Introduction
Type 1 diabetes (T1D) is a multifactorial autoimmune
disease caused by the complex interaction between genes and
environment. Although the major role of genetic alterations in T1D
pathogenesis has been extensively supported, the influence of
environmental factors remains less clear. As a result, the research
interest has shifted to the elucidation of the effect of
environmental triggering gene expression (1,2).
Epigenetics, the study of stable and mitotic
inherited changes in the expression of genes that do not directly
alter the original DNA sequence, is one of the proposed mechanisms
(3-5).
The main and, at the same time, the most studied epigenetic
mechanism is DNA methylation, which involves the addition of a
methyl group at specific sites in the molecular sequence (3,4). As
a result, cytosine-guanine sites (CpGs) in the genome may be
identified as methylated or unmethylated (3,4).
Methylation is associated with the development of T1D by altering
the expression of genes associated with the immune response
implicating pancreatic β-cells (1). The combination of the sequence of
methylated and non-methylated sites in a specific genetic region
constitutes its methylation haplotype (methyl-haplotype), following
the pattern of the DNA base sequence (6).
The insulin gene (INS) is the second most important
gene after the human leucocyte antigen complex in the development
of T1D and is responsible for ~10% of the genetic risk of the
disease (7). It is involved in the
pathogenesis of T1D by acting as an immunoregulatory agent that
inhibits cellular stress or even the death of pancreatic β-cells
(7). INS promoter (IGP) is a
molecular site of great importance, including the information that
regulates the loci expression. Epigenetic changes in this
site are of exceptional clinical significance.
The aim of the present study was to create a
predictive model that classified individuals with T1D and healthy
individuals using methylation haplotypes. There is great interest
in the area, with studies using different observational techniques
(8,9). Towards this direction, there are
reports that explore the use of machine learning methods in T1D
(10) and identify epigenetic
differentiations with prognostic value (11). Specifically, studies are using
machine learning algorithms, fed with a gene signature deriving
from gene expression (12) or
daily life data (13) to diagnose
diabetes, while others use deep learning algorithms to classify
diabetic and healthy cohorts (14). Regarding the prognostic value of
methylation haplotypes, research has focused on the early detection
of carcinogenesis (15) and only
very recently as an autoimmunity biomarker (16).
In the present study, methylation haplotypes were
used as features to feed the classification algorithms. After the
initial data preprocessing, an unsupervised clustering method was
implemented to explore the differentiation between patients and
healthy individuals. For the feature extraction, a classic method
was not used for the selection of the significant features, as
implemented in a previous study (6), but a dimensionality reduction
algorithm was performed that used the new fewer variables as
features.
Materials and methods
Data
The present study (ClinicalTrials.gov identifier, ΝCT04139369) is an
original observational clinical study with cross-sectional protocol
design, which took place at the Second Department of Pediatrics,
Faculty of Health Sciences, School of Medicine, Aristotle
University of Thessaloniki (Thessaloniki, Greece) in collaboration
with the Laboratory of Computing, Medical Informatics and
Biomedical Imaging Technologies, Faculty of Health Sciences, School
of Medicine, Aristotle University of Thessaloniki (Thessaloniki,
Greece).
All participants and their guardians were informed
in detail about the aims and content of the study and gave written
consent for their participation. The study was carried out in
accordance with the rules of the Declaration of Helsinki of 1975,
revised in 2013, after the approval from the Bioethics Committee of
the School of Medicine, Faculty of Health Sciences, Aristotle
University of Thessaloniki (approval no. 185/30.12.2015).
The study population consisted of 20 children and
adolescents with T1D and 20 healthy children and adolescents
matched for age and sex (Table I).
Recruitment was performed between January 2016 and February 2019.
According to the inclusion criteria of the present study, all
participants were non-consanguineous and at least three generations
of Greek origin. An additional inclusion criterion of the healthy
group was a negative family history of T1D or any other autoimmune
disease. Exclusion criteria were the presence of any chronic
disease for the healthy group or the presence of any chronic
disease apart from T1D for the T1D group. Patients were followed up
at the Unit of Pediatric Endocrinology and Metabolism and the Unit
of Diabetes Mellitus of children and adolescents of the Second
Department of Pediatrics, Faculty of Health Sciences, School of
Medicine, Aristotle University of Thessaloniki, AHEPA University
Hospital.
 | Table IDemographic characteristics of the
study population, presented per group. |
Table I
Demographic characteristics of the
study population, presented per group.
| Characteristic | Group Α (healthy
controls) | Group Β (T1D) | P-value |
|---|
| Number | 20.00 | 20.00 | |
| Sex
(female/male) | 12.00/8.00 | 8.00/12.00 | 0.206 |
| Age, years | 13.93±6.20 | 13.18±3.79 | 0.559 |
| Age at T1D
diagnosis, years | - | 7.03±4.00 | - |
| Duration of T1D,
years | - | 6.15±4.12 | - |
Sample representativeness
The calculation of sample size for continuous
variables with respect to the INS gene was based on data on the
standard deviation of the INS gene methylation variation in healthy
participants (5%) (17). To detect
a real potential difference of 5% in the variation of the
methylation levels of the INS gene between the compared groups
(statistical power, 80%; false negative rate β=0.2; probability of
error type Ia=0.05), a total of 16 cases of each study group was
necessary.
Definitions
The diagnosis of T1D was made based on the current
diagnostic criteria of the International Society for Pediatric and
Adolescent Diabetes and the American Diabetes Association (18,19).
Analysis
DNA of all participants was extracted from a whole
peripheral blood sample which was immediately stored in a deep
freezer (-80˚C) until processed. Total DNA was isolated using a
special isolation kit (QIAamp® DNA Blood Mini kit;
Qiagen, Inc.) according to the manufacturer’s instructions. The
isolated DNA samples were quantified spectrophotometrically using
the ratio OD 260/280 (1OD=50 µg/ml) (BioPhotometer 6131; Eppendorf)
and the amount of isolated material was checked by 1.5% agarose gel
electrophoresis. DNA modification was followed in a quantity of 300
ng from each sample, with the use of the EZ DNA Methylation-Gold™
Kit (Methylation Gold kit; Zymo Research Corp.).
The studied molecular locus (IGP) was then amplified
by a standard PCR protocol (PCR conditions: Initial denaturation at
95˚C for 3 min; 40 cycles of 95˚C denaturation for 30 sec, 55˚C
annealing for 30 sec and 72˚C extension for 2.5 min; 1 min final
extension step at 72˚C) using the following primers: INS forward,
5'-TATTTTGGAATTTTGAGTTTATT-3' and INS reverse,
5'-AACAAAAATCTAAAAACAACAA-3'. In addition, an overhang adapter
sequence was added to the gene-specific primers for the regions to
be targeted (Nextera Transposase Adaptors; Illumina, Inc.), for
prompt construction of the next-generation sequencing (NGS)
libraries. The promoter-specific primers targeted the NGS libraries
using the Transposase adapter (read_1 forward
5'-TCGTCGGCAGCGTCAGATGTGTATAAGAGACAG-3', read_2 reverse
5'-GTCTCGTGGGCTCGGAGATGTGTATAAGAGACAG-3'). PCR products were
amplified using a low temperature ramping instrument (9700 Thermal
Cycler; Eppendorf AG; cat. no. 5341) using the preset 9600
emulation mode. The reaction solution consisted of AmpliTaq Gold
DNA Polymerase with Buffer II and MgCl2 (Applied
Biosystems; Thermo Fisher Scientific, Inc.). The total reaction
volume was 25 µl, which consisted of 1.3 µl bisulfite-treated DNA,
2.5 µl 10X Buffer (100 mM Tris-HCl, pH 8.3, 500 mM KCl), 0.2 µM of
each primer, 200 µM dNTPs mix, 2 mM MgCl2 and 1.25 units
AmpliGold Taq Polymerase.
After purification of the PCR products using
NucleoMag NGS Clean-up and Size Select (cat. no. 744970.5;
Macherey-Nagel GmbH), they were pooled at similar molar quantities
and submitted for library construction according to the
manufacturer's protocol (Nextera XT DNA Library Preparation kit;
cat. no. FC-131-1096; Illumina, Inc.). For NGS, the readings
(pair-end reads) were chosen to have a read length format of 2x250
bp on a MiSeq® System Platform (cat. no. SY-410-1003;
Illumina, Inc.). FASTQ files were used to read the sequence. The
state of methylation was calculated with the ampliMethProfiler tool
(20), which is a conductor based
on the Python programming language (Python-based pipeline) and aims
to extract and analyze the synthesis of epitype sequences resulting
from treatment with sulfite. Methylation status was analyzed at 10
distinct CpG sites of the IGP surrounding the transcription start
site (TSS) at the 5'-end of the sequence of the INS gene (Supplementary data).
The methylation status at each of the 10 distinct
and default CpGs sites of IGP was encoded with the character 0
(zero) when it was found non-methylated or encoded with the
character 1 (one) when it was found methylated. The combination of
the codes for the 10 default CpGs sites was the methylation pattern
of each individual for the IGP promoter, forming its
methyl-haplotype. Thus, each reading of the 10 CpGs of each
participant could yield methyl-haplotype ‘1111111111’ (complete
methylation in all sites), methyl-haplotype ‘000000000’ (complete
non-methylation in all sites) or any other methyl-haplotype
combination. Data derived from the total reads of the samples are
the methyl-haplotypes that were thereafter analyzed as distinct
features in bioinformatics analyses.
Descriptional statistics
Demographic characteristics of the study population
were analyzed. Normality of distribution for continuous data was
examined using the Shapiro-Wilk test. Continuous variables were
expressed as mean ± standard deviation and comparisons between
groups were performed applying the independent-samples Student's
t-test or its non-parametric equivalent Mann-Whitney-U test.
Distribution of categorical variables among groups was compared
using the χ2 test. Data analysis was performed using
SPSS 19.0 (IBM Corp.). P#x003C;0.05 was considered to indicate a
statistically significant difference.
Data preprocessing
The first step in data preprocessing was to remove
the low variance features. This is achieved by applying a
low-variance filter. This filter removes the features that have
constant or close to constant values among samples, based on a
threshold. The threshold selected was ‘0.3’, which means that
features (methyl-haplotypes) that have a constant value in 70% of
the samples were detected and removed.
Unsupervised clustering as an
exploratory step
The second step was to perform spectral clustering
(SP) (21). SC is a clustering
method in which the algorithm detects clusters with similar
characteristics in a dataset. This method was applied as an
exploratory unsupervised clustering method, showing how the data
were clustered without imposing the knowledge of the two groups.
The purpose of this implementation was to explore the dataset that
is derived from an innovative method and has specific properties,
and to identify if the two groups were divided properly. The
parameters used for the spectral clustering analysis implementation
were: i) The nearest neighbors' method for the construction of the
affinity matrix; and ii) the k-means method for the assignment of
labels in the embedding space.
Transformation and feature
extraction
As a third step, a dimensionality reduction
algorithm, principal component analysis (PCA) (22), was applied to the dataset. With
this method, the features were reduced to new, fewer variables
[principal components (PC)] and data are expressed in terms of
these variables. Considered together, the new variables represent
the same amount of information as the original variables, by
keeping the same summed value of variance with the initial
dataset.
Classification
Finally, PCs were used as the features that fed the
classification algorithms for the implementation of the predictive
models. Five classification algorithms were tested: i) Random
forest; ii) decision tree; iii) linear regression; iv) Naive Bayes;
and v) support vector machine (linear). The evaluation of the
models was performed using the k-fold cross-validation method and
the evaluation metrics were: i) Accuracy; ii) precision; iii)
recall; iv) F1-score; and v) area under curve. All methods were
implemented in python 3 and scikit-learn library (23) for machine learning in python.
Results
Data
The study population was composed of two groups of
20 participants each (class A, healthy individuals; class B,
individuals with T1D), aged 2-17 years. The demographic
characteristics of the sample per patient group are presented in
detail in Table I.
Based on the design of the study, there was no
difference between the two groups in the distribution of both
gender (P=0.206) and age (P=0.559). The body mass index also showed
no difference between the two groups (P=0.119, data not shown). In
group B, the diagnosis of T1D had been made in all patients before
the age of 15 years (mean age of diagnosis, 7.03 years), with the
manifestation of diabetic ketoacidosis in most cases (16/20).
Glycemic regulation of T1D patients was optimum (HbA1c%,
7.76±0.94). None of the participants had T1D complications.
The initial frequency range of methyl-haplotypes
detected by reading the 10 IGP methylation sites in the general
population was [0, 1478]. After normalization of all
methyl-haplotype data, the value range was changed from [0, 1478]
to [0, 99.27].
Analysis. Preprocessing
The initial shape of the dataset was [40, 469].
After the low variance columns removal, 133 columns were removed,
and the final shape of the dataset was [40, 336].
Unsupervised clustering
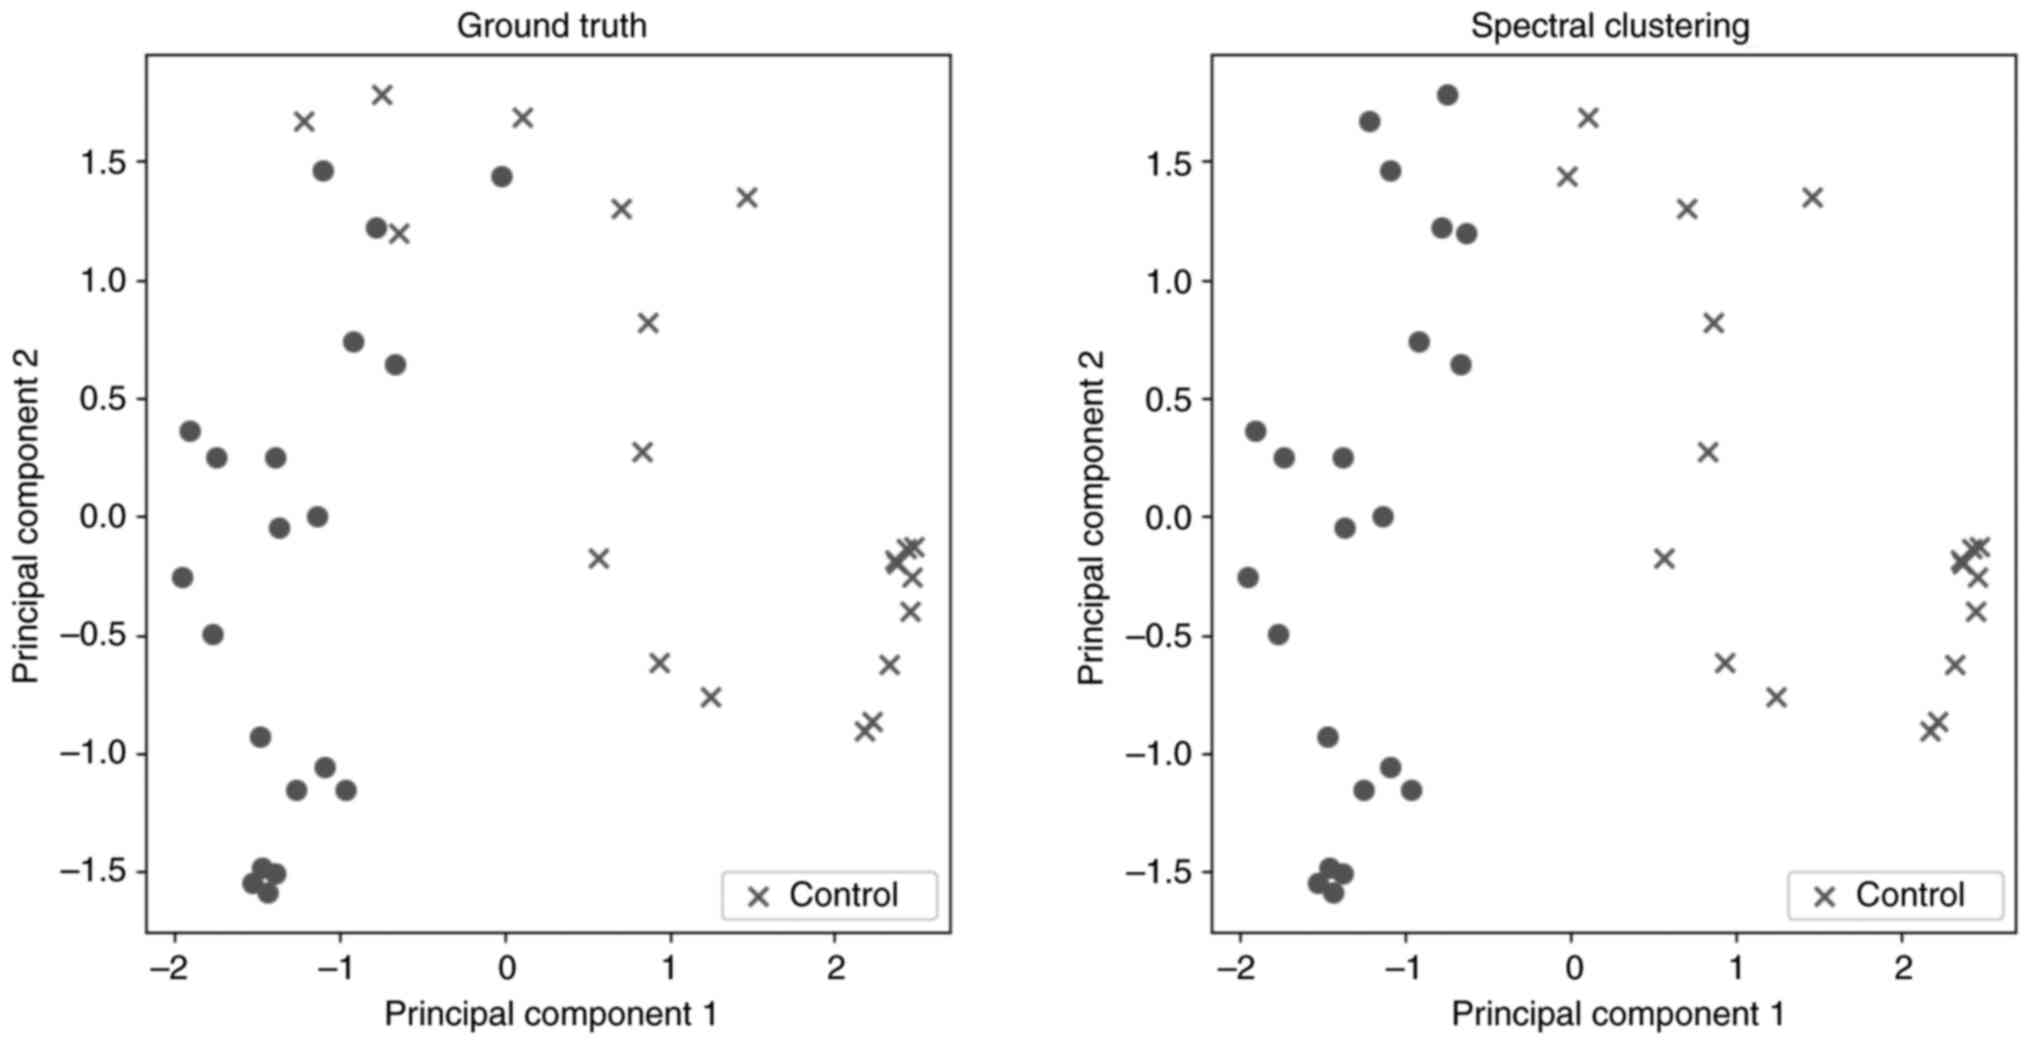
To explore the differentiation between the two
groups, a spectral clustering algorithm was applied as an
unsupervised clustering method. In Fig. 1, two scatter plots are presented.
In these plots and for visualization purposes, a dimensionality
reduction algorithm was implemented to present the results,
creating two PC. These plots show the distribution of the subjects
divided into the two groups using: i) The ground truth for the
characterization of each subject; and ii) the prediction of
spectral clustering. Table II
demonstrates the validation metrics of this method, based on the
confusion matrix between actual groups and separation in two
clusters. The two groups seem to be clustered with high
accuracy.
| Table IIEvaluation of spectral
clustering. |
Table II
Evaluation of spectral
clustering.
| Method | Accuracy | Precision | Recall | F1 score | Area under
curve |
|---|
| Spectral
clustering | 0.90 | 0.94 | 0.85 | 0.89 | 0.912 |
Transformation and feature
extraction
Since the dataset contains numerous features with a
number of zero values, PCA was applied as a dimensionality
reduction algorithm. The PCA algorithm, before applying the
dimensionality reduction methodology, performs whitening, which is
a transformation method. In this method, the vectors are multiplied
by the square root of samples and then divided by the singular
values to ensure uncorrelated outputs with unit component-wise
variances. For the implementation of the PCA method, the sklearn
library of python was used. An initial implementation was performed
without specifying the number of components. In this configuration,
the default number of components is calculated as the minimum value
between features and samples, which in this case is 40. This way
all the components are kept. Each component/new variable created by
this algorithm explains variance in a proportion. With this initial
implementation, it was noticed that the majority of the components
had low explained variance. As a next step, five components were
selected. Each component/new variable created by this algorithm
explains variance in a proportion depicted in Table III.
| Table IIILoadings of most significant feature
in each PC. |
Table III
Loadings of most significant feature
in each PC.
| Component | Explained variance
(%) | Significant
feature | Loading value |
|---|
| PC1 | 63.42 | 1111111111 | 0.769 |
| PC2 | 11.52 | 1111111011 | 0.498 |
| PC3 | 9.02 | 1110111111 | 0.873 |
| PC4 | 4.80 | 1111101111 | 0.706 |
| PC5 | 1.56 | 1110101111 | 0.446 |
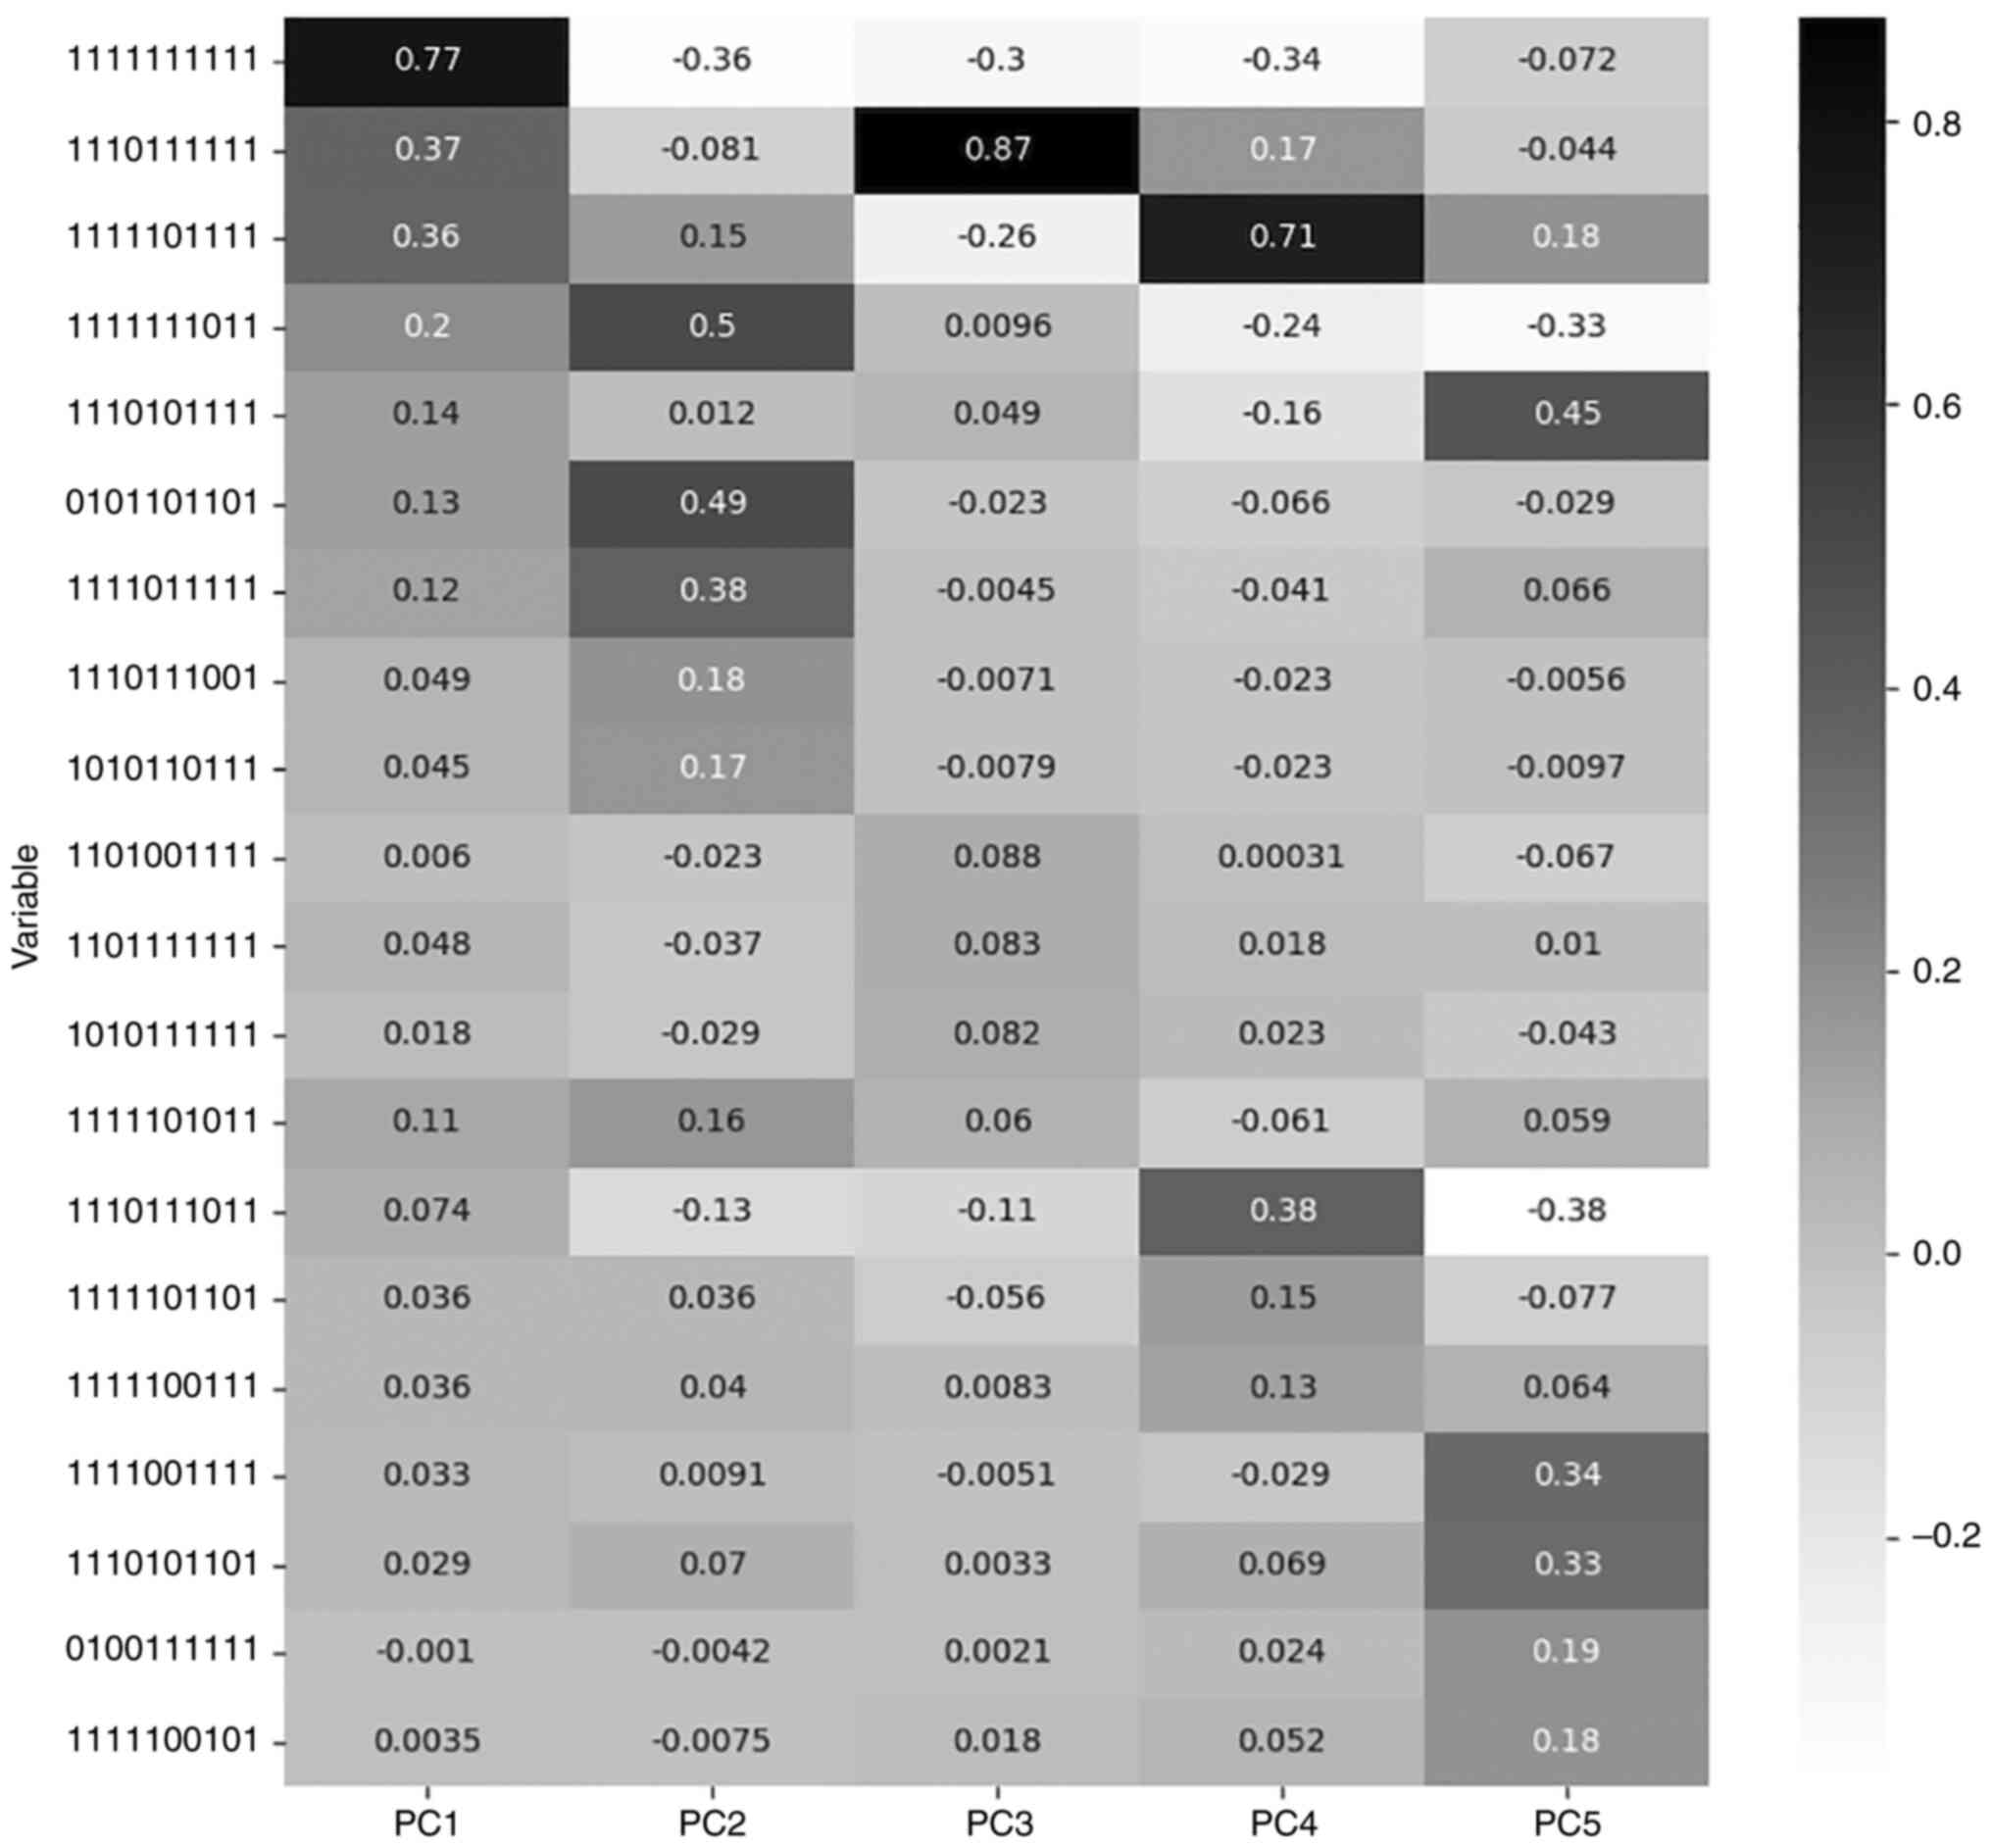
For each PC the most significant feature is the one
with the maximum value of loading. Loading is the correlation
coefficient between original variables and the component and is
calculated by the algorithm during the dimensionality reduction
procedure, as the loading value (explained variance) of each
component for each feature (24).
Table III describes the features
with the highest loadings for the respective PC, while Fig. 2 presents the loading values of the
five most significant features for each PC, among all PCs.
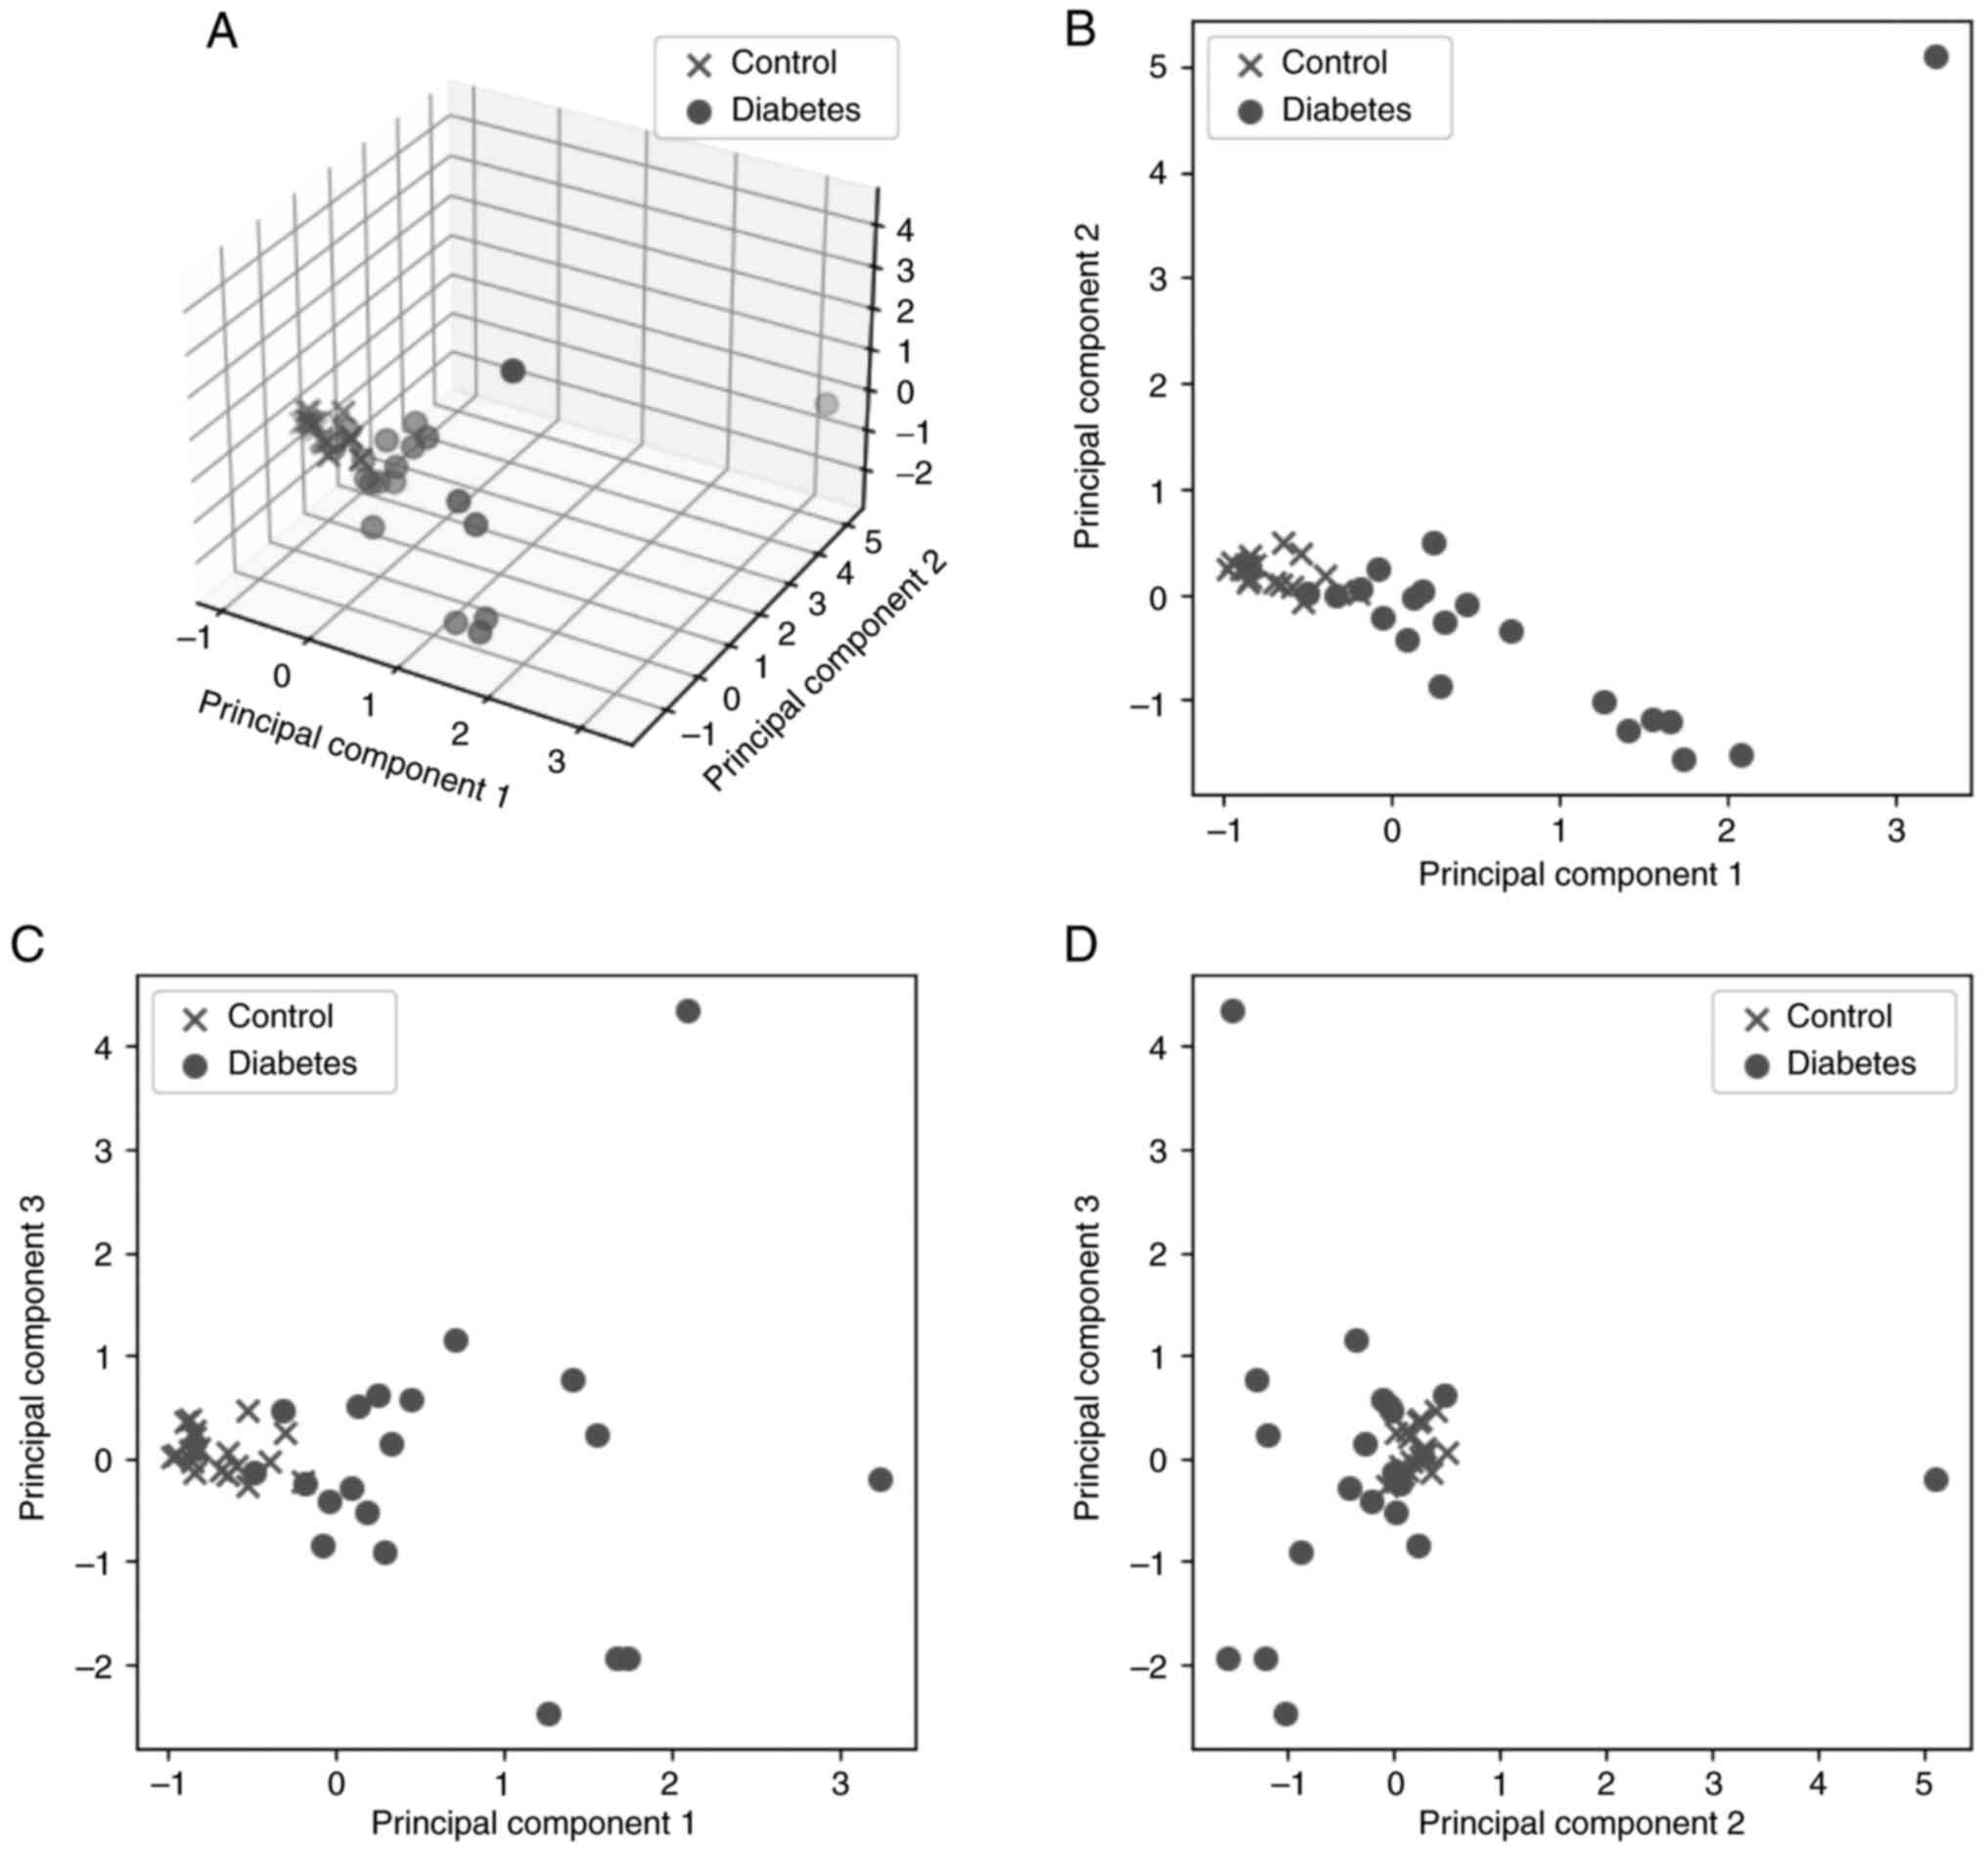
The summary of the explained variance of the five PC
is ~90%, which means that they represent a large number of the
initial features and they are concentrating a high percentage of
the information included in the initial dataset. However, PC4 and
PC5 represent only 6% of the information; therefore, only the first
three PC were kept for the next steps of the analysis. PC1, PC2 and
PC3 represent ~85% of the initial features. Fig. 3A shows the result of the analysis
in 3D space for the first three PC against the classes of patients
(control and diabetes), while Fig.
3B-D presents the relations between the three PC in pairs in 2D
space.
Classification
The three variables (PC) identified by the previous
step were used as the features that fed the classification
algorithms. Thus, five different classifiers were trained and
evaluated using the 5-fold cross-validation method. This method
splits the dataset into five groups and uses the fourth for
training and the fifth for testing and repeats the procedure until
all groups are used as the testing dataset. The evaluation metrics
of the five classifiers that were trained are presented in Table IV. For every classifier, the
training was repeated 100 times and the results recorded are based
on the mean value of every metric.
| Table IVEvaluation metrics. |
Table IV
Evaluation metrics.
| Classifier | Accuracy | Precision | Recall | F1 score | Area under
curve |
|---|
| Random forest | 0.87 | 0.86 | 0.89 | 0.87 | 0.93 |
| Decision tree | 0.88 | 0.86 | 0.82 | 0.88 | 0.84 |
| Logistic
regression | 0.65 | 0.61 | 0.80 | 0.70 | 0.75 |
| Naive Bayes | 0.90 | 0.94 | 0.85 | 0.90 | 0.96 |
| Support vector
machine (linear) | 0.77 | 0.72 | 0.90 | 0.80 | 0.85 |
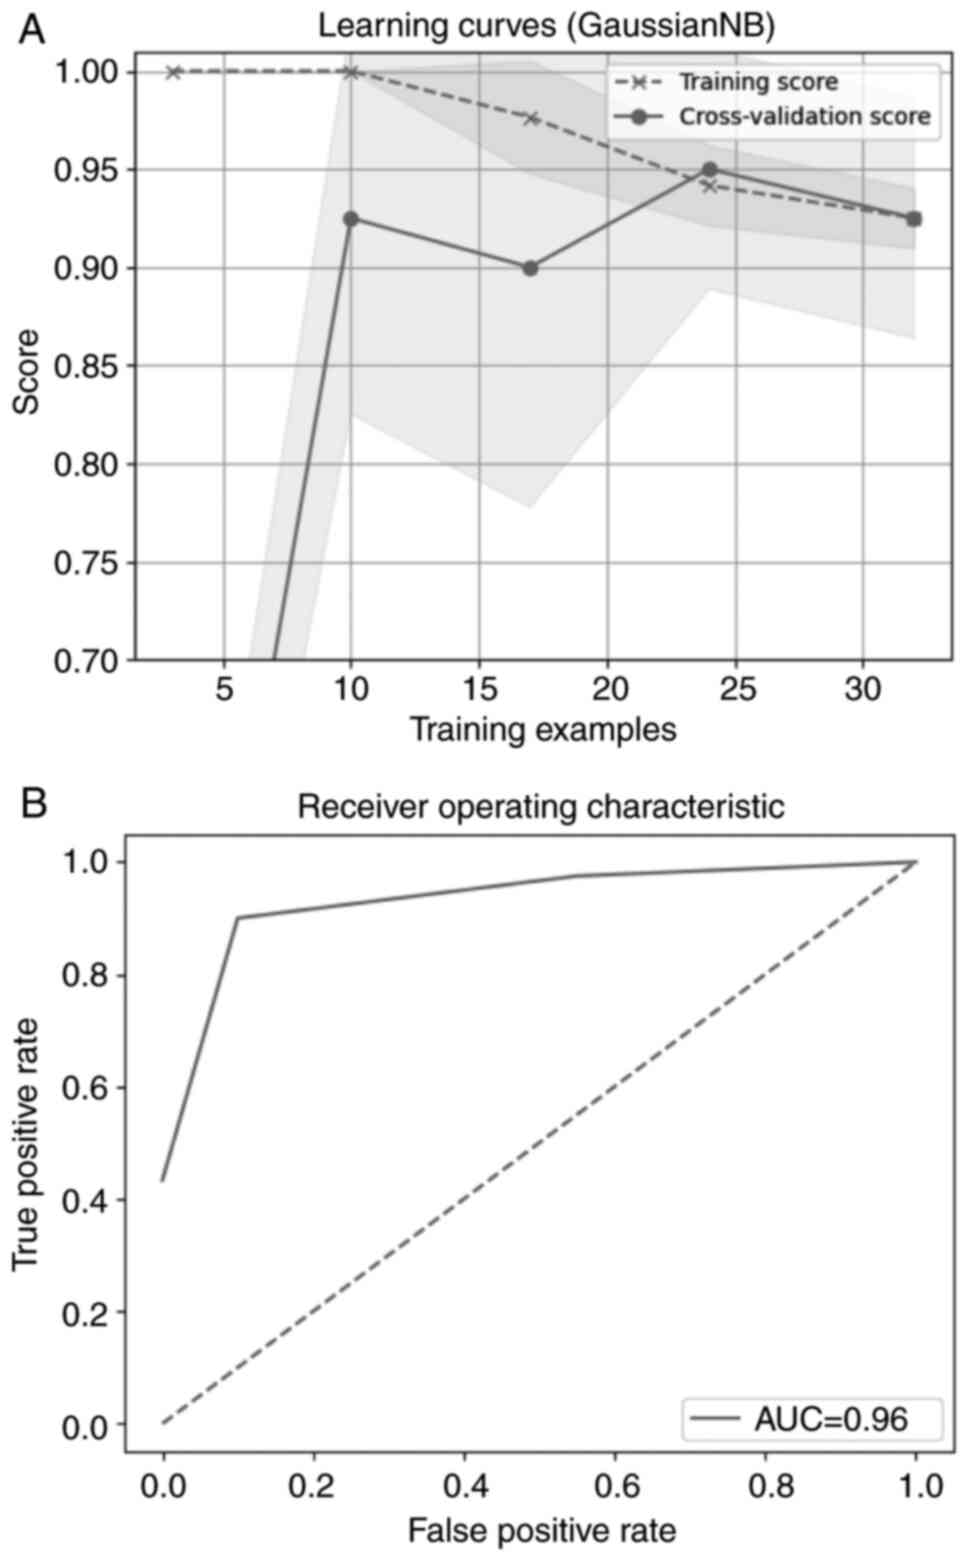
The best-performing classifier, when considering
accuracy, was Naive Bayes (25).
Fig. 4A shows the model
performance on the train and validation dataset over times of
evaluation. They are converging after a number of iterations,
following the same course and resulting in the final score.
Fig. 4B presents the receiver
operating characteristic curve. The curve is close to the upper
left quadrant of the plot which means that the model trained is
efficient.
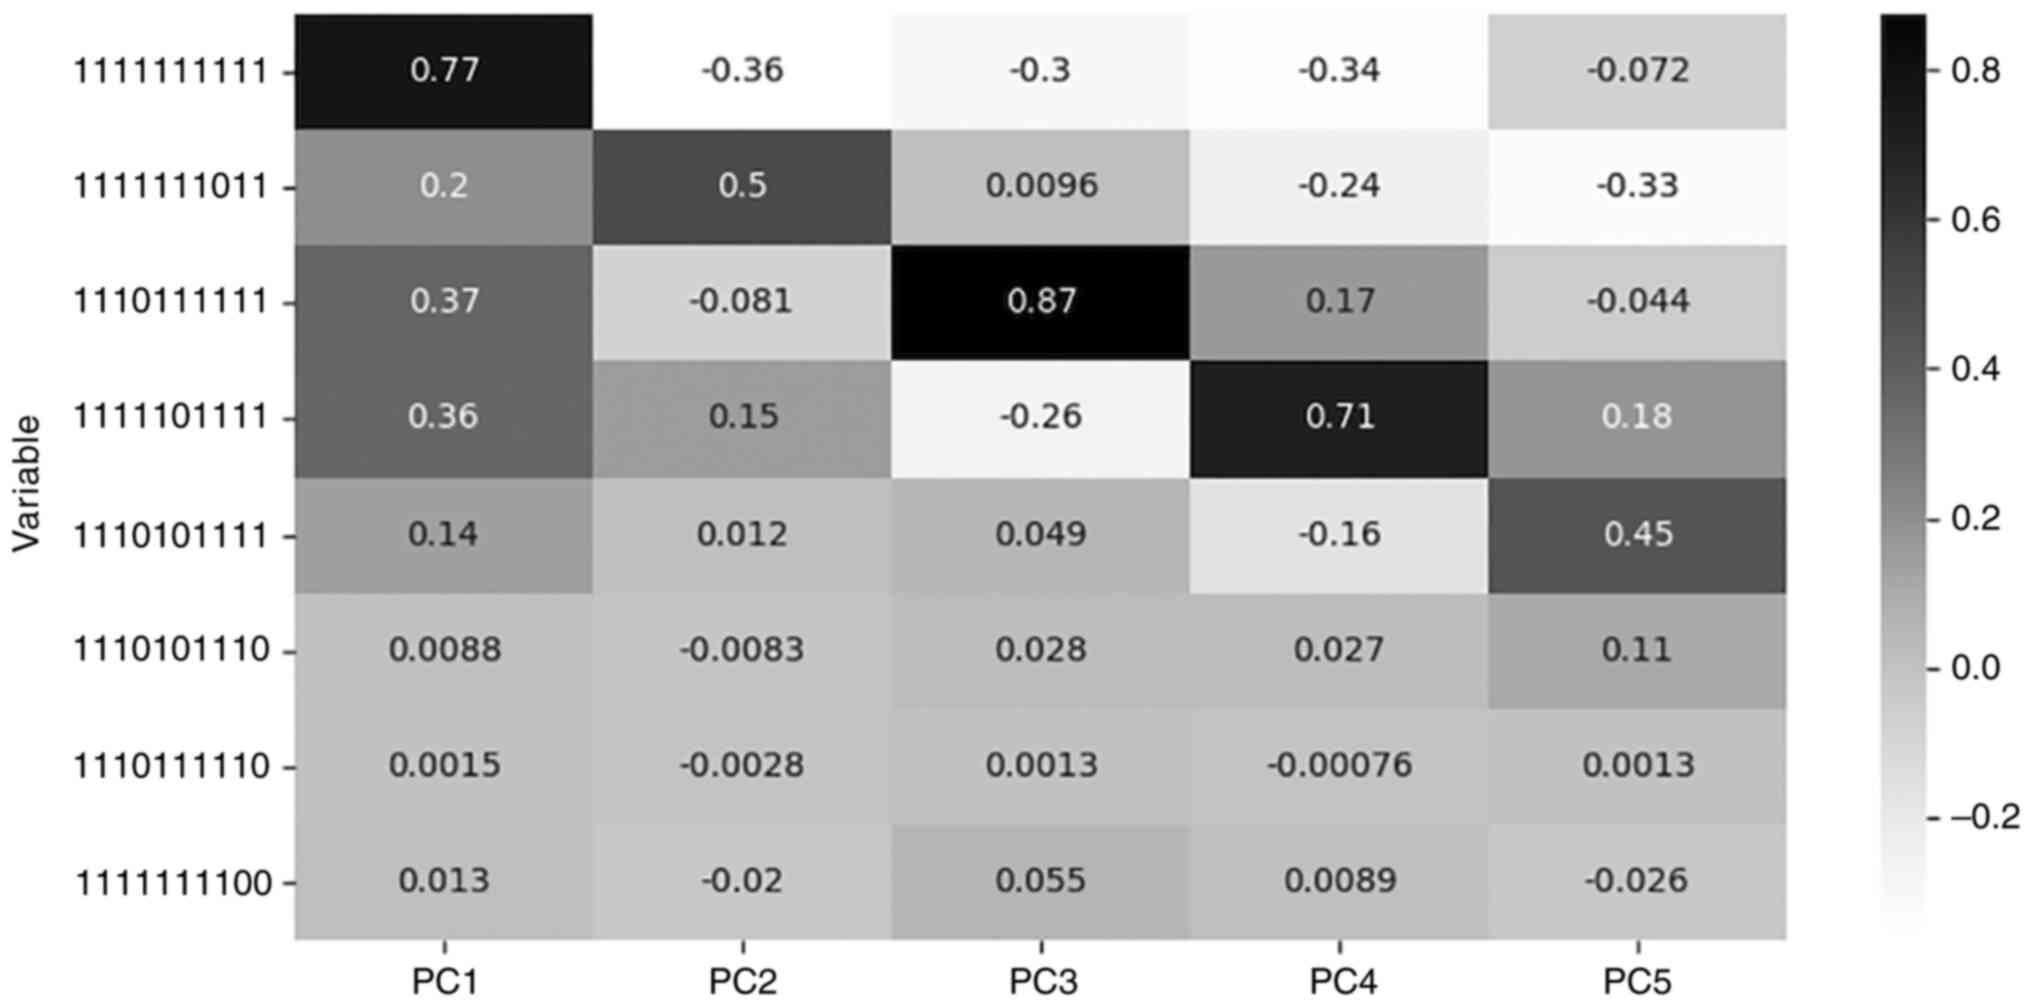
In one of our previous works, the most significant
methyl-haplotypes were detected with the Mann-Whitney-Wilcoxon
method and used as features (6).
The representative features detected with this methodology, as
having statistically significant differences between the two groups
(P#x003C;0.001), were the specific methyl-haplotypes (‘1110101110’,
‘1110111110’ and ‘1111111100’). The accuracy of the best-performing
classifier was 82%. Table V
describes the loadings for each one of the eight features, 3 from
previous work and five from the current work, and for every PC,
while Fig. 5 depicts their loading
values for each PC.
| Table VLoadings of the features selected by
the two methods in each PC. |
Table V
Loadings of the features selected by
the two methods in each PC.
| A, Present method
features |
|---|
| Feature | PC1 | PC2 | PC3 | PC4 | PC5 |
|---|
| 1111111111 | 0.769500 | -0.362961 | -0.304812 | -0.339602 | -0.071543 |
| 1111111011 | 0.202861 | 0.498655 | 0.009574 | -0.238478 | -0.329020 |
| 1110111111 | 0.370387 | -0.080940 | 0.873374 | 0.165998 | -0.044353 |
| 1111101111 | 0.361261 | 0.149943 | -0.259968 | 0.706187 | 0.181835 |
| 1110101111 | 0.138275 | 0.012254 | 0.049107 | -0.162598 | 0.446792 |
| B, Previous method
features |
| Feature | PC1 | PC2 | PC3 | PC4 | PC5 |
| 1110101110 | 0.008783 | -0.008252 | 0.027514 | 0.026659 | 0.110130 |
| 1110111110 | 0.001483 | -0.002835 | 0.001250 | -0.000759 | 0.001347 |
| 1111111100 | 0.013053 | -0.020119 | 0.054517 | 0.008947 | -0.025733 |
Discussion
To the best of our knowledge, the present study
investigated for the first time methyl-haplotypes in the IGP region
in children and adolescents with T1D and identified specific
methylation patterns significantly associated with T1D.
Furthermore, based on machine-learning methods, the present study
attempted to develop a predictive model for the discrimination of
patients with T1D and healthy individuals using methyl-haplotypes
as classification parameters. Naive Bayes turned out to be the
best-performing classifier in the context of accuracy, precision,
recall, F1 score and area under curve.
T1D is the result of a chronic, progressive,
T-cell-mediated selective destruction of pancreatic islet β-cells,
leading to loss of insulin secretion and lifelong need for
exogenous administration (1,7). It
is characterized by a strong genetic background responsible for the
increased rate of recurrence within families (1,26).
Although the exact genetic etiology remains unknown, >60 gene
sites have been found to be implicated through complex and
synergistic interactions (27,28).
Among them, the INS gene (11p15.5) is one of the most consistently
replicating regions associated with T1D (7) that is involved in both induction and
early phases of pancreatic islet β-cellular immunity (27). Furthermore, the increase in the
incidence of T1D in a genetically stable population for a short
period of time highlights the importance of epigenetics beyond that
of genomics (29). At present,
there is an increasing number of studies investigating DNA
methylation of several gene loci in patients with T1D with a wide
range of results (30).
INS gene methylation has been extensively studied in
adults with T1D (17,31-36).
Specific CpGs of this gene have been recorded in either a state of
hypermethylation or hypomethylation compared with a healthy
population (17,31-36).
In children with T1D, even at the time of diagnosis, different
levels of methylated and non-methylated DNA in the INS gene have
also been detected compared with controls (37). A recent study by our team estimated
the rate of methylation of the INS gene at IGP-CpGs sites, in
children and adolescents of Greek origin with T1D and mean disease
duration of 6 years and found hypermethylated sites compared with
healthy individuals (38).
The state of methylation of the IGP region is
emerging as a suitable biomarker for the detection of individuals
with pancreatic β-cell autoimmunity. Given the large number of CpGs
that are potential substrates for methylation, methyl-haplotype
processing offers the possibility of combinational searching and
comparison of patterns instead of single sites (39). As a result, the conclusions drawn
are of higher clinical significance and more compatible with the
complexity of the molecular and biological systems to be elucidated
(39). The present study studied
the overall methylation pattern at ten IGP-CpGs sites and detected
five distinct methyl-haplotypes highly associated with T1D.
Methyl-haplotype based association studies have been
proposed to have implications in the genetic investigation of
complex diseases (40). With the
development of biotechnology, even Epigenome-Wide Association Study
software has been developed in order to systematically approach and
reveal common disease/phenotype-related methyl-haplotypes (41). Methyl-haplotypes are used in cancer
diagnostics at an early disease stage (39,42-44).
Methods such as MHap and MHap_DMR have been developed for the
construction of methylation haplotypes in CpG dense regions of
homologous chromosomes, permitting the elucidation of the two-way
direction, cell differentiation or cancerization (45). In this context, a cell-free
DNA methylation panel, ThyMet classifier, has been established to
differentiate papillary thyroid carcinoma from benign thyroid
nodule (46). Furthermore,
a follicular thyroid carcinoma (FTC) predicting model based on DNA
methylation markers is used in cases of thyroid tumors with
uncertain malignant potential in order to distinguish between FTC
and benign follicular adenoma (FA) (47). Plasma methylation haplotyping has
been suggested as a promising method for the early detection of
tumor and its tissue of origin, as well as for the continuous
monitoring of tumor progression and metastasis to multiple organs
(42). More specifically,
methylation haplotyping is studied as a diagnostic tool in cervical
precancer (39,43) and hepatocellular carcinoma (HCC)
(44), pancreatic ductal
adenocarcinoma (48) and
colorectal cancer (49). In human
papillomavirus (HPV)-positive women, a methylation assay including
the basic carcinogenic HPV types can be applied as a screening test
(39), while in high-risk
HPV-positive women, certain methyl-haplotypes are found to
consistently serve as a potential biomarker for the stratification
of risk (39). In HCC and
pancreatic ductal adenocarcinoma (48), methyl-haplotypes can early,
accurately and non-invasively detect microvascular invasion and
predict prognosis of cancer (44,50).
Recently, full methylation haplotypes levels in the protein region
of homeodomain-interacting protein kinase 3 are supported as a
diagnostic biomarker and CRP level indicator for rheumatoid
arthritis, opening the way for studies in other autoimmune
diseases, such as T1D (16). More
recommended is the use of methyl-haplotypes as a screening tool in
clinical decision making (40).
In the present study, the evaluation metrics of the
predictive model show that this method had a greater performance
compared with our initial approach (6). The accuracy of the best-performing
classifier in the present case was 90%. In the previous work, the
accuracy of the best-performing classifier was 82% (6). By this, we hypothesize that the
transformation of the whole dataset with a dimensionality reduction
method included more useful information compared with the selection
of some representative methyl-haplotypes. This may suggest that the
phenomenon is expressed by several correlated features rather than
a few specific methyl-haplotypes.
The representative features detected in our previous
work, methyl-haplotypes (‘1110101110’, ‘1110111110’ and
‘1111111100’) (6) do not coincide
with the features marked as the most significant ones for each PC
that was created by the dimensionality reduction method
(‘1111111111’, ‘1111111011’, ‘1110111111’, ‘1111101111’,
‘1110101111’). The present study observed that none of the features
selected by the previous analysis has a significant participation
in the PCs. However, it has to be highlighted that the currently
proposed classifier used as features the transformed data, PCs,
instead of the original methyl-haplotypes, and in this sense it
combines information by more methyl-haplotypes in each PC.
With the implementation of the spectral clustering
method on the dataset, it is apparent that the two groups, T1D and
control, were classified with high accuracy, underlying that they
had significantly different characteristics in the structure of the
INS gene. Moreover, the high accuracy of the trained predictive
model indicated that methyl-haplotypes from INS gene may constitute
a reliable marker that can be used to identify the existence of
T1D.
The methodology implemented is a first approach to
the investigation of statistically significant IGP-CpGs
methyl-haplotypes as predictor parameters in a classification
system. After the preprocessing of our dataset and the removal of
the low variance features, the shape of the dataset was (40, 336).
PCA can be applied in all cases where n#x003C;p (51). A similar attempt of applying PCA in
relevant dataset, on the grounds of the above-mentioned rationale,
has already been published, providing valuable results (52). The only restriction that could be
applied to the present bioinformatic approach was that the
resulting components with non-zero variance should be at least n-1.
In the present case, only the first five components
(#x003C;#x003C;n-1) represent 90% of the initial dataset and the
rest of them have near-to-zero variance. Only the three first
components were hereby used, in order to avoid fitting noise. For
all these reasons, the results of the hereby presented analysis are
solid and could be repeatable in other non-relating datasets.
Studies on the widespread use of machine-learning
methods in diabetes have already been published (10,12,14).
The large data available after the implementation of
internationally accepted recommendations in diabetes, allow the use
of artificial intelligence machine-learning methods to extract new
knowledge and develop predictive tools (10). Among the epigenetic variations,
changes in DNA methylation can feed future prediction tools to be
applied in primary disease prevention (11). The results of the present
clustering tool succeeded in highlighting a specific method with
extremely high percentages of metrics (accuracy, sensitivity and
specificity), despite the fact that the implementation was
performed using a small amount of data. Data of the present study
could serve as a base of evidence to implement distinct statistical
approaches for reconstructing methyl-haplotypes frequency in
population data (53). Utilization
of specific software with Bayesian methodology, allows the use of
priori expectations in order to inform haplotype reconstruction
(53,54). Through this approach, the hereby
described methylation status in the IGP locus could serve as the
basis to extrapolate and calculate the expected frequency of
methylation haplotype in large datasets of T1D population, in order
to optimize the use of our experimental resources.
This protocol presents some limitations that are
recognized and include the homogeneity of the national origin of
the sample, the small number of participants, the recruitment by a
single center, as well as the homogeneity of patients in terms of
glycemic control and body mass index. Factors that reduced the
statistical significance of the results by increasing the accuracy,
but on the other hand limited the investigation of the influence of
environmental factors involved in the dynamic process of
methylation.
To summarize the results of these studies, we can
assume that the specific dataset and methyl-haplotypes of the
present study could be used as features for distinguishing T1D
diabetes. The first part of the analysis, SP, proved that these
features could differentiate the two classes of interest, control
and diabetes. The second part of the analysis, machine learning
based on PCA, showed evidence that effective predictive models
could be built based on the methyl-haplotypes. This methodology is
a promising step towards early T1D diagnosis.
Epigenetic changes can serve as biomarkers of early
diagnosis of T1D and as potential targets for therapeutic
intervention. Methyl-haplotyped studies such as the present are
expected to provide the evidence to put them in the service of
daily clinical practice as a tool of diagnosis and treatment with
the ultimate goal of improving the level of health services in
individuals with T1D or in those that they are prone to develop
T1D. Verification of the results of this protocol in large datasets
of patients with T1D could be extended accordingly.
Supplementary Material
Supplementary data
Acknowledgements
Not applicable.
Funding
Funding: This research was funded by the Hellenic Association
for the Study and Education of Diabetes Mellitus (grant no.
2015).
Availability of data and materials
The data generated in the present study may be found
in Zenodo under accession no. DOI:10.5281/zenodo.8001833 or the
following URL: https://zenodo.org/record/8001833. The datasets used
and/or analyzed during the current study are available from the
corresponding author on reasonable request.
Authors' contributions
AGT and IC conceptualized the study. AK, EPK and KM
designed the methodology. AK and IC performed the bioinformatic
analysis. EPK, KM, SG, VRT and AS performed investigation. EPK, AK,
KM, SG, VRT and AS curated the data. EPK, AK, KM, SG, VRT and AS
wrote the original draft preparation. AGT and IC reviewed and
edited the manuscript. AK and IC prepared the figures. AGT was the
supervisor and project administrator to the study and acquired the
funding. ΚΜ, EPK and AK confirm the authenticity of all the raw
data. All authors have read and approved the final manuscript and
agree to be personally accountable for their own contributions and
for ensuring that questions related to the accuracy or integrity of
any part of the work, even ones in which the author was not
personally involved, are appropriately investigated, resolved and
documented in the literature.
Ethics approval and consent to
participate
All subjects gave their informed consent for
inclusion before they participated in the study. The study was
conducted in accordance with the guidelines of the Declaration of
Helsinki, and the protocol was approved by the Bioethics Committee
of the School of Medicine, Faculty of Health Sciences, Aristotle
University of Thessaloniki (approval no. 185/30.12.2015).
Patient consent for publication
Not applicable.
Competing interests
The authors declare that they have no competing
interests.
References
|
1
|
Jerram ST, Dang MN and Leslie RD: The role
of epigenetics in type 1 diabetes. Curr Diab Rep.
17(89)2017.PubMed/NCBI View Article : Google Scholar
|
|
2
|
Xie Z, Chang C, Huang G and Zhou Z: The
role of epigenetics in type 1 diabetes. Adv Exp Med Biol.
1253:223–257. 2020.PubMed/NCBI View Article : Google Scholar
|
|
3
|
Allis CD and Jenuwein T: The molecular
hallmarks of epigenetic control. Nat Rev Genet. 17:487–500.
2016.PubMed/NCBI View Article : Google Scholar
|
|
4
|
Bird A: Perceptions of epigenetics.
Nature. 447:396–398. 2007.PubMed/NCBI View Article : Google Scholar
|
|
5
|
D'Angeli MA, Merzon E, Valbuena LF,
Tirschwell D, Paris CA and Mueller BA: Environmental factors
associated with childhood-onset type 1 diabetes mellitus: An
exploration of the hygiene and overload hypotheses. Arch Pediatr
Adolesc Med. 164:732–738. 2010.PubMed/NCBI View Article : Google Scholar
|
|
6
|
Kotanidou EP, Mouzaki K, Chouvarda I,
Koutsiana E, Kosvyra A, Tsinopoulou VR, Giza S, Serbis A and
Galli-Tsinopoulou A: CpG methylation haplotypes of the insulin gene
promoter as predictive biomarker in a cohort of children and
adolescents with type 1 diabetes. Paediatriki. 83:150–162.
2021.
|
|
7
|
Steck AK and Rewers MJ: Genetics of type 1
diabetes. Clin Chem. 57:176–185. 2011.
|
|
8
|
Moulder R, Bhosale SD, Erkkilä T, Laajala
E, Salmi J, Nguyen EV, Kallionpää H, Mykkänen J, Vähä-Mäkilä M,
Hyöty H, et al: Serum proteomes distinguish children developing
type 1 diabetes in a cohort with HLA-conferred susceptibility.
Diabetes. 64:2265–2278. 2015.PubMed/NCBI View Article : Google Scholar
|
|
9
|
Rodríguez-Ventura AL, Yamamoto-Furusho JK,
Coyote N, Dorantes LM, Ruiz-Morales JA, Vargas-Alarcón G and
Granados J: HLA-DRB1*08 allele may help to distinguish between type
1 diabetes mellitus and type 2 diabetes mellitus in Mexican
children. Pediatr Diabetes. 8:5–10. 2007.PubMed/NCBI View Article : Google Scholar
|
|
10
|
Kavakiotis I, Tsave O, Salifoglou A,
Maglaveras N, Vlahavas I and Chouvarda I: Machine learning and data
mining methods in diabetes research. Comput Struct Biotechnol J.
15:104–116. 2017.PubMed/NCBI View Article : Google Scholar
|
|
11
|
Zhang H and Pollin TI: Epigenetics
variation and pathogenesis in diabetes. Curr Diab Rep.
18(121)2018.PubMed/NCBI View Article : Google Scholar
|
|
12
|
Li J, Ding J, Zhi DU, Gu K and Wang H:
Identification of type 2 diabetes based on a ten-gene biomarker
prediction model constructed using a support vector machine
algorithm. Biomed Res Int. 2022(1230761)2022.PubMed/NCBI View Article : Google Scholar
|
|
13
|
Lethebe BC, Williamson T, Garies S,
McBrien K, Leduc C, Butalia S, Soos B, Shaw M and Drummond N:
Developing a case definition for type 1 diabetes mellitus in a
primary care electronic medical record database: An exploratory
study. CMAJ Open. 7:E246–E251. 2019.PubMed/NCBI View Article : Google Scholar
|
|
14
|
Fufurin I, Berezhanskiy P, Golyak I,
Anfimov D, Kareva E, Scherbakova A, Demkin P, Nebritova O and
Morozov A: Deep learning for type 1 diabetes mellitus diagnosis
using infrared quantum cascade laser spectroscopy. Materials
(Basel). 15(2984)2022.PubMed/NCBI View Article : Google Scholar
|
|
15
|
Seoighe C, Tosh NJ and Greally JM: DNA
methylation haplotypes as cancer markers. Nat Genet. 50:1062–1063.
2018.PubMed/NCBI View Article : Google Scholar
|
|
16
|
Jiang P, Wei K, Xu L, Chang C, Zhang R,
Zhao J, Jin Y, Xu L, Shi Y, Qian Y, et al: DNA methylation change
of HIPK3 in Chinese rheumatoid arthritis and its effect on
inflammation. Front Immunol. 13(1087279)2023.PubMed/NCBI View Article : Google Scholar
|
|
17
|
Fradin D, Le Fur S, Mille C, Naoui N,
Groves C, Zelenika D, McCarthy MI, Lathrop M and Bougnères P:
Association of the CpG methylation pattern of the proximal insulin
gene promoter with type 1 diabetes. PLoS One.
7(e36278)2012.PubMed/NCBI View Article : Google Scholar
|
|
18
|
ElSayed NA, Aleppo G, Aroda VR, Bannuru
RR, Brown FM, Bruemmer D, Collins BS, Hilliard ME, Isaacs D,
Johnson EL, et al: Classification and diagnosis of diabetes:
Standards of care in diabetes-2023. Diabetes Care. 46:19–40.
2023.PubMed/NCBI View Article : Google Scholar
|
|
19
|
Libman I, Haynes A, Lyons S, Pradeep P,
Rwagasor E, Tung JY, Jefferies CA, Oram RA, Dabelea D and Craig ME:
ISPAD clinical practice consensus guidelines 2022: Definition,
epidemiology, and classification of diabetes in children and
adolescents. Pediatr Diabetes. 23:1160–1174. 2022.PubMed/NCBI View Article : Google Scholar
|
|
20
|
Scala G, Affinito O, Palumbo D, Florio E,
Monticelli A, Miele G, Chiariotti L and Cocozza S:
AmpliMethProfiler: A pipeline for the analysis of CpG methylation
profiles of targeted deep bisulfite sequenced amplicons. BMC
Bioinformatics. 17(484)2016.PubMed/NCBI View Article : Google Scholar
|
|
21
|
von Luxburg U: A tutorial on spectral
clustering. Stat Comput. 17:395–416. 2007.
|
|
22
|
Jollife IT and Cadima J: Principal
component analysis: A review and recent developments. Philos Trans
A Math Physc Eng Sci. 374(20150202)2016.PubMed/NCBI View Article : Google Scholar
|
|
23
|
Pedregosa F, Varoquaux G, Gramfort A,
Michel V, Thirion B, Grisel O, Blondel M, Prettenhofer P, Weiss R,
Dubourg V, et al: Scikit-learn: Machine learning in python. J Mach
Learn Res. 12:2825–2830. 2011.
|
|
24
|
Frost HR: Eigenvectors from eigenvalues
Sparse principal component analysis (EESPCA). J Comput Graph Stat.
31:486–501. 2022.PubMed/NCBI View Article : Google Scholar
|
|
25
|
Webb GI: Naïve Bayes. In: Encyclopedia of
Machine Learning. Springer, Boston, MA, pp713-714, 2010.
|
|
26
|
Jerram ST and Leslie RD: The genetic
architecture of type 1 diabetes. Genes (Basel).
8(209)2017.PubMed/NCBI View Article : Google Scholar
|
|
27
|
Nokoff N and Rewers M: Pathogenesis of
type 1 diabetes: Lessons from natural history studies of high-risk
individuals. Ann N Y Acad Sci. 1281:1–15. 2013.PubMed/NCBI View Article : Google Scholar
|
|
28
|
Morahan G: Insights into type 1 diabetes
provided by genetic analyses. Curr Opin Endocrinol Diabetes Obes.
19:263–270. 2012.PubMed/NCBI View Article : Google Scholar
|
|
29
|
Wang Z, Xie Z, Lu Q, Chang C and Zhou Z:
Beyond genetics: What causes type 1 diabetes. Clin Rev Allergy
Immunol. 52:273–286. 2017.PubMed/NCBI View Article : Google Scholar
|
|
30
|
Cerna M: Epigenetic regulation in etiology
of type 1 diabetes mellitus. Int J Mol Sci. 21(36)2019.PubMed/NCBI View Article : Google Scholar
|
|
31
|
Stefan M, Zhang W, Concepcion E, Yi Z and
Tomer Y: DNA methylation profiles in type 1 diabetes twins point to
strong epigenetic effects on etiology. J Autoimmun. 50:33–37.
2014.PubMed/NCBI View Article : Google Scholar
|
|
32
|
Husseiny MΙ, Kaye A, Zebadua E, Kandeel F
and Ferreri K: Tissue-specific methylation of human insulin gene
and PCR assay for monitoring beta cell death. PLoS One.
9(e94591)2014.PubMed/NCBI View Article : Google Scholar
|
|
33
|
Neiman D, Moss J, Hecht M, Magenheim J,
Piyanzin S, Shapiro AMJ, de Koning EJP, Razin A, Cedar H, Shemer R
and Dor Y: Islet cells share promoter hypomethylation independently
of expression, but exhibit cell-type-specific methylation in
enhancers. Proc Natl Acad Sci USA. 114:13525–13530. 2017.PubMed/NCBI View Article : Google Scholar
|
|
34
|
Lehmann-Werman R, Neiman D, Zemmour H,
Moss J, Magenheim J, Vaknin-Dembinsky A, Rubertsson S, Nellgård B,
Blennow K, Zetterberg H, et al: Identification of tissue-specific
cell death using methylation patterns of circulating DNA. Proc Natl
Acad Sci USA. 113:E1826–E1834. 2016.PubMed/NCBI View Article : Google Scholar
|
|
35
|
Kuroda A, Rauch TA, Todorov I, Ku HT,
Al-Abdullah IH, Kandeel F, Mullen Y, Pfeifer GP and Ferreri K:
Insulin gene expression is regulated by DNA methylation. PLoS One.
4(e6953)2009.PubMed/NCBI View Article : Google Scholar
|
|
36
|
Herold KC, Usmani-Brown S, Ghazi T,
Lebastchi J, Beam CA, Bellin MD, Ledizet M, Sosenko JM, Krischer JP
and Palmer JP: Type 1 Diabetes TrialNet Study Group. β cell death
and dysfunction during type 1 diabetes development in at-risk
individuals. J Clin Invest. 125:1163–1173. 2015.PubMed/NCBI View Article : Google Scholar
|
|
37
|
Fisher MM, Watkins RA, Blum J,
Evans-Molina C, Chalasani N, DiMeglio LA, Mather KJ, Tersey SA and
Mirmira RG: Elevations in circulating methylated and unmethylated
preproinsulin DNA in new-onset type 1 diabetes. Diabetes.
64:3867–3872. 2015.PubMed/NCBI View Article : Google Scholar
|
|
38
|
Mouzaki K, Kotanidou EP, Fragou A, Kyrgios
I, Giza S, Kleisarchaki A, Tsinopoulou VR, Serbis A, Tzimagiorgis G
and Galli-Tsinopoulou A: Insulin gene promoter methylation status
in Greek children and adolescents with type 1 diabetes. Biomed Rep.
13(31)2020.PubMed/NCBI View Article : Google Scholar
|
|
39
|
Mirabello L, Frimer M, Harari A, McAndrew
T, Smith B, Chen Z, Wentzensen N, Wacholder S, Castle PE,
Raine-Bennett T, et al: HPV16 methyl-haplotypes determined by a
novel next-generation sequencing method are associated with
cervical precancer. Int J Cancer. 136:E146–E153. 2015.PubMed/NCBI View Article : Google Scholar
|
|
40
|
Zhao L, Liu D, Xu J, Wang Z, Chen Y, Lei
C, Li Y, Liu G and Jiang Y: The framework for population epigenetic
study. Brief Bioinform. 19:89–100. 2018.PubMed/NCBI View Article : Google Scholar
|
|
41
|
Xu J, Zhao L, Liu D, Hu S, Song X, Li J,
Lv H, Duan L, Zhang M, Jiang Q, et al: EWAS: Epigenome-wide
association study software 2.0. Bioinformatics. 34:2657–2658.
2018.PubMed/NCBI View Article : Google Scholar
|
|
42
|
Guo S, Diep D, Plongthongkum N, Fung HL
and Zhang K and Zhang K: Identification of methylation haplotype
blocks aids in deconvolution of heterogeneous tissue samples and
tumor tissue-of-origin mapping from plasma DNA. Nat Genet.
49:635–642. 2017.PubMed/NCBI View Article : Google Scholar
|
|
43
|
Clarke MA, Gradissimo A, Schiffman M, Lam
J, Sollecito CC, Fetterman B, Lorey T, Poitras N, Raine-Bennett TR,
Castle PE, et al: Human papillomavirus DNA methylation as a
biomarker for cervical precancer: Consistency across 12 genotypes
and potential impact on management of HPV-positive women. Clin
Cancer Res. 24:2194–2202. 2018.PubMed/NCBI View Article : Google Scholar
|
|
44
|
Xu L, Pen S, He Q, Chen Z and Kuang M:
Identification of DNA methylation signatures for microvascular
invasion in hepatocellular carcinoma. Gut. 68:A1–A166. 2019.
|
|
45
|
Peng X, Li Y, Kong X, Zhu X and Ding X:
Investigating different DNA methylation patterns at the resolution
of methylation haplotypes. Front Genet. 12(697279)2021.PubMed/NCBI View Article : Google Scholar
|
|
46
|
Hong S, Lin B, Xu M, Zhang Q, Huo Z, Su M,
Ma C, Liang J, Yu S, He Q, et al: Cell-free DNA methylation
biomarker for the diagnosis of papillary thyroid carcinoma.
EBioMedicine. 90(104497)2023.PubMed/NCBI View Article : Google Scholar
|
|
47
|
Zhang H, Zhang Z, Liu X, Duan H, Xiang T,
He Q, Su Z, Wu H and Liang Z: DNA methylation haplotype block
markers efficiently discriminate follicular thyroid carcinoma from
follicular adenoma. J Clin Endocrinol Metab. 106:1011–1021.
2021.PubMed/NCBI View Article : Google Scholar
|
|
48
|
Wu H, Guo S, Liu X, Li Y, Su Z, He Q, Liu
X, Zhang Z, Yu L, Shi X, et al: Noninvasive detection of pancreatic
ductal adenocarcinoma using the methylation signature of
circulating tumour DNA. BMC Med. 20(458)2022.PubMed/NCBI View Article : Google Scholar
|
|
49
|
Mo S, Dai W, Wang H, Lan X, Ma C, Su Z,
Xiang W, Han L, Luo W, Zhang L, et al: Early detection and
prognosis prediction for colorectal cancer by circulating tumour
DNA methylation haplotypes: A multicentre cohort study.
EClinicalMedicine. 55(101717)2022.PubMed/NCBI View Article : Google Scholar
|
|
50
|
Hao Y, Yang Q, He Q, Hu H, Weng Z, Su Z,
Chen S, Peng S, Kuang M, Chen Z and Xu L: Identification of DNA
methylation signatures for hepatocellular carcinoma detection and
microvascular invasion prediction. Eur J Med Res.
27(276)2022.PubMed/NCBI View Article : Google Scholar
|
|
51
|
de Winter JCF, Dodou D and Wieringa PA:
Exploratory factor analysis with small sample sizes. Multivariate
Behav Res. 44:147–181. 2009.PubMed/NCBI View Article : Google Scholar
|
|
52
|
Preacher KJ and MacCallum RC: Exploratory
factor analysis in behavior genetics research: Factor recovery with
small sample sizes. Behav Genet. 32:153–161. 2002.PubMed/NCBI View Article : Google Scholar
|
|
53
|
Stephens M, Smith NJ and Donnelly P: A new
statistical method for haplotype reconstruction from population
data. Am J Hum Genet. 68:978–989. 2001.PubMed/NCBI View
Article : Google Scholar
|
|
54
|
Stephens M and Donnelly P: A comparison of
bayesian methods for haplotype reconstruction from population
genotype data. Am J Hum Genet. 73:1162–1169. 2003.PubMed/NCBI View Article : Google Scholar
|