Introduction
Invasive aspergillosis (IA) is a common invasive
fungal disease caused by Aspergillus infection, with 60% of
all people with a fungal disease having an Aspergillus infection.
Pathogenic Aspergillus species include Aspergillus
fumigatus, Aspergillus flavus, Aspergillus niger
and Aspergillus terreus (1). Aspergillus is present widely
in the environment, and it can also exist on the human epidermis,
mucosa of the mouth, as well as other parts of the body. When the
immune barriers of an individual are normal, Aspergillus
generally does not cause disease. However, when an individual is
immunocompromised, Aspergillus will multiply in large
numbers in epidermal tissues, causing infection. The excessive use
of antibiotics may lead to a reduction in the total number of
normal bacterial flora, resulting in the uncontrolled reproduction
of Aspergillus, which can also lead to IA (2).
The incidence of IA has been increasing with the
wide application of broad-spectrum antibiotics, immunosuppressive
agents and corticosteroids, the diagnosis and treatment of organs,
stem cell transplantation and catheter technology, the increasing
incidence of malignant tumours and acquired immunodeficiency
syndrome (3). According to
clinical statistics, IA is the second most common invasive fungal
disease worldwide (4). Due to the
difficulty in making an early diagnosis and a lack of effective
treatment measures, worldwide mortality from IA is 30-95% (5-8),
and mortality in intensive care units has been reported to be as
high as 80% (9).
Because a lack of early diagnosis is the main reason
for the severity and high mortality of IA, the identification and
rapid screening of biomarkers is necessary for improving early
diagnosis (10). Identification of
the molecular mechanisms underlying the pathogenesis of IA is also
required. Analysis of microarray-based mRNA expression levels can
be used to identify genetic risk factors and investigate the
molecular pathobiology of IA (11).
Our previous study revealed that alveolar
macrophages (AM) serve a role in the resistance to
Aspergillus infection in human THP-1-derived macrophages
(12). The level of the CD23
protein in macrophages directly affects the function of AM. PU.1 is
critical for innate immunity against IA as it regulates important
C-type lectin receptors (CLR) expression in human macrophages.
CD23, encoded by the Fc fragment of the IgE receptor II gene was
recently reported to be a novel CLR. CD23 is a low-affinity IgE
receptor and serves key roles in the IgE-mediated immune response,
regulating cell differentiation and inflammation (12). HIF-1 as a critical mediator of
EtOH-mediated metabolic derangements in AM. FES proteins can
positively regulate the PU.1 and CD23 proteins, and HIF-1 can
negatively regulate FES proteins. However, an increase in HIF-1
levels, induced by IA, does not reduce the levels of CD23,
indicating that the increase in HIF-1 levels may not reduce the
ability of AM to resist fungal infection (13). It was further revealed that mice
with IA may have deficiencies in glycolytic energy metabolism and
AM activity, thus promoting the occurrence of the disease (14). The present study hypothesized that
an increase in HIF-1 levels, following AI, may serve a role in
overcoming the defects of the AM glycolysis pathway and improving
the ability of AM to resist fungal infection. Therefore, in the
present study, the association between macrophage activity and the
HIF-1 signalling pathway was confirmed through GO and KEGG
enrichment analyses. Both methods were used to jointly analyse
clinical information and microarray data from patients with IA in
order to identify genes associated with clinical features. These
genes may have important clinical implications and may serve as
diagnostic or prognostic biomarkers and therapeutic targets.
Materials and methods
Microarray data resources
Microarray data from the GSE78000 dataset, comparing
the gene expression levels in blood samples from patients suffering
from IA with that of patients without IA or healthy individuals
(considered as the healthy group in the present study) (15), was obtained from the Gene
Expression Omnibus (GEO) database (https://www.ncbi.nlm.nih.gov/geo/) to screen
differentially expressed genes (DEGs), identify key genes involved
in IA onset and deterioration.
Principal coordinates analysis
(PCoA)
PCoA is a visualization method that examines the
similarities or differences of the data, and allows the observation
of differences between individuals or groups (16). The original expression levels from
the GSE78000 dataset were standardised using log (1+x). The
dissimilarity indices of the standardized samples were calculated
using the Bray Curtis method, using the ‘vegdist’ tool (https://github.com/vegandevs/vegan/) (17). The distance matrix of the
dissimilarity index was calculated using the PCoA of the software
package ‘ape’ (http://ape-package.ird.fr/). After sorting a series of
eigenvalues and eigenvectors, the top 6 samples with were selected
through PCoA analysis.
Identification of DEGs
Raw data for gene expression levels were read and
processed using the ‘affy’ package (version 1.50.0) in the R
software (version 4.0.1, https://www.r-project.org/) (18). Gene probes were annotated using the
Affymetrix Human Genome U219 Array (accession no. GPL21464) as an
annotation profile and unmatched probes were discarded. When
multiple probes matched one gene symbol, the average values of the
probes were calculated as the final expression level of the gene.
DEGs from IA and control samples were screened using the Linear
Models for Microarray (Limma) package (version 3.24.14) in R
(19). Limma was used to analyse
the data according to the expression levels by fitting linear
models and to determine statistical significance with moderated
t-statistics. The P-value was adjusted according to the false
discovery rate (19). Genes with
an adjusted value of P<0.05 and at least a 2-fold increase or
decrease were considered DEGs.
Functional and pathway enrichment
analyses
The biological functions of the DEGs were explored
with GO (http://geneontology.org/) and KEGG
(https://www.kegg.jp/) enrichment analyses
(20,21) using the online tool Database for
Annotation, Visualization and Integrated Discovery (version 6.8;
https://david.ncifcrf.gov/home.jsp)
(18,22). The GO terms included biological
process (BP), cellular component and molecular function. KEGG
provides a set of functionalities, including input by
identifications and sequences, identification of frequent and
statistically enriched pathways, a choice of four statistical tests
and the option of multiple testing correction (23). Significant GO and KEGG pathways
with threshold counts ≥2 and P<0.05 were selected for further
analysis.
Correlation analysis of predicted
target genes
A prerequisite for understanding cellular functions
at the molecular level is determining the functional interactions
among the various proteins in the cell (24). The correlation matrix was generated
based on the results of hierarchical clustering of gene expression.
Spearman's ρ statistic was used to estimate a rank-based measure of
association with hierarchical clustering (Hclust)=0.05 and
P<0.05 as the cut-off values.
Protein-protein interaction (PPI)
network
A PPI network among co-expressed DEGs was
constructed using the STRING database (version 11.0; http://string-db.org/) (25) and a PPI score (medium confidence)
≥0.4 was defined as the cut-off value (26,27).
IA specimens
Between January 2020 and May 2021, whole blood
samples from 6 cases with IA (3 males, 3 females; age, 67±8 years)
and 6 cases without IA (controls; 3 males, 3 females; age, 65±9
years) were collected from the Department of Respiratory and
Critical Care Medicine of the First Affiliated Hospital of Henan
University of Science and Technology (Luoyang, China). Patients
that had a history of IA or had clinical or biochemical evidence of
other comorbidities were excluded (Table SI). Patients with IA and controls
provided written informed consent prior to using their blood
samples in the present study. The current study was approved by the
Ethics Committee of The First Affiliated Hospital of Henan
University of Science and Technology (approval no. HUST2034532,
Luoyang, China).
Reverse transcription-quantitative
polymerase chain reaction (RT-qPCR)
Complete RNA was extracted from whole blood with TRI
reagent (Merck KGaA), and all mRNA was subjected to reverse
transcription (RT) and qPCR using a PrimeScript® RT
Master Mix (Perfect Real Time) kit (Takara Biotechnology Co., Ltd.)
and SYBR Green Master Mix (Takara Biotechnology Co., Ltd.),
respectively, according to the manufacturer's protocols. qPCR was
performed on a Roche LightCycler® 480 II Real-Time
System (Roche Diagnostics). The program was as follows: 2 min at
94˚C followed by 40 cycles of 30 sec at 94˚C and 20 sec at 60˚C.
The results were analysed using the 2-ΔΔCq method
(28). The genes were amplified
using specific primers, and GAPDH was used as the reference gene in
qPCR (Table I).
 | Table ISequence information for primers used
in reverse transcription-quantitative PCR. |
Table I
Sequence information for primers used
in reverse transcription-quantitative PCR.
| Gene name | NCBI gene
identification number | Primer sequence
(5'-3') |
|---|
| ARG1 | 383 | F:
GCTACTCTCAGGATTAGATATA |
| | | R:
CAAGGTTATTGCAACTGCTGTGT |
| CD177 | 57126 | F:
AGCATTCAGGGCTGCGTGGCCCA |
| | | R:
CACATCACGCTTCTCACGCGCAG |
| FES | 2242 | F:
ACGTGTGGAGCTTTGGCATCTTG |
| | | R:
CACGGCATCAGGACACAGCTCTG |
| HMOX1 | 3162 | F:
CAACAAAGTGCAAGATTCTGCCC |
| | | R:
AGGACCCATCGGAGAAGCGGAGC |
| ICAM1 | 3383 | F:
CCGCAAGGTGACCGTGAATGTGC |
| | | R:
CGCTGGCGGTTATAGAGGTACGT |
| IL4R | 3566 | F:
TGGGCAGTGGCATTGTCTACTCA |
| | | R:
ACAGCAAGGACTGGCCATGACAG |
| ITGAM | 3684 | F:
ACCTCCTGATCGTGAGCACAGCT |
| | | R:
CGACAGAGCTGCCCACGATGAGC |
| MMP2 | 4313 | F:
TGGAGACAAATTCTGGAGATACA |
| | | R:
TGCAGGTCCACGACGGCATCCAG |
| PFKFB3 | 5209 | F:
ACGCCTGTCGCTTATGGCTGCCG |
| | | R:
GACACTATTGCGTCTCATGAGCG |
| TIMP1 | 7076 | F:
CTGGAACAGCCTGAGCTTAGCTC |
| | | R:
GTCCGTCCACAAGCAATGAGTGC |
| ALDOC | 230 | F:
AGCCTCTGCACTCAATGCCTGGC |
| | | R:
GCAAGCCCATTCACCTCAGCCCG |
| BLK | 640 | F:
CGCAACCTGGAGCGCGGCTACCG |
| | | R:
AAGTCCTCCAGCACCGACTGCAG |
| LDHB | 3945 | F:
AAGGATATACCAACTGGGCTATT |
| | | R:
ATCCCCTTTACCATTGTTGACAC |
| RPS12 | 6206 | F:
ATCCAACTGTGATGAGCCTATGT |
| | | R:
CTACACAACTGCAACCAACCACT |
| RPL8 | 6132 | F:
GCATCAGGGAACTATGCCACCGT |
| | | R:
CACACCAACCACAGCTCTGTTGG |
| RPL35 | 11224 | F:
CACGTGCCATGCGCCGCCGGCTC |
| | | R:
TTGACCGCGTACTTCCGCAGCGG |
| RPS6 | 6194 | F:
TTCAGCGTCTTGTTACTCCACGT |
| | | R:
GCATATTCTGCAGCCTCTTCTTT |
| RPS16 | 6217 | F:
GTGTAGACATCCGTGTCCGTGTA |
| | | R:
TATTTCTGGTAATAGGCCACCAG |
| GAPDH | 2597 | F:
CATCACTGCCACCCAGAAGACTG |
| | | R:
ATGCCAGTGAGCTTCCCGTTCAG |
Western blot assay
Whole blood from healthy patients and patients with
IA was extracted using a Whole Blood Protein Extraction kit
(EX1200, Beijing Solarbio Science & Technology Co., Ltd.) and
quantified via the bicinchoninic acid assay (Pierce; Thermo Fisher
Scientific, Inc.). A total of 24 µg protein sample was loaded per
lane and then electrophoresed on 10% SDS-PAGE gels and transferred
to PVDF membranes (MilliporeSigma) using electrophoresis systems
(Tanon VE-180 and Tanon VE-186, respectively; Tanon Science and
Technology Co., Ltd.). The PVDF membranes were blocked with 5%
(w/v) skimmed milk powder at room temperature for 2 h and incubated
at 4˚C overnight with the following primary antibodies: IL4
(1:1,000; cat. no. ab34277; Abcam), ITGAM (1:500; cat. no.
ab133357; Abcam), MMP2 (1:1,000; cat no. ab181286; Abcam), GAPDH
(1:5,000; cat. no. ab181602; Abcam) and RPL8 (1:1,000; cat. no.
ab169538; Abcam). The membranes were then washed five times with 1X
PBS-5% Tween 20 and incubated with HRP-labelled goat anti-rabbit
IgG (1:10,000; cat. no. ab205718; Abcam) and anti-rat IgG
(1:10,000; cat. no. ab205720; Abcam) secondary antibodies at room
temperature for 1 h. Blots were subsequently visualized using an
enhanced chemiluminescence detection kit (MilliporeSigma) according
to the manufacturer's protocols. A ChemiDoc MP (Bio-Rad
Laboratories, Inc.) scanning system was used to assess the
immunoreactive protein bands.
Statistical analysis
The data are presented as the mean ± SEM.
Statistical analysis was performed using GraphPad Prism 6.05
software (GraphPad Software; Dotmatics). The data were analysed
using paired Student's t-tests as appropriate. P<0.05 was
considered to indicate a statistically significant difference.
Results
Identification of DEGs in IA
The GSE78000 dataset was downloaded from the GEO
database and included 45 samples in total. Subsequently, the
samples of 23 patients with IA and 9 healthy individuals were
selected for primary analysis and unclassified samples were
excluded. According to the results of PCoA analysis, 12 blood
samples (6 patients with IA matched with 6 patients without IA or
healthy individuals) were selected for further analysis (Fig. S1 and Table SII). The Limma package was then
used to identify DEGs by comparing samples with IA with matched
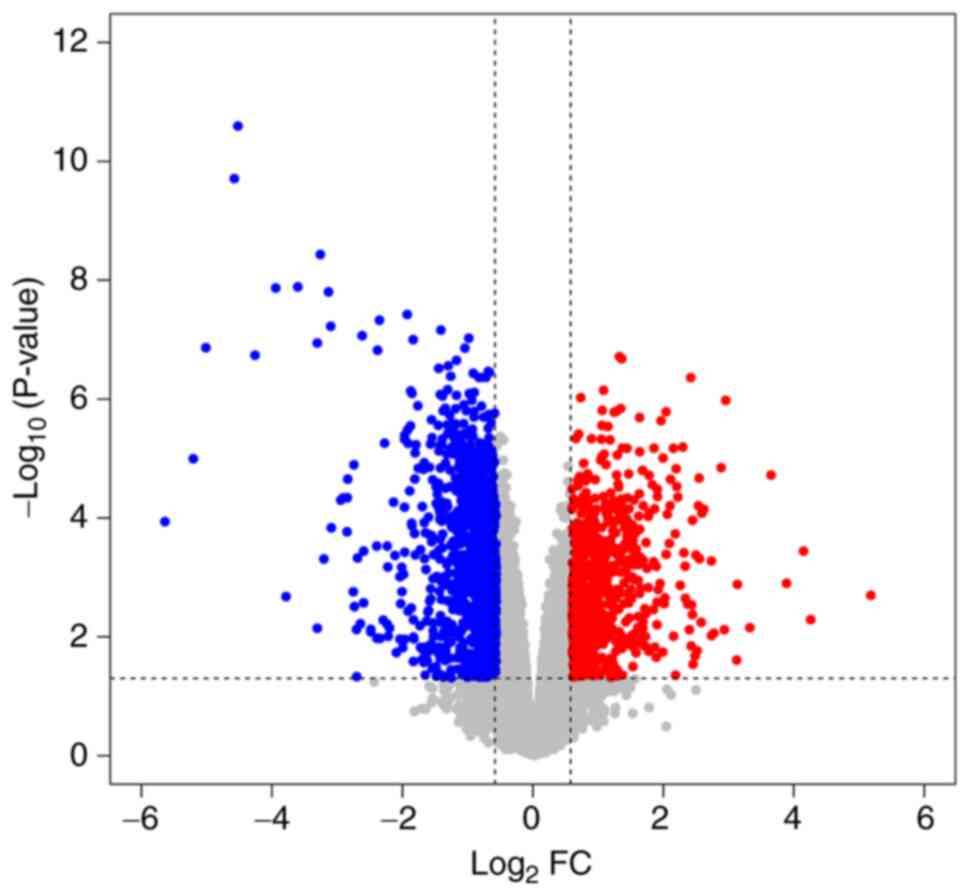
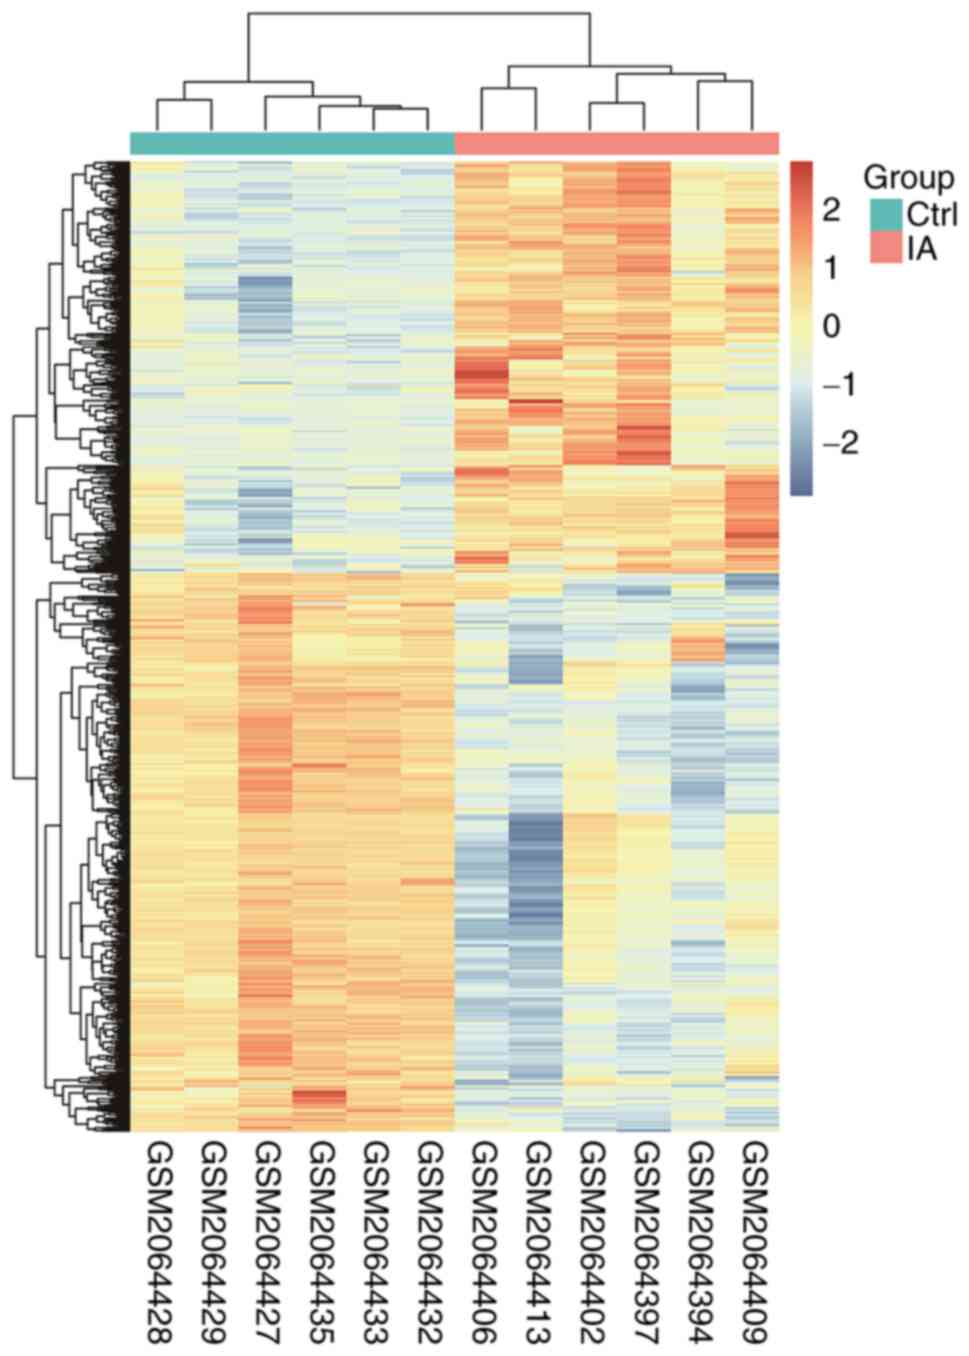
control samples. The Limma package identified 312 upregulated and
423 downregulated genes (a total of 735 genes; Table SIII). The expression levels and
distribution status of all DEGs in the GSE78000 dataset are
presented in a volcano plot (Fig.
1) and a heatmap (Fig. 2).
Functional and pathway enrichment
analyses of DEGs
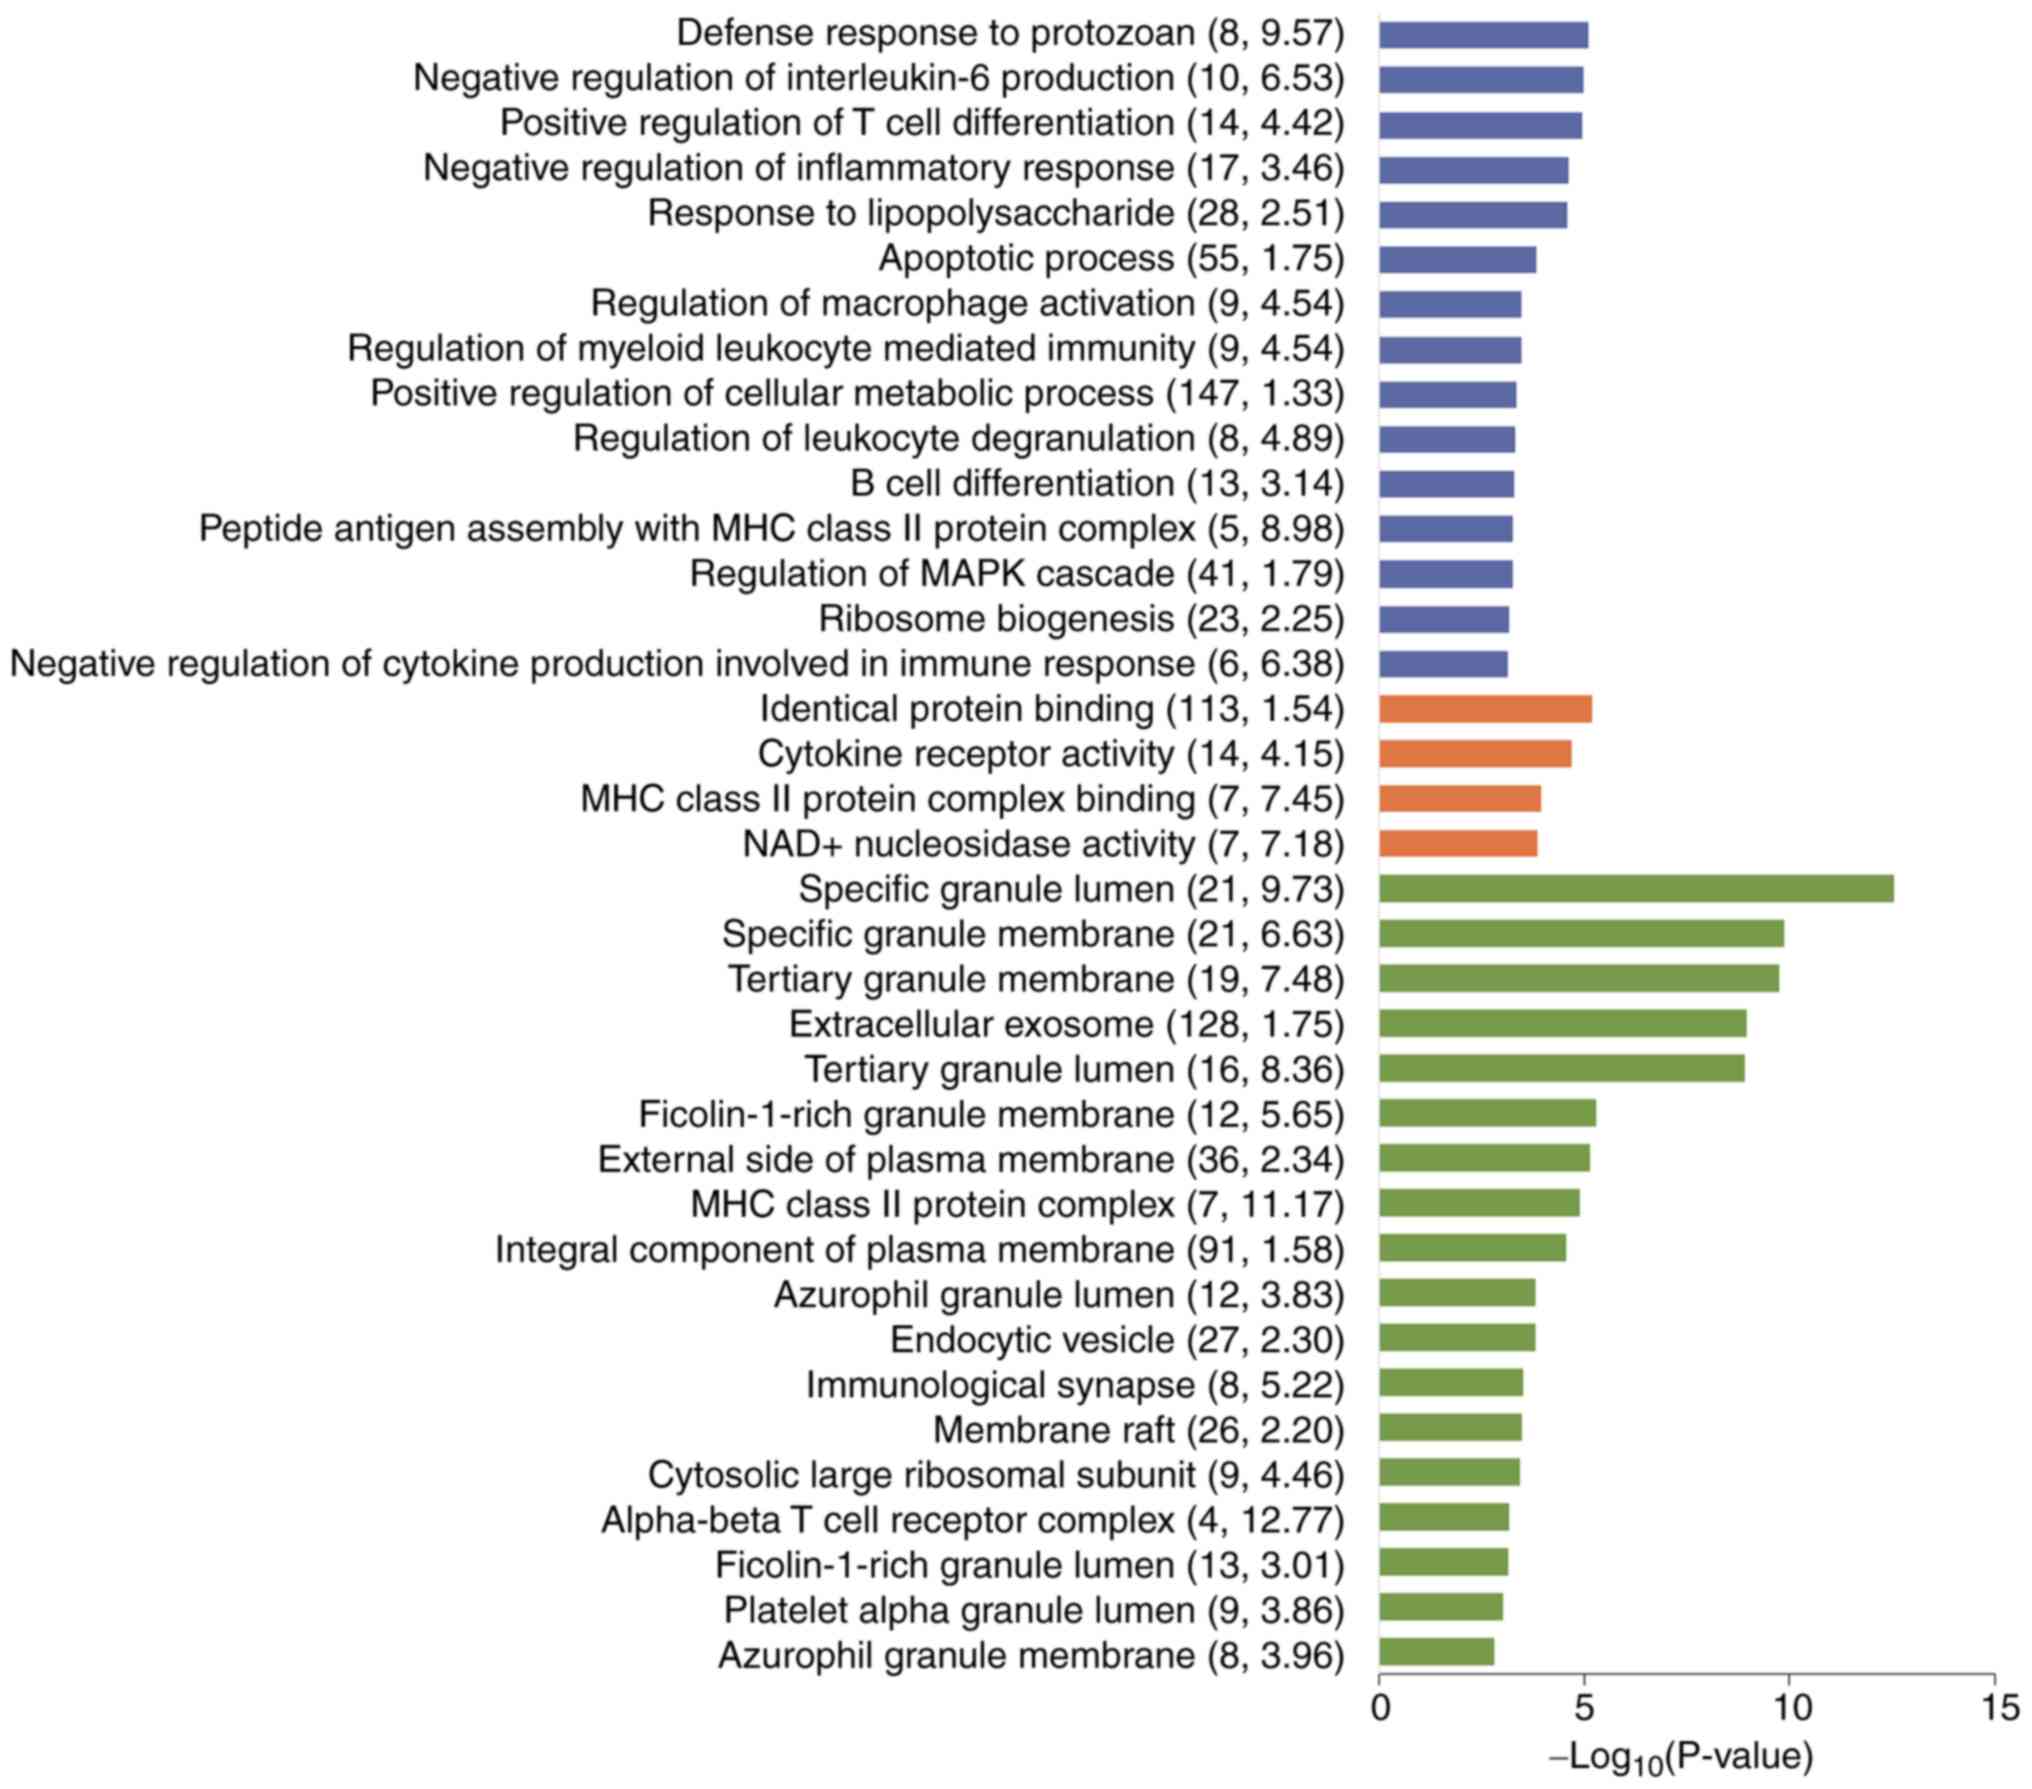
After obtaining the DEGs, GO and KEGG enrichment
analyses were performed to examine the classification of the DEGs.
The GO analysis revealed that the BP terms included ‘regulation of
macrophage activation’, MF terms included ‘cytokine receptor
activity’ and CC terms included ‘immunological synapse’ (Fig. 3 and Table SIV). This finding demonstrated
that the occurrence of IA was associated with abnormal immune
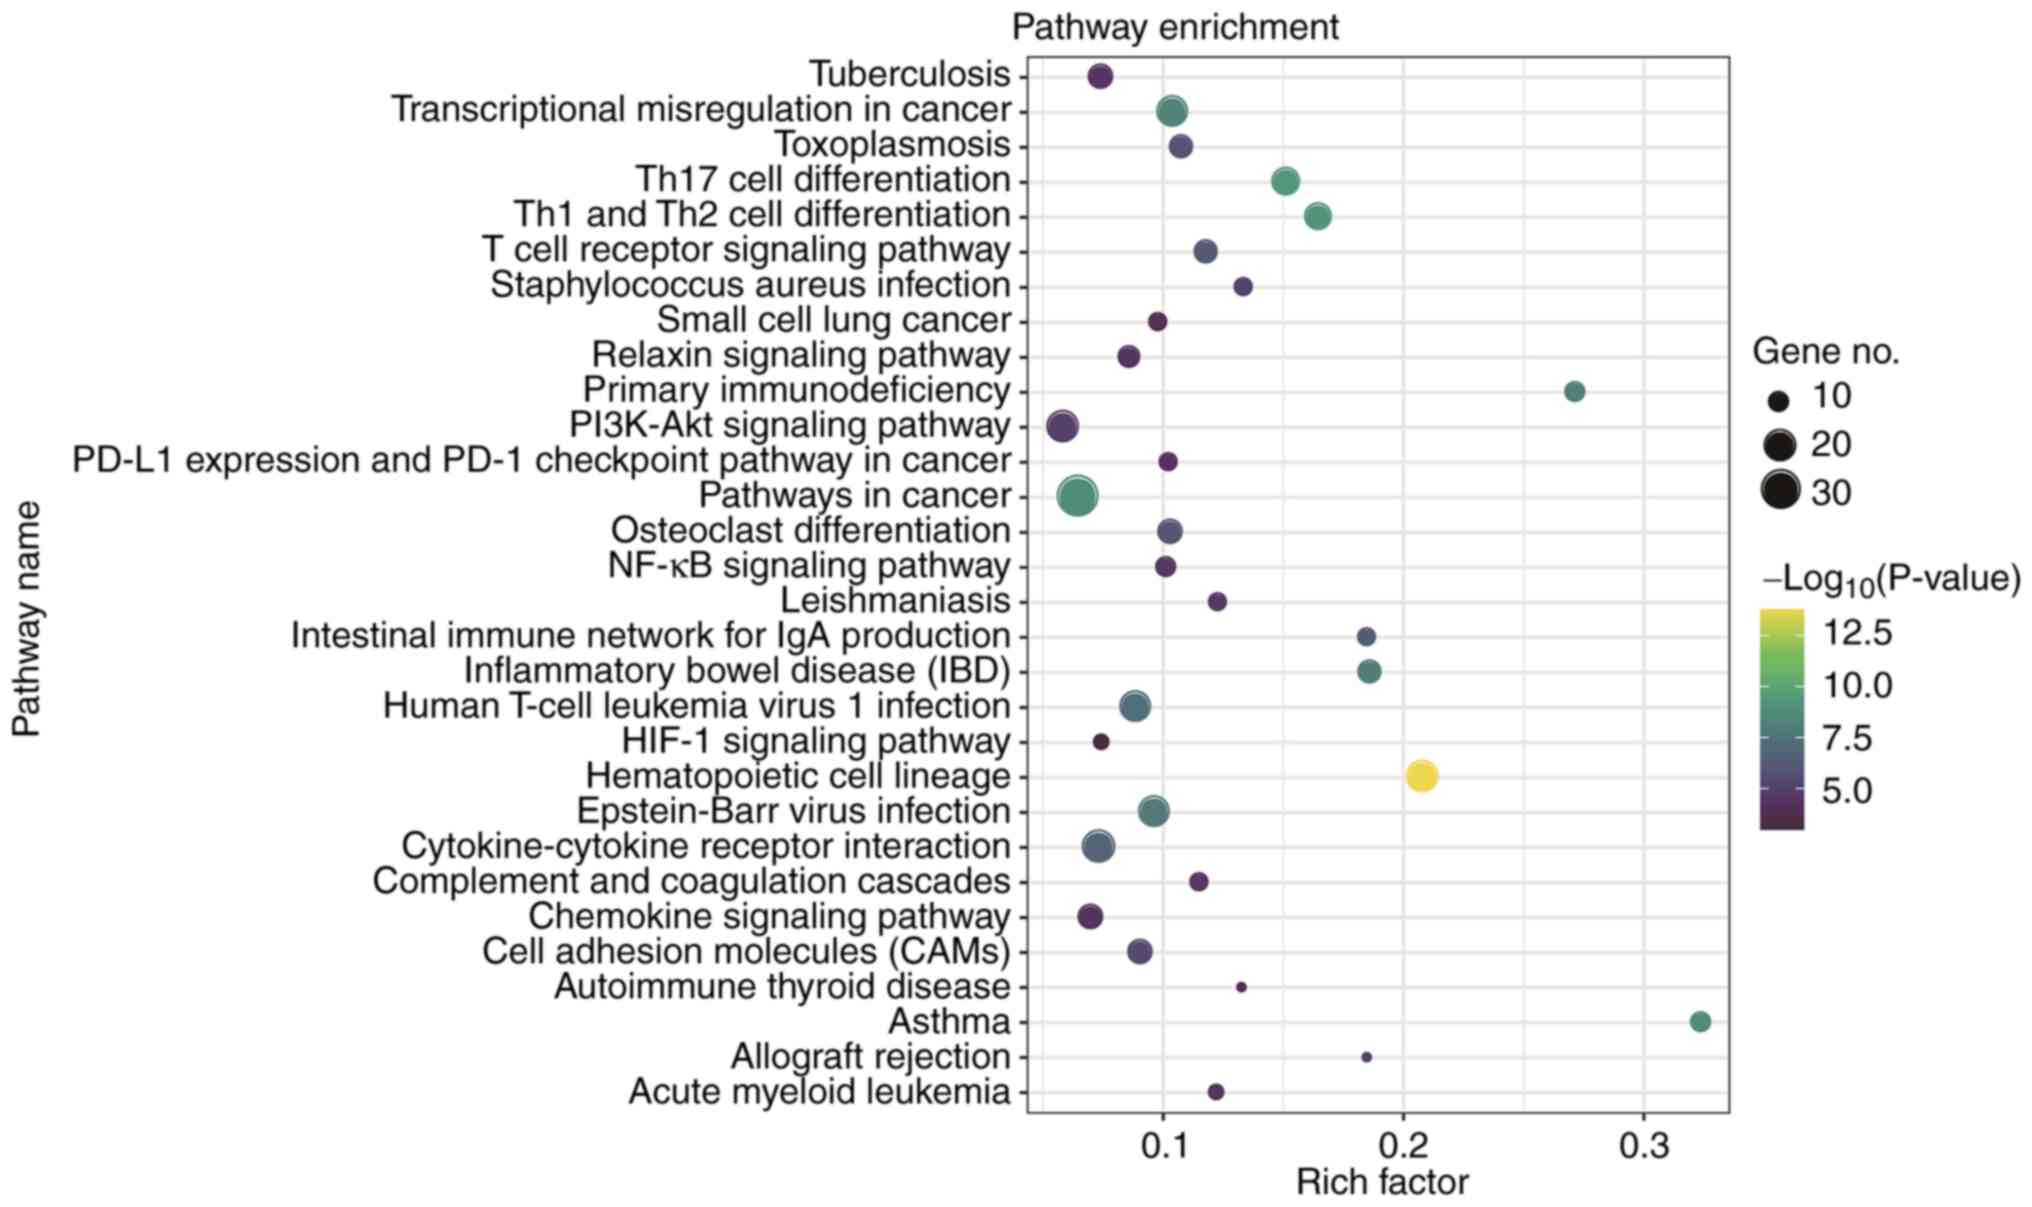
function. At the same time, a previous study reported that the
HIF-1 signalling pathway plays a role in antifungal immunity
(13); thus, the potential
implication of the HIF-1 signalling pathway in IA was further
investigated. It was revealed that the significantly enriched KEGG
pathways of the DEGs included the HIF-1 signalling pathway
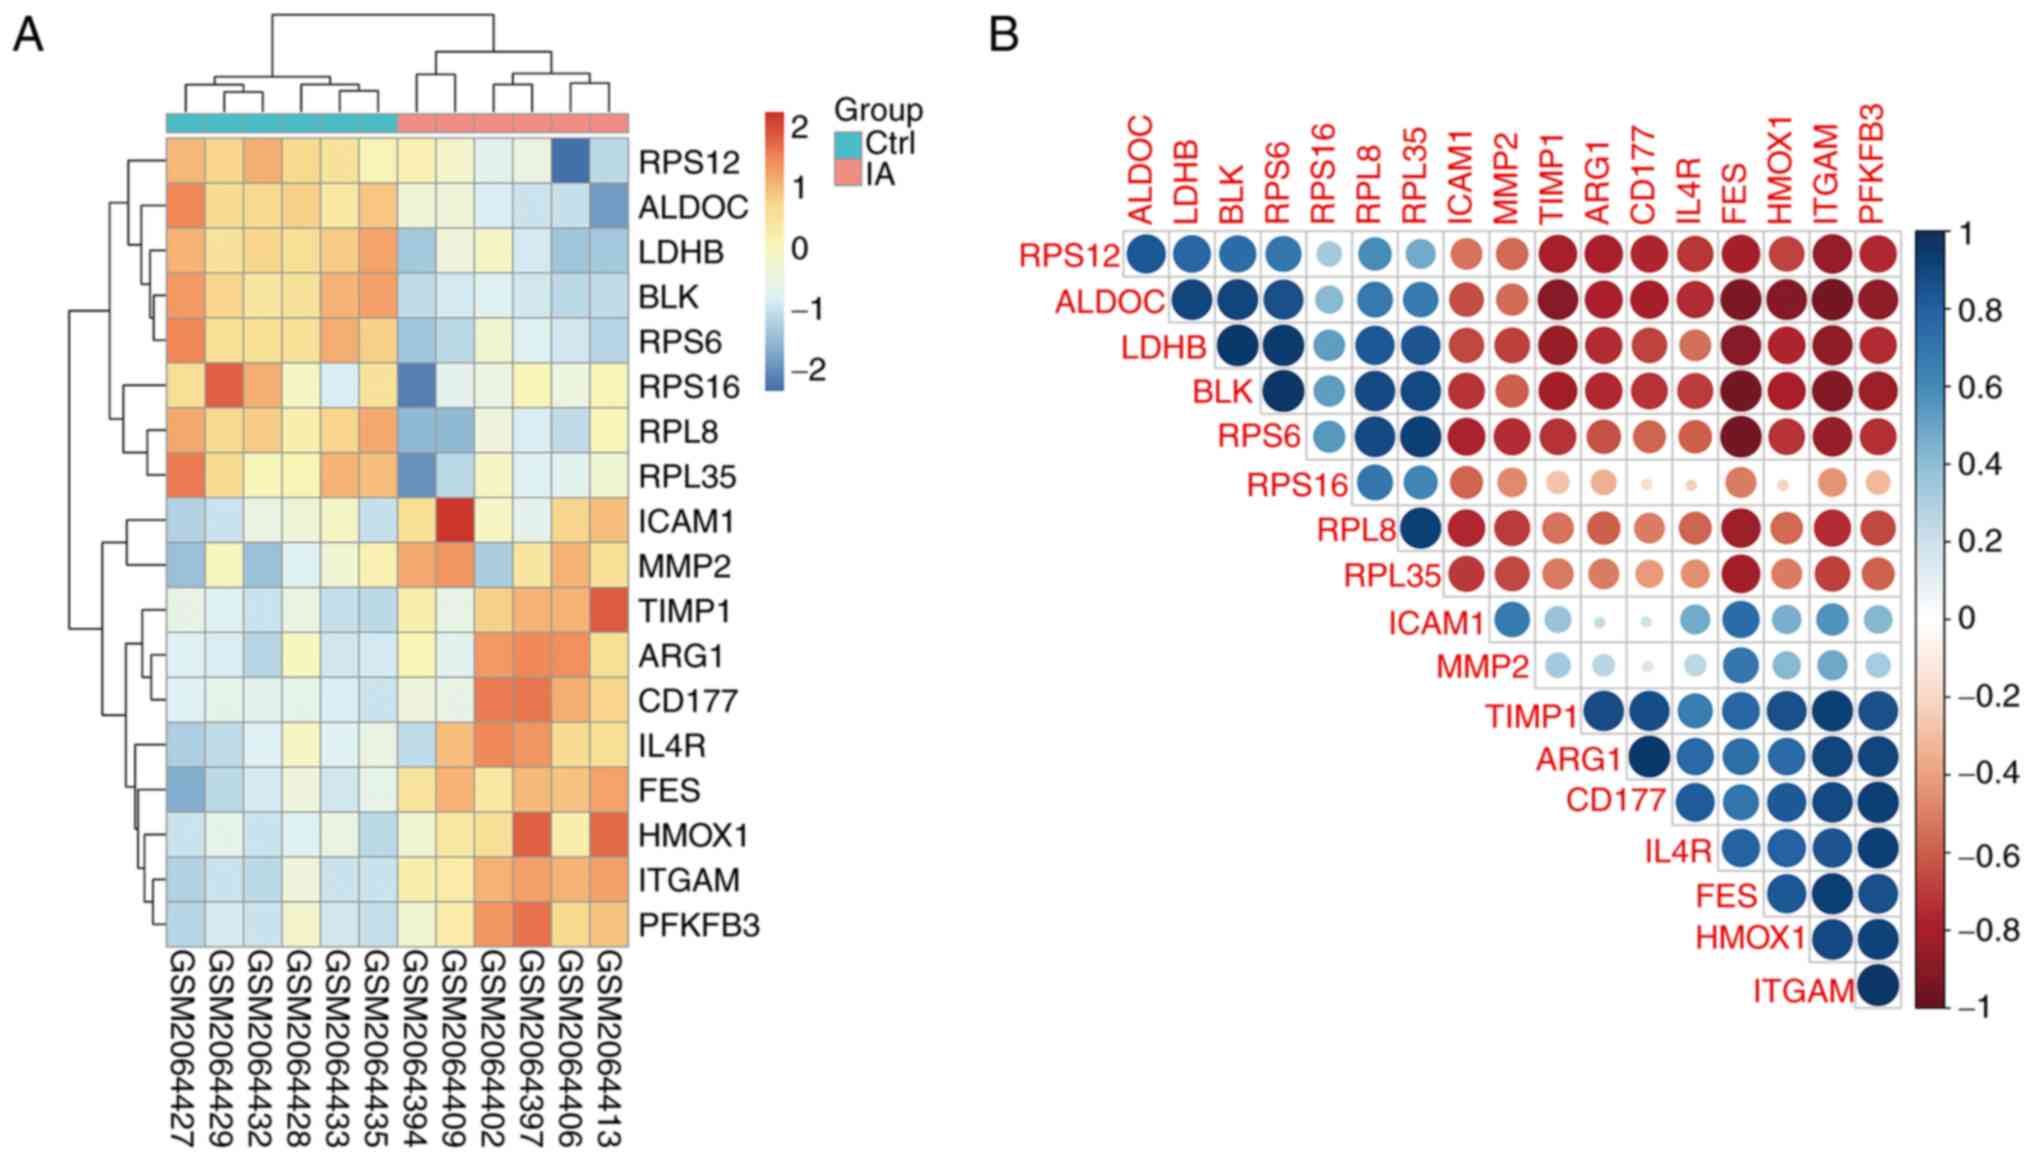
(Fig. 4 and Table SV). The present study demonstrated
that there are 18 major signalling molecules involved in the
macrophage activation signalling pathway and HIF-1 signalling
pathway. Among them, the expression of ICAM1, MMP2, TIMP1, ARG1,
CD177, IL4R, FES, HMOX1, ITGAM and PFKFB3 were upregulated and the
expression of RPS12, ALDOC, LDHB, BLK, RPS6, RPS16, RPL8 and RPL35
were downregulated in IA group compared with control groups
(Fig. 5A).
Correlation analysis of macrophage
activation and HIF-1 signalling pathways
In the aforementioned experiments, the expression
levels of the signalling pathways moleucles regulating macrophage
activity and HIF-1 were significantly different between the IA and
control samples. To clarify whether correlation occurred between
the macrophage activation and HIF-1 signalling pathways, Hclust
correlation analysis was used to predict co-expressed interactions
(Fig. 5B). With HClust=0.05 as the
cut-off for a significant difference, the 18 genes were revealed to
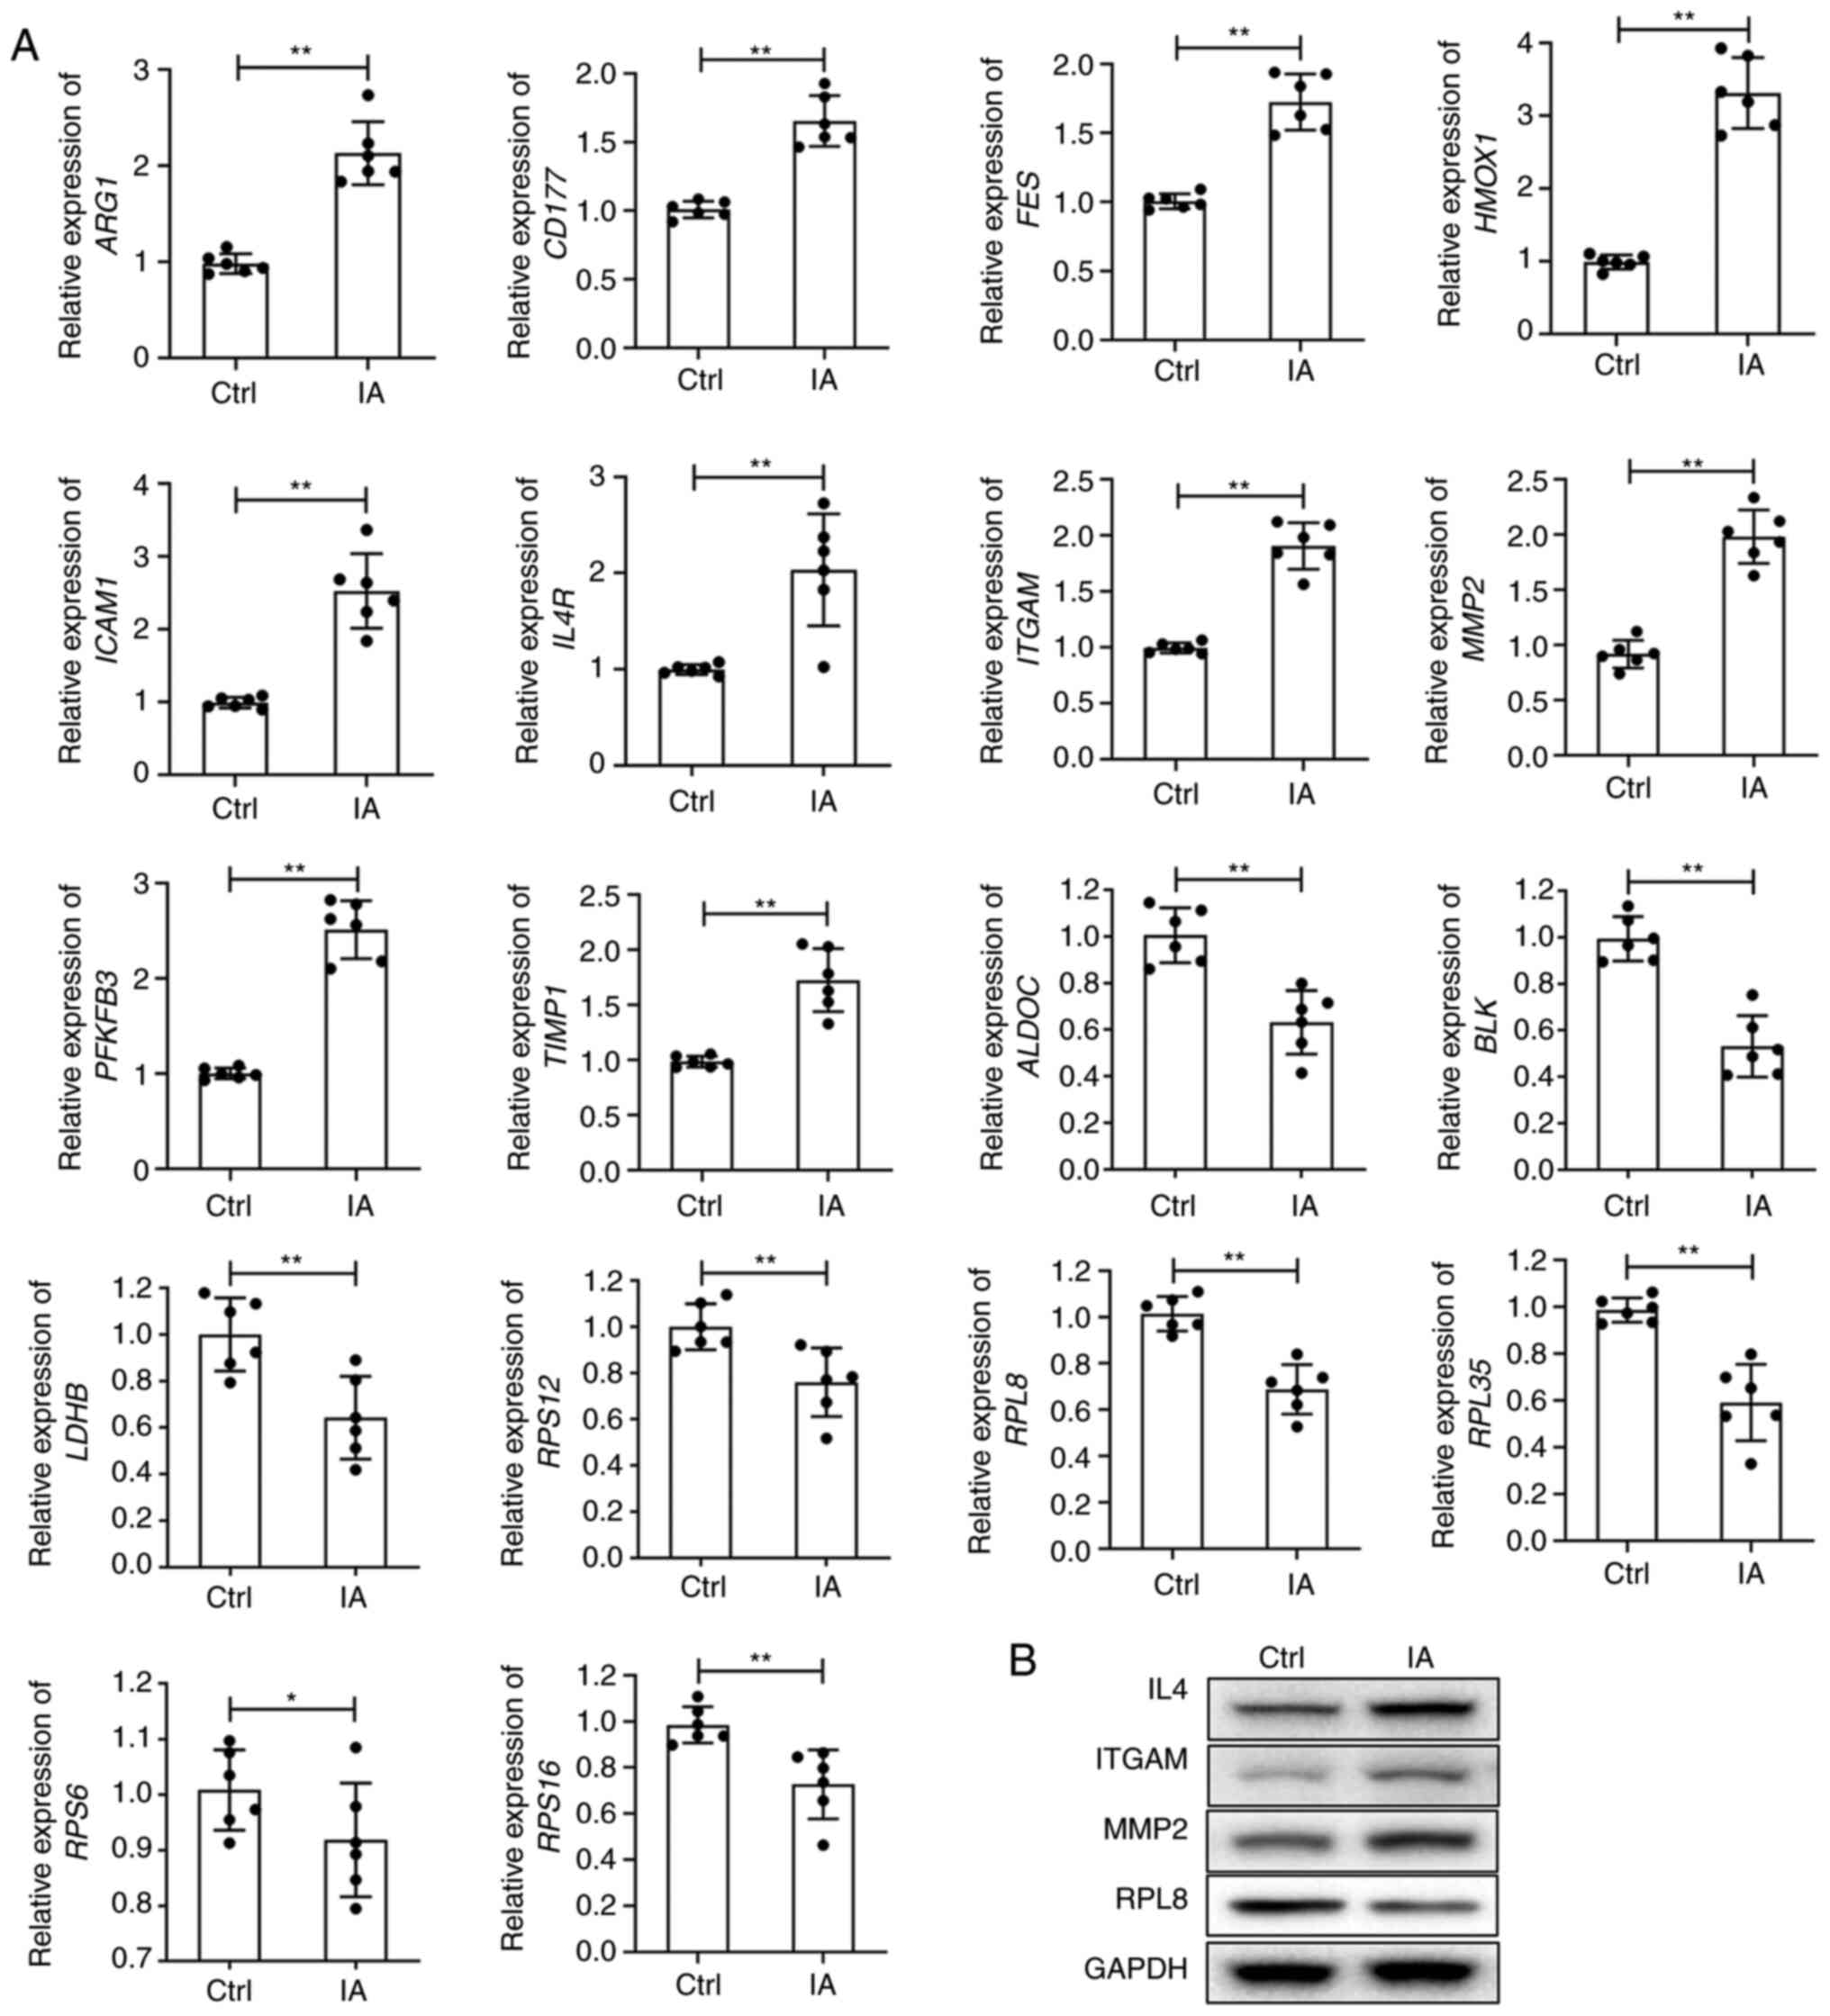
be correlated with each other. Subsequently, the expression levels
of them were compared between the control and IA groups (Fig. 6A). Compared with the control group,
the expression levels of all 10 genes in the macrophage activity
regulation signalling pathway were significantly higher (P<0.01)
in the IA group. The expression levels of the eight genes in the
HIF-1 signalling pathway were decreased significantly in the IA
group compared with the control group. Except for RPS6 (P<0.05),
the other seven genes exhibited a significant difference of
P<0.01 (Fig. 6A). Furthermore,
the protein levels of IL4, ITGAM and MMP2 were upregulated, while
the RPL8 protein level was downregulated in patients with IA
compared with healthy controls (Fig.
6B). The aforementioned results demonstrated the correlation
between the two types of genes.
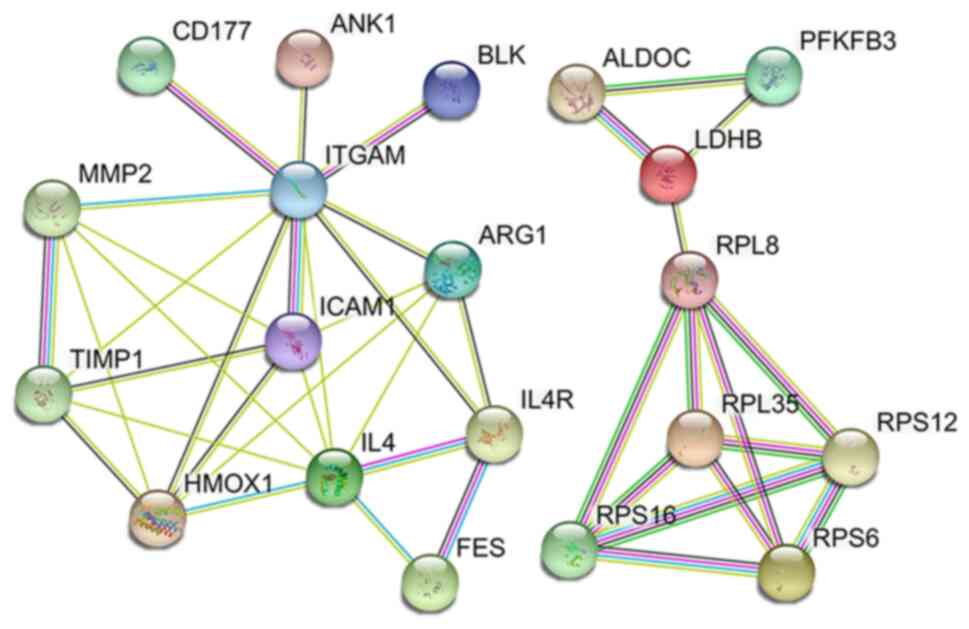
Gene expression levels represent the level of RNA
expression, and they cannot account for the final functionality at
the protein level. To further investigate the relationship between
macrophage activation and HIF-1 signalling pathways, PPI analysis
was employed. Strong interactions were revealed among the 12
proteins of the macrophage activity regulation signalling pathway,
and there were also interactions among the eight proteins of the
HIF-1 signalling pathway. However, there was no PPI between the
macrophage activity regulation and HIF-1 signalling pathways
(Fig. 7).
Discussion
Galactomannan assay, PCR, β-D-glucan testing and
biopsy are the primary methods of diagnosing aspergillosis. The
lack of clinical statistical data and a diagnostic consensus are
the main reasons for the severity and high mortality of IA;
however, identification and rapid screening of simple biomarkers
would allow for an early diagnosis. Understanding the molecular
mechanisms underlying the pathogenesis of IA is required. Although
a number of prognostic models have been proposed, the majority of
the models are based on clinical parameters and lack accuracy.
Therefore, the pre-diagnosis of IA needs to be accurate, and
improved IA-specific biomarkers are required. Improved biomarkers
will provide more accurate clinical information that could enhance
decision-making for patient management (29).
Bioinformatics analysis was performed to identify
the correlation analysis modules associated to the diagnosis of IA.
The macrophage activity regulation and HIF-1 signalling pathways
were revealed to be significantly upregulated and downregulated,
respectively, in patients with IA compared with that in healthy
individuals. For further analysis of the correlation between
macrophage activation and HIF-1 signalling pathways, blood samples
were collected from allogeneic haematopoietic stem cell transplant
recipients and patients receiving myelosuppressive chemotherapy
(15). Therefore, the patients
with IA were immunocompromised individuals. For patients with
immunosuppression, increased macrophage activity may be a feedback
mechanism. However, in the present study, the control group
included patients with immunosuppression but without IA, and the
macrophage activity in these individuals was not increased, thereby
excluding the possibility that increased macrophage activity in the
IA group was a compensatory response to immunosuppression. This
suggests that the increased macrophage activity in patients with IA
was an innate immune response to Aspergillus infection,
which is consistent with the experimental results of previous
studies (30-32).
Tan et al (33) reported
that macrophages exposed to lysyl oxidase like 4 in vitro
can cause an immunosuppressive phenotype, activate the expression
of the programmed cell death ligand 1 and inhibit the function of
CD8+ T cells. Fecher et al (34) reported that after infection with
Histoplasma capsulatum, the increased activity of
transcription factor cAMP response element-binding protein in
HIF-1α-knockout mice further increased the production of IL-10 in
macrophages (34). In the present
study, the macrophage activation pathway was upregulated in the IA
group compared with the control group. There are numerous molecules
that regulate macrophage activity, of which HIF-1 has attracted
attention. For example, Fecher et al (34) demonstrated that HIF-1α could
promote macrophages to prevent fungal growth by inhibiting the
production of IL-10 by macrophages. Additionally, studies have
demonstrated that in a mouse model of Aspergillus fumigatus
infection, mTOR-mediated HIF-1α activation is necessary for
macrophage glycolysis activation and its role in controlling the
growth of Aspergillus fumigatus (30,35).
In addition, ω-alkynyl arachidonic acid polarizes macrophages to
the M2 type by interfering with HIF-1α and pyruvate kinase
(36). These previous studies have
demonstrated that HIF-1α was necessary in the polarization of
macrophages to the M1 type. Therefore, clarifying the expression
profiles of the HIF-1 signalling pathway in patients with IA is
required to understand the molecular mechanism underlying this
process. The present study revealed that the HIF-1 signalling
pathway was significantly downregulated in patients with IA
compared with that of controls. This suggested that the activation
of macrophages in patients with IA may be considered an M2-type
activation. Therefore, although the activity of the macrophages in
patients with IA was increased compared with that in the control
group, the patients were immunosuppressed and could not eliminate
the Aspergillus infection. Further experimental research is
needed to confirm this hypothesis. At the same time, the present
study results may indicate that the root cause of
Aspergillus infection was the inhibition of HIF-1 expression
in the patients with IA. Therefore, it is necessary to clarify the
molecular biological mechanism causing HIF-1 inhibition with
further in-depth research on this topic.
In the PPI analysis, there was no interaction
between the macrophage activity regulation and HIF-1 signalling
pathways. This indicated that the regulation of macrophage function
by HIF-1 was not due to a direct interaction, but was mediated by
intermediate signalling molecules, and future research in this
field should focus on identifying these molecular signals.
In conclusion, a comprehensive bioinformatic
analysis of the gene expression profiles of blood samples from
patients with IA and patients without IA or healthy individuals was
conducted, and 735 DEGs were identified. There were 18 co-expressed
genes belonging to macrophage activation and HIF-1 signalling
pathways. The present study indicated that downregulation of the
HIF-1 signalling pathway and upregulation of macrophage activity
may be the reason for Aspergillus infection and could be
used as biomarkers for the prediction and diagnosis of IA.
Supplementary Material
PCoA analysis demonstrating the
distance of the samples in the GSE78000 dataset.
The information of IA patients.
Detailed information on the microarray
data of GSE78000 obtained from the GEO database. GEO: Gene
Expression Omnibus.
Detailed information on DEGs. DEGs:
differentially expressed genes.
Pathway enrichment of DEGs by GO
analysis. GO: Gene Ontology; DEGs: differentially expressed
genes.
Pathway enrichment of DEGs by KEGG
analysis. KEGG: Kyoto Encyclopedia of Genes and Genomes; DEGs:
differentially expressed genes.
Acknowledgements
Not applicable.
Funding
Funding: The present study was funded by the Henan Provincial
Program for Science and Technology Research (grant no.
202102310047) and the Henan Provincial Program for Medical Science
and Technology Research (grant no. LHGJ20200569).
Availability of data and materials
The bioinformatics datasets generated and/or
analysed during the current study are available in the GEO
repository (https://www.ncbi.nlm.nih.gov/geo/query/acc.cgi?acc=GSE78000).
Other datasets used and/or analyzed during the current study are
available from the corresponding author on reasonable request.
Authors' contributions
YM, YZ and MW conceived and designed the study. YH,
FC and JQ analysed and interpreted the data. MW and YM drafted the
manuscript. All authors have read and approved the final version of
the manuscript. YM and MW confirm the authenticity of all the raw
data.
Ethics approval and consent to
participate
Patients with IA and controls provided written
informed consent prior to using their blood samples in the present
study. The current study was approved by the Ethics Committee of
The First Affiliated Hospital of Henan University of Science and
Technology (approval no. HUST2034532; Luoyang, China).
Patient consent for publication
Not applicable.
Competing interests
The authors declare that they have no competing
interests.
References
|
1
|
Park HS, Jun SC, Han KH, Hong SB and Yu
JH: Diversity, application, and synthetic biology of industrially
important aspergillus fungi. Adv Appl Microbiol. 100:161–202.
2017.PubMed/NCBI View Article : Google Scholar
|
|
2
|
Becker KL, Ifrim DC, Quintin J, Netea MG
and van de Veerdonk FL: Antifungal innate immunity: Recognition and
inflammatory networks. Semin Immunopathol. 37:107–116.
2015.PubMed/NCBI View Article : Google Scholar
|
|
3
|
Takakura S: Zygomycosis. Nihon Rinsho.
66:2356–2361. 2008.PubMed/NCBI(In Japanese).
|
|
4
|
Cadena J, Thompson GR III and Patterson
TF: Invasive aspergillosis: Current strategies for diagnosis and
management. Infect Dis Clin North Am. 30:125–142. 2016.PubMed/NCBI View Article : Google Scholar
|
|
5
|
Cadena J, Thompson GR III and Patterson
TF: Aspergillosis: Epidemiology, diagnosis, and treatment. Infect
Dis Clin North Am. 35:415–434. 2021.PubMed/NCBI View Article : Google Scholar
|
|
6
|
Latge JP and Chamilos G: Aspergillus
fumigatus and aspergillosis in 2019. Clin Microbiol Rev.
33:e00140–18. 2019.PubMed/NCBI View Article : Google Scholar
|
|
7
|
Oren I and Goldstein N: Invasive pulmonary
aspergillosis. Curr Opin Pulm Med. 8:195–200. 2002.PubMed/NCBI View Article : Google Scholar
|
|
8
|
Darling BA and Milder EA: Invasive
aspergillosis. Pediatr Rev. 39:476–478. 2018.PubMed/NCBI View Article : Google Scholar
|
|
9
|
Verma N, Singh S, Syal A, Pradhan P and
Singh M and Singh M: Invasive aspergillosis is a critical
determinant of mortality in cirrhosis: A systematic review with
meta-analysis. Med Mycol. 59:1092–1100. 2021.PubMed/NCBI View Article : Google Scholar
|
|
10
|
Arvanitis M and Mylonakis E: Diagnosis of
invasive aspergillosis: Recent developments and ongoing challenges.
Eur J Clin Invest. 45:646–652. 2015.PubMed/NCBI View Article : Google Scholar
|
|
11
|
Dhesi Z, Herbst S and Armstrong-James D:
Transcript profiling of the murine immune response to invasive
aspergillosis. Methods Mol Biol. 845:435–444. 2012.PubMed/NCBI View Article : Google Scholar
|
|
12
|
Wang M, Zhang M, Qiu J, Liu C, Lou Y, Wang
T, Zhang Y and Mao Y: PU.1-CD23 signaling mediates pulmonary innate
immunity against Aspergillus fumigatus infection by driving
inflammatory response. BMC Immunol. 24(4)2023.PubMed/NCBI View Article : Google Scholar
|
|
13
|
Fliesser M, Morton CO, Bonin M, Ebel F,
Hünniger K, Kurzai O, Einsele H and Löffler J: Hypoxia-inducible
factor 1α modulates metabolic activity and cytokine release in
anti-Aspergillus fumigatus immune responses initiated by human
dendritic cells. Int J Med Microbiol. 305:865–873. 2015.PubMed/NCBI View Article : Google Scholar
|
|
14
|
Morris NL, Michael DN, Crotty KM, Chang SS
and Yeligar SM: Alcohol-Induced glycolytic shift in alveolar
macrophages is mediated by hypoxia-inducible factor-1 Alpha. Front
Immunol. 13(865492)2022.PubMed/NCBI View Article : Google Scholar
|
|
15
|
Dix A, Czakai K, Springer J, Fliesser M,
Bonin M, Guthke R, Schmitt AL, Einsele H, Linde J and Löffler J:
Genome-Wide expression profiling reveals S100B as biomarker for
invasive aspergillosis. Front Microbiol. 7(320)2016.PubMed/NCBI View Article : Google Scholar
|
|
16
|
Wang Y, Sun FZ, Lin W and Zhang SQ:
AC-PCoA: Adjustment for confounding factors using principal
coordinate analysis. PLoS Comput Biol. 18(e1010184)2022.PubMed/NCBI View Article : Google Scholar
|
|
17
|
Delbeke H, Casteels I and Joossens M: DNA
extraction protocol impacts ocular surface microbiome profile.
Front Microbiol. 14(1128917)2023.PubMed/NCBI View Article : Google Scholar
|
|
18
|
Zhan Z, Chen Y, Duan Y, Li L, Mew K, Hu P,
Ren H and Peng M: Identification of key genes, pathways and
potential therapeutic agents for liver fibrosis using an integrated
bioinformatics analysis. PeerJ. 7(e6645)2019.PubMed/NCBI View Article : Google Scholar
|
|
19
|
Haldermans P, Shkedy Z, Van Sanden S,
Burzykowski T and Aerts M: Using linear mixed models for
normalization of cDNA microarrays. Stat Appl Genet Mol Biol.
6(Article 19)2007.PubMed/NCBI View Article : Google Scholar
|
|
20
|
Ding J and Zhang Y: Analysis of key GO
terms and KEGG pathways associated with carcinogenic chemicals.
Comb Chem High Throughput Screen: Dec 18, 2017 (Epub ahead of
print).
|
|
21
|
Chen L, Zhang YH, Lu G, Huang T and Cai
YD: Analysis of cancer-related lncRNAs using gene ontology and KEGG
pathways. Artif Intell Med. 76:27–36. 2017.PubMed/NCBI View Article : Google Scholar
|
|
22
|
Dennis G Jr, Sherman BT, Hosack DA, Yang
J, Gao W, Lane HC and Lempicki RA: DAVID: Database for annotation,
visualization, and integrated discovery. Genome Biol.
4(P3)2003.PubMed/NCBI
|
|
23
|
Goutzelas Y, Kontou P, Mamuris Z, Bagos P
and Sarafidou T: Meta-analysis of gene expression data in adipose
tissue reveals new obesity associated genes. Gene.
818(146223)2022.PubMed/NCBI View Article : Google Scholar
|
|
24
|
Wallach T, Schellenberg K, Maier B,
Kalathur RK, Porras P, Wanker EE, Futschik ME and Kramer A: Dynamic
circadian protein-protein interaction networks predict temporal
organization of cellular functions. PLoS Genet.
9(e1003398)2013.PubMed/NCBI View Article : Google Scholar
|
|
25
|
Szklarczyk D, Gable AL, Nastou KC, Lyon D,
Kirsch R, Pyysalo S, Doncheva NT, Legeay M, Fang T, Bork P, et al:
The STRING database in 2021: Customizable protein-protein networks,
and functional characterization of user-uploaded gene/measurement
sets. Nucleic Acids Res. 49(D1):D605–D612. 2021.PubMed/NCBI View Article : Google Scholar
|
|
26
|
Liu J, Zhou S, Li S, Jiang Y, Wan Y, Ma X
and Cheng W: Eleven genes associated with progression and prognosis
of endometrial cancer (EC) identified by comprehensive
bioinformatics analysis. Cancer Cell Int. 19(136)2019.PubMed/NCBI View Article : Google Scholar
|
|
27
|
Chen Y, Li H, Lai L, Feng Q and Shen J:
Identification of common differentially expressed genes and
potential therapeutic targets in ulcerative colitis and rheumatoid
arthritis. Front Genet. 11(572194)2020.PubMed/NCBI View Article : Google Scholar
|
|
28
|
Livak KJ and Schmittgen TD: Analysis of
relative gene expression data using real-time quantitative PCR and
the 2(-Delta Delta C(T)) method. Methods. 25:402–408.
2001.PubMed/NCBI View Article : Google Scholar
|
|
29
|
Johnson G, Ferrini A, Dolan SK, Nolan T,
Agrawal S, Doyle S and Bustin SA: Biomarkers for invasive
aspergillosis: The challenges continue. Biomark Med. 8:429–451.
2014.PubMed/NCBI View Article : Google Scholar
|
|
30
|
Margalit A and Kavanagh K: The innate
immune response to aspergillus fumigatus at the alveolar surface.
FEMS Microbiol Rev. 39:670–687. 2015.PubMed/NCBI View Article : Google Scholar
|
|
31
|
Seifert M, Nairz M, Schroll A, Schrettl M,
Haas H and Weiss G: Effects of the aspergillus fumigatus
siderophore systems on the regulation of macrophage immune effector
pathways and iron homeostasis. Immunobiology. 213:767–778.
2008.PubMed/NCBI View Article : Google Scholar
|
|
32
|
Heinekamp T, Schmidt H, Lapp K, Pahtz V,
Shopova I, Koster-Eiserfunke N, Kruger T, Kniemeyer O and Brakhage
AA: Interference of aspergillus fumigatus with the immune response.
Semin Immunopathol. 37:141–152. 2015.PubMed/NCBI View Article : Google Scholar
|
|
33
|
Tan HY, Wang N, Zhang C, Chan YT, Yuen MF
and Feng Y: Lysyl Oxidase-Like 4 Fosters an immunosuppressive
microenvironment during hepatocarcinogenesis. Hepatology.
73:2326–2341. 2021.PubMed/NCBI View Article : Google Scholar
|
|
34
|
Fecher RA, Horwath MC, Friedrich D, Rupp J
and Deepe GS Jr: Inverse correlation between IL-10 and HIF-1alpha
in macrophages infected with histoplasma capsulatum. J Immunol.
197:565–579. 2016.PubMed/NCBI View Article : Google Scholar
|
|
35
|
Goncalves SM, Duarte-Oliveira C, Campos
CF, Aimanianda V, Ter Horst R, Leite L, Mercier T, Pereira P,
Fernandez-Garcia M, Antunes D, et al: Phagosomal removal of fungal
melanin reprograms macrophage metabolism to promote antifungal
immunity. Nat Commun. 11(2282)2020.PubMed/NCBI View Article : Google Scholar
|
|
36
|
Cheng Y, Feng Y, Xia Z, Li X and Rong J:
ω-Alkynyl arachidonic acid promotes anti-inflammatory macrophage M2
polarization against acute myocardial infarction via regulating the
cross-talk between PKM2, HIF-1α and iNOS. Biochim Biophys Acta Mol
Cell Biol Lipids. 1862:1595–1605. 2017.PubMed/NCBI View Article : Google Scholar
|