Introduction
Ewing sarcoma is a rare soft or bone tissue tumor mainly occurring in the second decade of life and appears to be a slightly heterogeneous group of cancers mainly composed of a fusion of EWSR1 with a variety of ETS transcription factors at the molecular level (1). The specific cells of origin leading to Ewing sarcoma tumors in a true in vivo situation remain undetermined, but there is certain established evidence that Ewing sarcoma arises from mesodermal structures or respectively from neural crest-derived mesenchymal stem cells (MSCs) (2-4). As in numerous cancer entities, studies indicate a different incidence in different human populations (5). For instance, patients with a European ancestry exhibit a 9-fold higher risk compared to African Americans and Asian/Pacific Islanders (0.155 in the European region vs. 0.017 in the Asian/Pacific region and people of African ancestry). In spite of certain progress in the treatment of Ewing sarcoma in recent years, the overall survival rate is between 61 and 74% for patients with a localized disease with deviations in both directions concerning body localization and tumor progression (6). Several therapeutic concepts have been developed up to now (7) and a comprehensive overview of the 'genomic, epigenomic and transcriptomic landscapes' was presented by Sand et al (8).
In contrast to the clinical sphere, where considerable progress has been made in the description, categorization and treatment of Ewing sarcoma, much less basic knowledge has been generated concerning the systems biology of Ewing sarcoma and its progression from the cell of origin to a life-threatening tumor. In 2009, Suvà et al (9) was able to isolate a subpopulation of CD133+ Ewing cells and demonstrate their cancer stem cell (CSC) and MSC properties. Further efforts by Yang et al (10) to isolate Ewing CSC inspired our group to establish and characterize, in an extended way, a similar side population (SP) of Ewing sarcoma cells of the EWSR1-ERG type [cf. fusion gene types (11)]. The SP was comprehensively characterized in several assays, which highlighted their stem- ness character. In conjunction, a differential gene expression (DE) study was performed by our group. The resulting pattern, with a high content of oncogenes, pointed to a plausible alteration in the pathways of AP-1 complex, APC/c-CDC20 and HDAC9, partly explaining the tumor mechanisms in this fully developed sarcoma (12). The biology of the CSCs and their interplay with the main (non-CSC) Ewing cancer population appear to be complex [e.g., (13)], but the molecular patterns highlighted in a previous study by our group indicated rather small but distinct molecular differences between the CSC and non-CSC populations (12).
Describing a DE pattern between an Ewing sarcoma CSC SP and bone marrow-derived MSCs is only one molecular perspective in the complex systems biology of the cell. Another important aspect concerns splice variants, whose contribution to this altered network situation has not been conclusively explored so far, particularly for EWSR1-ERG based Ewing sarcomas.
It is generally accepted that alternative splicing, here in the sense of differential splicing (DS) events have an enormous role in the regulatory response spectrum (14,15) the cellular system has developed, and is essential to cope with a multitude of environmental challenges, and to synchronize multicellular behavior. A deep insight into alternative splicing in cancer is given by Oltean and Bates (16).
Thus, analyzing the splice variants of a whole transcriptome will definitely provide regulatory and response information for the whole transcriptome, which may otherwise remain more limited. For Ewing sarcoma, this information has, to date, been patchy. Patócs et al (17) looked at the breakpoint variants of the Ewing fusion gene itself and observed 9 different variants and even multiple variants in the same tumor sample, also indicating the existence of different response activity levels of one and the same fusion gene. A study by Sand et al (18) focused on hub genes with clinical relevance, such as CXCR4. Downstream target effects of the fusion transcripts on the alternative splicing of further genes such as ARID1A were observed by Selvanathan et al (19). However, up to now, further high-throughput studies adding whole-genome DS information to existing whole-genome DE information are lacking for Ewing sarcoma with the EWSR1-ERG fusion gene.
Studies on alternative splicing may be categorized into those that are mainly interested in screening and mapping the diversity of observable splice variants to form a biological network and those focusing on the splicing process itself (20), although both perspectives intermingle at the network level. The focus of the present study is on the first type.
Consequently, the main objective of the present study was to define the DS information on a whole-transcriptome basis using the CADO-ES1 (CADO) model cell line harboring the fusion gene EWSR1-ERG, a CSC SP thereof, bone marrow-derived MSC primary cell cultures as putative progenitor cells of Ewing sarcoma and further controls. Comparison between MSCs and the SP should enable the detection of similar and dissimilar (stem) cell features. To make the primary splice detection step more robust, rMATS (21) was chosen, a DS tool modeling Bayesian statistics around a differential approach, in contrast to the majority of splice detection tools, which are working in a non-differential way. The performance of rMATS has been convincingly demonstrated in a comparative study from 2017 (22) and also in a newer study from 2019 (23). The downstream analysis of the DS data in the present study focused on, inter alia (i.a.), creating specific DS gene sets, characterizing the expression profiles of wild-type fusion gene partners and annotating the major biological pathways involved in this multi-group design. Finally, these results were compared with established knowledge and an existing DE analysis of the same dataset from 2018 (12) to create an integrated view.
Materials and methods
Samples
Using the Ewing sarcoma cell line CADO-ES1 (CADO), which was established from the malignant pleural effusion of a 19-year-old Japanese female in 1991 (24), the CSC features of an SP were analyzed in comparison to the main Ewing sarcoma population (NSP) and MSCs. The SP was established by fluorescence-activated cell sorting of the cells and extensively characterized by several assays in a previous publication by our group where additional details are provided (12). Furthermore, 8 different human samples with several biological replicates were considered for the present study. A total of 4 samples were based on the CADO cell line (DSMZ-German Collection of Microorganisms and Cell Cultures) carrying the EWSR1-ERG fusion gene: i) SP, three biological replicates; ii) NSP including 1-3% SP cells, three biological replicates; iii) no stain (and no sort) control (nst), three biological replicates; iv) not sorted (but stained) control (nso), three biological replicates; v) primary cell culture of bone marrow-derived MSCs (from two females and two males; age, six to 29 years; bone marrow classified as normal from Ewing patients; March 2017; Department of Pediatric Hematology and Oncology, University Hospital Münster, Münster, Germany), four biological replicates [protocol (25), assessment according to (26)]; vi) two primary Ewing cell cultures (ES): a) EWSR1-ERG (ES1) and b) EWSR1-FLI1 (ES2), with one sample each [DC-ES-6 and -15, respectively (25,27); renamed as MS-EwS-16/-15 (28); two males; age, 12 and 22 years; Ewing sarcoma; March 2017; Department of Pediatric Hematology and Oncology, University Hospital Münster, Münster, Germany]. As a further off-target control, human skin fibroblasts (hFIB) were utilized with four biological replicates [protocol (29), source (30); all four donors are male; age, one to two years; foreskin fibroblasts; March 2017; Centre of Reproductive Medicine and Andrology, University Hospital Münster, Münster, Germany]. Nso means no fluorescence-activated cell sorting of the cells, while nst means that the Hoechst dye to sort the cells was not added to the cells and they were not sorted at all. Both mentioned procedures cause stress for the cells of interest and this may produce false-positive/false-negative DS genes. The respective controls nst and nso should intercept those misleading results. Experiment-related details are mentioned below in the section on experimental design. All patients were included into the multicenter E.U.R.O Ewing 99 (EE99; no. NCT00020566, 12/02/1999) and Ewing 2008 (no. NCT00987636, 01/10/2009) trials.
Sequencing and raw data processing
The dataset was created in-house for a DE study focusing on CSC features of a distinct Ewing sarcoma SP of CADO cells and the data generation was described in detail by Hotfilder et al (12). In brief, for sequencing, 0.5-10×106 cells/ml were used depending on the approach and the applied downstream procedure. The RNA library preparation for the SOLiD5500×l technology was according to a paired-end design. The read length was 75/35 nucleotides, trimmed to 35/35 to retain a high quality for translating color-space into base-space data. The conversion tool is available online in two different flavors (http://complex-systems.uni-muenster.de/tools.html). Approximately 30 million high-quality reads per sample were remaining after preprocessing for the downstream analysis, which denotes an average transcriptome coverage of 35×. The entire dataset E-MTAB-6067 is available online at the EMBL-EBI data repository (https://www.ebi.ac.uk/arrayex-press/experiments/E-MTAB-6067/). An overview of the full data workflow is provided in Fig. 1.
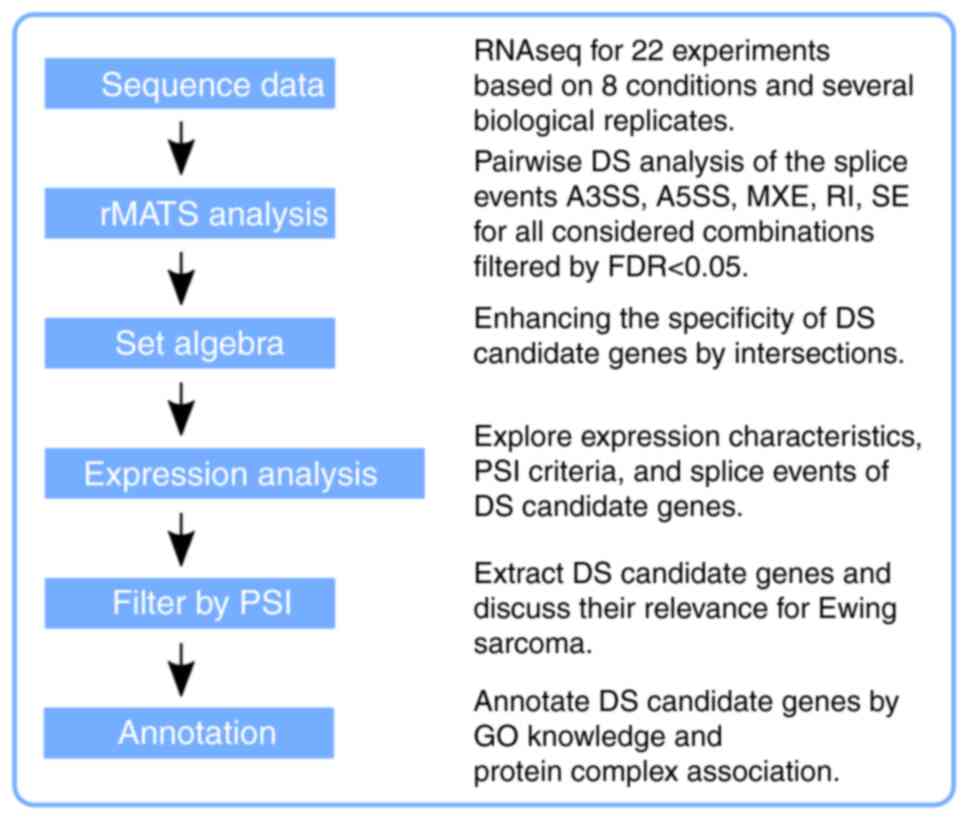 |
Figure 1
Flow chart providing an overview of what type of data processing was considered. The raw reads were aligned to the human genome (GRCh38) and the resulting BAM files were used for the rMATS analysis. Details of the sample combinations are presented in Fig. 7. Every rMATS result table is based on five basic splice events, either considering splice junction counts only or splice junction and adjacent exon counts. Further processing was performed on the R platform and the R workspace is provided as supplementary information. GO, gene ontology; FDR, false discovery rate; RNAseq, RNA sequencing; rMATS, program for splice variant analysis; DS, differential splicing; PSI, percentage spliced in-DS quality criterion; MXE, mutually exclusive exons; SE, skipped exon; RI, retained intron; A3SS or A5SS, alternative 3′ or 5′ splice site.
|
EWSR1-ERG fusion gene and wild-type genes
The algorithm of rMATS does not allow for the direct identification of gene fusions; therefore, STAR-Fusion (31) was used to confirm the EWSR1-ERG fusion gene in the CADO samples SP, NSP, nst and nso. The results suggested that the fusion gene was detectable in numerous but not all samples (Table SI-1).
The influence of the presence of the fusion gene on the behavior of the wild-type genes was then examined. The basic expression levels of EWSR1 and further ETS fusion partners and FUS were high throughout and exhibited distinct DE profiles (Fig. S1). The DE profiles support the clinical sample classification and, consequently, the validity of the sample design of the present study. It is worthwhile to observe how the wild-type EWSR1, FUS and ETS genes are influenced by EWSR1-ERG in the CADO cells. Of note, ERG is downregulated in ES2 (EWSR1-FLI1 fusion) but not in ES1 (EWSR1-ERG fusion) samples, but FLI1 expression is not differentially influenced by the fusion gene or the wild-type.
In addition, the dataset was examined for the normalized expression of certain further genes relevant to Ewing sarcoma. Suvà et al (9) mentioned certain markers in the context of Ewing CSC, while Amaral et al (26) analyzed certain markers which are able to segregate Ewing and MSC cells. It appears that in general, these markers also cluster our dataset according to their described properties (Fig. S2A) and reproduce the known origin of our cell types. Another important gene, POLR2A, the RNA polymerase II responsible for transcription and involved in RNA splicing, was reported to interact with EWSR1 (32). The expression profiles of POLR2A together with its interaction partners according to the Search Tool for the Retrieval of Interacting Genes and proteins (STRING) database (https://string-db.org) are presented in Fig. S2B. This gene group has its own coherent profile, which differs from that of the EWSR1-ETS group, but also arranges the samples according to their respective cell types.
Detection of DS by rMATS
To search for alternative splice events between the samples of the experimental design, rMATS was applied (21,33). It was selected as it is still maintained, is able to handle replicated RNA samples (which not all tools support), has a reasonable statistical concept suitable for any technology and preprocessing pipeline, may be limited to known splice variants and is one of the few which is able to detect alternative splicing between two conditions (22). rMATS version 3.2.5 and 4.1.0 with TopHat-aligned BAM files were used. The applied parameter settings were as follows: Paired, read length 35 and anchor length 8. The reference genome for the analysis was Homo sapiens GeneCode version 35 (GRCh38.p13 https://www.gencodegenes.org/human/; gtf format). rMATS was utilized in a fixed mode to detect 5 known and annotated splice events: i) Alternative 3′ splice site (A3SS); ii) alternative 5′ splice site (A5SS); iii) mutually exclusive exons (MXE); iv) retained intron (RI); and v) skipped exon (SE) (Fig. S3).
The five rMATS result tables were provided in two versions. One which evaluates splicing variants with only those reads that span splice junctions (JC) and the other one includes reads that span splice junctions and additionally those reads placed fully on the adjacent, alternatively spliced exon region (reads on target) (JCEC) http://rnaseq-mats.sourceforge.net/). All result sets were generated by the JC approach as well as with the JCEC approach to study the splice variant frequencies across these two approaches.
The raw rMATS results were filtered using a false discovery rate (FDR) of 0.05 as the cutoff. Table I presents the total number of significant genes rMATS generated for the JC results (for JCEC see Table SI-2). All the rMATS result sets represent a DS analysis between two selected cell populations and are therefore inherently differential sets.
 |
Table I
DS numbers per splice event from all rMATS analyses.a
|
Table I
DS numbers per splice event from all rMATS analyses.a
| Label |
rMATS sample 1 |
rMATS sample 2 |
Splice events
|
Sum (total n=8,564) |
| A3SS |
A5SS |
MXE |
RI |
SE |
| C1 |
NSP 1-3 |
nst 1-3 |
46 |
28 |
6 |
69 |
201 |
350 |
| C2 |
NSP 1-3 |
nso 1-3 |
37 |
27 |
7 |
36 |
152 |
259 |
| B |
SP 1-3 |
NSP 1-3 |
33 |
16 |
10 |
33 |
93 |
185 |
| D |
SP 1-3 |
MSC 1-4 |
82 |
59 |
61 |
169 |
428 |
799 |
| B2 |
NSP 1-3 |
MSC 1-4 |
97 |
86 |
61 |
238 |
536 |
1,018 |
| G1 |
NSP 1-3 |
ES 1 |
76 |
48 |
147 |
121 |
417 |
809 |
| G2 |
NSP 1-3 |
ES 2 |
172 |
94 |
164 |
216 |
731 |
1,377 |
| H1 |
SP 1-3 |
ES 1 |
93 |
49 |
155 |
118 |
376 |
791 |
| H2 |
SP 1-3 |
ES 2 |
128 |
65 |
155 |
189 |
548 |
1,085 |
| E1 |
SP 1-3 |
hFIB 1-4 |
58 |
52 |
61 |
128 |
313 |
612 |
| E2 |
NSP 1-3 |
hFIB 1-4 |
87 |
69 |
64 |
176 |
441 |
837 |
| E3 |
MSC 1-3 |
hFIB 1-4 |
58 |
34 |
40 |
53 |
257 |
442 |
| Fraction, % |
|
|
11 |
7 |
11 |
18 |
52 |
100 |
The preference for the JC approach was based on the following reasons. JC is more stringent and handles only junctions of well-established splice events, while the 'reads on target' dilute the precision of the 'junction read'-defined splice variants, by presumably interfering with further non- annotated splice events or splice sites. This becomes apparent by analyzing the Shashimi plots in more detail. The Bayesian approach of rMATS (33) has high sensitivity and generates numerous results. Looking at the quality of the results, there appears to be a tendency to create false-positives concerning the categorization but also to accept too many low-read count results. In addition, because bulk sequencing data are used in the present study, the averaging of all cells may result in a loss of gene candidates with low expression.
The biological replicates of the samples exhibit a certain variance. To obtain an estimate for the robustness of the results, a variance analysis between SP and NSP replicate combinations was implemented. As indicated in Table SI-3 (yellow and grey boxes), there was a certain variation between the replicate combinations. However, it was not possible to identify a good rationale for outlier exclusion. Therefore, it was decided not to eliminate replicates and proceeded with all of them.
To improve the impact of the rMATS results, the score 'percent spliced-in' (PSI) was applied to certain intermediate results and the final intersections to filter for relevant splice variants. The standard formula inclusion reads divided by the sum of inclusion and exclusion reads was used. The thresholds for sample group one and sample group two are a PSI in the range of 0.1-0.9 for each sample and a difference between the samples of 0.5-0.9. With these stringent criteria, the JC approach yielded 305 PSI-stable DS events, while with the JCEC approach, 787 PSI-stable DS events were obtained. All of the result tables of the rMATS analyses are available in Information S4 (FDR <0.05).
Downstream processing of rMATS results in R
The study design with the different sample combinations and the used acronyms are presented in Fig. 2. The DS approaches of rMATS denoted by connector lines were further refined by set arithmetic procedures applied to generate more specific subsets of DS genes (e.g., B -> BC -> BC′).
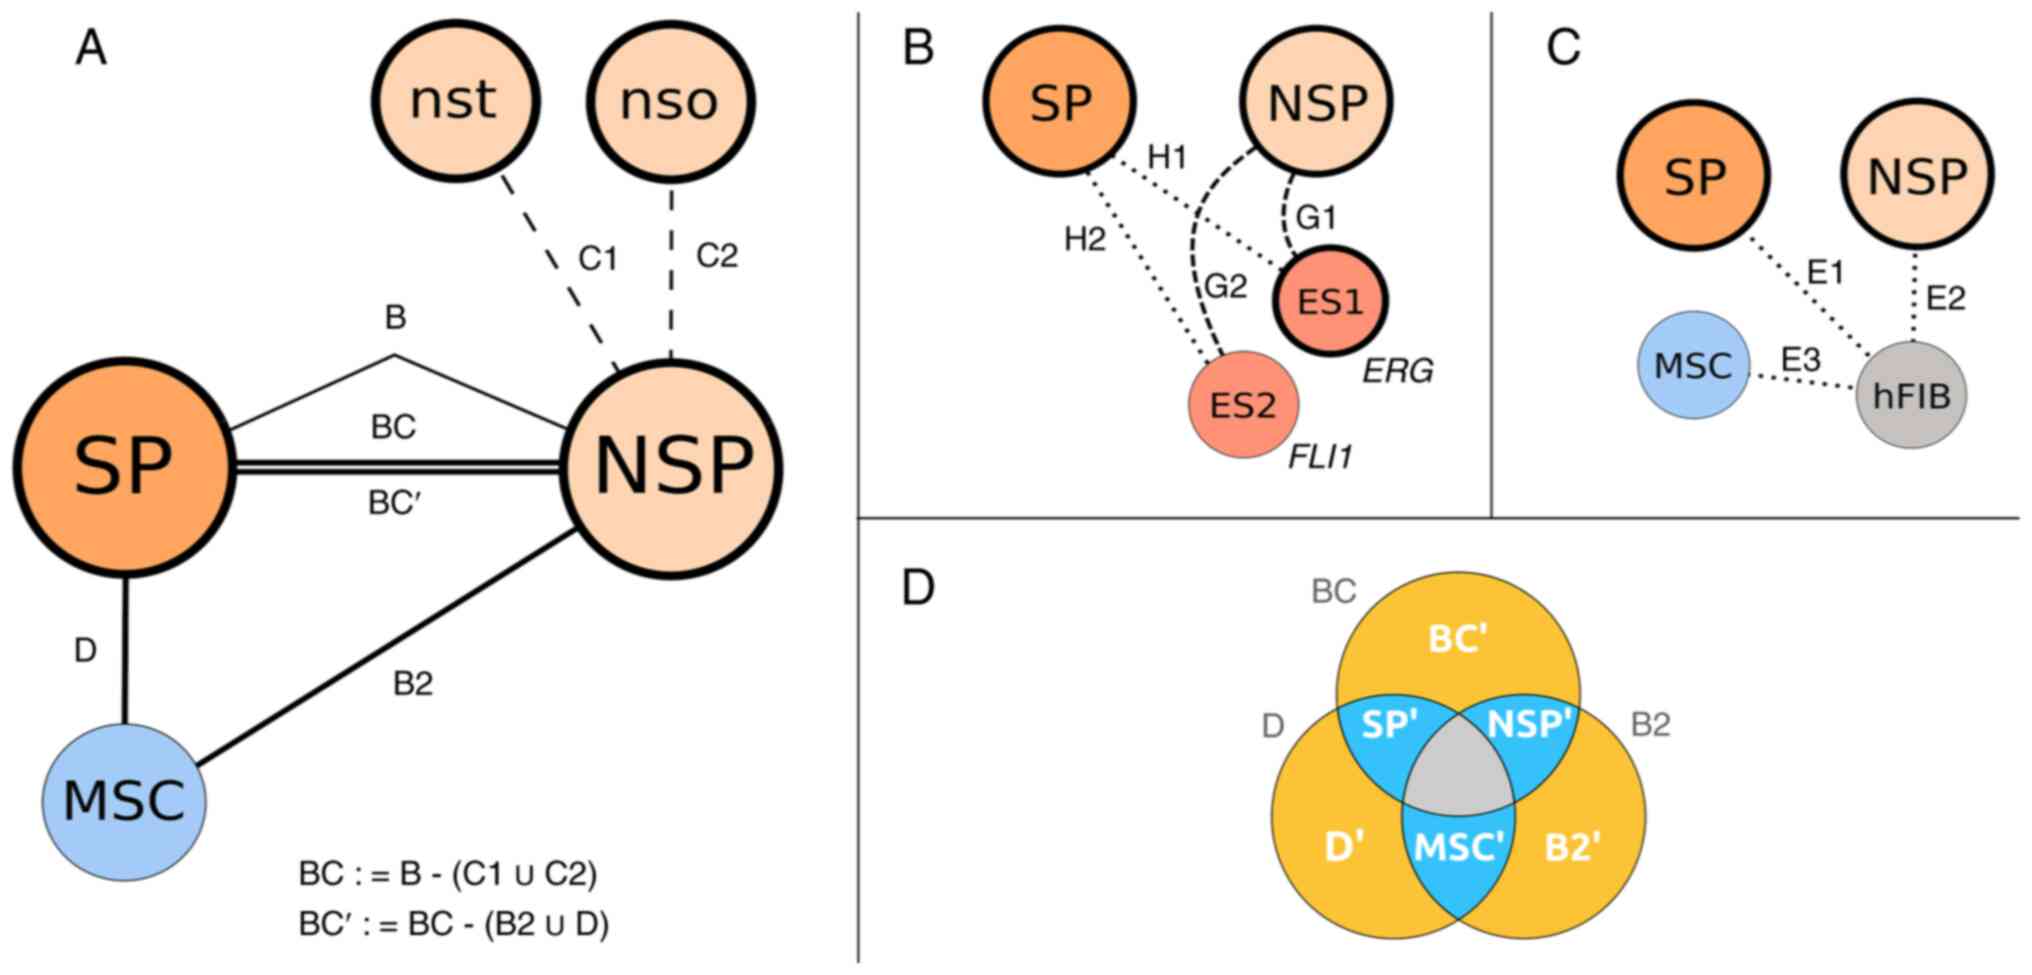 |
Figure 2
Study design. The base cell entities are represented by circles with the respective acronyms. Thick borders around the circles indicate Ewing cell samples with the fusion gene EWSR1-ERG. Colors: CSC SP (orange); main sarcoma population cells (NSP, light orange); MSC (blue). ES1 and ES2 (red) are further Ewing primary cell cultures and hFIB (grey) are an off-target control. The rMATS analyses are denoted by acronyms, e.g., B or C1, and displayed along the connector lines. (A) Analyses presented define the specific differences (BC′) of the Ewing side population with CSC properties (SP) to the main sarcoma cell population (NSP) and to a putative cell of origin (MSC) applying internal controls (nst, nso). (B) Analyses H1,2 and G1,2 define additional SP/NSP differences to two other primary Ewing cell cultures used to form generalized subsets BC′∩ H1,2 and NSP′∩G1,2. (C) Analyses E1-E3 with normal human fibroblasts evaluate the context of SP/NSP differences established in panel A. (D) The differential splice variant sets specific for the three core entities are created by intersections of BC, D and B2 (full circles, black IDs) leading to the partial sets denoted by SP′, NSP′ and MSC′ (blue parts with white labels, bidirectional). The remaining yellow parts (BC′, D′ and B2′, white labels) are indicating differential splicing variants specific solely for the respective comparison. The central intersection (grey) is not considered at all and sparsely populated (JC:4, JCEC:30). SP, side population; CSC, cancer stem cell; NSP, main Ewing population; nso and nst, controls of the main Ewing population; MSC, bone marrow-derived mesenchymal stem cells; ES1 and ES2, further Ewing cell cultures; hFIB, human skin fibroblasts; ∩, intersection operator; ∪, union operator.
|
Due to the high number of raw data tables, the mathematical software platform R (version 3.4.4 and 4.0.3) was used to perform the evaluation, certain tests and also the Gene Ontology (GO) analysis. The rMATS tables were imported into R. The 'gene symbol' column in conjunction with the 'exon start' column indicates that there are certain genes which possess more than one splice variant. For these cases, a new column joining gene name and physical position was introduced in an additional column named IDnew to be able to distinguish between distinct splice variants. The drawback is that not all analyses may be performed easily with IDnew, such as the GO analysis. To evaluate the suspected error by using only gene names and not the more precise IDnew identifier, all set sizes were analyzed based on gene symbol vs. those based on IDnew. The difference in numbers is going down for the very distinct and filtered sets such as BC′. The difference between gene symbol and IDnew is reasonably low and varying for JC from 3 to 8% (Table SI-4). The GO annotation was run with the gene symbols.
The CADO control groups nso and nst may contain products of potential splice effects, which may occur due to staining and cell sorting procedures. Therefore, splice effects specific for nst and nso were removed. The B set corrected by C1 and C2 sets was termed BC, created by B-(C1∪C2) [∪, union operator]. Table II presents the count of genes prior to and after the correction.
|
Table II
Adjusted SP-NSP differential set BC.a
|
Table II
Adjusted SP-NSP differential set BC.a
| Label |
Procedure |
Splice events
|
Sum |
| A3SS |
A5SS |
MXE |
RI |
SE |
| B |
None |
33 |
16 |
10 |
33 |
93 |
185 |
| BC |
B-(C1∪C2) |
15 |
7 |
7 |
20 |
48 |
97 |
The BC, B2 and D differential sets build an overlapping triple, so that certain genes or their respective splice variants are not solely part of only one rMATS differential set but further rMATS differential sets (Fig. 2D). Table III displays the number of alternatively spliced genes specific for the biological entities, specifically discriminating the biological entities (for JCEC see Table SI-5-1). An overview and work- flow of all set theoretical procedures are provided in Fig. S4.
|
Table III
Cell type and differential-specific differential splicing count numbers.a
|
Table III
Cell type and differential-specific differential splicing count numbers.a
| Label |
Procedure |
Splice events
|
Sum |
| A3SS |
A5SS |
MXE |
RI |
SE |
| SP′ |
B2-(BC∩D) |
3 |
1 |
1 |
5 |
21 |
31 |
| NSP′ |
D -(BC∩B2) |
3 |
2 |
2 |
6 |
11 |
24 |
| MSC′ |
BC-(D∩B2) |
24 |
29 |
21 |
77 |
177 |
328 |
| BC′[SP-NSP] |
BC-(B2∪D) |
8 |
4 |
4 |
6 |
16 |
38 |
| B2′[NSP-MSC] |
B2-(BC∪D) |
60 |
53 |
33 |
141 |
319 |
606 |
| D′[SP-MSC] |
D-(BC∪B2) |
49 |
28 |
36 |
76 |
203 |
392 |
Important for a specific downstream analysis is that all subsets are disjunct as far as possible, so that crosstalk between sets is minimized. There is an exclusive specificity for the genes included in the respective subsets. Conceptually, all the interlinked differential situations in the tripartite, as denoted in Fig. 2A, may be discriminated precisely and therefore, this procedure improves the specificity of the single result sets.
As an additional internal control to obtain an estimate for strength of the C1/C2 correction, the difference of the specific set BC′ from the specific set of B′ (both without the proportions of B2 and D) was determined. The result of the C1/C2 correction is reasonable and yielded a 40% smaller set of BC′ compared with B′, and BC′ is a 100% subset of B′. Thus, the expected trends in this set theoretical approach are consistent (Table SI-5-2). Comparison to the further Ewing cell cultures ES1 and ES2 is adding more relevance to the basic DS sets and enables the discrimination of EWSR1-ERG and -FLI1 dependencies of DS genes (Fig. 2B).
As a final control for specificity, the SP, NSP and MSC populations were compared with an unrelated cell type, hFIBs resulting in sets E1/E2/E3 (Fig. 2C). Sets E1-E3 were further intersected with adjacent differential approaches (E1 with D, BC; E2 with BC, B2; E3 with B2, D). In all situations a certain overlap could be observed, although there were also distinct differences (Table SI-6). Considering the huge number of basic biological functions all human cells share, this overlap is expected. On the other hand, the clear differences exemplify these cells as another entity and cross-validate the trends described above.
These primary DS (intersection) results are mechanistically characterized by analyzing the DS genes at the GO level and membership in protein complexes. The GO analysis of DS genes, the association of DS genes with known protein complexes and the sampling procedures to validate the sparse GO term overlap are comprehensively described in Data S1.
Results
Roughly uniform genomic distribution of the five basic splice events
The DS events between the samples of the experimental design (Tables I-III and SI, Fig. 3) were detected by rMATS. The program was utilized to search only for the following known and well-established splice events: i) A3SS; ii) A5SS; iii) MXE; iv) RI; and v) SE. The overall sum of classified splice variants is 8,564 on an FDR level of 0.05.
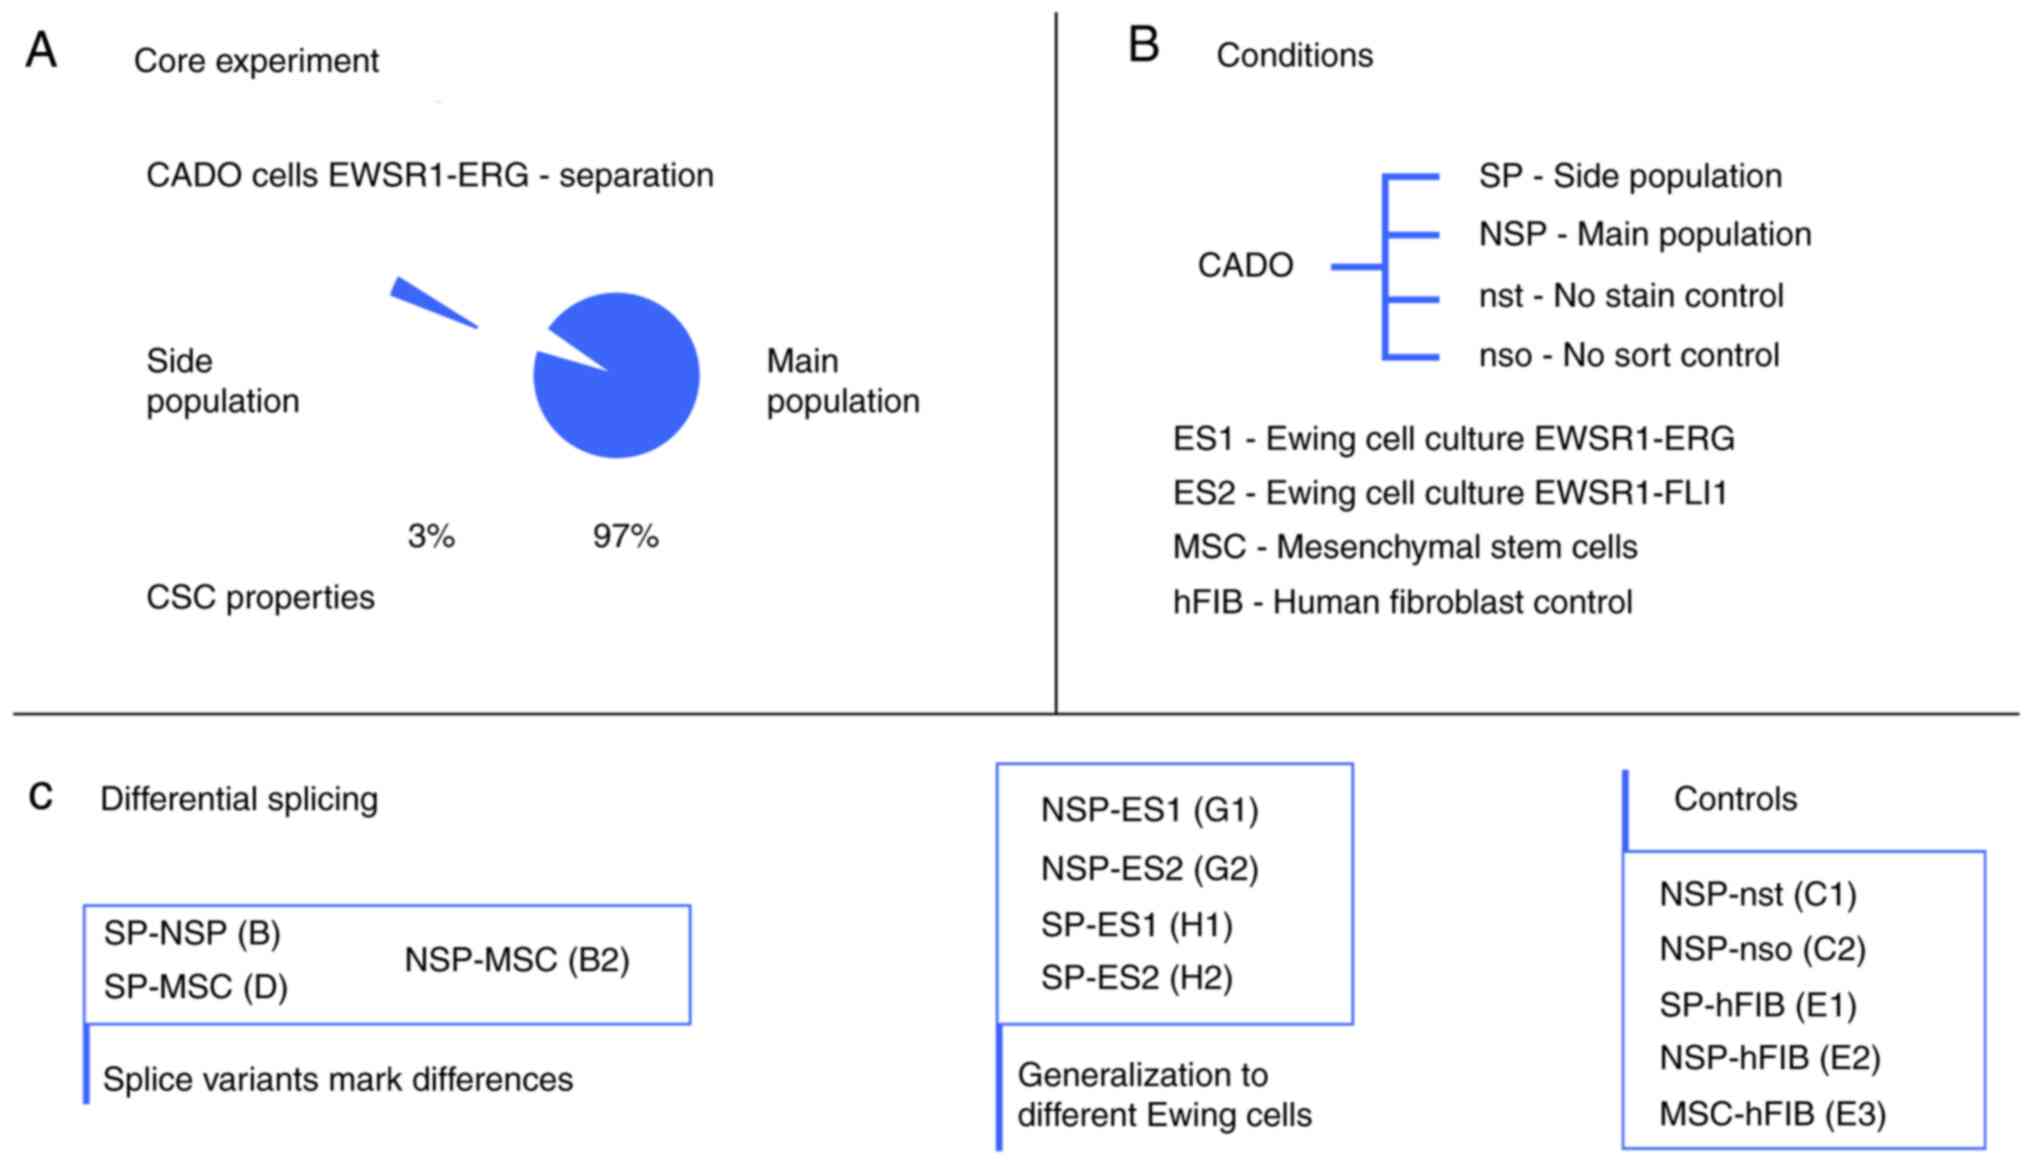 |
Figure 3
Samples and conditions. (A) Goal to elucidate whether the characterized SP with CSC features has alternative splicing. (B) Conditions of the experimental design to reveal the difference in alternative splicing of the SP cells to further cell entities. (C) The performed independent differential rMATS experiments. Further details are provided in the Methods section. SP, side population; CSC, cancer stem cell; NSP, main Ewing population; nso and nst, controls of the main Ewing population; MSC, bone marrow derived mesenchymal stem cell; ES1 and ES2, further Ewing cell cultures; hFIB, human skin fibroblasts.
|
In several DE studies, an uneven whole-genome distribution of DE genes was observed [e.g., (34)]. This is frequently explained by coherently working pathway genes and regulatory neighborhoods or by genomic alterations. To the best of our knowledge, it is unclear whether DS genes in CADO may also exhibit such an uneven genomic pattern.
The number of primary rMATS results was reduced for the selection of hard candidates by applying the score PSI as described in the Methods to 305 (PSI 0.1-0.9 and PSI difference 0.5-0.9). The distribution of all primary or the remaining 305 splice variants on the genome did not reveal any clear preferences for CADO and ES cell samples. Slight accumulations on one or the other chromosomes did not distract from the overall picture of a more uniform distribution. The whole-genome maps of the PSI stable DS variants of the JC and JCEC approach for B, G1, G2, H1 and H2 are provided in supplementary Information S1.
Pronounced segregation of GO terms by splice events
The primary rMATS result genes are bound to certain splice events. The genes of a distinct splice event are bound to their concrete GO terms. All the unique GO terms of each of the five basic splice events used, A3SS, A5SS, MXE, RI and SE, of one sample only exhibit a limited overlap between each other. This is presented in an example for three pairwise splice event comparisons of the CSC SP′ set (Table IV, Fig. 4). The definition of SP′ is provided in the Methods section. Similar albeit slightly less segregated clusters are observed when two different entities are compared, e.g., an SP′ intersection with an MSC′ intersection (Information S2). In addition, the JCEC approach tended toward a somewhat weaker separation of splice variants in comparison to the JC approach. On closer inspection, there were certain exceptions, but the segregation trend was visible throughout numerous comparisons (Information S2).
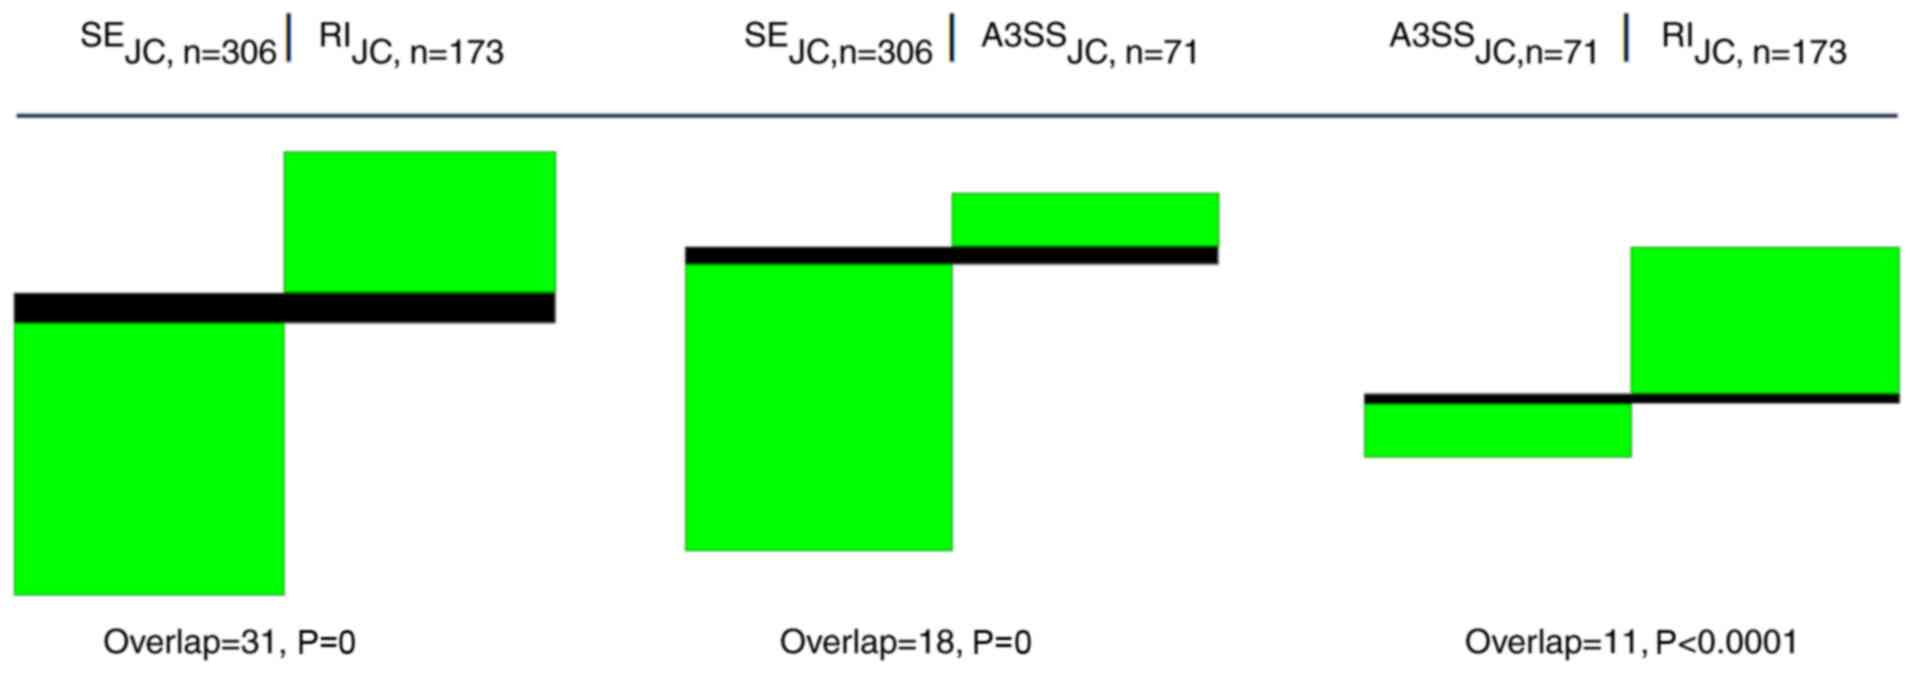 |
Figure 4
Splice events are segregating GO terms. Pairwise comparisons of GO terms for three basic splice events occurring in the intersection of SP′ indicate pronounced segregation between different splice events (JC approach). Note the very small overlap for SE vs. RI, SE vs. A3SS and A3SS vs. RI and the low sampling P-values associated with each approach. Columns refer to the different splice events as indicated by acronyms SE, A3SS and RI. 'n' denotes the number of GO terms found for each splice event. Black areas represent GO terms existing in both types, while green areas are unique for each group. White color (space) indicates the absence of the particular GO term. GO, gene ontology; SP′, a unique DS subset of the side population; JC, splice junction counts; RI, retained intron; SE, skipped exon; A3SS, alternative 3′ splice site.
|
|
Table IV
DS gene pattern for CSC SP and main population.
|
Table IV
DS gene pattern for CSC SP and main population.
| Label |
Unique gene names |
Overlap |
| BC′ |
|
|
| ∩H1 |
ATP13A3 (194412198), HLCS (36947332), OGT (71536177), POC5 (75707736), TCAIM (44367455), TRA2A (23521706) |
EPB41 (29058588), SNHG17 (38422091) |
| ∩H2 |
KMO (241590011), SNHG1 (62851987), STRADA (63728333), TRDMT1 (17161482) |
|
| NSP′ |
|
|
| ∩G1 |
POLDIP3 (42601969), RMDN1 (86472348), SMARCB1 (23791755) |
ACADVL (7223812), LMO7 (75835151), NOP58 (202278211), TM7SF3 (27003235), |
| ∩G2 |
AC022826.2 (73825146), SELENBP1 (151369003), ZFAND1 (81721226), ZNF283 (43837052) |
TSPAN3 (77055788) |
The validity of the results was determined by several sampling approaches. The global perspective indicates that the probability to sample the combination of GO terms in the joined five splice events of one sample is extremely low (r1; Data S1, Table SII-1). A permutation approach on the unique set of GO terms of the five splice events of one sample indicated that Fig. 4 is stable on a reasonably high significance level (r2; Data S1, Table SII-2). The generalized sampling procedure at the gene set level of the five splice events (r3; Data S1) as a further analysis on how the gene combinations impact the results indicates that the gene sets themselves define the segregation and therefore form slightly different GO term compositions (Table SII-3).
Taken together, these unexpectedly clear results indicate a possible path towards functional subspecialization for different splice variants, and on the other hand, the clear segregation observed supports the robustness of the established GO term system.
Typical marker genes are not DS
There are numerous conventional DE markers defined for the purpose of diagnostics or research in the field of Ewing sarcoma. It is worth seeing if those marker genes may have an overlap with DS genes. Searching the differential rMATS comparisons for well-defined EWSR1-ETS markers, including PAX7 (35) or RUNX2 (36), or MSC markers such as GATA6, TRPC4, FLG or TGM2 (37), or SCA1, CD29, CD44 and CD90 (38), revealed that none of these markers appear to be DS. Consequently, DS of typical markers appears to be less relevant for the regulation of the SP-NSP transitions or any other analyzed comparison and their regulatory differences.
Creation of DS subsets with higher specificity
The major objective of the present study was to determine if the characterized CSC SP of the Ewing sarcoma-derived CADO cell line exhibits differences in its splice variants compared to the NSP from this cell line, as well as to the bone marrow-derived MSCs, the putative cell of origin for Ewing sarcoma.
As a control for possible stress response in the NSP population due to fluorescence-activated cell sorting, its differences from unsorted (both unstained and stained) populations (nst and nso, respectively) were also determined. To obtain an accurate representation of the physiologically relevant difference between SP and NSP, those differences were therefore subtracted from the SP vs. NSP difference (intersection BC). Furthermore, SP vs. NSP differences that also show up in the comparison to the MSC population (intersections D and B2, respectively) were also eliminated, resulting in intersection BC′.
The tripartite comparison SP, NSP and MSC (Fig. 2D) was designed to identify those DS elements of the SP-NSP analysis that are monodirectional (BC′) and therefore, specific for this difference as compared to the bidirectional comparison, cell-specific DS elements (SP′, NSP′), which are shared with further comparisons (D, B2). The SP′ and NSP′ cells exhibited far less bidirectional splice variants than the MSC′ cells.
DS genes characterizing CSC side- and main Ewing sarcoma populations
The search for the subset of generally relevant DS genes within BC′ and NSP′ by comparing with further primary Ewing cell cultures sharing the same fusion gene (EWSR1-ERG) and additionally with a cell line carrying a different ETS fusion gene (EWSR1-FLI1) resulted in a 21 and 16% gene overlap of BC′ to the H1 and H2 intersection sets, respectively. The NSP′ fraction exhibited a considerable overlap of 33% for G1 and 37% for G2. The NSP′∩G1,2 and BC′∩H1,2 sets [∩ intersection operator] are disjunct, supporting the robustness of the study design. The lack of overlap between the BC′∩H1,2 and NSP′∩G1,2 sets suggested that they belong to different regulatory circuits (Tables II and SIII).
The Pearson correlation analysis of the DS genes in Table II according to their basic expression profiles revealed that the DS genes themselves have an unspectacularly uniform gene expression profile across the cell samples and exhibit a weak pattern (Fig. 5A) and form an Ewing cluster. A similar pattern may be observed for the full set of all rMATS DS genes (Fig. 5B).
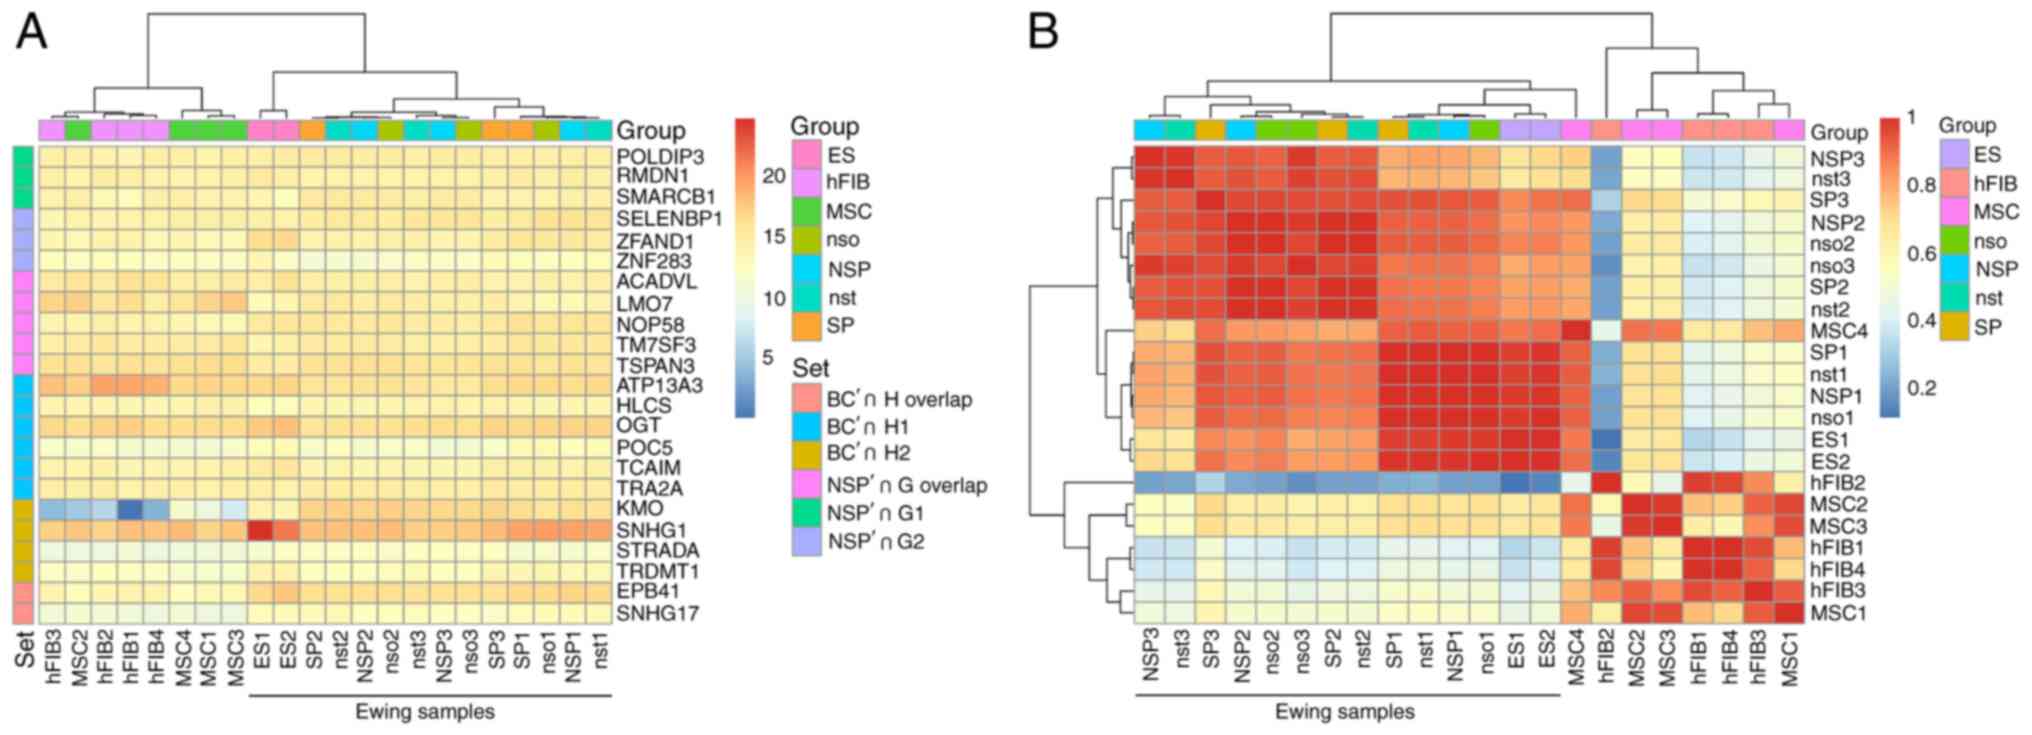 |
Figure 5
The DS genes separate the sample groups according to their gene expression status. (A) The DS genes of Table I are forming an Ewing sarcoma cluster in a Pearson correlation of the expression profiles. The heatmap is based on the TMM-normalized RNA quantification table. The Pearson correlation was also used for the 2D hierarchical clustering of rows and columns. The color scale is denoting the correlation values from weak similarity (>0) to strong similarity (<1). The group color scale is combining the biological replicates. (B) The expression profiles of the DS genes do not expose strong differential effects between the genes. The scale is based on log2 expression values. The set index color codes the comparisons identified by their acronyms. 'H overlap' and 'G overlap' describe the common genes between H1,2 and G1,2, respectively. DS, differentially spliced; SP, side population; ES, Ewing sarcoma; NSP, main Ewing population; nso, no sort control; nst, no stain control; MSC, bone marrow derived mesenchymal stem cell; hFIB, human skin fibroblasts.
|
The defined gene sets had a certain variability in their absolute and splice event-dependent relative gene expression; thus, it is essential to ensure the robustness of the observed differ- ences. The PSI score was applied to establish the relevance of candidates. The remaining candidate genes have an average expression in the observed region of around 3-5 reads per kilobase of transcript, per million mapped reads (RPKM) and above, i.e., well above the threshold of 1 RPKM reported to be a sufficiently sensitive level to detect splice variants (39-41). Applying the stringent PSI criteria as described in the Methods to the DS genes of Table II, several of the questionable candidates described previously were discarded (Table SIV). The particularly stable DS genes of the comparisons BC′∩H1,2 are ATP13A3, EPB41 and for NSP′∩G1,2, they are ACADVL, NOP58 and TSPAN3 (Fig. 6).
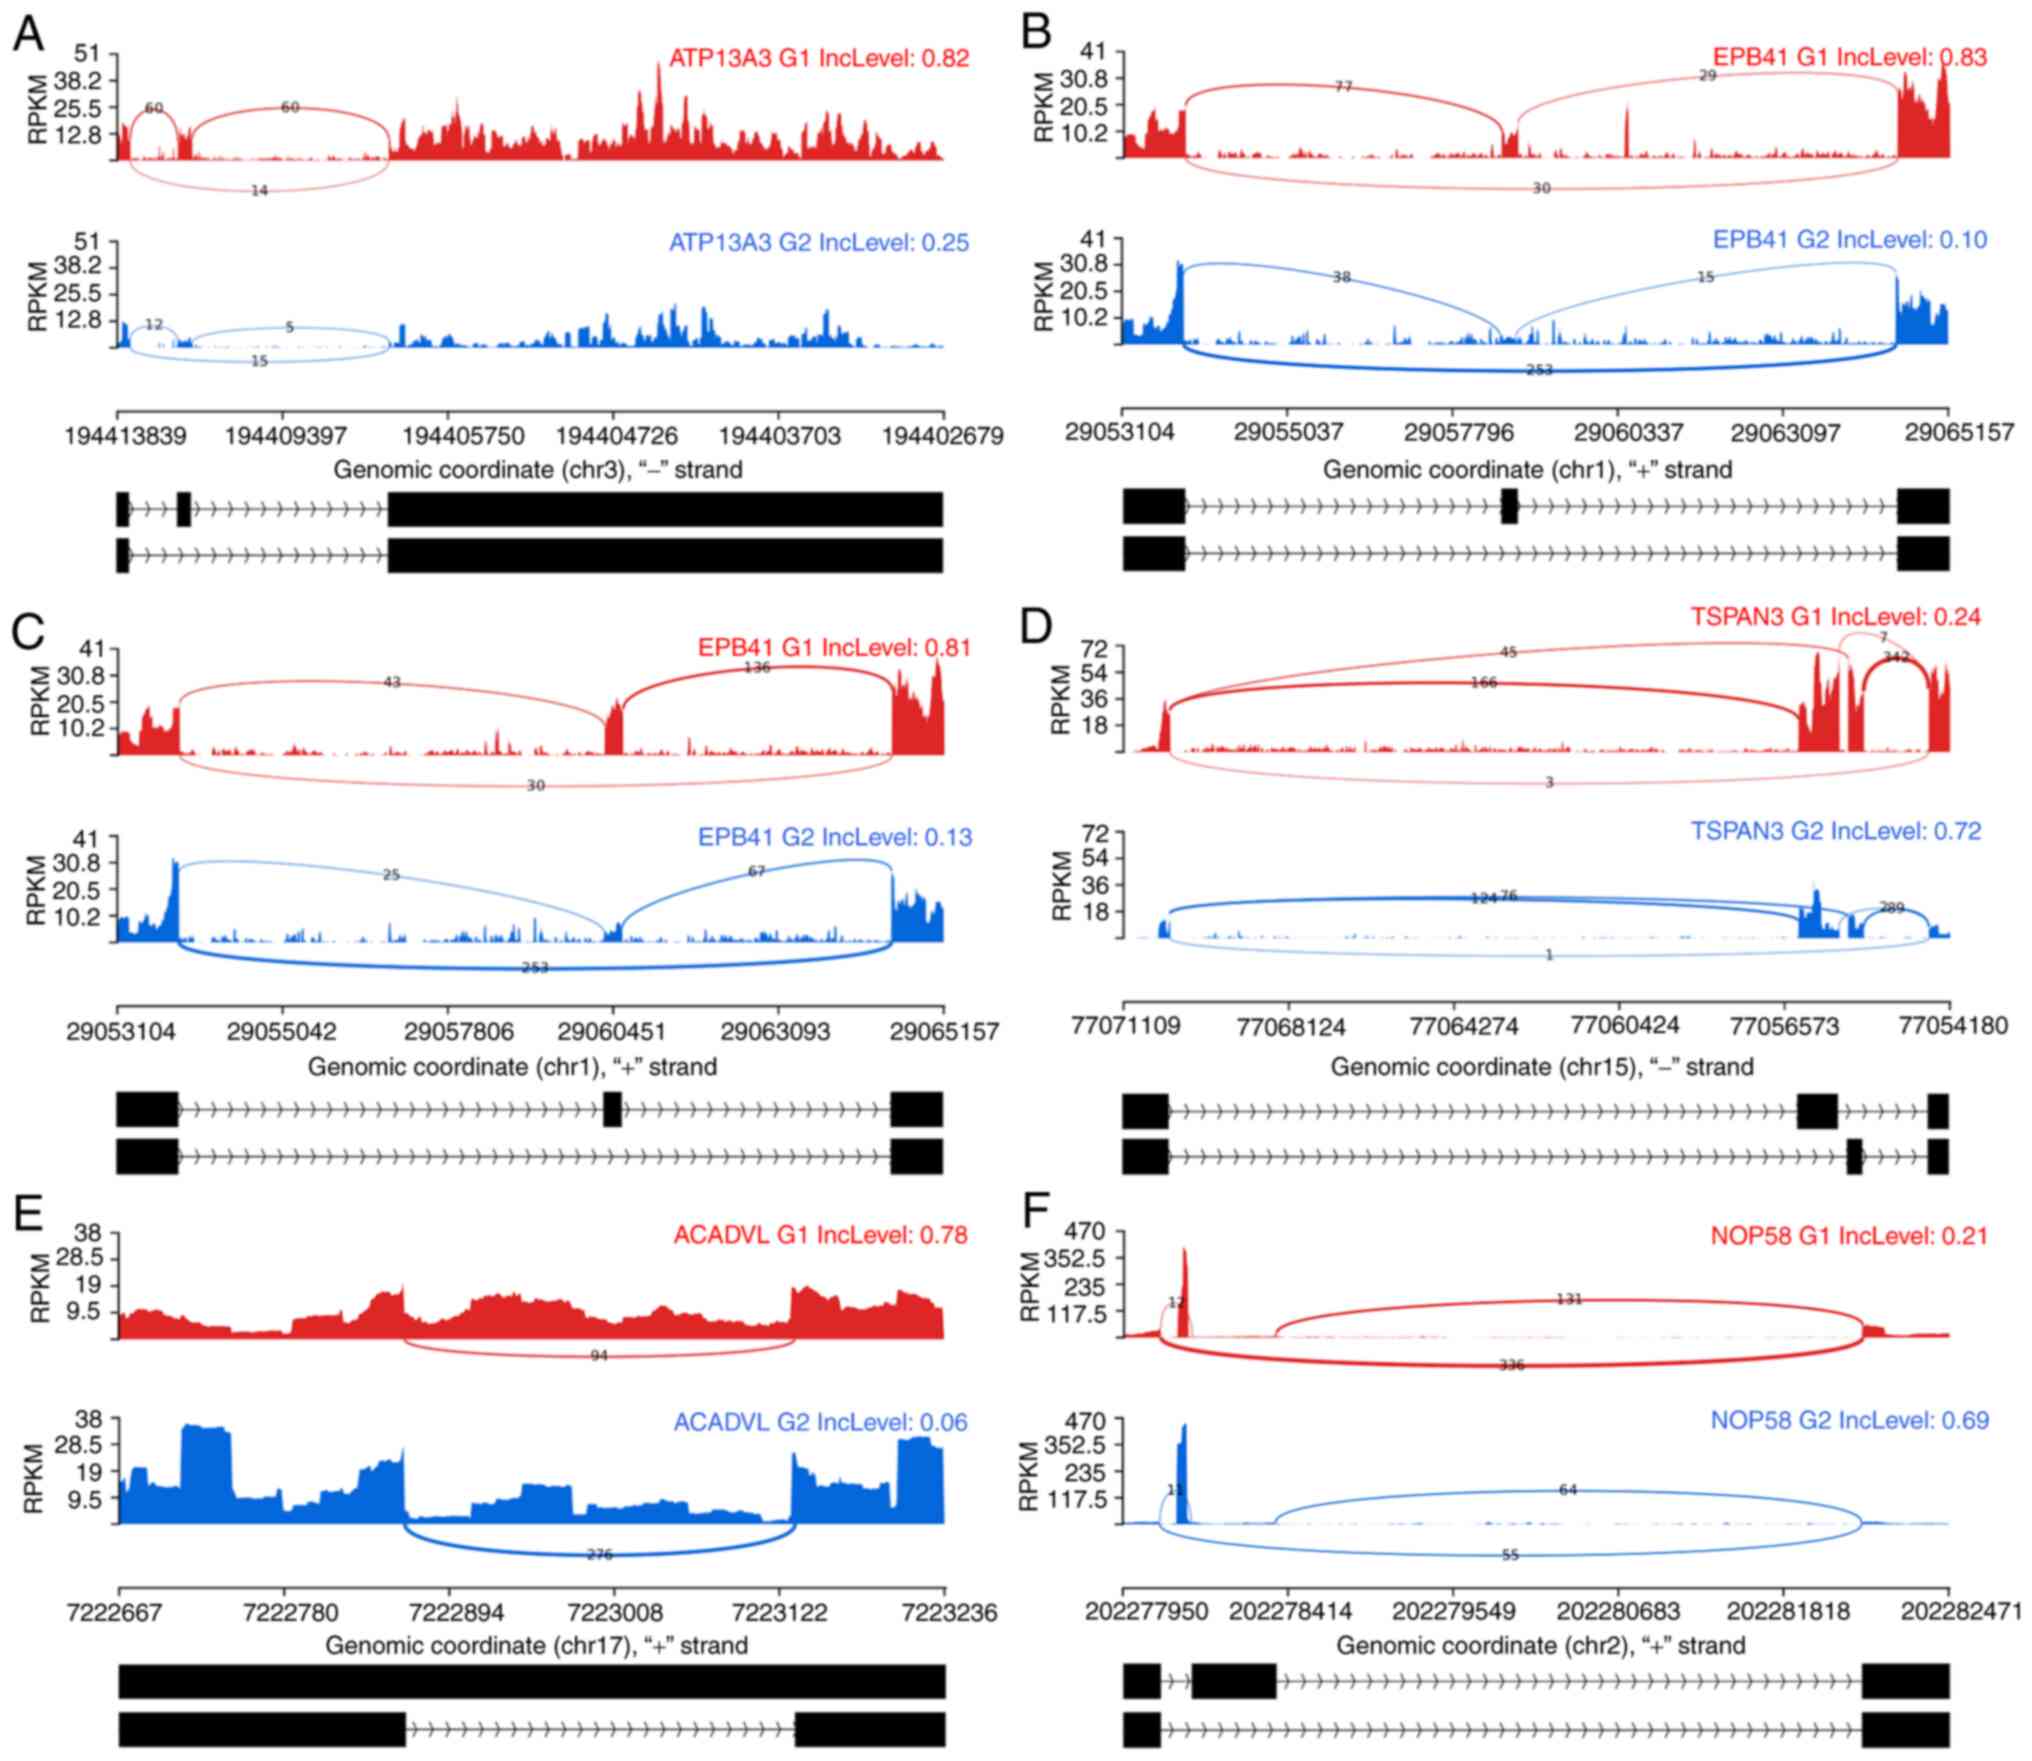 |
Figure 6
PSI stable DS genes of the comparisons BC′∩H1,2 and NSP′∩G1,2. Sashimi plots are used to illustrate the structure of the splice events. The DS genes of BC′∩H1,2 can be seen in (A-C). (A) Indicates gene ATP13A3, (B) gene EPB41 exhibiting an SE splice event and (C) again gene EPB41 with another SE splice event in exactly the same region but not jointly as an MXE event. (D-F) The NSP′∩G1,2 splice events. (D) illustrates the gene TSPAN3, (E) the gene ACADVL and (F) NOP58. All the presented genes passed the PSI criteria. Red and blue color indicate the two rMATS groups which were compared. The numbers on the exon connector lines indicate the number of considered junction reads. Read coverage is indicated by RPKM units on the Y-axis while the X-axis is displaying the genomic position. The two identified splice events are indicated below each pair of graphs in black. A broad diversity of read distributions could be observed in the presented splice events. However, the junction count numbers are well supporting each of the DS events. DS, differentially spliced; MXE, mutually exclusive exons; SE, skipped exon; PSI, percentage spliced in-differential splicing quality criterion; chr, chromosome; RPKM, reads per kilobase of transcript, per million mapped reads.
|
Analyzing the splice variants of Table SIV, which fail to pass the PSI criteria, further observations may be made. The NSP′∩G1 intersection contains POLDIP3 showing a SE splice event, which may be a misclassified MXE type, well-populated in CADO and not expressed in the Ewing control cell line ES1. RMDN1 is exposing an uncommon A3SS type, which appears to be differential, but a highly expressed region in the case of ES1 was not identified, presumably due to not being part of the annotation. SMARCB1 had two splice variants of A5SS and an RI type. The RI type may be a miss-classified A5SS type. A5SS is clearly present; however, it is expressed in NSP, but not in ES1. This may point to a sporadic weakness of the algorithm erroneously reporting DE as a DS effect (Information S3).
Wild-type EWSR1 was reported by rMATS in several sets (Table SV), but not DS due to low PSI score differences. DS of wild-type ERG was not observed at all and DS of wild-type FLI1, observed one time, missed the set PSI criteria by far. Thus, none of the three molecules have any role in any of the analyzed DS comparisons.
CORUM-based analysis reveals numerous tumor-relevant processes for DS candidates
Well-defined protein complex databases are available, which include i.a. information on gene or protein members of a complex, GO information and links to known diseases associated with complex members. The added value is that numerous direct interaction partners may be identified. Hence, protein complex databases are a rich resource to annotate genes by their functional context. Several characteristics for the DS genes of SP′, NSP′, MSC′ and the sets BC′∩H1,2 and NSP′∩G1,2 from Table II are described below for the JC samples and summarized in Fig. 7.
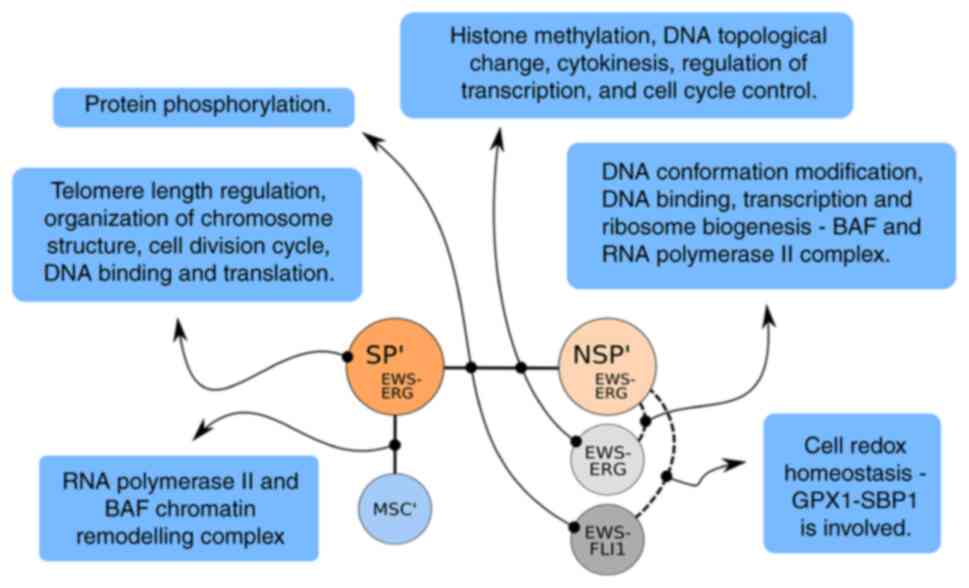 |
Figure 7
DS genes are part of important complexes. Certain core mechanisms affected by the DS genes resulting from the analysis are presented. The connector lines denote the sets of the analysis that lead to the described sub-functionality. The mechanisms differentiate the cellular states. DS, differentially spliced; SP′, a unique subset of the side population; EWS, Ewing sarcoma; MSC′, a unique DS subset of the bone marrow derived mesenchymal stem cell; NSP′, a unique DS subset of the main Ewing population; EWS-ERG or EWS-FLI1, cells with one of these fusion genes.
|
The SP′ set only contains few and small complexes with significant hits, i.a. TERF1 (42) (comprising CDC27, CDC16, ANAPC1, CDC23, ANAPC7, ANAPC5, ANAPC4, ANAPC2, telomere length regulation), DISC1-RHOT1 complex (43), Tankyrin 1-tankyrin 2-TERF1 complex (44) (organization of chromosome structure) and cell division cycle complex (45) (CDC27, CDC16, ANAPC7). Further complexes are involved in DNA binding and translation. Disease information exists for the KEOPS-complex (46) proteins OSGEP, TP53RK and TPRKB, which are involved in cell proliferation, protein translation and DNA-damage-response signaling/ apoptosis (47). Another molecule, POT1, is involved in telomere metabolism (48).
The NSP′ set has far more results than the SP′ set, albeit with moderate enrichment. The functional annotation points to DNA conformation modification, transcriptional repression and DNA modification by acetylation/deacetylation (49). The list of complexes comprises i.a. SIN3-ING1b complex II (50) (i.a. SAP30, SMARCA4, SMARCB1, HDAC1, SMARCC2, HDAC2, SMARCC1, SMARCD1), ALL-1 supercomplex, GPX1-SBP1 complex (51), ubiquitin E3 ligase (BMI1, SPOP, CUL3) and ETS2-SMARCA4-INI1 complex. Disease information exists for SBP1, which is downregulated in several cancer types, GPX1, which is associated with cancer risk and development, MTA1, which is involved in metastasis and cancer formation, and the TWIST complex, which was reported to be required for cancer metastasis in vivo (52).
The MSC′ set is different to the sets mentioned above. The enrichment is higher and includes certain master pathways, such as ribosomal activities (53) and cellular signaling, but no reported link to oncogenes.
The BC′ set (specific for the difference of SP-NSP) resulted in a short, complex list. The GO annotation is primarily associated with posttranslational modification of amino acids, protein targeting, sorting and translocation, vesicular transport, modification by phosphorylation and transcriptional activation. There is certain disease information pointing to cancer, particularly tumor suppressor genes LKB1 (54) and MLL5 described to be co-expressed with OGT (55) and USP7, and the RBL2 complex (56) (DNMT1, E2F4, E2F5, HDAC1, SUV39H1 and RBL2), which is associated with breast cancer.
The D′ set (SP-MSC) is large and similar to the results of MSC′ or NSP′. Here, certain translation and DNA conformation modification-related activities appear. Important in this context are the hits regarding the RNA polymerase II complex and the BAF complex (57) reported to have central roles in Ewing sarcoma (19).
The B2′ set (NSP-MSC) is large and encompasses well-known regulatory functions such as NOP56p-associated pre-rRNA complex, large Drosha complex, COP9 signalosome complex (58), nucleosomal methylation activator complex and DDB2 complex (59). Disease information exists for DGCR8, which is deleted in DiGeorge syndrome, obviously EWSR1, which is involved in Ewing's sarcoma disease and BARD1, which is associated with colorectal adenocarcinoma and attenuates the affinity of BRCA1 and RAD51.
The subsets described in Table II (NSP′∩G1,2, BC′∩H1,2) are small but are associated with noteworthy complexes, which partly already appear in the basic sets above.
BC′∩H1 displays 10 complexes and a GO annotation comprising histone H3-K4 methylation, protein hydroxylation, protein methylation, DNA topological change, cytokinesis, regulation of transcription and the cell cycle. Thus, to a certain extent, the biological functionality is a subset of the sets mentioned above, but more specialized on distinct biological roles. The OGT-TRAK1-TRAK2 complex (60) is associated with hydroxylation, while MLL1/2 complexes (61) stand for histone methylation. The KMT2E-OGT-USP7 complex (62), containing MLL5, emphasizes cell cycle control and has a role in primary cervical adenocarcinomas.
BC′∩H2 exhibits only one complex, the LKB1- STRAD-MO25 complex (54), which does not appear in any of the three other subsets in this section. The GO information points to protein phosphorylation. One of the name-giving genes, LKB1, is known as a tumor suppressor gene. This complex has a role in various sporadic cancers, particularly non-small cell lung cancer.
NSP′∩G1 has 30 different complexes. Of these, numerous complexes have GO terms which point towards DNA conformation modification, and DNA binding and transcription. One of these is again the BAF complex (alias SWI/SNF) (63). Another one is the RNA polymerase II complex in 6 different variants. A further complex is NOP56p-associated pre-rRNA complex, which is involved in ribosome biogenesis.
NSP′∩G2 has only 4 complexes, namely NOP56p-associated pre-rRNA complex, Emerin complex 1 (64), Emerin regula- tory complex and GPX1-SBP1 complex (51). The first three are also part of NSP′∩G1. The Emerin complexes are associated with DNA topological change and transcription. The last one, GPX1-SBP1, is involved in cell redox homeostasis. Disease information for Emerin points to Emery-Dreifuss muscular dystrophy, while GPX1-SBP1 complex is associated with cancer risk and cancer development.
Summarizing the results for the complex-based GO analysis reveals a mechanistic pattern that is strongly connected with the control of cellular core processes involving DNA- and transcriptional processing. Numerous DS genes are linked to cancer processes and allow, at the functional level, the differentiation of the side- and main Ewing sarcoma populations.
Taking all results together, it may be stated that the extracted DS candidates have a good ability to distinguish between the aforementioned CADO subpopulations and furthermore, they are also valid in a broader context of Ewing sarcoma samples of ERG- and FLI1-based fusion genes. A striking feature is the observation that GO terms belonging to a distinct sample exhibit a pronounced segregation between the basic splice events.
Discussion
The main objective of the present study was to extend the available knowledge on Ewing CSCs-characterized in an SP of CADO cells-by studying the appearance, distribution and composition of splice variants on exactly the same dataset that was used in a previous CSC expression study from our group (12). The DS gene sets resulting from the study design developed in the present study are uncovering central modifiers between the tumor biology of CSCs and the main population of Ewing sarcoma cells.
The overall read coverage in the present experiment is sufficient to reliably detect major effects. However, a non-negligible number of spurious observations may have been reduced possibly by using 70× instead of 35× per sample finally mapped reads. While it is difficult to compare this value to other studies with different design, it should be pointed out that the value of 35× of the present study lies well within the range reported elsewhere, 15-80× (65-67). Another aspect concerns the DS detection tools and the quality of their results. While rMATS obtained a fairly good rating in a study by Ding et al (22), the tool has certain weaknesses concerning the selection criteria. A more sophisticated rule set or better implemented Bayesian procedure would improve the specificity for marginal cases.
The observed numbers of DS events for each differential approach expose the differences between the examined cell populations. Less than 200 DS events segregate the CSC SP from the NSP. Much more DS events separate these two populations from the MSC population. However, the SP-MSC number is ~30% smaller than the NSP-MSC number, which points to a somewhat higher similarity of the SP to the MSC population than the main Ewing population. This is consistent with an MSC origin of the CSC SP (2-4), but it cannot be excluded that the SP with its CSC nature, typified here as a DS signature, may also be part of other stem cell lineages.
The relative frequency of the five splice events considered was distinctly different when summed over all splice variants, with abundance values for SE of 52%, A5SS of 7%, A3SS of 11%, RI of 18% and MXE of 11% (cf. Table III). In 2008, Sammeth et al (68) published a calculation of splice event proportions averaged over all three human references (GeneCode, EnsEMBL and RefSeq) and reported the following splice event frequencies: SE, 52%; A5SS, 8%; A3SS, 14%; RI, 6%; and others, 12%. Their values are corresponding very well with those of the present study. In 2019, Lau et al (69) also published statistics with ENCODE RNA-seq data and deter- mined the following frequencies: SE, 65%; A5SS, 7%; A3SS, 11%; RI, 10%; and MXE, 7%, which is in good agreement with the present data except for the considerably higher abundance of RI in the present dataset. However, these other two statistics are based on all known splice variants collected in databases, whereas the present study only identified splice variants that are differential between two conditions. Technical reasons for the higher abundance of RI in the present data may be excluded, as even the subsets reveal similar frequencies. Thus, the higher abundance of RI in the present dataset may be of specific relevance for the (Ewing) cancer situation. RI may result either in functionally different or in dysfunctional protein products [cf. e.g., Monteuuis et al (70)]. However, in each case, the biological networks in which the differentially spliced proteins participate would be affected.
The pure amount of detected splice variants at the gene expression level does not prove that all these splice variants may be translated into proteins [criticism is provided by Tress et al (71), but we tend to agree with Blencowe (72)]. On average, there is a lot of support that the major splice variants will be translated into proteins. Huang et al (73) sophisticatedly demonstrated that at least with modern approaches, all 5 reported gene splice variants of RARRES2 (Chimerin) may also be detected in body fluids at the real protein level. Therefore, it may be assumed that the results of the present study that are at the gene level are mostly retaining their relevance at the protein level.
Another observation from the current rMATS results is that commonly known markers were rarely detected, as exemplified by certain MSC and EWSR1-ETS markers. The reason may be that numerous established molecular markers are developed by DE studies and not DS studies; hence, a DS screening study would rarely expose conventional (DE) markers. DS studies do focus on relative expression ratios instead of absolute expression strength. Therefore, DS studies may be well-suited for developing additional independent marker panels based on alternative splicing patterns.
The comparison of the CADO-CSC SP to the main Ewing sarcoma population (SP-NSP, intersection BC′) together with two further primary Ewing cell cultures enable us to dissect those candidate genes in BC′ that may be generalized to SP-ES1 (both ERG fusion) or SP-ES2 (ERG vs. FLI1 fusion) comparisons. In an analogous way, the Ewing sarcoma NSP-ES1 (both ERG fusion) or NSP-ES2 (ERG vs. FLI1 fusion) comparisons enable us to dissect those candidate genes in the NSP′ that may be generalized to the further two primary Ewing cell cultures in the design of the present study. In each case, the generalization should eliminate those genes specific for CADO and thus narrow down the candidate gene set to those more likely to be of general relevance for Ewing sarcoma progression. Hence, the results are expected to be useful for future biological studies on the pathophysiology of Ewing sarcoma.
The resulting four DS gene groups are representing the DS fingerprint for the CSC and the main Ewing sarcoma population. The biological role of the four PSI criteria passing alternate spliced genes is multifaceted due to their specific selection history. However, their known roles are cancer-associated ones. ATP13A3 is involved in regulatory processes of cation transport across membranes and polyamine transport (74), EPB41 is part of the anaphase (membrane and spindle) processes and may have further roles (75), while ACADVL catalyzes the first step of the mitochondrial beta-oxidation pathway (76), NOP58 is required for the biogenesis of small nucleolar RNAs (U3, U8 and U14) (77) and TSPAN3 (a transmembrane protein) mediates signal transduction events in the course of cell development, growth and motility (78). Taken together, these specific DS genes are useful markers and link to alternate tumor pathways.
Analyzing the association of GO terms with splice events as shown in this study is not done so far as can be seen in Zhang et al (79) for cancer. The presented observation that different splice events are segregating GO terms in a statistically significant way appears to be a novel aspect. This is pointing to a generally assumed systemic feature of a biological network that a set of distinct splice variants stands for a physiological state of the cell. Switching the splice event to another one will change the role of this gene into another functional context. To our knowledge, such a result has not been reported in the literature in this clear appearance by a splice event-based clustering of GO terms. To sum up, splice event patterns form a distinct GO term composition, separating even different cell samples, and may be visualized by a splice event-based GO term clustering.
To date, the alternative splicing of the constitutional exons of EWSR1-ERG or EWSR1-FLI1 themselves has remained largely elusive. While Patócs et al (17) was mainly interested in (breakpoint) variants of the ETS-fusion genes EWSR1-FLI1 and -ERG itself, they were not able to detect any alternative splicing in the constitutional exons of the fusion partners. What they observed was the appearance of up to three different fusion products in one patient sample and the breakpoint variability of the fusion products itself. The present observations confirm known EWSR1-ERG fusions but it was not possible to detect alternate splicing of fusion genes. The wild-type EWSR1, ERG and FLI1 genes appeared to be splice event-free in the present study. However, due to the spurious events reported, it cannot be completely excluded that alternative splicing in a wild-type gene may occur.
In several studies, EWSR1-FLI1 is classified as a typical network hub. Network hubs are molecules that are interacting with numerous molecules in parallel and thus possessing a certain centrality in the biological network structure. For EWSR1-FLI1, the tight interaction with the spliceosome network was reported by Selvanathan et al (80), which led to alternative splicing for CLK1, CASP3, PPFIBP1 and TERT. The former three are also part of the rMATS sets of the present study. The above-mentioned study reported on two further subsets associated with alternative splicing. An expression set with 10 well-validated genes (two in the present B, G2 and H2 sets: HDAC8 and EZH2) and an expression set with nine genes which were assumed to be affected by Selvanathan et al (80). MBNL1 in the latter one also appeared in our analysis and was able to distinguish SP and NSP cells from MSC. The results of Selvanathan et al (80) were obtained from protein studies, array data and partly from RNAseq data, so this may account for certain differences. However, the EWSR1-FLI1 fusion gene they are working on may account for the major differences. The existing overlap between their core genes and the present results suggests that EWSR1-ERG and EWSR1-FLI1 share a certain amount of their molecular regulation.
A subsequent study published by Selvanathan et al (19) in 2019 was centered around the BAF complex and its supporting oncogenic role. One of the well-characterized gene members in the BAF complex is ARID1A (alias BAF250a, SMARCF1). A splice variant of this molecule was not able to be detected in the present study, but ARID1B was observed in SP-MSC as a further BAF member. However, the opener for their study, BAF47 (official SMARCB1), is part of the rMATS intersection sets of the present study. The minor differences from the genes of Selvanathan et al (19) may be explained again by the fact that they focused their study on the EWSR1-FLI1 scenario and not on the EWSR1-ERG variant. However, it appears that the observations of Selvanathan et al (19) again share certain mechanistic aspects with the present analysis. In this context, the work of Boulay et al (81) has a central role by describing that in Ewing sarcoma, the BAF complex is recruited and retargeted by EWSR1 as part of the EWSR1-FLI1 fusion protein, a process which will also likely be valid for EWSR1-ERG.
Selvanathan et al (19) described, in their interaction experiments between the BAF complex and EWSR1-FLI1, further BAF members, such as SMARCA4, SMARCB1, SMARCC1 and SMARCC2. Of these 4 SMARC-members, SMARCA4, SMARCB1 and SMARCC2 (but not SMARCC1) were part of the present analysis. The BAF members detected in the present study may be separated into two categories. ACTB, ACTG1, ACTL6A, SMARCA4, SMARCE1, so six of 13 members of the BAF complex (46%), were obtained in the SP and NSP to ES1/ES2 comparisons. The other group, consisting of ACTB, ACTG1, ARID1B, SMARCA2, SMARCB1 and SMARCC2, was obtained in the SP and NSP to MSC comparisons (Table SVI). Thus, the composition of alternatively spliced BAF members characterizes the differences between CSC side- and main Ewing sarcoma populations as well as from the MSCs. The coherence of the results of Selvanathan et al (19) with the present observations suggests a strong role of the BAF complex for the ETS fusion genes and implies similar work mechanisms for the EWSR1-ERG and -FLI1 fusion genes.
Selvanathan et al (19), somewhat in contrast to Boulay et al (81), speculates on wild-type EWSR1 interactions with the EWSR1-FLI1 fusion gene to explain how wild-type EWSR1, which appears to not bind to the BAF complex directly, may also come into play for the BAF complex-associated mechanisms. The EWSR1 binding by oligomerization as described by Spahn et al (82) may there- fore be a good working hypothesis and the known variability of the molecular splice mechanisms (83,84) supports such a concept. There are further studies describing the interaction of both EWSR1-FLI1 and wild-type EWSR1 with the early spliceosome factors SF1 and SNRPC (32,85) or CCND1 (86), illustrating that the EWSR1-FLI1 fusion gene and wild-type EWSR1 share a certain mechanistic overlap. However, none of the three wild-type genes are part of the DS lists of the present study. Therefore, it is not possible for the present results to provide any support for the mechanisms discussed above.
The above-mentioned DS events of the BAF complex may also be able to tune activation or repression of transcriptional activity by histone modification and chromatin remodeling, as described by Zhu et al (87) for muscle-specific gene expression and Nguyen et al (88,89) for neural stem cell proliferation and embryonic development. The PRC2 complex, which was demonstrated to behave antagonistic to the BAF complex by Nguyen et al (88), was indicated to have three DS genes in the present study (RBBP7, LCOR and MTF2). Overall, these authors concluded that epigenetic modifications appear to primarily trigger differentiation and cell fate decisions by transcriptional control. However, the mentioned histone modifications, despite being able to survive several mitotic events, may also be overruled by other mechanisms such as those of long non-coding RNAs, as indicated by Grote and Herrmann (90). DS events may therefore introduce a further regulatory layer, which may even be a crucial element to trigger a malformed differentiation path from MSCs to Ewing CSCs by modifying the activity of the BAF- and PRC2 complexes. A recent overview focusing on ncBAF (GBAF) but also on further BAF family members comprehensively presented the broad spectrum of action the BAF family of complexes is able to orchestrate (91).
A review by Sveen et al (92) provided an overview of molecular factors associated with 'alternative splicing and cancer hallmarks'. Of these, certain factors were detected in the broader context of the study (34%), but by far not all (Table SVII). VEGFA is described to have an extended exon 8 but was detected to be present in the current study with an optional exon 6. Overall, this review does not really fit the present Ewing sarcoma situation. In contrast to Sveen et al (92), the studies of Selvanathan et al (19,80) show a much better fit with the present results and particularly expose the cancer biology by numerous overlapping candidate genes.
Comparing the DE results with the DS results will foremost raise the conceptional question of what is comparable in these two research situations. DE studies on a gene level are considering expression strength differences between sample groups, while DS studies aim to identify expression ratio differences of gene fragments between sample groups. This may include certain aspects of a DE analysis, but not all and not vice versa. From this perspective, a certain overlap between DE and DS analyses is expected.
The gene overlap between the results of a previous gene expression study by our group (12) and the present results based on the same aligned BAM files ranges from 9 to 30%. Of note, the reported remarkable set of oncogenes, which is differential between SP and NSP cells, is contributing to the largest overlap in the present study (Table SVIII). This is once more underlining the already reported importance of alternative splicing for cancer maintenance in general [e.g., (93)] and particularly for the oncogenes themselves, not as a primary source of cancer progression instead of a secondary booster stabilizing the fusion gene's initiated changes on the splicing machinery itself (19).
Comparing different published DE studies is hampered by a large number of effects ranging from cell culture to experimental technology and may therefore only be suitable for primary effects. However, in contrast to this conservative estimate, remarkable synchronicity may be observed with studies of Hu-Lieskovan et al (94) of 22% and again Selvanathan et al (19) of 20% (Table SVIII).
Finally, it should be noted that splice events are only one aspect of the whole regulatory scenario and genomic alterations as well as epigenetic modifications, and several further regulatory levels together model the outcome of a cellular state.
Concluding on all the different aspects of this discussion, it may be stated that all of the present results build upon established knowledge and are extending the depth of details to a systems biology level.
In conclusion, the comprehensive and systematically structured screening results provided in the present study constitute a valuable data resource for follow-up analyses focusing on specific research questions on Ewing sarcoma and cancer in general. A striking feature is the observation that GO terms and splice event types are building exclusive groups, which may be distinguished and visualized in a GO term-based cluster graph. This feature enables further studies to decode organizational characteristics of the regulation scheme behind splice events.
The analysis revealed a high similarity between EWSR1-ERG and -FLI1 fusion gene variants concerning their participation in the BAF complex. This, together with the defined core sets for CSC-like SP cells, as well the main Ewing sarcoma cells and their DS characteristics, is a good starting point to integrate the understanding of all ETS fusion gene members over time, and thus clarify the mode of action of stem cells in Ewing sarcoma.
A splice variant-aware expression analysis as a standard procedure is expected to provide more comprehensive and fruitful insight into the systems biology of CSCs and their derivatives. It may be helpful to implement this integrative approach manually performed in the present study in a single software tool for detecting both DS and DE. Such a tool would be required to integrate not only different tool chains but also different philosophies, as the DE and DS analyses are answering related but slightly different basic questions, i.e., outcome of regulation vs. regulation itself.
Supplementary Data
Availability of data and materials
All data are freely available from public or institutional data repositories or on request. The transcriptome data are hosted in EBI ArrayExpress (E-MTAB-6067; https://www.ebi.ac.uk/arrayexpress/experiments/E-MTAB-6067/), public access. CORUM protein complex database (http://mips.helmholtz-muenchen.de/corum/), public access. DAVID database (https://david.ncifcrf.gov/) with public access. Further information (specifically Information S1-S4 and R workspace) is available through the institutional website (http://complex-systems.uni-muenster.de/sinfo.html).
Authors' contributions
Conceptualization, MH and EK; methodology, JM and EK; validation, JM, MH and EK; formal analysis and investigation, JM, MH and EK; writing - original draft preparation, JM, MH and EK; visualization, EK; supervision, EK; project administration, MH and EK; funding acquisition, MH and EK. All authors have read and agreed to the published version of the manuscript and approved the authenticity of the raw data.
Ethics approval and consent to participate
The primary study was performed according to the tenets of the Declaration of Helsinki and approved by the Institutional Review Board (Ethics Committee) of the University of Muenster [multicenter trials E.U.R.O Ewing 99 (EE99 NCT00020566, 12/02/1999) and Ewing 2008 (NCT00987636, 01/10/2009); both registered at https://clinicaltrials.gov]. Written informed consent was obtained from all subjects involved in the study or in the case of children from their respective parents/guardians.
Patient consent for publication
Not applicable.
Competing interests
The authors declare that they have no competing interests.
Acknowledgments
The authors would like to thank Ms. Annegret Rosemann, Ms. Dagmar Clemens and Mr. Martin Kiefer from the Department of Pediatric Hematology and Oncology, University Hospital Münster, Germany for their excellent technical work in all types of wet laboratory procedures.
Funding
This study was supported in part by the Federal Ministry of Education and Research (BMBF; grant no. 01GM0869, TranSaRNet; and in part by grant no. 01KT1310, PROVABES). The authors also acknowledge the support from the Open Access Publication Fund of the University of Münster.
Abbreviations:
|
CSC
|
cancer stem cell
|
|
MSC
|
mesenchymal stem cell
|
|
DS
|
differential splicing
|
|
DE
|
differential gene expression
|
|
CADO
|
CADO-ES1 cell line
|
|
SP
|
side population
|
|
NSP
|
non-SP-main Ewing sarcoma population
|
|
nso
|
NSP not sorted
|
|
nst
|
NSP not stained and not sorted
|
|
ES1 and ES2
|
Ewing cell cultures
|
|
hFIB
|
human skin fibroblasts
|
|
A3SS
|
alternative 3′ splice site
|
|
A5SS
|
alternative 5′ splice site
|
|
MXE
|
mutually exclusive exons
|
|
RI
|
retained intron
|
|
SE
|
skipped exon
|
|
JC
|
junction count
|
|
JCEC
|
junction and on adjacent exon count
|
|
PSI
|
percentage spliced in-DS quality criterion
|
|
FDR
|
false discovery rate
|
References
|
1
|
Sbaraglia M, Righi A, Gambarotti M and Dei Tos AP: Ewing sarcoma and Ewing-like tumors. Virchows Archiv. 476:109–119. 2020. View Article : Google Scholar
|
|
2
|
Tirode F, Laud-Duval K, Prieur A, Delorme B, Charbord P and Delattre O: Mesenchymal stem cell features of Ewing tumors. Cancer Cell. 11:421–429. 2007. View Article : Google Scholar : PubMed/NCBI
|
|
3
|
Riggi N, Suvà ML, Suvà D, Cironi L, Provero P, Tercier S, Joseph JM, Stehle JC, Baumer K, Kindler V, et al: EWS-FLI-1 expression triggers a Ewing's sarcoma initiation program in primary human mesenchymal stem cells. Cancer Res. 68:2176–2185. 2008. View Article : Google Scholar : PubMed/NCBI
|
|
4
|
von Levetzow C, Jiang X, Gwye Y, von Levetzow G, Hung L, Cooper A, Hsu JHR and Lawlor ER: Modeling initiation of Ewing sarcoma in human neural crest cells. PLoS One. 6:e193052011. View Article : Google Scholar : PubMed/NCBI
|
|
5
|
Jawad MU, Cheung MC, Min ES, Schneiderbauer MM, Koniaris LG and Scully SP: Ewing sarcoma demonstrates racial disparities in incidence-related and sex-related differences in outcome: An analysis of 1631 cases from the SEER database, 1973-2005. Cancer. 115:3526–3536. 2009. View Article : Google Scholar : PubMed/NCBI
|
|
6
|
Orr WS, Denbo JW, Billups CA, Wu J, Navid F, Rao BN, Davidoff AM and Krasin MJ: Analysis of prognostic factors in extraosseous Ewing sarcoma family of tumors: Review of St. Jude Children's research hospital experience. Ann Surg Oncol. 19:3816–3822. 2012. View Article : Google Scholar : PubMed/NCBI
|
|
7
|
Grünewald TGP, Cidre-Aranaz F, Surdez D, Tomazou EM, de Álava E, Kovar H, Sorensen PH, Delattre O and Dirksen U: Ewing sarcoma. Nat Rev Dis Primers. 4:52018. View Article : Google Scholar
|
|
8
|
Sand LGL, Szuhai K and Hogendoorn PCW: Sequencing over- view of Ewing sarcoma: A journey across genomic, epigenomic and transcriptomic landscapes. Int J Mol Sci. 16:16176–16215. 2015. View Article : Google Scholar : PubMed/NCBI
|
|
9
|
Suvà ML, Riggi N, Stehle JC, Baumer K, Tercier S, Joseph JM, Suvà D, Clément V, Provero P, Cironi L, et al: Identification of cancer stem cells in Ewing's sarcoma. Cancer Res. 69:1776–1781. 2009. View Article : Google Scholar : PubMed/NCBI
|
|
10
|
Yang M, Zhang R, Yan M, Ye Z, Liang W and Luo Z: Detection and characterization of side population in Ewing's sarcoma SK-ES-1 cells in vitro. Biochem Biophys Res Commun. 391:1062–1066. 2010. View Article : Google Scholar
|
|
11
|
Helman LJ and Meltzer P: Mechanisms of sarcoma development. Nat Rev Cancer. 3:685–694. 2003. View Article : Google Scholar : PubMed/NCBI
|
|
12
|
Hotfilder M, Mallela N, Seggewiß J, Dirksen U and Korsching E: Defining a characteristic gene expression set responsible for cancer stem cell-like features in a sub-population of ewing sarcoma cells CADO-ES1. Int J Mol Sci. 19:39082018. View Article : Google Scholar
|
|
13
|
Tanabe A and Sahara H: The metabolic heterogeneity and flexibility of cancer stem cells. Cancers (Basel). 12:27802020. View Article : Google Scholar
|
|
14
|
Park E, Pan Z, Zhang Z, Lin L and Xing Y: The expanding landscape of alternative splicing variation in human populations. Am J Hum Genet. 102:11–26. 2018. View Article : Google Scholar : PubMed/NCBI
|
|
15
|
Xu B, Meng Y and Jin Y: RNA structures in alternative splicing and back-splicing. Wiley Interdiscip Rev RNA. 12. pp. e16262021, View Article : Google Scholar
|
|
16
|
Oltean S and Bates DO: Hallmarks of alternative splicing in cancer. Oncogene. 33:5311–5318. 2014. View Article : Google Scholar
|
|
17
|
Patócs B, Németh K, Garami M, Arató G, Kovalszky I, Szendrői M and Fekete G: Multiple splice variants of EWSR1-ETS fusion transcripts co-existing in the Ewing sarcoma family of tumors. Cell Oncol (Dordr). 36:191–200. 2013. View Article : Google Scholar
|
|
18
|
Sand LGL, Jochemsen AG, Beletkaia E, Schmidt T, Hogendoorn PCW and Szuhai K: Novel splice variants of CXCR4 identified by transcriptome sequencing. Biochem Biophys Res Commun. 466:89–94. 2015. View Article : Google Scholar : PubMed/NCBI
|
|
19
|
Selvanathan SP, Graham GT, Grego AR, Baker TM, Hogg JR, Simpson M, Batish M, Crompton B, Stegmaier K, Tomazou EM, et al: EWS-FLI1 modulated alternative splicing of ARID1A reveals novel oncogenic function through the BAF complex. Nucleic Acids Res. 47:9619–9636. 2019.PubMed/NCBI
|
|
20
|
Bartys N, Kierzek R and Lisowiec-Wachnicka J: The regulation properties of RNA secondary structure in alternative splicing. Biochim Biophys Acta Gene Regul Mech. 1862:1944012019. View Article : Google Scholar : PubMed/NCBI
|
|
21
|
Shen S, Park JW, Lu ZX, Lin L, Henry MD, Wu YN, Zhou Q and Xing Y: rMATS: Robust and flexible detection of differential alternative splicing from replicate RNA-Seq data. Proc Natl Acad Sci USA. 111:E5593–E5601. 2014. View Article : Google Scholar : PubMed/NCBI
|
|
22
|
Ding L, Rath E and Bai Y: Comparison of alternative splicing junction detection tools using RNA-Seq data. Curr Genomics. 18:268–277. 2017. View Article : Google Scholar : PubMed/NCBI
|
|
23
|
Mehmood A, Laiho A, Venäläinen MS, McGlinchey AJ, Wang N and Elo LL: Systematic evaluation of differential splicing tools for RNA-seq studies. Brief Bioinform. 21:2052–2065. 2020. View Article : Google Scholar :
|
|
24
|
Kodama K, Doi O, Higashiyama M, Mori Y, Horai T, Tateishi R, Aoki Y and Misawa S: Establishment and characterization of a new Ewing's sarcoma cell line. Cancer Genet Cytogenet. 57:19–30. 1991. View Article : Google Scholar : PubMed/NCBI
|
|
25
|
Leuchte K, Altvater B, Hoffschlag S, Potratz J, Meltzer J, Clemens D, Luecke A, Hardes J, Dirksen U, Juergens H, et al: Anchorage-independent growth of Ewing sarcoma cells under serum-free conditions is not associated with stem-cell like phenotype and function. Oncol Rep. 32:845–852. 2014. View Article : Google Scholar
|
|
26
|
Amaral AT, Manara MC, Berghuis D, Ordóñez JL, Biscuola M, Lopez-García MA, Osuna D, Lucarelli E, Alviano F, Lankester A, et al: Characterization of human mesenchymal stem cells from ewing sarcoma patients. Pathogenetic implications. PLoS One. 9:e858142014. View Article : Google Scholar : PubMed/NCBI
|
|
27
|
Unland R, Clemens D, Heinicke U, Potratz JC, Hotfilder M, Fulda S, Wardelmann E, Frühwald MC and Dirksen U: Suberoylanilide hydroxamic acid synergistically enhances the antitumor activity of etoposide in Ewing sarcoma cell lines. Anticancer Drugs. 26:843–851. 2015. View Article : Google Scholar
|
|
28
|
Kailayangiri S, Altvater B, Lesch S, Balbach S, Göttlich C, Kühnemundt J, Mikesch JH, Schelhaas S, Jamitzky S, Meltzer J, et al: EZH2 inhibition in Ewing sarcoma upregulates G D2 expression for targeting with gene-modified T cells. Mol Ther. 27:933–946. 2019. View Article : Google Scholar : PubMed/NCBI
|
|
29
|
Villegas J and McPhaul M: Establishment and culture of human skin fibroblasts. Curr Protoc Mol Biol. 28:Unit 28.3. 2005.
|
|
30
|
Schmid F, Glaus E, Barthelmes D, Fliegauf M, Gaspar H, Nürnberg G, Nürnberg P, Omran H, Berger W and Neidhardt J: U1 snRNA-mediated gene therapeutic correction of splice defects caused by an exceptionally mild BBS mutation. Hum Mutat. 32:815–824. 2011. View Article : Google Scholar : PubMed/NCBI
|
|
31
|
Haas BJ, Dobin A, Li B, Stransky N, Pochet N and Regev A: Accuracy assessment of fusion transcript detection via read-mapping and de novo fusion transcript assembly-based methods. Genome Biol. 20:2132019. View Article : Google Scholar : PubMed/NCBI
|
|
32
|
Knoop LL and Baker SJ: The splicing factor U1C represses EWS/FLI-mediated transactivation. J Biol Chem. 275:24865–24871. 2000. View Article : Google Scholar : PubMed/NCBI
|
|
33
|
Shen S, Park JW, Huang J, Dittmar KA, Lu Zx, Zhou Q, Carstens RP and Xing Y: MATS: A Bayesian framework for flexible detection of differential alternative splicing from RNA-Seq data. Nucleic Acids Res. 40:e612012. View Article : Google Scholar :
|
|
34
|
Bürger H, de Boer M, van Diest PJ and Korsching E: Chromosome 16q loss-a genetic key to the understanding of breast carcinogenesis. Histol Histopathol. 28:311–320. 2013.
|
|
35
|
Sánchez L, Gutierrez-Aranda I, Ligero G, Rubio R, Muñoz-López M, García-Pérez JL, Ramos V, Real PJ, Bueno C, Rodríguez R, et al: Enrichment of human ESC-derived multipotent mesenchymal stem cells with immunosuppressive and anti-inflammatory properties capable to protect against experimental inflammatory bowel disease. Stem Cells. 29:251–262. 2011. View Article : Google Scholar : PubMed/NCBI
|
|
36
|
Li X, McGee-Lawrence ME, Decker M and Westendorf JJ: The Ewing's sarcoma fusion protein, EWS-FLI, binds Runx2 and blocks osteoblast differentiation. J Cell Biochem. 111:933–943. 2010. View Article : Google Scholar : PubMed/NCBI
|
|
37
|
Kubo H, Shimizu M, Taya Y, Kawamoto T, Michida M, Kaneko E, Igarashi A, Nishimura M, Segoshi K, Shimazu Y, et al: Identification of mesenchymal stem cell (MSC)-transcription factors by microarray and knockdown analyses, and signature molecule-marked MSC in bone marrow by immunohistochemistry. Genes Cells. 14:407–424. 2009. View Article : Google Scholar : PubMed/NCBI
|
|
38
|
Pelekanos RA, Li J, Gongora M, Chandrakanthan V, Scown J, Suhaimi N, Brooke G, Christensen ME, Doan T, Rice AM, et al: Comprehensive transcriptome and immunophenotype analysis of renal and cardiac MSC-like populations supports strong congruence with bone marrow MSC despite maintenance of distinct identities. Stem Cell Res. 8:58–73. 2012. View Article : Google Scholar
|
|
39
|
Chen M, Xiao J, Zhang Z, Liu J, Wu J and Yu J: Identification of human HK genes and gene expression regulation study in cancer from transcriptomics data analysis. PLoS One. 8:e540822013. View Article : Google Scholar : PubMed/NCBI
|
|
40
|
Rau A, Gallopin M, Celeux G and Jaffrézic F: Data-based filtering for replicated high-throughput transcriptome sequencing experiments. Bioinformatics. 29:2146–2152. 2013. View Article : Google Scholar : PubMed/NCBI
|
|
41
|
Conesa A, Madrigal P, Tarazona S, Gomez-Cabrero D, Cervera A, McPherson A, Szczesniak MW, Gaffney DJ, Elo LL, Zhang X and Mortazavi A: A survey of best practices for RNA-seq data analysis. Genome Biol. 17:132016. View Article : Google Scholar :
|
|
42
|
Shen M, Haggblom C, Vogt M, Hunter T and Lu KP: Characterization and cell cycle regulation of the related human telomeric proteins Pin2 and TRF1 suggest a role in mitosis. Proc Natl Acad Sci USA. 94:13618–13623. 1997. View Article : Google Scholar
|
|
43
|
Ogawa F, Malavasi EL, Crummie DK, Eykelenboom JE, Soares DC, Mackie S, Porteous DJ and Millar JK: DISC1 complexes with TRAK1 and miro1 to modulate anterograde axonal mitochondrial trafficking. Hum Mol Genet. 23:906–919. 2014. View Article : Google Scholar :
|
|
44
|
Sbodio JI and Chi NW: Identification of a tankyrase-binding motif shared by IRAP, TAB182, and human TRF1 but not mouse TRF1. NuMA contains this RXXPDG motif and is a novel tankyrase partner. J Biol Chem. 277:31887–31892. 2002. View Article : Google Scholar : PubMed/NCBI
|
|
45
|
Kraft C, Vodermaier HC, Maurer-Stroh S, Eisenhaber F and Peters JM: The WD40 propeller domain of Cdh1 functions as a destruction box receptor for APC/C substrates. Mol Cell. 18:543–553. 2005. View Article : Google Scholar : PubMed/NCBI
|
|
46
|
Costessi A, Mahrour N, Sharma V, Stunnenberg R, Stoel MA, Tijchon E, Conaway JW, Conaway RC and Stunnenberg HG: The human EKC/KEOPS complex is recruited to Cullin2 ubiquitin ligases by the human tumour antigen PRAME. PLoS One. 7:e428222012. View Article : Google Scholar :
|
|
47
|
Braun DA, Rao J, Mollet G, Schapiro D, Daugeron MC, Tan W, Gribouval O, Boyer O, Revy P, Jobst-Schwan T, et al: Mutations in KEOPS-complex genes cause nephrotic syndrome with primary microcephaly. Nat Genet. 49:1529–1538. 2017. View Article : Google Scholar : PubMed/NCBI
|
|
48
|
Liu D, Safari A, O'Connor MS, Chan DW, Laegeler A, Qin J and Songyang Z: PTOP interacts with POT1 and regulates its localization to telomeres. Nat Cell Biol. 6:673–680. 2004. View Article : Google Scholar : PubMed/NCBI
|
|
49
|
Zhang Y, LeRoy G, Seelig HP, Lane WS and Reinberg D: The dermatomyositis-specific autoantigen Mi2 is a component of a complex containing histone deacetylase and nucleosome remodeling activities. Cell. 95:279–289. 1998. View Article : Google Scholar : PubMed/NCBI
|
|
50
|
Kuzmichev A, Zhang Y, Erdjument-Bromage H, Tempst P and Reinberg D: Role of the Sin3-histone deacetylase complex in growth regulation by the candidate tumor suppressor p33 (ING1). Mol Cell Biol. 22:835–848. 2002. View Article : Google Scholar : PubMed/NCBI
|
|
51
|
Fang W, Goldberg ML, Pohl NM, Bi X, Tong C, Xiong B, Koh TJ, Diamond AM and Yang W: Functional and physical interaction between the selenium-binding protein 1 (SBP1) and the glutathione peroxidase 1 selenoprotein. Carcinogenesis. 31:1360–1366. 2010. View Article : Google Scholar : PubMed/NCBI
|
|
52
|
Fu J, Qin L, He T, Qin J, Hong J, Wong J, Liao L and Xu J: The TWIST/Mi2/NuRD protein complex and its essential role in cancer metastasis. Cell Res. 21:275–289. 2011. View Article : Google Scholar
|
|
53
|
Nakao A, Yoshihama M and Kenmochi N: RPG: The ribosomal protein gene database. Nucleic Acids Res. 32(Database issue): D168–D170. 2004. View Article : Google Scholar :
|
|
54
|
Zeqiraj E, Filippi BM, Deak M, Alessi DR and van Aalten DM: Structure of the LKB1-STRAD-MO25 complex reveals an allosteric mechanism of kinase activation. Science. 326:1707–1711. 2009. View Article : Google Scholar
|
|
55
|
Inoue D, Fujino T, Sheridan P, Zhang YZ, Nagase R, Horikawa S, Li Z, Matsui H, Kanai A, Saika M, et al: A novel ASXL1-OGT axis plays roles in H3K4 methylation and tumor suppression in myeloid malignancies. Leukemia. 32:1327–1337. 2018. View Article : Google Scholar : PubMed/NCBI
|
|
56
|
Macaluso M, Cinti C, Russo G, Russo A and Giordano A: p R b2 / p13 0 - E 2 F 4 /5 - H DAC1- S U V39 H1- p3 00 an d pRb2/p130-E2F4/5HDAC1-SUV39H1-DNMT1 multimolecular complexes mediate the transcription of estrogen receptor-alpha in breast cancer. Oncogene. 22:3511–3517. 2003. View Article : Google Scholar : PubMed/NCBI
|
|
57
|
Xue Y, Canman JC, Lee CS, Nie Z, Yang D, Moreno GT, Young MK, Salmon ED and Wang W: The human SWI/SNF-B chromatin-remodeling complex is related to yeast rsc and localizes at kinetochores of mitotic chromosomes. Proc Natl Acad Sci USA. 97:13015–13020. 2000. View Article : Google Scholar : PubMed/NCBI
|
|
58
|
Seeger M, Kraft R, Ferrell K, Bech-Otschir D, Dumdey R, Schade R, Gordon C, Naumann M and Dubiel W: A novel protein complex involved in signal transduction possessing similarities to 26S proteasome subunits. FASEB J. 12:469–478. 1998. View Article : Google Scholar : PubMed/NCBI
|
|
59
|
Groisman R, Polanowska J, Kuraoka I, Sawada Ji, Saijo M, Drapkin R, Kisselev AF, Tanaka K and Nakatani Y: The ubiquitin ligase activity in the DDB2 and CSA complexes is differentially regulated by the COP9 signalosome in response to DNA damage. Cell. 113:357–367. 2003. View Article : Google Scholar : PubMed/NCBI
|
|
60
|
Iyer SP, Akimoto Y and Hart GW: Identification and cloning of a novel family of coiled-coil domain proteins that interact with O-GlcNAc transferase. J Biol Chem. 278:5399–5409. 2003. View Article : Google Scholar
|
|
61
|
van Nuland R, Smits AH, Pallaki P, Jansen PW, Vermeulen M and Timmers HT: Quantitative dissection and stoichiometry determination of the human SET1/MLL histone methyltransferase complexes. Mol Cell Biol. 33:2067–2077. 2013. View Article : Google Scholar : PubMed/NCBI
|
|
62
|
Ding X, Jiang W, Zhou P, Liu L, Wan X, Yuan X, Wang X, Chen M, Chen J, Yang J, et al: Mixed lineage leukemia 5 (MLL5) protein stability is cooperatively regulated by O-GlcNac transferase (OGT) and ubiquitin specific protease 7 (USP7). PLoS One. 10:e01450232015. View Article : Google Scholar : PubMed/NCBI
|
|
63
|
Yan Z, Cui K, Murray DM, Ling C, Xue Y, Gerstein A, Parsons R, Zhao K and Wang W: PBAF chromatin-remodeling complex requires a novel specificity subunit, BAF200, to regulate expression of selective interferon-responsive genes. Genes Dev. 19:1662–1667. 2005. View Article : Google Scholar : PubMed/NCBI
|
|
64
|
Holaska JM and Wilson KL: An emerin 'proteome': Purification of distinct emerin-containing complexes from HeLa cells suggests molecular basis for diverse roles including gene regulation, mRNA splicing, signaling, mechanosensing, and nuclear architecture. Biochemistry. 46:8897–8908. 2007. View Article : Google Scholar
|
|
65
|
Battle A, Mostafavi S, Zhu X, Potash JB, Weissman MM, McCormick C, Haudenschild CD, Beckman KB, Shi J, Mei R, et al: Characterizing the genetic basis of transcriptome diversity through RNA-sequencing of 922 individuals. Genome Res. 24:14–24. 2014. View Article : Google Scholar :
|
|
66
|
Consortium G. Human genomics: The genotype-tissue expression (GTEx) pilot analysis: Multitissue gene regulation in humans. Science. 348:648–660. 2015. View Article : Google Scholar
|
|
67
|
Pala M, Zappala Z, Marongiu M, Li X, Davis JR, Cusano R, Crobu F, Kukurba KR, Gloudemans MJ, Reinier F, et al: Population- and individual-specific regulatory variation in Sardinia. Nat Genet. 49:700–707. 2017. View Article : Google Scholar : PubMed/NCBI
|
|
68
|
Sammeth M, Foissac S and Guigó R: A general definition and nomenclature for alternative splicing events. PLoS Comput Biol. 4:e10001472008. View Article : Google Scholar : PubMed/NCBI
|
|
69
|
Lau E, Han Y, Williams DR, Thomas CT, Shrestha R, Wu JC and Lam MPY: Splice-junction-based mapping of alternative isoforms in the human proteome. Cell Rep. 29:3751–3765.e5. 2019. View Article : Google Scholar : PubMed/NCBI
|
|
70
|
Monteuuis G, Wong JJL, Bailey CG, Schmitz U and Rasko JEJ: The changing paradigm of intron retention: Regulation, ramifications and recipes. Nucleic Acids Res. 47:11497–11513. 2019.PubMed/NCBI
|
|
71
|
Tress ML, Abascal F and Valencia A: Alternative splicing may not be the key to proteome complexity. Trends Biochem Sci. 42:98–110. 2017. View Article : Google Scholar
|
|
72
|
Blencowe BJ: The relationship between alternative splicing and proteomic complexity. Trends Biochem Sci. 42:407–408. 2017. View Article : Google Scholar : PubMed/NCBI
|
|
73
|
Huang H, Tong TT, Yau LF, Wang JR, Lai MH, Zhang CR, Wen XH, Li SN, Li KY, Liu JQ, et al: Chemerin isoform analysis in human biofluids using an LC/MRM-MS-based targeted proteomics approach with stable isotope-labeled standard. Anal Chim Acta. 1139:79–87. 2020. View Article : Google Scholar : PubMed/NCBI
|
|
74
|
Hamouda NN, Van den Haute C, Vanhoutte R, Sannerud R, Azfar M, Mayer R, Calabuig ÁC, Swinnen JV, Agostinis P, Baekelandt V, et al: ATP13A3 is a major component of the enigmatic mammalian polyamine transport system. J Biol Chem. 296:1001822021. View Article : Google Scholar :
|
|
75
|
Yuan J, Xing H, Li Y, Song Y, Zhang N, Xie M, Liu J, Xu Y, Shen Y, Wang B, et al: EPB41 suppresses the Wnt/β-catenin signaling in non-small cell lung cancer by sponging ALDOC. Cancer Lett. 499:255–264. 2021. View Article : Google Scholar
|
|
76
|
Zhao X, Qin W, Jiang Y, Yang Z, Yuan B, Dai R, Shen H, Chen Y, Fu J and Wang H: ACADL plays a tumor-suppressor role by targeting Hippo/YAP signaling in hepatocellular carcinoma. NPJ Precis Oncol. 4:72020. View Article : Google Scholar : PubMed/NCBI
|
|
77
|
Yu G, Zhao Y and Li H: The multistructural forms of box C/D ribonucleoprotein particles. RNA. 24:1625–1633. 2018. View Article : Google Scholar : PubMed/NCBI
|
|
78
|
Yang YG, Sari IN, Zia MF, Lee SR, Song SJ and Kwon HY: Tetraspanins: Spanning from solid tumors to hematologic malignancies. Exp Hematol. 44:322–328. 2016. View Article : Google Scholar
|
|
79
|
Zhang Y, Qian J, Gu C and Yang Y: Alternative splicing and cancer: A systematic review. Signal Transduct Target Ther. 6:782021. View Article : Google Scholar : PubMed/NCBI
|
|
80
|
Selvanathan SP, Graham GT, Erkizan HV, Dirksen U, Natarajan TG, Dakic A, Yu S, Liu X, Paulsen MT, Ljungman ME, et al: Oncogenic fusion protein EWS-FLI1 is a network hub that regulates alternative splicing. Proc Natl Acad Sci USA. 112:E1307–E1316. 2015. View Article : Google Scholar : PubMed/NCBI
|
|
81
|
Boulay G, Sandoval GJ, Riggi N, Iyer S, Buisson R, Naigles B, Awad ME, Rengarajan S, Volorio A, McBride MJ, et al: Cancer-specific retargeting of BAF complexes by a prion-like domain. Cell. 171:163–178.e19. 2017. View Article : Google Scholar
|
|
82
|
Spahn L, Siligan C, Bachmaier R, Schmid JA, Aryee DNT and Kovar H: Homotypic and heterotypic interactions of EWS, FLI1 and their oncogenic fusion protein. Oncogene. 22:6819–6829. 2003. View Article : Google Scholar : PubMed/NCBI
|
|
83
|
Lee MJ and Yaffe MB: Protein regulation in signal transduction. Cold Spring Harb Perspect Biol. 8:a0059182016. View Article : Google Scholar : PubMed/NCBI
|
|
84
|
Dvinge H: Regulation of alternative mRNA splicing: Old players and new perspectives. FEBS Lett. 592:2987–3006. 2018. View Article : Google Scholar : PubMed/NCBI
|
|
85
|
Knoop LL and Baker SJ: EWS/FLI alters 5′-splice site selection. J Biol Chem. 276:22317–22322. 2001. View Article : Google Scholar : PubMed/NCBI
|
|
86
|
Sanchez G, Bittencourt D, Laud K, Barbier J, Delattre O, Auboeuf D and Dutertre M: Alteration of cyclin D1 transcript elongation by a mutated transcription factor up-regulates the oncogenic D1b splice isoform in cancer. Proc Natl Acad Sci USA. 105:6004–6009. 2008. View Article : Google Scholar : PubMed/NCBI
|
|
87
|
Zhu X, Lan B, Yi X, He C, Dang L, Zhou X, Lu Y, Sun Y, Liu Z, Bai X, et al: HRP2-DPF3a-BAF complex coordinates histone modification and chromatin remodeling to regulate myogenic gene transcription. Nucleic Acids Res. 48:6563–6582. 2020. View Article : Google Scholar : PubMed/NCBI
|
|
88
|
Nguyen H, Sokpor G, Pham L, Rosenbusch J, Stoykova A, Staiger JF and Tuoc T: Epigenetic regulation by BAF (mSWI/SNF) chromatin remodeling complexes is indispensable for embryonic development. Cell Cycle. 15:1317–1324. 2016. View Article : Google Scholar :
|
|
89
|
Nguyen H, Kerimoglu C, Pirouz M, Pham L, Kiszka KA, Sokpor G, Sakib MS, Rosenbusch J, Teichmann U, Seong RH, et al: Epigenetic regulation by BAF complexes limits neural stem cell proliferation by suppressing wnt signaling in late embryonic development. Stem Cell Reports. 10:1734–1750. 2018. View Article : Google Scholar : PubMed/NCBI
|
|
90
|
Grote P and Herrmann BG: The long non-coding RNAFendrrlinks epigenetic control mechanisms to gene regulatory networks in mammalian embryogenesis. RNA Biol. 10:1579–1585. 2013. View Article : Google Scholar : PubMed/NCBI
|
|
91
|
Innis SM and Cabot B: GBAF, a small BAF sub-complex with big implications: A systematic review. Epigenetics Chromatin. 13:482020. View Article : Google Scholar : PubMed/NCBI
|
|
92
|
Sveen A, Kilpinen S, Ruusulehto A, Lothe RA and Skotheim RI: Aberrant RNA splicing in cancer; expression changes and driver mutations of splicing factor genes. Oncogene. 35:2413–2427. 2016. View Article : Google Scholar
|
|
93
|
El Marabti E and Younis I: The cancer spliceome: Reprograming of alternative splicing in cancer. Front Mol Biosci. 5:802018. View Article : Google Scholar : PubMed/NCBI
|
|
94
|
Hu-Lieskovan S, Zhang J, Wu L, Shimada H, Schofield DE and Triche TJ: EWS-FLI1 fusion protein up-regulates critical genes in neural crest development and is responsible for the observed phenotype of Ewing's family of tumors. Cancer Res. 65:4633–4644. 2005. View Article : Google Scholar : PubMed/NCBI
|


