Introduction
Pancreatic adenocarcinoma (PDAC) is a leading cause
of cancer-related mortality in Western countries; most patients
with PDAC are diagnosed with advanced disease and survive <12
months after diagnosis (1,2). Although surgery, neoadjuvant
chemotherapy, radiation therapy and other treatments have been
employed over previous decades, the overall survival rate of
patients with PDAC has not improved markedly (3). Thus, patients with PDAC have a poor
prognosis and high rates of mortality. Therefore, precision
treatment of PDAC is important in increasing the survival rate and
improving therapeutic options for different stages of PDAC.
Metabolomics has emerged as a field that elucidates
pathological mechanisms (4),
improves disease diagnosis (5),
screens biomarkers (6,7) and provides improved assessments of
the rationality of drugs (8).
Additionally, metabolomics is downstream of other 'omics', such as
genomics, transcriptomics and proteomics, and analyzes biosynthetic
and catabolic pathways involving multiple compounds, such as the
cellular, tissue, biofluid and other physiological environments.
Metabolomics can identify potential interactions between genes,
enzymes, metabolic reactions or metabolic compounds; for example,
glutamine metabolism can support pancreatic cancer growth via a
KRAS-driven pathway (9,10).
Therefore, metabolomics represents a powerful tool to profile
tumors and identify precision treatment strategies (11,12).
PDAC tumors, like numerous tumors, exhibit altered
metabolism in order to meet the needs of unconstrained
proliferation (13). Abnormal
energy utilization in cancer was first recognized by Warburg
(14), who noted that cancer cells
primarily rely on glycolysis followed by lactic acid fermentation
for ATP production, despite the availability of oxygen. This
process is commonly referred to as 'aerobic glycolysis' (15). In addition, other metabolic
pathways, such as lipid or fatty acid metabolism, and amino acid
metabolism, are found to be defective in PDAC (16). Hence, metabolon studies are
important for PDAC research. The comparison of metabolic profiles
between various types of pancreatic cancer may allow clinicians to
detect an altered pancreatic profile at early stages, enabling
early diagnosis of pancreatic cancer. Therefore, it is critical to
identify PDAC biomarkers for further studies. Certain metabolites,
such as leucine, isoleucine, valine, lactate, alanine,
phosphocholine, glycerophosphocho-line, taurine, betaine, taurine,
creatine and glutamate, were reported to be potential biomarkers of
PDAC in tissues (17,18). Furthermore, metabolic studies have
revealed the pathogenesis of PDAC, allowing researchers to look for
potential targets for drug therapy. For example, PDAC relies on
increased utilization of glutamine to fuel anabolic processes
(16). Drawing on the
aforementioned knowledge, researchers have identified a
non-canonical pathway of glutamine metabolism involving a
KRAS-driven pathway, which is required for tumor growth
(4).
However, the lack of well-annotated biological
materials with long-term storage capability is a bottleneck in
human tissue metabolomics research. At present, formalin-fixed
paraffin-embedded (FFPE) materials are widely utilized in
metabolomics and other 'omics' research (19). Due to the widespread availability
and long-term stability of FFPE materials, accurately profiling the
metabolite content of these tumor samples could assist in
identifying biomarkers for clinical diagnosis.
There are three powerful analytical techniques
applied for the assay and quantification of metabolites; liquid
chromatography (LC) coupled with mass spectrometry (MS), gas
chromatography coupled with MS and nuclear magnetic resonance
(20). In addition, Fourier
transform ion cyclotron resonance MS coupled to matrix-assisted
laser desorption/ionization has also been utilized for metabolic
analysis (19). Using this
platform, the overlap of m/z species detected in FFPE samples was
72% compared with fresh frozen samples.
While there is literature on metabolomic profiling
using FFPE materials in studies of sarcomas and prostate cancer,
few publications have demonstrated the effect of metabolomic
profiling from PDAC FFPE tissue samples (21,22).
In the present study, optical cutting temperature (OCT)-embedded
and FFPE human pancreatic cancer tissue samples were compared using
ultra-performance (UP)LC-MS/MS-based metabolomics to explore the
metabolites preserved in FFPE. Physical and chemical properties of
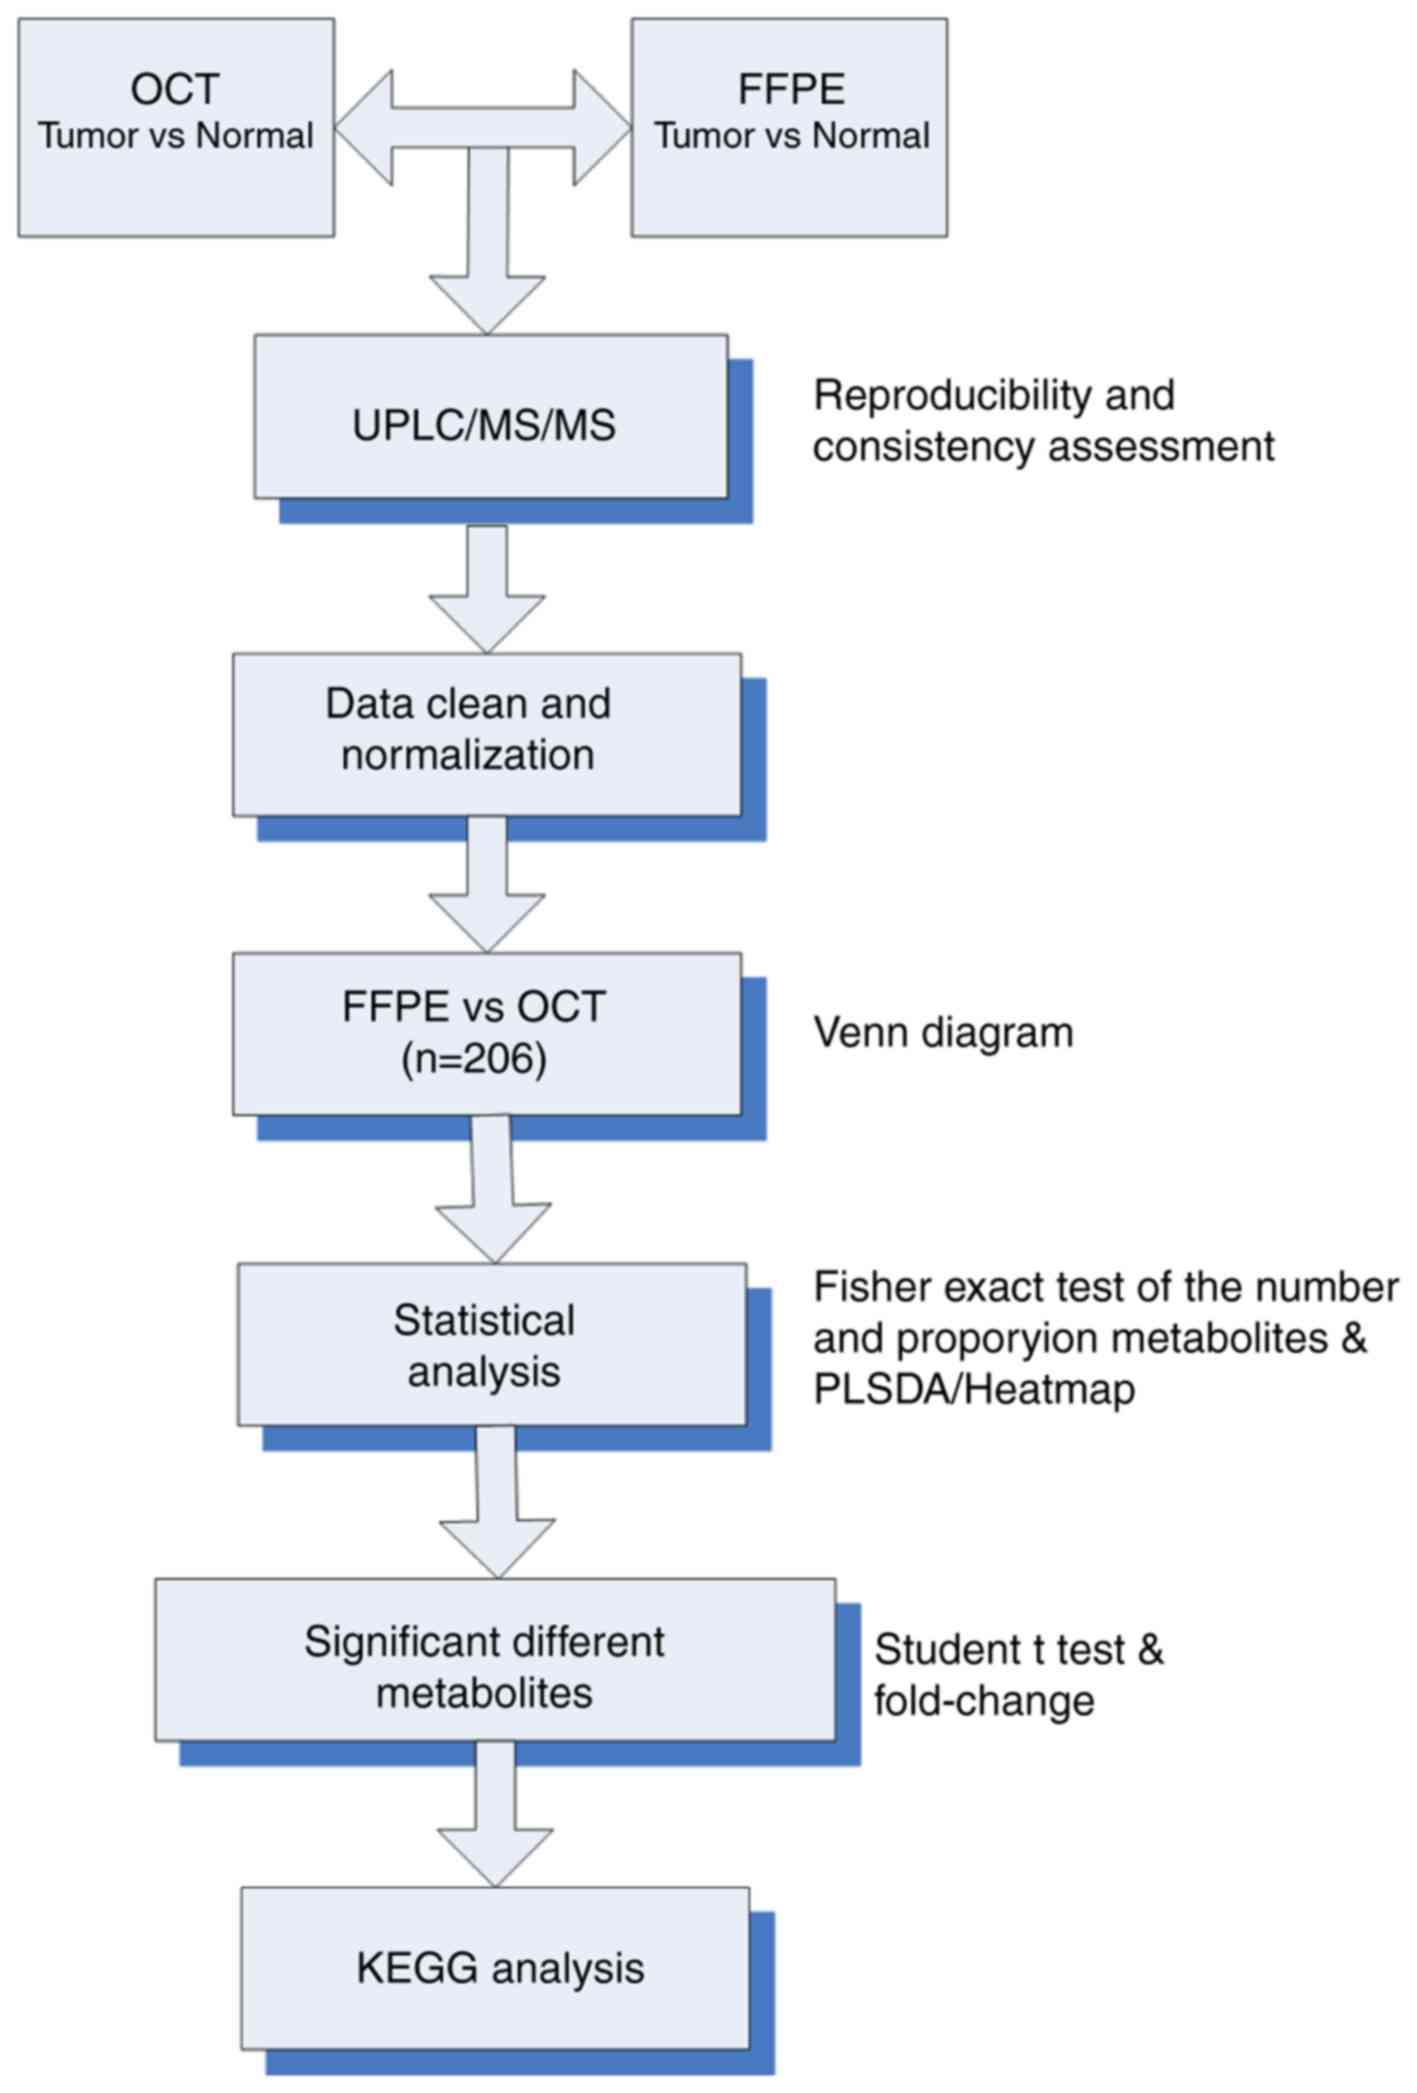
the metabolites were also investigated. This study examined the
method's feasibility through reproducibility and a consistency
assessment. In addition, differential metabolites and pathways were
explored to examine whether tissues were malignant or
non-malignant.
Materials and methods
Human pancreatic tissue
A total of 13 patients with PDAC were selected in
between July and September 2018 (age range, 41-71 years; mean age
60.0±7.3 years; gender, 7 male and 6 female). Demographic profiles
of all patients are presented in Table
I. Both tumor and normal OCT-embedded and FFPE tissues were
extracted and processed from each patient at Chinese PLA General
Hospital (Beijing, China). Samples were obtained during surgical
resection. An OCT compound medium (Sakura Finetek USA, Inc.)
containing 10.24% w/w polyvinyl alcohol, 4.26% w/w polyethylene
glycol and 85.50% w/w of a nonreactive ingredient was used to
create the blocks (23). The
sample collection protocol was approved by the Institutional Review
Board of the Chinese PLA General Hospital (permit no.
S2018-041-01), and all subjects provided informed consent for
inclusion in the study. The OCT-embedded and FFPE tissue sections
were collected by the Department of Pathology at Chinese PLA
General Hospital according to protocols as described previously
(24). Tissue blocks were
sectioned at 20 µm and stained with hematoxylin and eosin to
delineate tumor and healthy areas in each block. In brief, the
normal tissue specimen was taken from areas directly adjacent to
the tumor areas. The FFPE tissue blocks were stained with
hematoxylin for 10 min at room temperature and eosin for 30 sec at
room temperature. After that each slide was dehydrated in ethanol
(70-100%) for 12 min and 100% xylene for 3 min at room temperature,
and was covered with a coverslip and mounting neutral balsam medium
(Beijing Solarbio Science & Technology Co., Ltd.). Each tissue
block was observed under an optical microscope (magnification, ×100
and ×400) and images of at least ten fields of view were
captured.
 | Table IClinical features of pancreatic
adenocarcinoma cases. |
Table I
Clinical features of pancreatic
adenocarcinoma cases.
| Characteristic | Finding |
|---|
| Age (years) | 60.0±7.3 |
| Gender | |
| Male | 7 (54) |
| Female | 6 (46) |
| Cancer stage | |
| I | 4 (32) |
| II | 5 (38) |
| III | 2 (15) |
| IV | 2 (15) |
Extraction of metabolites
Methanol (80%; 1 ml) was added directly to each
OCT-embedded and FFPE tissue section and mixed thoroughly. Both
types of tissue sample were then incubated at 70°C for 45 min. All
samples were placed on ice for 30 min and centrifuged for 15 min at
14,000 × g at 4°C, and the supernatant was transferred into a new
1.5-m microcentrifuge tube. Centrifugation was repeated once under
the same conditions. Finally, each supernatant was collected into a
new microcentrifuge tube and stored at −80°C.
Untargeted metabolite profiling
The metabolite profiling of both FFPE and OCT tissue
samples were determined following protocols as previously reported
(25). All methods involved
utilized a Waters® ACQUITY I-CLASS UPLC (Waters
Corporation) and AB SCIEX QTRAP 5500 high resolution/accurate mass
spectrometer (SCIEX), which consisted of a heated electrospray
ionization source and Orbitrap mass analyzer at 35,000 mass
resolution. The temperature of column was to 30°C, the flow rate
was 300 µl/min and the sample injection volume was 2
µl. A series of internal standards at fixed concentrations
was added to reconstituted sample solutions to ensure injection and
chromatographic consistency. The resulting sample solution was
divided into three parts: First, one aliquot was assessed using
acidic positive ion-optimized conditions for hydrophilic compounds.
The aliquot was gradient eluted from a C18 column (Waters ACQUITY
UPLC® BEH C18-2.1×50 mm; 1.7 µm) using
chormatographic grade methanol (purity >99.99%) and acetonitrile
(purity >99.99%) as well as water phase containing 0.05%
perfluoropentanoic acid and 0.05% formic acid. The gradient program
was: 8% methanol, 4% acetonitrile and 88% water phase for 3 min,
increased to 12% methanol, 6% acetonitrile and 82% water phase over
1 min and hold for 4 min. Then increased to 30% methanol, 15%
acetonitrile and 55% water phase over 2 min and hold for 4 min,
followed by increase to 50% methanol, 25% acetonitrile and 25%
water phase over 3 min and hold for 5 min, and back to 8% methanol,
4% acetonitrile and 88% water phase over 1 min and hold for 3 min
to re-equilibrate the column. Second, the second aliquot was
analyzed using basic negative ion-optimized conditions using a
separate dedicated C18 column. For each analysis, the sample was
eluted from a gradient column using methanol and water containing 5
mM ammonium bicarbonate at pH 8. The gradient program was: 90%
methanol for 1.5 min, decreased to 75% methanol over 1 min and hold
for 3 min, decreased to 35% methanol over 3 min and hold for 3 min,
then decreased to 10% methanol over 1.5 min and hold for 3 min, and
back to 90% methanol over 1 min and hold for 5 min to
re-equilibrate the column. Finally, the third aliquot was
determined through negative ionization and gradient eluted from a
hydrophilic interaction liquid chromatographic column (Waters
ACQUITY UPLC® BEH Amide-2.1×50 mm; 1.7 µm) using
acetonitrile and water with 8 mM ammonium formate at pH 10. The
gradient program was: 85% methanol for 3 min, decreased to 40%
methanol over 4.5 min and hold for 2 min, then decreased to 15%
methanol over 3 min and hold for 5 min, and back to 85% methanol
over 1 min and hold for 5 min to re-equilibrate. Nitrogen was used
as the dry gas and the flow rate was 8 l/min, sheath gas
temperature was 400°C and the desolvation gas temperature was
350°C; the nebulizer pressure was 15 psi. The mass spectrum of each
sample was scanned between 70-1,000 m/z using dynamic exclusion
according to methods. Raw data files were archived and extracted as
described below.
Metabolite identification
MS raw data were pre-processed by MultiQuant 2.0
(SCIEX) as previously described (26). Compounds were identified in
comparison to library entries of purified standards or recurrent
unknown entities. Furthermore, biochemical properties of compounds
were identified as follows: Retention time within a narrow
retention time/index window of the proposed identified compound,
and accurate sample MS data ±10 ppm match to the library and the
MS/MS scores between the experimental mass spectra and authentic
standards. The MS/MS forward and reverse scores were based on a
comparison of the ions present in the experimental data to the
ions' spectra present in the library. While similarities may be
found among these molecules based on one of above factors, all
those data points above can be utilized to distinguish different
compounds. All identified metabolites were divided into eight
super-classes (nucleotide, cofactors and vitamins, xenobiotics,
amino acid, lipid, carbohydrate, energy and peptide) and
consequently several sub-classes based on previous reports
(27).
Statistical analysis
Detailed information regarding the categorization of
metabolites detectable in FFPE and OCT-embedded samples
(super-class and subclass), substituents (an atom or group of atoms
taking the place of another atom group or occupying a specific
position in a molecule) and chemical/physical properties can be
obtained from the Human Metabolome Database (HMDB; http://www.hmdb.ca/) (28,29),
Small Molecule Pathway Database (http://www.smpdb.ca), and Kyoto Encyclopedia of Genes
and Genomes (KEGG; http://www.genome.jp/kegg).
The identified metabolite data were pre-processed
prior to conducting further analysis. The raw peak intensity table
was inputted into MetaboAnalyst 4.0 (http://www.metaboanalyst.ca), an online platform
intended for metabolomic analysis (30,31).
For multivariant analysis, the cutoff was set at 77% to ensure
compounds that may be detected exclusively in one class were not
excluded (FFPE or OCT-embedded). Otherwise, the missing values were
input as half of the minimum positive value in the original data.
Next, data filtering was performed; variables were removed if their
relative standard deviation was >25%. For completeness sake,
normalization was also conducted based on the median followed by
log2 transformation and mean centering (mean-centered
only). The resultant data were used for further analysis.
R software (version 3.5.1) was used for all
statistical analyses (32). The
Fisher exact test was used to evaluate the differences in a number
of metabolites belonging to a specific category detected or
non-detected in FFPE samples. Pearson correlation analysis was used
to correlate metabolites between FFPE and OCT-embedded samples.
Pairwise comparisons of physical/chemical properties of metabolites
were performed according to the Mann-Whitney test.
Benjamini-Hochberg false discovery rate (FDR) correction was used
to adjust all P-values and reduce false-positive discovery for
multiple testing (33). The q
conversion algorithm was used to calculate FDRs in multiple
comparisons (33). The threshold
for significance was FDR<0.05 for all tests.
To distinguish between normal and tumor groups in
the OCT-embedded and FFPE samples, a partial least-squares
discriminant analysis (PLS-DA) was performed. All compounds in
heatmaps were ordered via hierarchical clustering (Ward linkage)
implemented in the R package ggplot2 (32). Then, the 40 common metabolites with
the most significant P-values as determined by Student's t-test
were selected.
Volcano diagram analysis was performed in
MetabolAnalyst 4.0 platform (http://www.metaboanalyst.ca), to identify metabolites
presenting significant differences between the tumor and normal
groups. P-values were calculated by Student's t-test, and the fold
change (FC) of tumor/normal was calculated. The differential
metabolites were identified by a P<0.05 and an FC>1.5.
Pathway analysis was also performed using the
MetaboAnalyst 4.0 platform. First, HMBD IDs of the differential
compounds between OCT-embedded and FFPE samples were inputted into
the platform. The differential compounds were identified by
Student's t-test; FC and HMDB IDs are available in the HMDB. The
pathway library used for pathway analysis was 'Homo sapiens
(human)'. Representation analysis was conducted using the
hypergeometric test, and pathway topology analysis was conducted
using the relative-betweenness centrality. If compounds involved
within the pathway belonged to OCT-embedded and FFPE samples, the
pathway would be defined as a shared pathway. In order to analyze a
correlation network of the compounds in shared pathways, MetScape
(34), an app implemented in Java
and integrated with Cytoscape (version 3.2.1), was used (35). KEGG IDs, P-values and log2 FCs of
selected compounds were inputted into the app, and Compound-Gene
was selected to build a network. Once the core program was
completed, the compound-gene network was created, and the node
color was set based on the log2 FC of each metabolite.
Results
Human pancreatic tissue samples
OCT-embedded and FFPE tissue slices from 13 patients
with pancreatic cancer were collected. Both tumor and normal
OCT-embedded and FFPE tissue samples were collected from each
patient during surgical resection. Patient details are summarized
in Table I. FFPE samples were
stained with H&E to identify the tumor and normal tissue areas
in each block. Fig. S1 presents
the distinction between tumor tissue and normal tissue, indicating
that the tissue architecture was preserved and could be used for
further analysis. As shown in the figure, tumor cells were severely
atypia and the glands were irregular, which infiltrated in the
desmoplastic stroma. However, the tissue in normal blocks presented
without atypia.
Reproducibility and consistency
assessment
After UPLC-MS/MS profiling, a total of 570 and 210
metabolites were identified in OCT-embedded and FFPE samples,
respectively. However, a high rate of missing values caused
difficulties for downstream analysis. To combat this issue, a rule
to clear data for further analysis was generated, which excluded
any metabolites absent from ≥77% of the raw data obtained from
UPLC-MS/MS experiments. The remaining missing values were input as
half of the minimum positive value in the original data. Then, a
data filtering and normalization process was conducted. The
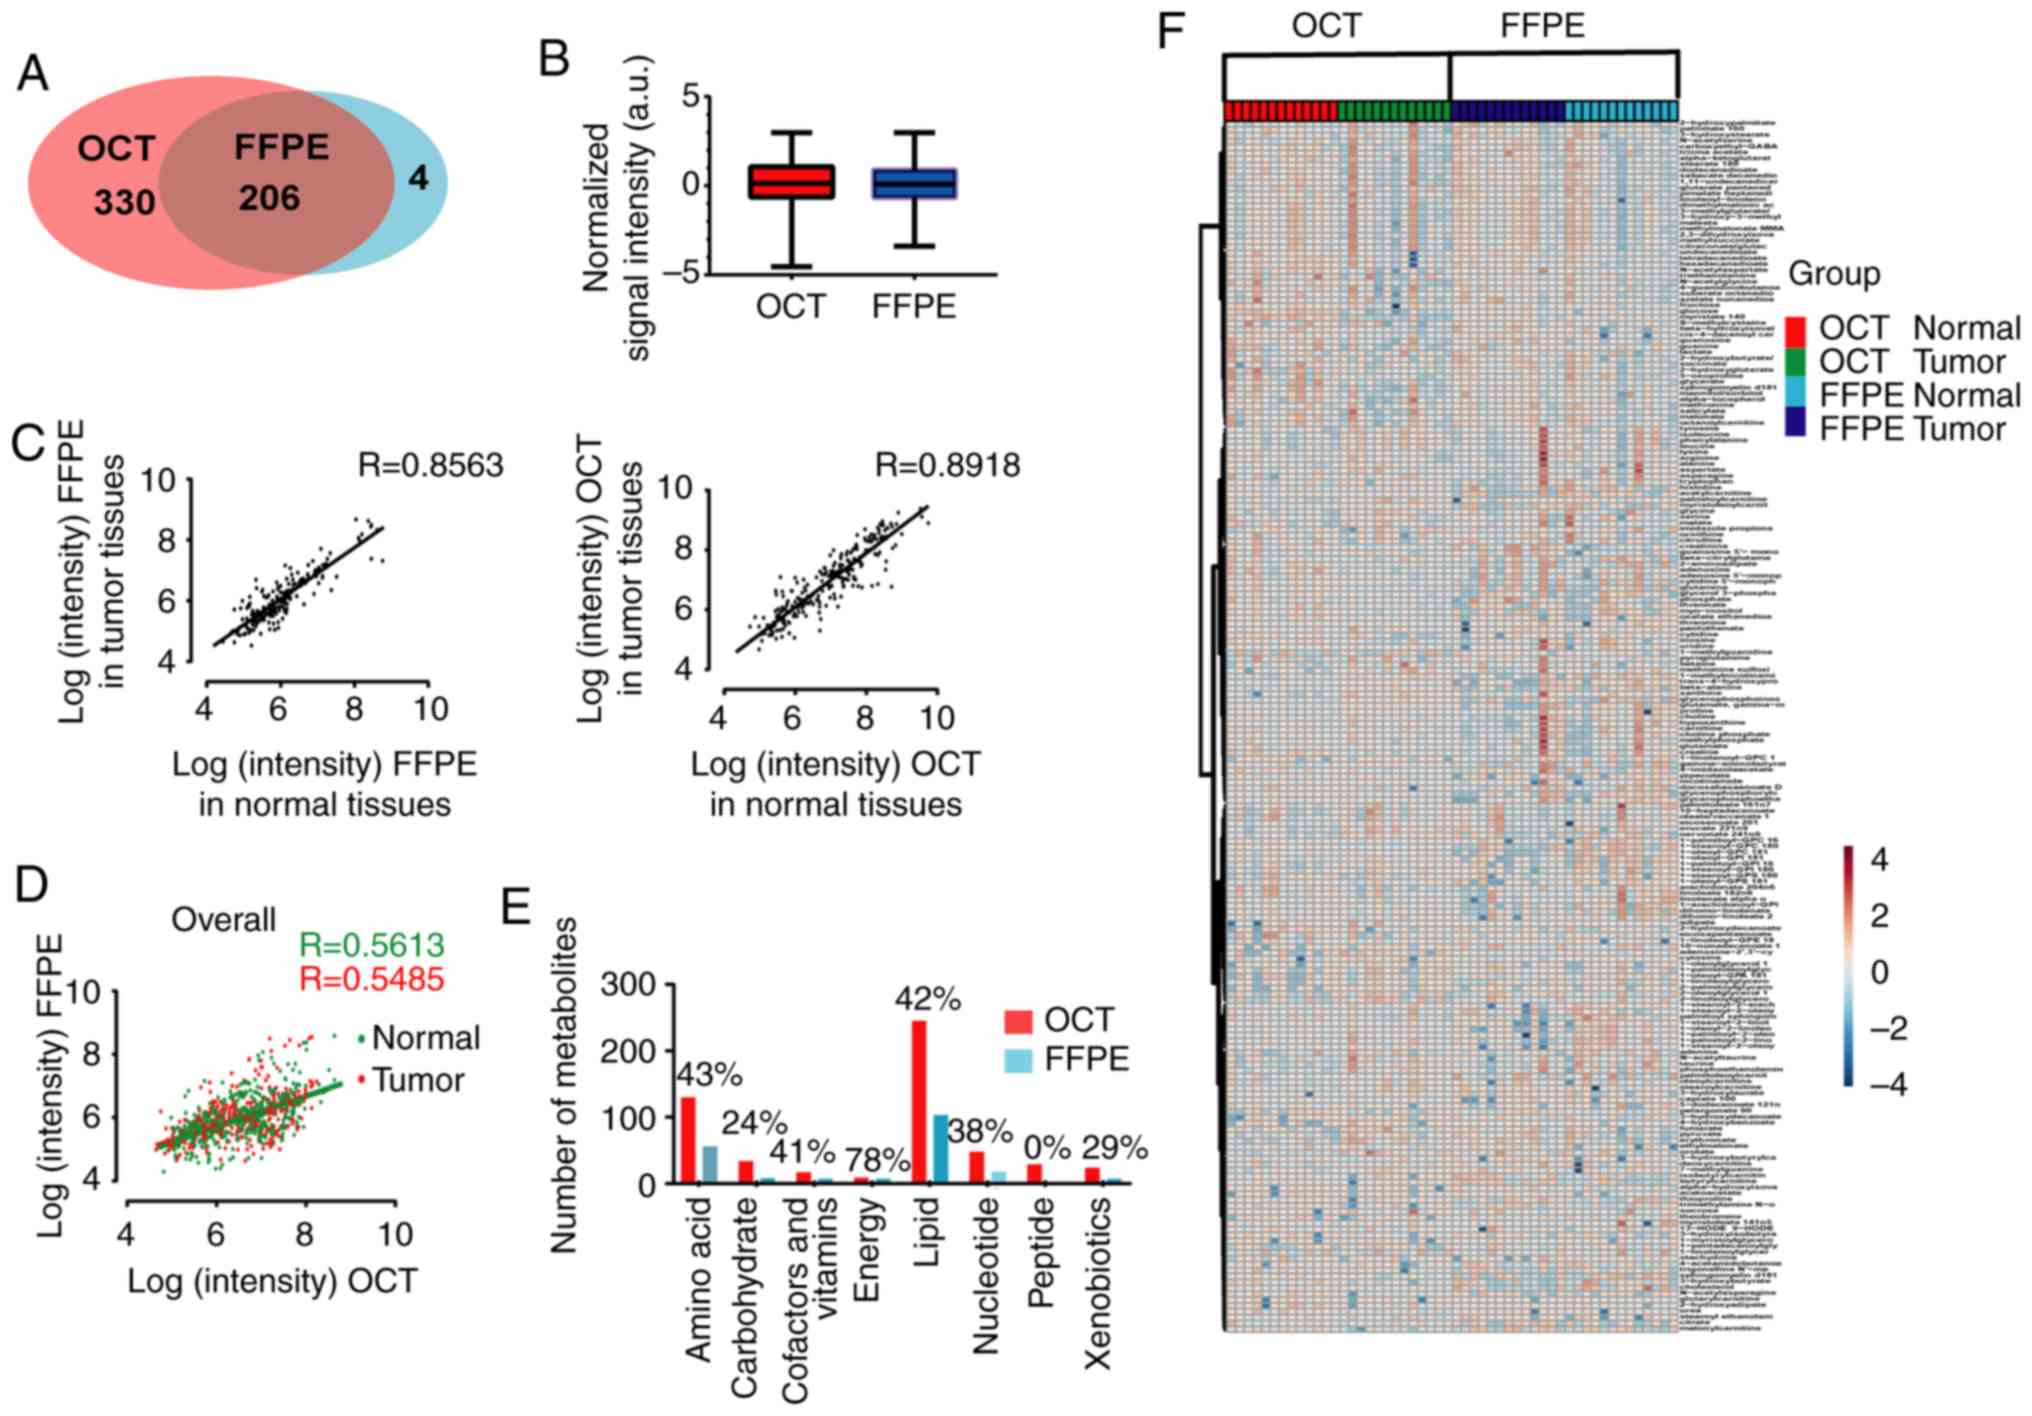
specific protocol was presented in Fig. 1. Finally, a total of 206
metabolites passed the filtering criteria and were preserved in
both FFPE and OCT-embedded samples; an additional 330 metabolites
were detected only in frozen OCT-embedded samples, and 4 were found
only in FFPE samples (Fig. 2A).
The relative signal intensities of all shared metabolites found in
OCT-embedded and FFPE samples are presented in Fig. 2B.
To assess data reproducibility in FFPE or
OCT-embedded replicates, Pearson correlation analysis was conducted
for the 206 shared metabolites in the 13 patients. As shown in
Fig. 2C, the correction
coefficients calculated in FFPE samples (normal vs. tumor) ranged
between 0.844 and 0.864 (median value, 0.856), indicating little
variability among samples and verifying the feasibility of the
method. Similar to the results obtained with FFPE sample
replicates, OCT-embedded sample replicates indicated high degree of
reproducibility ranging between 0.884 and 0.900 (median value,
0.892; Fig. 2C).
The median of correlation coefficients between FFPE
and OCT-embedded samples were 0.561 (ranging between 0.532 and
0.589) and 0.549 (ranging between 0.519 to 0.577) in normal and
tumor groups, respectively (Fig.
2D).
The consistency in the seven metabolite
super-classes between OCT-embedded and FFPE samples were presented
in Fig. S2. The correlation
coefficients were calculated for each metabolite super class,
including nucleotide, cofactors and vitamins, xenobiotics, amino
acid, lipid, carbohydrate and energy. The median value of the
correction coefficients was >0.500, except for carbohydrate
(r=0.380 in normal tissues and r=0.487 in tumor tissues) and
cofactors and vitamins (r=0.258 in normal tissues and r=0.095 in
tumor tissues).
Metabolites preserved in FFPE tissue
samples
To examine the similarity of metabolomic data
between FFPE and OCT-embedded tissues, the study focused on the 206
shared metabolites found in both types of samples, and the 330 only
preserved in OCT-embedded samples. As shown in Fig. 2E, it was confirmed that only
several classes of metabolites could be recovered in FFPE samples.
The present study then compared the rate of detection in FFPE
samples with the corresponding OCT-embedded samples according to
the class of the metabolite. Using a Fisher exact test, the
differences in detected or undetected FFPE samples were evaluated.
The P-values and FDR are listed in Table SI. The metabolites belonging to
nucleotide, cofactors and vitamins, xenobiotics, amino acid, lipid
and carbohydrate super-classes presented no significant difference
between FFPE and OCT-embedded samples (P>0.05), illustrating
that the extent to which these metabolites were preserved in FFPE
samples was similar to their OCT-embedded counterparts. Of note,
103 of 245 lipids were preserved in FFPE groups (42%; P=0.13;
FDR=0.26). It was also found that metabolites in the lipid class
had good detectability, such as sterol (33%; P>0.999; FDR=1.00)
and lysolipid (41%; P=0.85; FDR=1.00). Conversely, no peptides were
preserved in FFPE samples (0%; P=5.46×10⁻⁷;
FDR=4.37×10⁻⁶). In addition, metabolites in each
sub-class were compared between OCT-embedded and FFPE groups, and
certain similarities between the two groups were identified,
including metabolites belonging to purine, adenine, pyrimidine,
orotate, urea, arginine and proline metabolism subclasses (all
FDR>0.05). Meanwhile, the differences between the
chemical/physical properties were evaluated using the
non-parametric Wilcoxon-Mann-Whitney test (Table SI). Metabolites retained in FFPE
were characterized by a lower molecular weight
(P=2.20×10⁻¹⁶; FDR=2.64×10⁻¹⁵),
polarizability (P=8.32×10⁻⁹; FDR=4.99×10⁻⁸)
and refractivity (P=4.41×10⁻⁸;
FDR=1.76×10⁻⁷), as well as higher solubility
(P=2.04×10⁻²; FDR=3.06×10⁻²) and pKa
(P=2.63×10⁻⁴; FDR=5.26×10⁻⁴). To perform a
comparative analysis between FFPE and OCT-embedded tissues, the
study focused on the 206 shared metabolites found in both types of
samples. Hierarchical clustering was used to distinguish
metabolites significantly different between OCT-embedded and FFPE
materials (Fig. 2F).
Exploration of differential metabolites
between pancreatic cancer and normal tissues
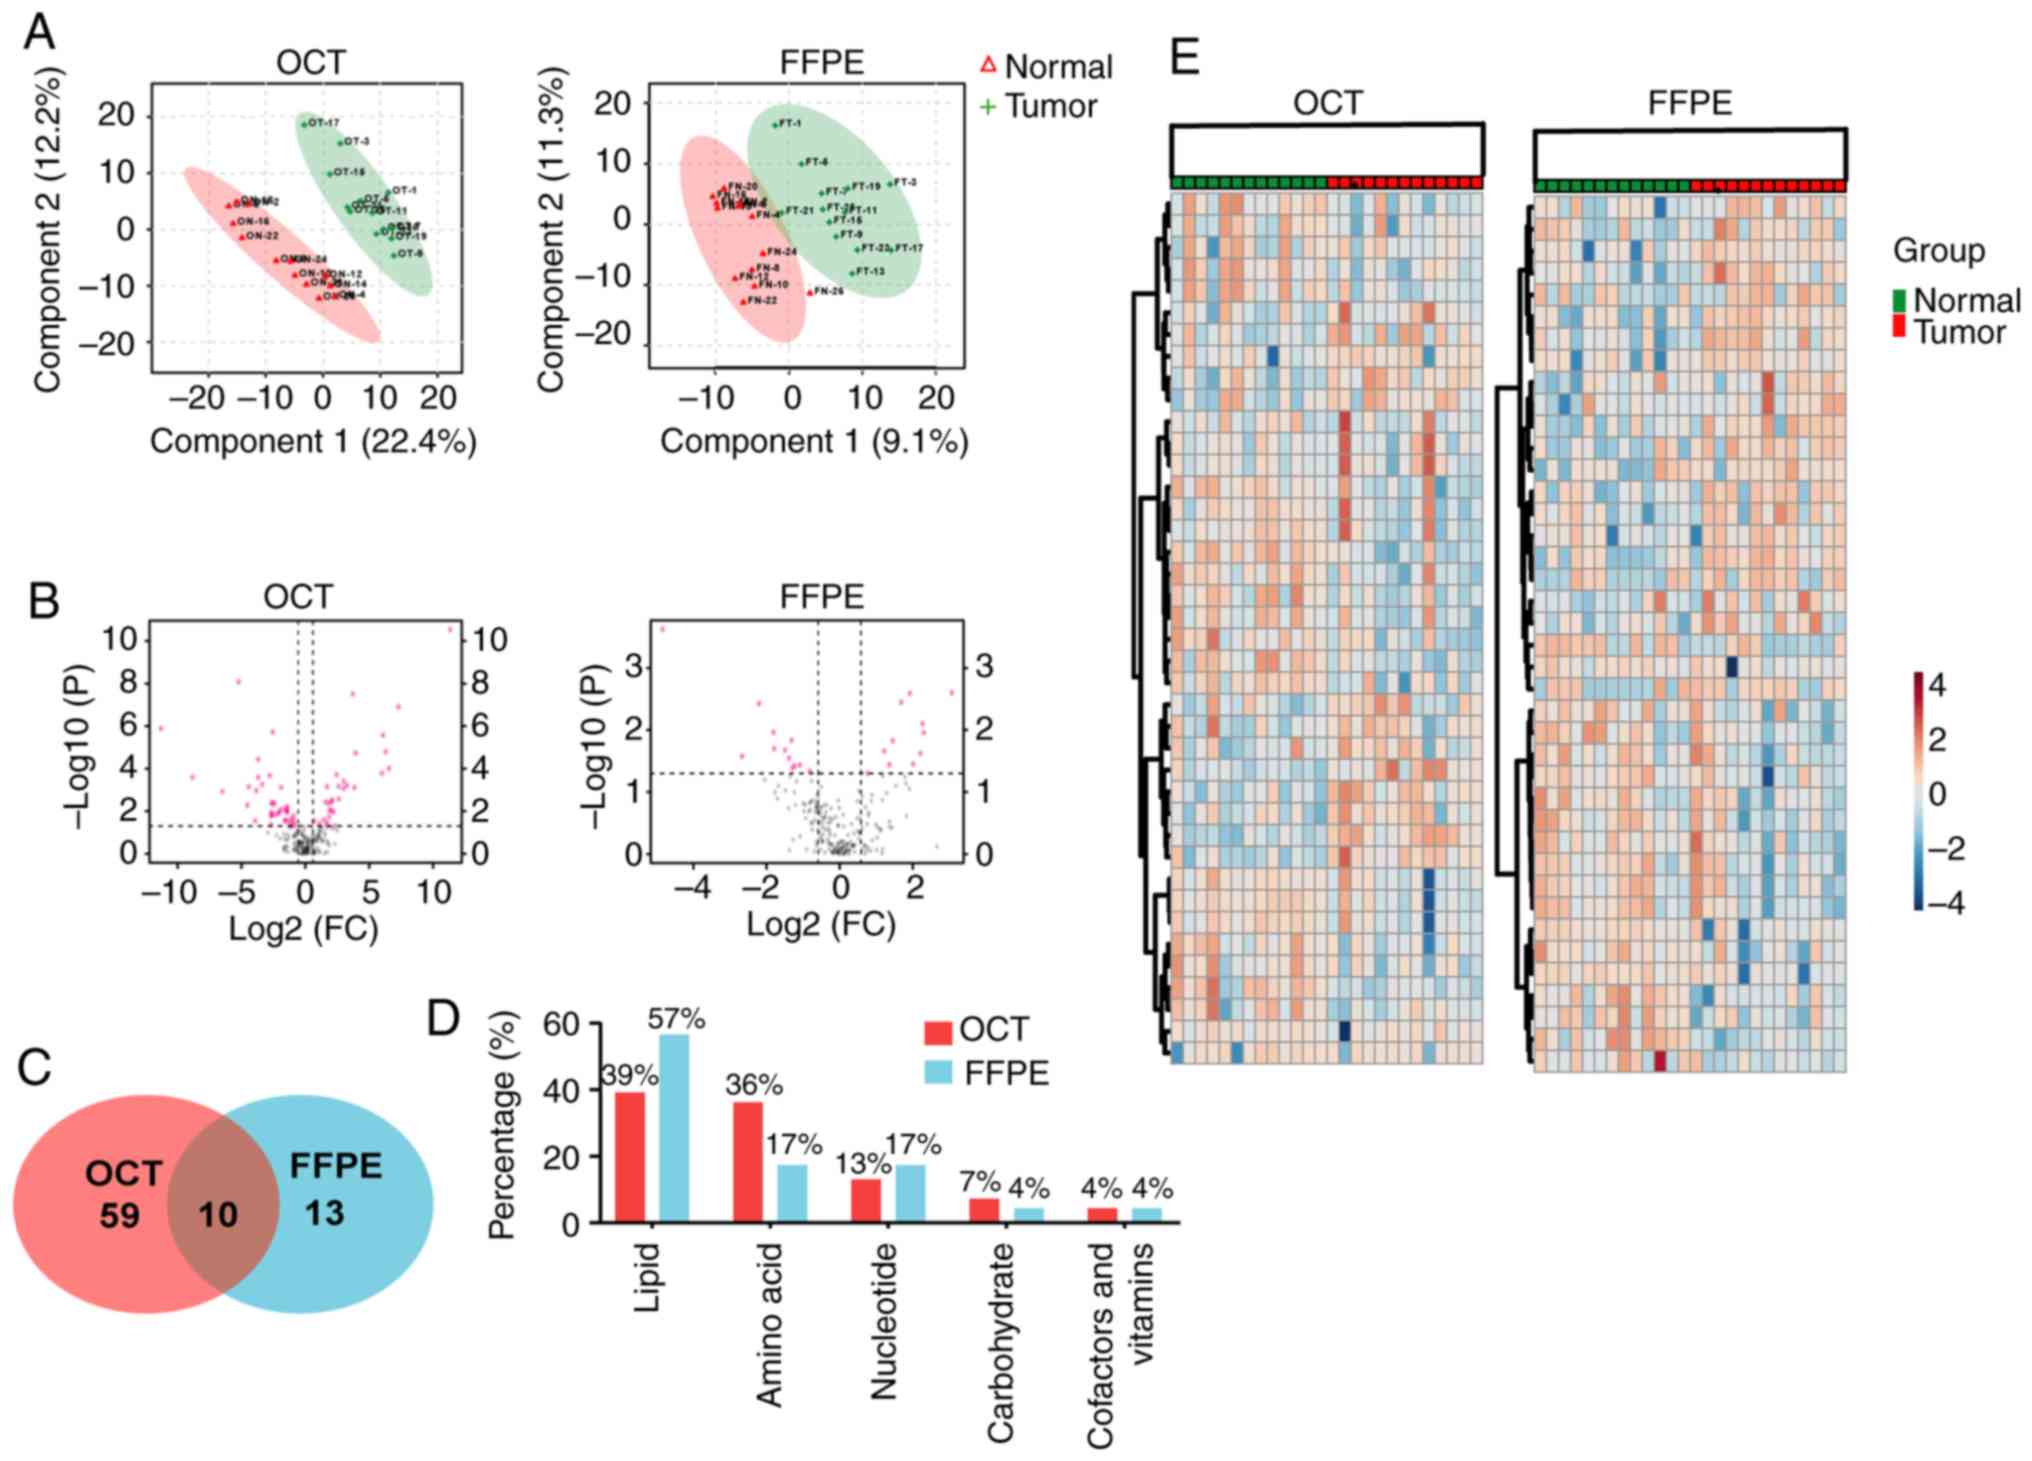
Distinguishing tumor groups from normal groups in
tissue samples is vital for further diagnosis. Using normalized
data, PLS-DA was attempted. In anticipation of this, the tumor
cohorts were separated from the normal cohorts in the
two-dimensional score plots (Fig.
3A).
Analysis was performed to elucidate which
metabolites were present in tumor but not normal tissue, and vice
versa. Therefore, a Student's t-test was performed, and the FC
between tumor and normal groups was calculated for the 206 shared
metabolites. The metabolites with significant differences were
defined as having an FC>1.5 and P<0.05, respectively. In the
volcano diagram shown in Fig. 3B,
the red dots represent metabolites with significant differences.
Overall, 69 of the 206 total metabolites were significantly
different between normal and tumor tissue in OCT-embedded samples;
only 23 of 206 metabolites were significantly different in FFPE
samples (Fig. 3C; Table SII). Among the different tissue
types, 39 were increased in tumor tissue, and 45 were
downregulated. Most of these compounds in tumor tissues could be
categorized as lipid, amino acids and nucleotides both in
OCT-embedded and FFPE samples (Fig.
3D). Using the top 40 common metabolites, normal and tumor
tissues were delineated both in OCT-embedded samples and FFPE
material (Fig. 3E). A total of 10
metabolites, including N-acetylaspartate, β-hydroxyisovalerate,
creatinine and guanosine, were significantly differentially
expressed in both OCT-embedded and FFPE tumor samples (Fig. 3C; Table SIII). These candidates included
amino acids, lipid, nucleotides, carbohydrate cofactors and
vitamins, which showed no significant difference between FFPE and
OCT-embedded samples (P>0.05; Tables SI and SIII).
Discovery of shared metabolism pathways
in both OCT-embedded and FFPE samples
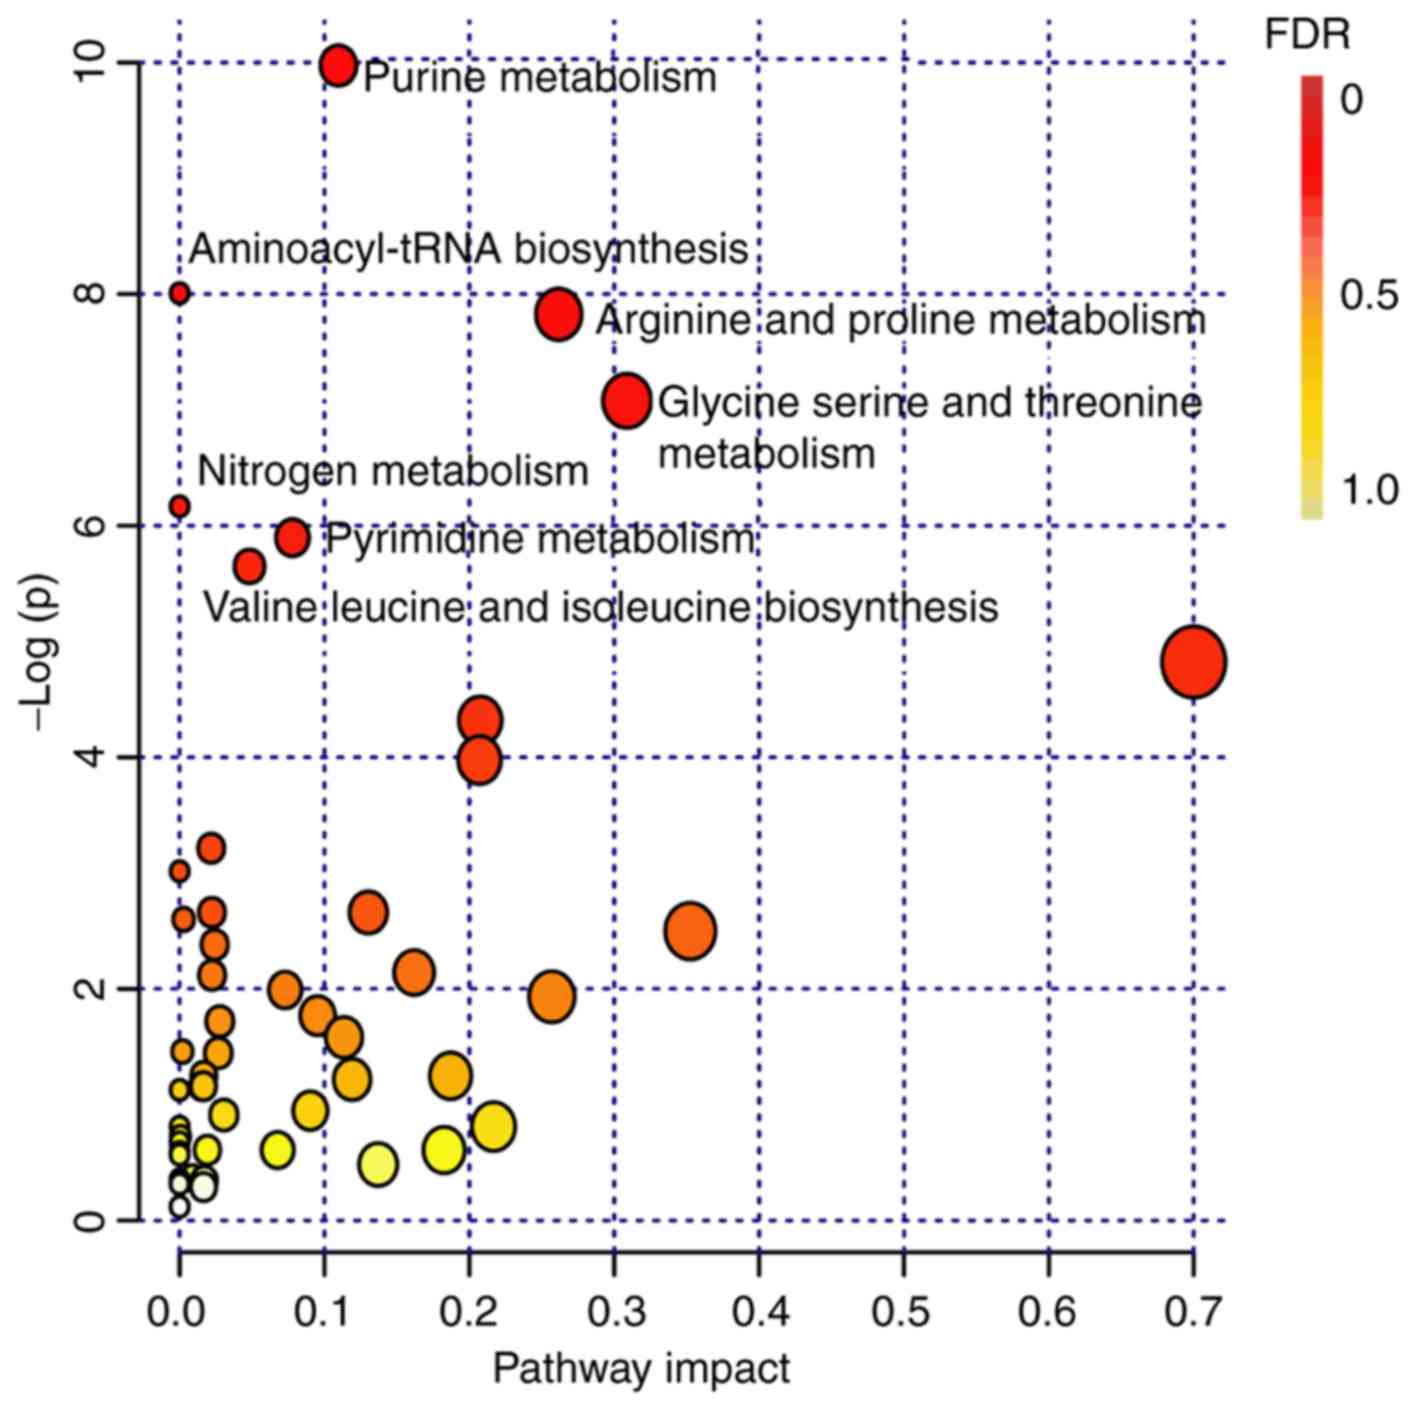
To investigate the metabolism of metabolites
significant differentially expressed between tumor and healthy
tissues, pathway analysis was performed. All differential
metabolites in OCT-embedded or FFPE samples were selected for
analysis. Finally, seven metabolic pathways were identified as
meaningful (FDR<0.05; Fig. 4;
Table SIV), most of which were
involved in amino acid metabolism and production. To find the
shared metabolic pathways from these seven metabolic pathways, a
filter rule was defined: The compounds in the metabolic pathways
should belong to either OCT-embedded groups or FFPE groups.
However, only three metabolic pathways, namely purine metabolism
(FDR=3.73×10⁻³), arginine and proline metabolism
(FDR=1.07×10⁻²) and pyrimidine metabolism
(FDR=3.67×10⁻²) were shared between both OCT-embedded
and FFPE samples. The compounds involved with the three common
pathways were listed in Table SV
and can be classified under the amino acid, nucleotide and
carbohydrate super-classes. These correspond with the previous
analysis, indicating that the three categories were not
significantly differently enriched between FFPE and OCT-embedded
samples (P>0.05). The same results also appeared in their
respective sub-classes.
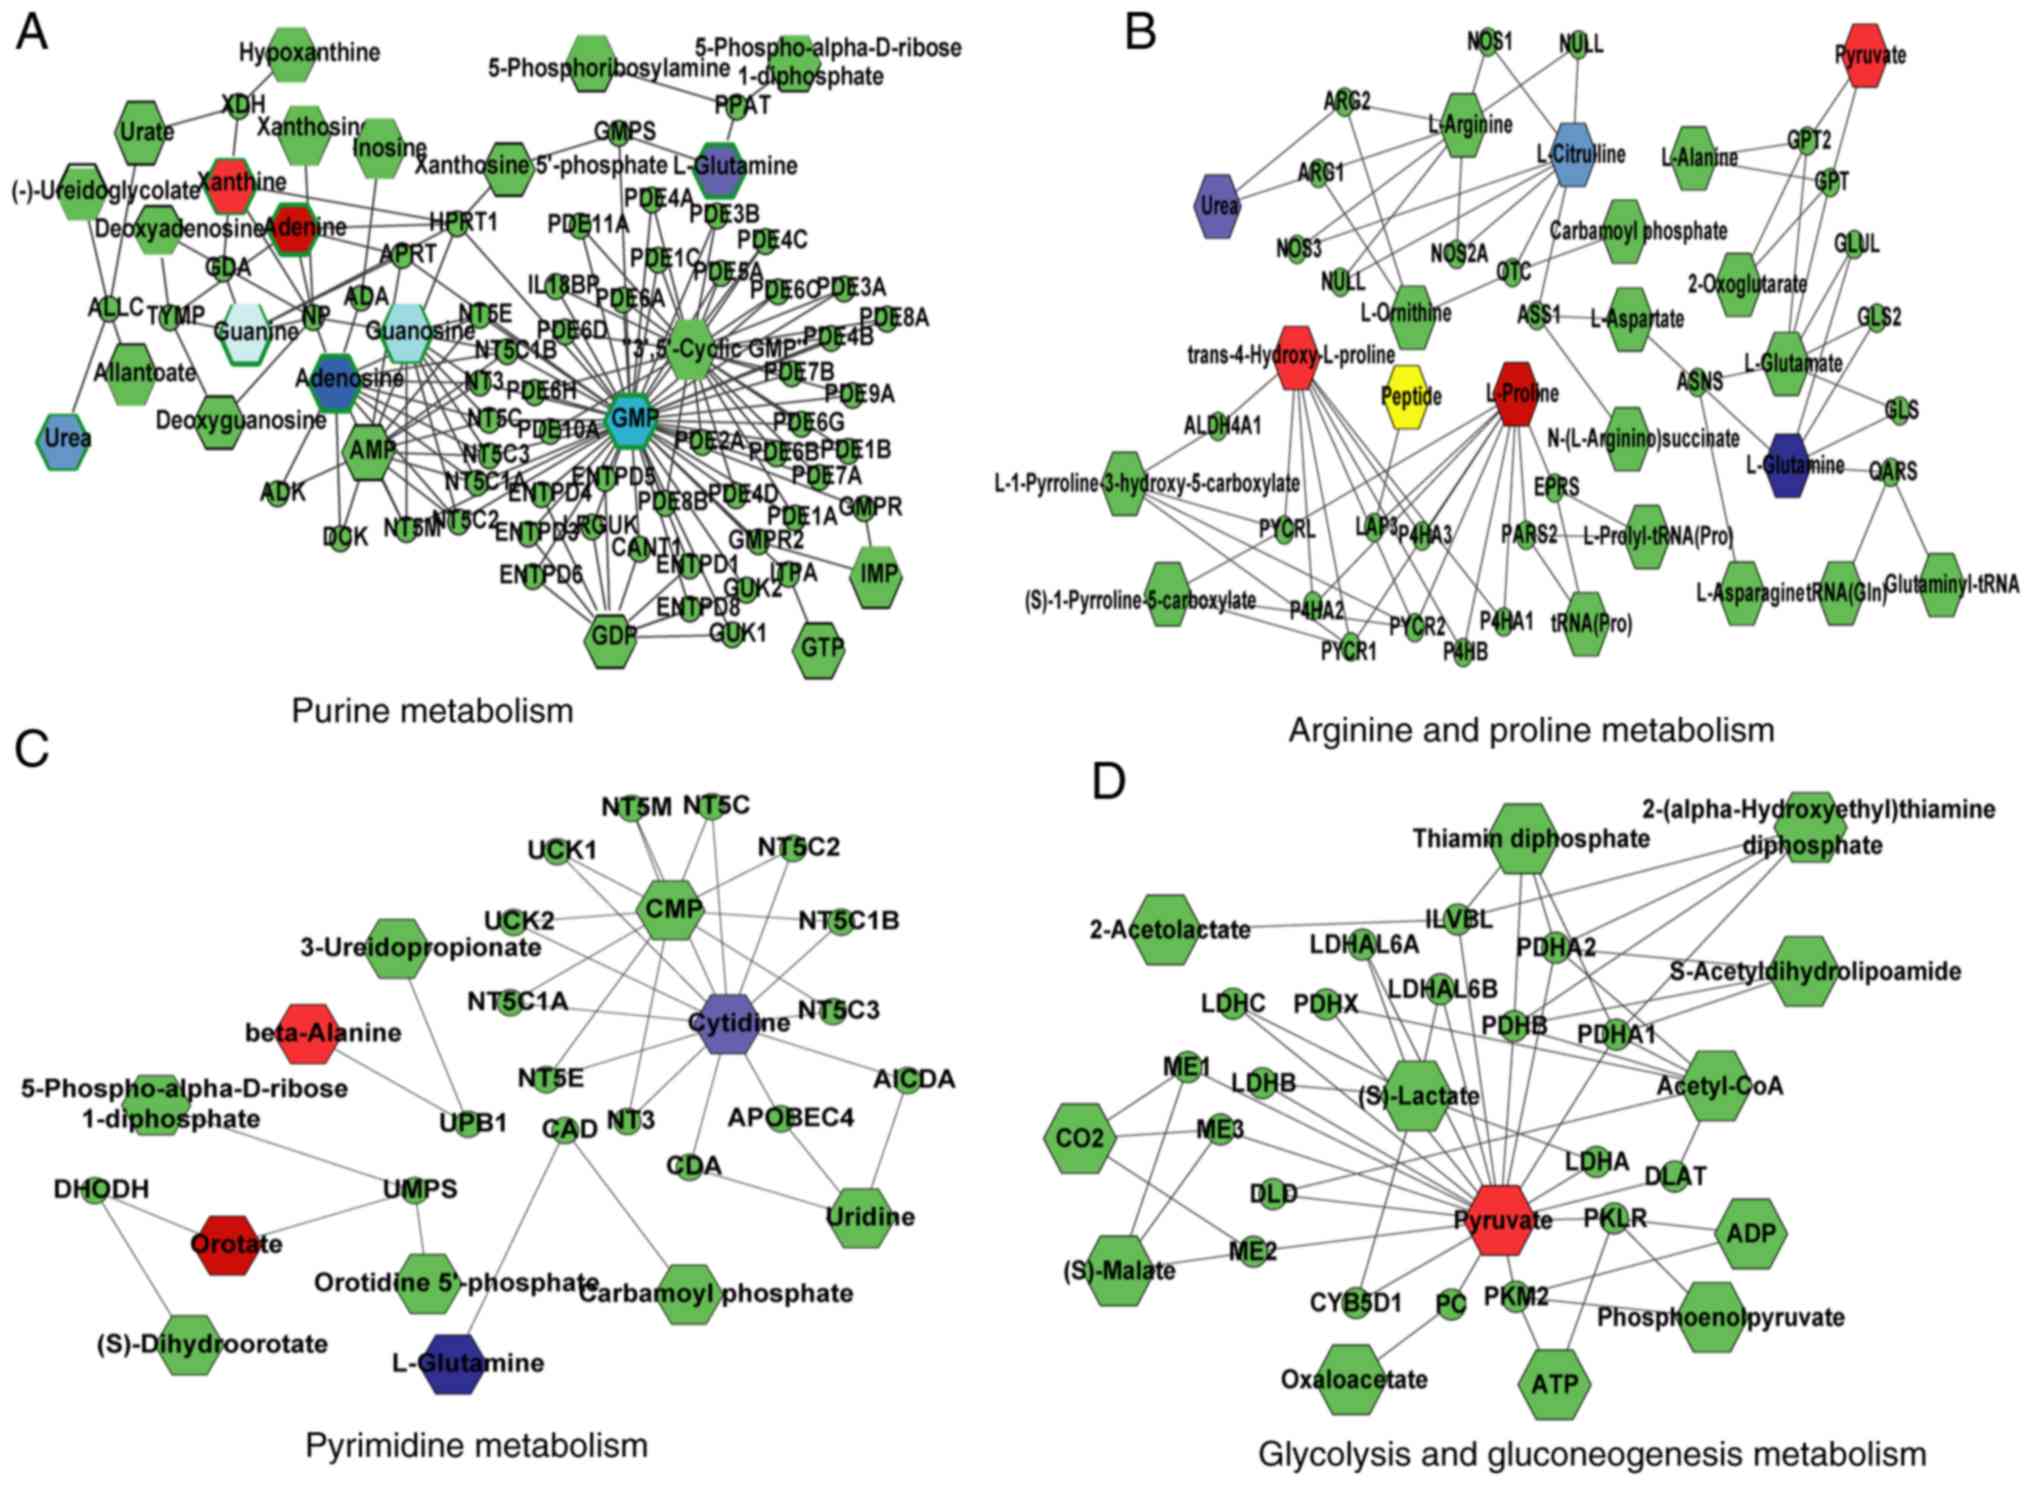
To explore the latent relationship of the compounds
with significant differences involved in the three shared pathways,
topologic correlation networks between compounds and gene were
constructed using Cytoscape software. The node color was set based
on the log2 of fold changes comparison between tumor and normal
tissues. From the topologic networks, it was observed that glycine,
xanthine and adenine, involved in murine metabolism, were
upregulated, and glutamine and adenosine were downregulated in
tumor tissues (Fig. 5A). Proline
and trans-4-hydroxyproline were increased in arginine and
proline metabolism, whereas glutamine, urea and citrul-line were
significantly decreased in tumor tissues (Fig. 5B). In pyrimidine metabolism,
orotate, β-alanine, and cytosine were upregulated; however, certain
compounds, such as glutamine, urea and cytidine were downregulated
in tumor tissues (Fig. 5C). From
the networks, it was also found that an upregulated compound,
pyruvate, was involved in the glycolysis and gluconeogenesis
metabolism pathway, which was an important downstream target of the
arginine and proline metabolism in tumor tissues (Fig. 5D).
Discussion
The past several years has witnessed the development
of metab-olomics; however, the majority of metabolomics research
has been conducted using frozen or fresh tissues. Several studies
using FFPE materials and UPLC-MS/MS-based metabolomics profiling
have been reported in the study of prostate cancer (36), sarcomas (21) and thyroid cancer (37). These works demonstrated the
technical feasibility of using patient FFPE blocks for metabolomic
studies. Meanwhile, FFPE materials can be utilized for
retrospective studies into biomarker discovery and drug screening
(16). For example, studies have
identified P53, CD45, human epidermal growth factor receptor 2 and
β-actin as biomarkers using tonsil and breast tissue sections from
FFPE samples in retrospective studies (13). However, few metabolomic studies
have studied pancreatic cancer using FFPE tissue blocks (38-40).
These studies primarily aimed to perform metabolic profiling using
fresh material, such as cells and urine, but were limited in
comparing the metabolic profiles of FFPE tissue blocks and
OCT-embedded blocks. In the present study, metabolites extracted
from FFPE tissue blocks were comprehensively analyzed compared with
those in corresponding OCT-embedded blocks from patients with PDAC.
The similarities and differences in class categorization and
physical/chemical properties of those detectable metabolites from
the differentially prepared tissues were characterized. Then,
shared and unique metabolic biomarkers and pathways in the two
types of tissue blocks were explored, potentially aiding the
identification of pathways critical for the metabolism of
pancreatic cancer cells.
First, UPLC-MS/MS-based metabolomic profiling was
selected for the metabolic analysis. Several studies have confirmed
that MS/MS-based platforms, which use hydrophilic interaction LC
with positive/negative ion switching, can be compatible with polar
metabolites from any biological source, such as FFPE tumor tissue
(41,42). Additionally, a high correlation
(r>0.80) was found for the 13 replicates of the FFPE and
OCT-embedded samples, demonstrating the feasibility of the method.
Furthermore, the tight correlation between OCT-embedded and FFPE
samples, both overall and for the majority of super-classes,
suggested that there was minimal technical variability across runs.
These results indicated that measurements of metabolite content in
FFPE tissues may be applicable for further metabolite analysis.
To compare metabolic data from OCT-embedded and FFPE
tissue samples, a comprehensive characterization of the
categorization of metabolites in FFPE and OCT-embedded samples was
performed. A previous study used the composition ratio to compare
the categorization of metabolites in FFPE and OCT-embedded samples
(43). Overall, 38.4% of compounds
were preserved in human tumor FFPE specimens compared with their
paired frozen counterparts; however, the properties of retained
metabolites varied notably across class categories. Certain
super-classes of metabolites, including xenobiotics, energy,
carbohydrates, cofactors, vitamins and amino acids, were reported
have to no significant difference between FFPE and OCT-embedded
samples in prostate cancer (27).
In the present study, it was revealed that the majority of
super-classes (nucleotides, cofactors and vitamins, xenobiotics,
amino acids, lipid and carbohydrate, and energy) of metabolites
detected in OCT-embedded samples could also be identified in FFPE
tissue blocks; however, peptides were not. Additionally, certain
similarities in the physical/chemical properties of detectable
metabolites were identified, including logP, pKa (strongest base),
physiological charge and formal charge. Our findings were similar
to a previous report on prostate tissues (27), but it also presented with
difference in some aspects, including the sub-classes, which
metabolites preserved in. It may be ascribed to a particular cancer
tissue type and were susceptible to FFPE processing.
Pancreatic cancer is one of the most lethal cancers
in the world, with low survival and poor prognosis (5). Several metabolomic studies have led
to an enhanced understanding of disease mechanisms, and the
discovery of novel diagnostic biomarkers (44,45).
In the present study, it was found that 69 metabolites showed
significant differences in OCT-embedded groups, and 23 metabolites
were significantly different in FFPE groups. Concerning their
categories, most metabolites could be classified as lipids, amino
acids and nucleotides, which were altered in tumor tissue.
Similarly, it was identified that metabolites belonged to peptide,
nucleotide, amino acid and lipid-related super-classes were
dysregulated in human cancer in previous study (46). In this study, we found that the
majority of metabolites associated with amino acids and lipids were
perturbed in tumor tissues both in OCT-embedded and FFPE samples.
This finding was consistent with previous studies showing that
amino acid and lipid metabolism were involved in several
tumorigenic processes (47-50).
For example, tryptophan metabolism is recognized as a
microenvironmental factor for suppressing antitumor responses
(7), and tryptophan was found to
be dysregulated in PDAC (51). Of
the metabolites identified in the present study, 10 were identified
as significantly differentially expressed in tumor tissue in both
the OCT-embedded and FFPE groups. Consistent with previous studies
(21,27), the classification of compounds
which were preserved in FFPE specimens were amino acids,
carbohydrates, lipids, nucleotides, cofactors and vitamins.
Recently, research regarding the metabolic profiling of pancreatic
cancer using various types of biological materials has been
reported (8). These reports
suggested several potential biomarkers of pancreatic cancer, such
as alanine, creatine, 3-hydroxybutyrate, 3-hydroxyisovalerate,
glucose, asparagine and proline (17,18).
Most of them were involved in amino acid metabolic pathways, such
as alanine and aspartate metabolism, arginine and proline
metabolism, and tryptophan metabolism (46,51).
Of note, 10 metabolites were found to be altered in tumor tissues
in the present study. Among them, N-acetylaspartate and creatinine
have been reported to be critical for cancer metabolism.
N-acetylaspartate was associated with autophagy and histone
acetylation in non-small cell lung cancer and impacted cell
survival (52,53). Creatine, a diagnostic indicator of
prostate cancer, was shown to be a marker of high mortality in
numerous cancers, such as prostate, gastrointestinal and prostate
cancer (54-56). Thus, creatine may be a candidate
biomarker of malignant pancreatic cancer.
Through KEGG pathway enrichment analysis, it was
found that three metabolic pathways (purine metabolism,
arginine/proline metabolism and pyrimidine metabolism) were
markedly altered in both OCT-embedded and FFPE samples. The proline
pathway was linked with hypoxia in pancreatic cancer and triggered
a hypoxic stress response (57).
The metabolism of proline as a stress substrate modulates the
carcinogenic pathway, and is responsible for destroying
intracellular reactive oxygen species, mediated via p53-induced
proline oxidase (57-59). A previous study reported that
increased levels of proline and trans-4-hydroxyproline in
tumor tissues, in part, are due to an alteration of intracellular
redox status and ultimately affect the biosynthesis of nucleic acid
and fatty acids (57). The pathway
analysis also revealed the significance of the purine metabolic
pathway, which plays an important role in providing cellular
energy, and indicates cancer cell survival and proliferation
(60,61). In addition, pyrimidine metabolism,
which is a key metabolic bottleneck important for DNA replication
in tumor cells, and a valuable diagnostic and therapeutic target,
was disrupted in tumor tissues (62,63).
Furthermore, the compounds involved in the three shared pathways
could be classified into the amino acid, nucleotide and
carbohydrate super-classes. These metabolites were demonstrated to
be preserved similarly in FFPE and OCT-embedded samples. From the
latent network of the compounds built by Cytoscape software, the
glycolysis and gluconeogenesis metabolic pathways were latent and
downstream of the arginine and proline metabolism pathway. This
finding was consistent with a previous study that pancreatic cancer
was associated with the 'Warburg effect' (14), which is commonly referred to as
'aerobic glycolysis'. Collectively, these results are consistent
with the existing cancer literature and illustrate that potential
metabolic pathways in cancer biology can be analyzed in FFPE tissue
blocks using UPLC-MS/MS.
However, there were certain limitations to the
present study. The number of patients was small compared with other
metabolomic studies of pancreatic cancer tissues. However, the
major purpose of this study was to investigate the feasibility of
employing FFPE tissue samples for the metabolomic studies of human
pancreatic cancer tissue, and to identify differences between FFPE
and OCT-embedded specimens. Based on the present findings, future
studies may further explore the metabolic profiling of patients
with pancreatic cancer. Furthermore, using categories of the
compounds to calculate the composition ratio analysis for
metabolites may not be sufficient to represent the specific
properties of metabolites. Thus, the physical/chemical properties
of the detectable compounds, and the different metabolites and
potential metabolic pathways altered in pancreatic tumors also
require further analysis in both FFPE and OCT-embedded
specimens.
In conclusion, this study focused on the application
of UPLC-MS/MS-based metabolic profiling of FFPE and OCT-embedded
pancreatic tissues in the discovery and comparison of candidate
biomarkers and potential metabolic pathways altered in pancreatic
tumors to distinguish tumor and normal tissues. A total of 10
metabolites, including N-acetylaspartate, β-hydroxyisovalerate,
creatinine and guanosine, may be potential candidate biomarkers of
malignant pancreatic tissue samples. It was also found that three
metabolic pathways, namely purine metabolism, arginine/proline
metabolism and pyrimidine metabolism, were significantly altered in
both OCT-embedded and FFPE samples. The present findings suggested
that FFPE specimens may provide similarly reliable metabolic data
as OCT-embedded specimens for PDAC, and may be utilized in further
diagnostic and retrospective studies into metabolic biomarkers and
pathways.
Supplementary Data
Abbreviations:
|
FC
|
fold change
|
|
FDR
|
false discovery rate
|
|
FFPE
|
formalin-fixed paraffin-embedded
|
|
HMDB
|
Human Metabolome Database
|
|
KEGG
|
Kyoto Encyclopedia of Genes and
Genomes
|
|
KRAS
|
Kirsten rat sarcoma viral oncogene
|
|
MS
|
mass spectrometry
|
|
PDAC
|
pancreatic adenocarcinoma
|
|
PLS-DA
|
partial least-squares discriminant
analysis
|
|
OCT
|
optimal cutting temperature
|
|
UPLC
|
ultra-performance liquid
chromatography
|
Acknowledgments
We sincerely appreciate Dr Michael C. Lin (360
Scientific Consulting) for his advice and assistance with the
language consulting of the manuscript.
Funding
The present study was supported by THE National
Natural Science Foundation of China (grant nos. 81673607, 81303235,
81774011 and 81473434), Natural Science Foundation of Zhejiang
Province (grant no. LY19H280001), Beijing Municipal Natural Science
Foundation (grant no. 7152140), Beijing Nova Program (grant no.
XXJH2015B098) and rgw Science and Technology Research Project for
Public Welfare in Huzhou (grant no. 2019GZ24).
Availability of data and materials
The analyzed data sets generated during the present
study are available from the corresponding author on reasonable
request.
Authors' contributions
All authors made substantial contributions to the
conception and design of the study. MCG and YS are the grant
holders, initiated the study, and participated in its design and
coordination. DF, XZ, and YLW were responsible for protocol design,
statistical analysis and manuscript drafting. JY, LL and YFQ
contributed to the collection and embedding of clinical samples,
and the extraction of metabolic data. QL and LPC contributed to
revising the manuscript. All authors read and approved the final
manuscript.
Ethics approval and consent to
participate
The study was approved by the Institutional Review
Board of Chinese PLA General Hospital. Informed consent was
obtained from all individual participants in the study.
Patient consent for publication
Not applicable.
Competing interests
The authors declare that they have no competing
interests.
References
|
1
|
Suzuki K, Takeuchi O, Suzuki Y and
Kitagawa Y: Mechanisms of metformin's anti-tumor activity against
gemcitabine-resistant pancreatic adenocarcinoma. Int J Oncol.
54:764–772. 2019.
|
|
2
|
Wei DM, Jiang MT, Lin P, Yang H, Dang YW,
Yu Q, Liao DY, Luo DZ and Chen G: Potential ceRNA networks involved
in autophagy suppression of pancreatic cancer caused by chloroquine
diphosphate: A study based on differentially-expressed circRNAs,
lncRNAs, miRNAs and mRNAs. Int J Oncol. 54:600–626. 2019.
|
|
3
|
Lin QJ, Yang F, Jin C and Fu DL: Current
status and progress of pancreatic cancer in China. World J
Gastroenterol. 21:7988–8003. 2015. View Article : Google Scholar : PubMed/NCBI
|
|
4
|
Son J, Lyssiotis CA, Ying H, Wang X, Hua
S, Ligorio M, Perera RM, Ferrone CR, Mullarky E, Shyh-Chang N, et
al: Glutamine supports pancreatic cancer growth through a
KRAS-regulated metabolic pathway. Nature. 496:101–105. 2013.
View Article : Google Scholar : PubMed/NCBI
|
|
5
|
Huang Q, Tan Y, Yin P, Ye G, Gao P, Lu X,
Wang H and Xu G: Metabolic characterization of hepatocellular
carcinoma using nontargeted tissue metabolomics. Cancer Res.
73:4992–5002. 2013. View Article : Google Scholar : PubMed/NCBI
|
|
6
|
Keum N, Yuan C, Nishihara R, Zoltick E,
Hamada T, Martinez Fernandez A, Zhang X, Hanyuda A, Liu L, Kosumi
K, et al: Dietary glycemic and insulin scores and colorectal cancer
survival by tumor molecular biomarkers. Int J Cancer.
140:2648–2656. 2017. View Article : Google Scholar : PubMed/NCBI
|
|
7
|
McDonnell SR, Hwang SR, Rolland D,
Murga-Zamalloa C, Basrur V, Conlon KP, Fermin D, Wolfe T, Raskind
A, Ruan C, et al: Integrated phosphoproteomic and metabolomic
profiling reveals NPM-ALK-mediated phosphorylation of PKM2 and
metabolic reprogramming in anaplastic large cell lymphoma. Blood.
122:958–968. 2013. View Article : Google Scholar : PubMed/NCBI
|
|
8
|
Vernieri C, Pusceddu S, Fucà G, Indelicato
P, Centonze G, Castagnoli L, Ferrari E, Ajazi A, Pupa S, Casola S,
et al: Impact of systemic and tumor lipid metabolism on everolimus
efficacy in advanced pancreatic neuroendocrine tumors (pNETs). Int
J Cancer. 144:1704–1712. 2019. View Article : Google Scholar
|
|
9
|
Cacciatore S, Hu X, Viertler C, Kap M,
Bernhardt GA, Mischinger HJ, Riegman P, Zatloukal K, Luchinat C and
Turano P: Effects of intra- and post-operative ischemia on the
metabolic profile of clinical liver tissue specimens monitored by
NMR. J Proteome Res. 12:5723–5729. 2013. View Article : Google Scholar : PubMed/NCBI
|
|
10
|
Priolo C, Pyne S, Rose J, Regan ER, Zadra
G, Photopoulos C, Cacciatore S, Schultz D, Scaglia N, McDunn J, et
al: AKT1 and MYC induce distinctive metabolic fingerprints in human
prostate cancer. Cancer Res. 74:7198–7204. 2014. View Article : Google Scholar : PubMed/NCBI
|
|
11
|
Liu L, Tabung FK, Zhang XH, Nowak JA, Qian
ZR, Hamada T, Nevo D, Bullman S, Mima K, Kosumi K, et al: Diets
that promote colon inflammation associate with risk of colorectal
carcinomas that contain fusobacterium nucleatum. Clin Gastroenterol
Hepatol. 16:1622–1631.e3. 2018. View Article : Google Scholar : PubMed/NCBI
|
|
12
|
Ruan J, Zheng H, Rong X, Zhang J, Fang W,
Zhao P and Luo R: Overexpression of cathepsin B in hepatocellular
carcinomas predicts poor prognosis of HCC patients. Mol Cancer.
15:172016. View Article : Google Scholar
|
|
13
|
Cors JF, Kashyap A, Fomitcheva Khartchenko
A, Schraml P and Kaigala GV: Tissue lithography: Microscale
dewaxing to enable retrospective studies on formalin-fixed
paraffin-embedded (FFPE) tissue sections. PLoS One.
12:e01766912017. View Article : Google Scholar : PubMed/NCBI
|
|
14
|
Warburg O: On the origin of cancer cells.
Science. 123:309–314. 1956. View Article : Google Scholar : PubMed/NCBI
|
|
15
|
Mayer A, Schmidt M, Seeger A, Serras AF,
Vaupel P and Schmidberger H: GLUT-1 expression is largely unrelated
to both hypoxia and the warburg phenotype in squamous cell
carcinomas of the vulva. BMC Cancer. 14:7602014. View Article : Google Scholar : PubMed/NCBI
|
|
16
|
Poste G: Bring on the biomarkers. Nature.
469:156–157. 2011. View Article : Google Scholar : PubMed/NCBI
|
|
17
|
Fang F, He X, Deng H, Chen Q, Lu J, Spraul
M and Yu Y: Discrimination of metabolic profiles of pancreatic
cancer from chronic pancreatitis by high-resolution magic angle
spinning 1H nuclear magnetic resonance and principal components
analysis. Cancer Sci. 98:1678–1682. 2007. View Article : Google Scholar : PubMed/NCBI
|
|
18
|
Kaplan O, Kushnir T, Askenazy N, Knubovets
T and Navon G: Role of nuclear magnetic resonance spectroscopy
(MRS) in cancer diagnosis and treatment: 31P, 23Na, and 1H MRS
studies of three models of pancreatic cancer. Cancer Res.
57:1452–1459. 1997.PubMed/NCBI
|
|
19
|
Buck A, Ly A, Balluff B, Sun N, Gorzolka
K, Feuchtinger A, Janssen KP, Kuppen PJ, van de Velde CJ, Weirich
G, et al: High-resolution MALDI-FT-ICR MS imaging for the analysis
of metabolites from formalin-fixed, paraffin-embedded clinical
tissue samples. J Pathol. 237:123–132. 2015. View Article : Google Scholar : PubMed/NCBI
|
|
20
|
Wang H, Wang L, Zhang H, Deng P, Chen J,
Zhou B, Hu J, Zou J, Lu W, Xiang P, et al: H-1 NMR-based metabolic
profiling of human rectal cancer tissue. Mol Cancer. 12:1212013.
View Article : Google Scholar
|
|
21
|
Kelly AD, Breitkopf SB, Yuan M, Goldsmith
J, Spentzos D and Asara JM: Metabolomic profiling from
formalin-fixed, paraffin-embedded tumor tissue using targeted
LC/MS/MS: Application in sarcoma. PLoS One. 6:e253572011.
View Article : Google Scholar : PubMed/NCBI
|
|
22
|
Aimetti M, Cacciatore S, Graziano A and
Tenori L: Metabonomic analysis of saliva reveals generalized
chronic periodontitis signature. Metabolomics. 8:465–474. 2012.
View Article : Google Scholar
|
|
23
|
Lim J, Kim Y, Lee W, Kim M, Lee EJ, Kang
CS and Han K: Fresh-frozen, optimal cutting temperature (OCT)
compound-embedded bone marrow aspirates: A reliable resource for
morphological, immunohistochemical and molecular examinations. Int
J Laboratory Hematol. 32:e34–39. 2010. View Article : Google Scholar
|
|
24
|
Liu M, Zhao SQ, Yang L, Li X, Song X,
Zheng Y, Fan J and Shi H: A direct immunohistochemistry (IHC)
method improves the intraoperative diagnosis of breast papillary
lesions including breast cancer. Discov Med. 28:29–37.
2019.PubMed/NCBI
|
|
25
|
Evans AM, DeHaven CD, Barrett T, Mitchell
M and Milgram E: Integrated, nontargeted ultrahigh performance
liquid chromatography/electrospray ionization tandem mass
spectrometry platform for the identification and relative
quantification of the small-molecule complement of biological
systems. Anal Chem. 81:6656–6667. 2009. View Article : Google Scholar : PubMed/NCBI
|
|
26
|
Yuan M, Breitkopf SB, Yang X and Asara JM:
A positive/negative ion-switching, targeted mass spectrometry-based
metabolomics platform for bodily fluids, cells, and fresh and fixed
tissue. Nat Protoc. 7:872–881. 2012. View Article : Google Scholar : PubMed/NCBI
|
|
27
|
Cacciatore S, Zadra G, Bango C, Penney KL,
Tyekucheva S, Yanes O and Loda M: Metabolic profiling in
formalin-fixed and paraffin-embedded prostate cancer tissues. Mol
Cancer Res. 15:439–447. 2017. View Article : Google Scholar : PubMed/NCBI
|
|
28
|
Li CF, Tsai HH, Ko CY, Pan YC, Yen CJ, Lai
HY, Yuh CH, Wu WC and Wang JM: HMDB and 5-AzadC combination
reverses tumor suppressor CCAAT/enhancer-binding protein delta to
strengthen the death of liver cancer cells. Mol Cancer Ther.
14:2623–2633. 2015. View Article : Google Scholar : PubMed/NCBI
|
|
29
|
Wishart DS, Feunang YD, Marcu A, Guo AC,
Liang K, Vázquez-Fresno R, Sajed T, Johnson D, Li C, Karu N, et al:
HMDB 4.0: The human metabolome database for 2018. Nucleic Acids
Res. 46:D608–D617. 2018. View Article : Google Scholar :
|
|
30
|
Xia J, Psychogios N, Young N and Wishart
DS: MetaboAnalyst: A web server for metabolomic data analysis and
interpretation. Nucleic Acids Res. 37:W652–W660. 2009. View Article : Google Scholar : PubMed/NCBI
|
|
31
|
Xia J and Wishart DS: Web-based inference
of biological patterns, functions and pathways from metabolomic
data using MetaboAnalyst. Nat Protoc. 6:743–760. 2011. View Article : Google Scholar : PubMed/NCBI
|
|
32
|
Villanueva RAM and Chen ZJ: ggplot2:
Elegant graphics for data analysis (2nd ed.). Meas
Interdisciplinary Res Perspect. 17:160–167. 2019. View Article : Google Scholar
|
|
33
|
Benjamini Y and Hocherg Y: Controlling the
false discovery rate: A practical and powerful approach to multiple
testing. J Royal Stat Soc Series B (Methodological). 57:289–300.
1995. View Article : Google Scholar
|
|
34
|
Gao J, Tarcea VG, Karnovsky A, Mirel BR,
Weymouth TE, Beecher CW, Cavalcoli JD, Athey BD, Omenn GS, Burant
CF and Jagadish HV: Metscape: A Cytoscape plug-in for visualizing
and interpreting metabolomic data in the context of human metabolic
networks. Bioinformatics. 26:971–973. 2010. View Article : Google Scholar : PubMed/NCBI
|
|
35
|
Shannon P, Markiel A, Ozier O, Baliga NS,
Wang JT, Ramage D, Amin N, Schwikowski B and Ideker T: Cytoscape: A
software environment for integrated models of biomolecular
interaction networks. Genome Res. 13:2498–2504. 2003. View Article : Google Scholar : PubMed/NCBI
|
|
36
|
Putluri N, Shojaie A, Vasu VT, Nalluri S,
Vareed SK, Putluri V, Vivekanandan-Giri A, Byun J, Pennathur S,
Sana TR, et al: Metabolomic profiling reveals a role for androgen
in activating amino acid metabolism and methylation in prostate
cancer cells. PLoS One. 6:e214172011. View Article : Google Scholar : PubMed/NCBI
|
|
37
|
Wojakowska A, Chekan M, Marczak Ł,
Polanski K, Lange D, Pietrowska M and Widlak P: Detection of
metabolites discriminating subtypes of thyroid cancer: Molecular
profiling of FFPE samples using the GC/MS approach. Mol Cell
Endocrinol. 417:149–157. 2015. View Article : Google Scholar : PubMed/NCBI
|
|
38
|
Mayers JR, Wu C, Clish CB, Kraft P,
Torrence ME, Fiske BP, Yuan C, Bao Y, Townsend MK, Tworoger SS, et
al: Elevation of circulating branched-chain amino acids is an early
event in human pancreatic adenocarcinoma development. Nat Med.
20:1193–1198. 2014. View Article : Google Scholar : PubMed/NCBI
|
|
39
|
Sadanandam A, Wullschleger S, Lyssiotis
CA, Grötzinger C, Barbi S, Bersani S, Körner J, Wafy I, Mafficini
A, Lawlor RT, et al: A cross-species analysis in pancreatic
neuroendocrine tumors reveals molecular subtypes with distinctive
clinical, metastatic, developmental, and metabolic characteristics.
Cancer Discov. 5:1296–1313. 2015. View Article : Google Scholar : PubMed/NCBI
|
|
40
|
Nie S, Lo A, Wu J, Zhu J, Tan Z, Simeone
DM, Anderson MA, Shedden KA, Ruffin MT and Lubman DM: Glycoprotein
biomarker panel for pancreatic cancer discovered by quantitative
proteomics analysis. J Proteome Res. 13:1873–1884. 2014. View Article : Google Scholar : PubMed/NCBI
|
|
41
|
Wojakowska A, Marczak Ł, Jelonek K,
Polanski K, Widlak P and Pietrowska M: An optimized method of
metabolite extraction from formalin-fixed paraffin-embedded tissue
for GC/MS analysis. PLoS One. 10:e01369022015. View Article : Google Scholar : PubMed/NCBI
|
|
42
|
Gika H, Virgiliou C, Theodoridis G, Plumb
RS and Wilson ID: Untargeted LC/MS-based metabolic phenotyping
(metabo-nomics/metabolomics): The state of the art. J Chromatogr B
Analyt Technol Biomed Life Sci. 1117:136–147. 2019. View Article : Google Scholar : PubMed/NCBI
|
|
43
|
Kaushik AK, Vareed SK, Basu S, Putluri V,
Putluri N, Panzitt K, Brennan CA, Chinnaiyan AM, Vergara IA, Erho
N, et al: Metabolomic profiling identifies biochemical pathways
associated with castration-resistant prostate cancer. J Proteome
Res. 13:1088–1100. 2014. View Article : Google Scholar
|
|
44
|
DeMarshall C, Goldwaser EL, Sarkar A,
Godsey GA, Acharya NK, Thayasivam U, Belinka BA and Nagele RG:
Autoantibodies as diagnostic biomarkers for the detection and
subtyping of multiple sclerosis. J Neuroimmunol. 309:51–57. 2017.
View Article : Google Scholar : PubMed/NCBI
|
|
45
|
Yokom DW, Stewart J, Alimohamed NS,
Winquist E, Berry S, Hubay S, Lattouf JB, Leonard H, Girolametto C,
Saad F and Sridhar SS: Prognostic and predictive clinical factors
in patients with metastatic castration-resistant prostate cancer
treated with cabazitaxel. Can Urol Assoc J. 12:E365–E372. 2018.
View Article : Google Scholar : PubMed/NCBI
|
|
46
|
Moreno P, Jiménez-Jiménez C,
Garrido-Rodríguez M, Calderón-Santiago M, Molina S, Lara-Chica M,
Priego-Capote F, Salvatierra Á, Muñoz E and Calzado MA: Metabolomic
profiling of human lung tumor tissues-nucleotide metabolism as a
candidate for therapeutic interventions and biomarkers. Mol Oncol.
12:1778–1796. 2018. View Article : Google Scholar : PubMed/NCBI
|
|
47
|
Zhang J, Pavlova NN and Thompson CB:
Cancer cell metabolism: The essential role of the nonessential
amino acid, glutamine. EMBO J. 36:1302–1315. 2017. View Article : Google Scholar : PubMed/NCBI
|
|
48
|
Koutsioumpa M, Hatziapostolou M,
Polytarchou C, Mahurkar-Joshi S and Iliopoulos D: H3K4me3 affects
glucose metabolism and lipid content in pancreatic cancer.
Gastroenterology. 152:S1152017. View Article : Google Scholar
|
|
49
|
Sunami Y, Rebelo A and Kleeff J: Lipid
metabolism and lipid droplets in pancreatic cancer and stellate
cells. Cancers (Basel). 10. pp. E32017, View Article : Google Scholar
|
|
50
|
Krishnamurthy RV, Suryawanshi YR and
Essani K: Nitrogen isotopes provide clues to amino acid metabolism
in human colorectal cancer cells. Sci Rep. 7:25622017. View Article : Google Scholar : PubMed/NCBI
|
|
51
|
Jiao L, Maity S, Coarfa C, Rajapakshe K,
Chen L, Jin F, Putluri V, Tinker LF, Mo Q, Chen F, et al: A
prospective targeted serum metabolomics study of pancreatic cancer
in postmenopausal women. Cancer Prev Res (Phila). 12:237–246. 2019.
View Article : Google Scholar
|
|
52
|
Bogner-Strauss JG: N-acetylaspartate
metabolism outside the brain: Lipogenesis, histone acetylation, and
cancer. Front Endocrinol (Lausanne). 8:2402017. View Article : Google Scholar
|
|
53
|
Lou TF, Sethuraman D, Dospoy P, Srivastva
P, Kim HS, Kim J, Ma X, Chen PH, Huffman KE, Frink RE, et al:
Cancer-Specific Production of N-Acetylaspartate via NAT8L
Overexpression in Non-Small Cell Lung Cancer and Its Potential as a
Circulating Biomarker. Cancer Prev Res (Phila). 9:43–52. 2016.
View Article : Google Scholar
|
|
54
|
Wang M, Zou L, Liang J, Wang X, Zhang D,
Fang Y, Zhang J, Xiao F and Liu M: The urinary sarcosine/creatinine
ratio is a potential diagnostic and prognostic marker in prostate
cancer. Med Sci Monit. 24:3034–3041. 2018. View Article : Google Scholar : PubMed/NCBI
|
|
55
|
Lin HL, Chen CW, Lu CY, Sun LC, Shih YL,
Chuang JF, Huang YH, Sheen MC and Wang JY: High preoperative ratio
of blood urea nitrogen to creatinine increased mortality in
gastrointestinal cancer patients who developed postoperative
enteric fistulas. Kaohsiung J Med Sci. 28:418–422. 2012. View Article : Google Scholar : PubMed/NCBI
|
|
56
|
Weinstein SJ, Mackrain K,
Stolzenberg-Solomon RZ, Selhub J, Virtamo J and Albanes D: Serum
creatinine and prostate cancer risk in a prospective study. Cancer
Epidemiol Biomarkers Prev. 18:2643–2649. 2009. View Article : Google Scholar : PubMed/NCBI
|
|
57
|
Phang JM, Donald SP, Pandhare J and Liu Y:
The metabolism of proline, a stress substrate, modulates
carcinogenic pathways. Amino Acids. 35:681–690. 2008. View Article : Google Scholar : PubMed/NCBI
|
|
58
|
Eales KL, Hollinshead KE and Tennant DA:
Hypoxia and metabolic adaptation of cancer cells. Oncogenesis.
5:e1902016. View Article : Google Scholar : PubMed/NCBI
|
|
59
|
Tang L, Zeng J, Geng P, Fang C, Wang Y,
Sun M, Wang C, Wang J, Yin P, Hu C, et al: Global metabolic
profiling identifies a pivotal role of proline and hydroxyproline
metabolism in supporting hypoxic response in hepatocellular
carcinoma. Clin Cancer Res. 24:474–485. 2018. View Article : Google Scholar
|
|
60
|
Karigane D, Kobayashi H, Morikawa T,
Ootomo Y, Sakai M, Nagamatsu G, Kubota Y, Goda N, Matsumoto M,
Nishimura EK, et al: p38α activates purine metabolism to initiate
hematopoietic stem/progenitor cell cycling in response to stress.
Cell Stem Cell. 19:192–204. 2016. View Article : Google Scholar : PubMed/NCBI
|
|
61
|
Matsuyama M, Wakui M, Monnai M, Mizushima
T, Nishime C, Kawai K, Ohmura M, Suemizu H, Hishiki T, Suematsu M,
et al: Reduced CD73 expression and its association with altered
purine nucleotide metabolism in colorectal cancer cells robustly
causing liver metastases. Oncol Lett. 1:431–436. 2010. View Article : Google Scholar : PubMed/NCBI
|
|
62
|
El Kouni MH: Pyrimidine metabolism in
schistosomes: A comparison with other parasites and the search for
potential chemotherapeutic targets. Comp Biochem Physiol B Biochem
Mol Biol. 213:55–80. 2017. View Article : Google Scholar : PubMed/NCBI
|
|
63
|
Ser Z, Gao X, Johnson C, Mehrmohamadi M,
Liu X, Li S and Locasale JW: Targeting one carbon metabolism with
an antime-tabolite disrupts pyrimidine homeostasis and induces
nucleotide overflow. Cell Rep. 15:2367–2376. 2016. View Article : Google Scholar : PubMed/NCBI
|