Introduction
Colorectal cancer (CRC) is one of the most common
types of cancer worldwide, and ~15% of all patients with CRC
exhibit microsatellite instability (MSI), which is caused by a
defective DNA mismatch repair (MMR) system, the origins of which
can be either sporadic or hereditary. The hereditary disorder Lynch
syndrome (also known as hereditary non-polyposis CRC) is the result
of autosomal dominant heterozygous germ-line mutations in MMR genes
and accounts for 2-5% of all cases of MSI-CRC (1). Germline mutations occur in one of the
four key MMR genes; mutL homologue 1 (MLH1; chromosome
3p21.3), mutS homologue 2 (MSH2; chromosome 2p22-21), mutS
homologue 6 (MSH6; chromosome 2p16) or postmeiotic
segregation increased 2 (PMS2; chromosome 7p22.2) (2). Although patients with Lynch syndrome
are predisposed to a variety of cancers, CRC is the most common
type of cancer associated with Lynch syndrome (3). Sporadic cases of MSI-CRC account for
~12% of all CRC cases and have been found to be caused by
hypermethylation of the MLH1 promoter. MLH1 promoter
hypermethylation results in the loss of MLH1 protein expression,
and is closely associated with the presence of the BRAFV600E
mutation (4). In summary, MLH1 is
the protein most frequently affected and relevant for MSI in
CRC.
CRC with MSI is associated with improved survival
rates, reduced aggressiveness and a more favourable prognosis
(5,6). In a previous study by the authors, it
was demonstrated that there was a close association between tumour
aggressiveness and MLH1 deficiency, as well as a decreased
non-erythroid spectrin αII (SPTAN1) expression (7). The decreased expression of the
cytoskeletal protein, SPTAN1, was shown to be associated with
decreased cell viability, cellular mobility and cell-cell contact.
Furthermore, SPTAN1 expression was higher in patients with stage I
CRC compared with patients with stages II-IV CRC, and the amount of
SPTAN1 was lower in patients with metastatic CRC compared with
patients with non-metastatic CRC (7).
One of the most important features of MSI-CRC
however, is that these tumours exhibit a dense infiltration of
cytotoxic CD8-positive (CD8+) T lymphocytes (8). The MSI tumour tissue infiltrating
T-cells may eliminate the dysplastic precursors of tumour cells and
may thus improve the survival of these cancer patients. The
functionality of these T-cells appears to be fully available and
functional during the early stages of tumour development (9), although it can be inactivated during
tumour progression, a hallmark of cancer (10). From a therapeutic viewpoint,
MSI-CRC is associated with resistance to the commonly used 5-FU
chemotherapy regimen (11),
whereas MSI sensitizes CRC to programmed cell death-1 immune
checkpoint inhibitors (12).
Despite the fact that several groups have focused on
the clinical differences between MSI-CRC and sporadic CRC, only a
few proteins are currently known that may partially explain their
respective characteristics. In the present study, proteome arrays
were used with CRC cell lines in which MLH1 or SPTAN1 were knocked
down to identify potentially relevant chemokines or receptor
proteins, and to provide molecular explanations for the reduced
tumour aggressiveness and increased T-cell infiltration in patients
with MSI-CRC.
Materials and methods
Patients
Formalin-fixed paraffin-embedded (FFPE) tissue
samples from 20 patients (who were members of a cohort of 189
patients with CRC used in a previous study) (7) were used as representative samples for
the present study. Of these samples, 10 were MLH1-deficient,
whereas the other 10 were MLH1-proficient with regards to
expression (7). All patients
included in the present study underwent bowel resection with
curative intent. The characteristics of the individual tissue
specimens are summarized in Table
I. The expression levels of MLH1 have been previously analysed
(7) and IL-8 expression was
determined in the present study using immunohistochemistry for each
tumour and the matching adjacent non-malignant tissue. The study
was approved by the Local Ethics Committee of the University
Hospital Frankfurt, all research was performed in accordance with
relevant guidelines/regulations, and all patients provided written
informed consent.
 | Table IClinicopathological characteristics
of 20 patients with CRC evaluated for expression of MLH1, SPTAN1
and IL-8. |
Table I
Clinicopathological characteristics
of 20 patients with CRC evaluated for expression of MLH1, SPTAN1
and IL-8.
| Patient | Sex | Localization
relative to the splenic flexure | Age at diagnosis
(years) | Year of diagnosis
and surgery | Tumour | Metastases | Stage | MLH1 status | BRAF wt/BRAF
V600E/E2/D | Tumour SPTAN1
intensity compared to mucosa | IL-8 intensity in
tumour tissue |
|---|
| 2 | F | Proximal | 62 | 2014 | pT2 | M0 | I | + | | > | 0 |
| 3 | M | Proximal | 77 | 2012 | pT1 | M0 | I | + | | > | n. a. |
| 11 | F | Distal | 49 | 2014 | pT1(sm3) | M0 | I | + | | > | +++ |
| 15 | F | Distal | 58 | 2013 | pT2 | M0 | I | + | | > | ++ |
| 18 | M | Distal | 75 | 2012 | pT2 | M0 | I | + | | > | ++ |
| 20 | F | Proximal | 65 | 2013 | pT1(sm2) | M0 | I | + | | > | ++ |
| 24 | M | Proximal | 65 | 2013 | pT2 | M0 | I | + | | > | + |
| 25 | M | Proximal | 78 | 2014 | pT2 | M0 | I | + | | > | ++ |
| 26 | M | Proximal | 72 | 2015 | pT2 | M0 | I | + | | > | + |
| 27 | M | Distal | 76 | 2014 | pT2 | M0 | I | + | | > | ++ |
| 164 | F | Proximal | 85 | 2016 | pT1 | M0 | I | - | BRAF wt | < | + |
| 170 | F | Proximal | 94 | 2014 | pT4b | M0 | IIC | - | BRAF
V600E/E2/D | < | n. a. |
| 173 | M | Proximal | 75 | 2014 | pT4b | M1a (LYM) | IVA | - | BRAF wt | < | ++ |
| 177 | M | Distal | 29 | 2008 | pT3c | M0 | II | - | BRAF wt | < | + |
| 179 | M | Proximal | 71 | 2016 | pT3 | M0 | II | - | BRAF wt | < | + |
| 180 | M | Distal | 47 | 2013 | pT3 | M1 (HEP) | IV | - | BRAF wt | < | ++ |
| 183 | M | | 46 | 2012 | pT4b | M0 | II | - | BRAF wt | < | n. a. |
| 185 | M | Proximal | 41 | 2015 | pT4b | M0 | II | - | BRAF wt | = | ++ |
| 186 | M | | 64 | 2014 | pT4b | M0 | III | - | BRAF
V600E/E2/D | < | n. a. |
| 188 | F | Proximal | 74 | 2016 | pT3 | M0 | II | - | BRAF
V600E/E2/D | < | +++ |
Cell lines and cell culture
SW620 (CCL-227), SW480 (CCL-228) and HT29 (HTB-38)
CRC cell lines, as well as 293 (ATCC® CRL-1573™) cells,
which are frequently used as a model of tumorigenic cells (13), were purchased from American Type
Culture Collection. Colorectal HCT116 mlh1-2 cancer cells stably
transfected with pcDNA3.1+/MLH1 were a gift from Professor
Francoise Praz (Villejuif, France) (14).
All cells were grown in DMEM (Gibco; Thermo Fisher
Scientific, Inc.) with 10% FBS (Sigma-Aldrich; Merck KGaA) and 1%
penicillin-streptomycin (Sigma-Aldrich; Merck KGaA). The media for
shMLH1, shSPTAN1 and pLKO.1 stably transduced cell lines
additionally contained 5 µg/ml puromycin or 4 µg/ml
for HCT116 mlh1-2 cells. The media for pLKO.1-neo and shSPTAN1-neo
stably transduced SW620 cell lines additionally included G418 (1
mg/ml).
The cells were tested frequently for mycoplasma and
char-acterized in June, 2018 using STR profiling, as indicated by
the DSMZ online catalogue (15).
STR profiling of the 8 STR loci was performed as recently described
(16).
Transduction with SPTAN1 or
MLH1-shRNAs
SW620, SW480, HT29, 293 and HCT116 mlh1-2 cells
express SPTAN1, as well as MLH1 endogenously (17-19).
To knock-down SPTAN1 or MLH1 expression in these cell lines, they
were transduced with lentivirus encoding interfering
MISSION® shRNA nucleic acid molecules, according to the
manufacturer's protocol (MISSION® shRNA; Sigma-Aldrich;
Merck KGaA). Briefly, cells were plated at a density of 3 or
5×10⁵ cells per well and transduced with 3 µg of
shRNA targeting SPTAN1 (MISSION® shRNA TRCN0000053669)
or 3 µg of shRNA targeting MLH1 (MISSION® shRNA
TRCN0000288641) delivered through a viral vector
(MISSION® pLKO.1-puro). As the control, SW620, SW480,
HT29, 293 and HCT116 mlh1-2 cells were transduced with the same
amount of viral vector containing non-mammalian shRNA
(MISSION® pLKO.1-puro control plasmid DNA, SHC002).
Transduced cells were selected for using 5 µg/ml puromycin
in the cell culture medium, apart from the HCT116 mlh1-2 cells,
which were selected for using 4 µg/ml puromycin.
To achieve the co-knockdown of MLH1 and SPTAN1, the
SW620 cells stably transduced with pLKO.1 and shMLH1 were used for
an additional lentiviral transduction using 3 µg of control
shRNA (MISSION® Non-Target shRNA Control Plasmid DNA,
SHC016) or shRNA targeting SPTAN1 (MISSION® shRNA
TRCN0000053669) in a different lentiviral vector backbone
(pLKO.1-Neo-CMV-TurboGFP™, MISSION®; Sigma-Aldrich;
Merck KGaA) as described above. Transduced cells were selected for
in G418 containing medium (1 mg/ml) for 8 days.
MSI testing
Single cell clones of stably transduced SW620 and
SW480 cell lines were investigated for their MSI status. The cells
were diluted to 10 cells/ml, and 100 µl of each was added
per well to a 96-well plate and incubated for 14 days at 37°C.
After culturing the single cell clones, DNA was isolated and tested
for MSI using a pentaplex PCR. A total of 5 different MSI loci; the
quasimonomorphic mononucleotide repeats NR-21, BAT-26, BAT-25,
NR-24 and NR-22 were amplified and subsequently fragment length
analysis was performed using an ABI 3130xl Genetic Analyzer
(Applied Biosystems; Thermo Fisher Scientific, Inc.) as previously
described by Suraweera et al (20). The primer sequences used were as
follows: NR-21 forward, 5′-TAA ATG TAT GTC TCC CCT GG-3′ and
reverse, 5′-FAM-ATT CCT ACT CCG CAT TCA CA-3′; BAT-26 forward,
5′-TGA CTA CTT TTG ACT TCA GCC-3′ and reverse, 5′-ATTO550-AAC CAT
TCA ACA TTT TTA ACC C-3′; BAT-25 forward, 5′-FAM-TCG CCT CCA AGA
ATG TAA GT-3′ and reverse, 5′-TCT GCA TTT TAA CTA TGG CTC-3′; NR-24
forward, 5′-CCA TTG CTG AAT TTT ACC TC-3′ and reverse, 5′-HEX-ATT
GTG CCA TTG CAT TCC AA-3′; and NR-22 forward, 5′-GAG GCT TGT CAA
GGA CAT AA-3′ and reverse, 5′-FAM-AAT TCT GAT GCC ATC CA GTT-3′.
The interpretation of the results was based on the following
features: If ≥3 of these 5 loci were detectable with somatic
changes they were classified as high MSI (MSI-H); if ≤2 of the 5
markers exhibited somatic changes, they were considered low MSI
(MSI-L); and if no changes were detected, they were considered
microsatellite stable (MSS).
Western blot analysis
Whole cell extracts (50 µg protein per lane)
were isolated using CelLytic™ M (Sigma-Aldrich; Merck KGaA) with
protease inhibitor cOmpleteTM (Roche), quantified using Bradford
protein assay with Quick Start Bradford-Reagent (Bio-Rad
Laboratories, Inc.), separated on 10% polyacrylamide gels, followed
by transfer onto nitrocellulose membranes and antibody detection
using standard procedures was performed as described previously
(21). Membranes were blocked and
antibodies were diluted in 5% non-fat dry milk in tris-buffered
saline with 0.025% Tween-20 for 1 h at room temperature. The
following antibodies were used: Anti-SPTAN1 (1:100, overnight
shaking at 4°C, cat. no. sc-46696; clone C-11; Santa Cruz
Biotechnology, Inc.), anti-MLH1 (1:1,000, 1 h at room temperature,
cat. no. 554073; clone G168-728; BD Biosciences), anti-SPTAN1
(1:1,000, overnight shaking at 4°C, cat. no. MAB1622; EMD
Millipore), anti-β-actin (1:5,000, 1 h at room temperature, cat.
no. A5441; clone AC-15; Sigma-Aldrich-Merck KGaA), and for the
fluorescently labelled secondary antibody, IRDye 680LT goat
anti-mouse (1:20,000, 1 h at room temperature, cat. no. 926-68020,
LI-COR Biosciences). Fluorescence signals were detected in the
fluorescence scanner FLA-9000 Starion (Fujifilm Life Science). If
indicated, the band intensity of protein expression from two
western blots was quantified using Multi Gauge version 3.2
(Fujifilm, Inc.).
Proteome arrays
The Proteome Profiler Human Receptor Array,
non-hematopoietic kit (cat. no. ARY012; R&D Systems) was used
according to the manufacturer's protocol. This Human Soluble
Receptor array allows the simultaneous detection of the relative
levels of 119 different chemokines and soluble receptors, released
by non-hematopoietic cells, which are spotted in a duplicate
antibody pattern on nitrocellulose membranes. Protein extracts of
shMLH1-, shSPTAN1- or control-shRNA stably transduced SW620 and
SW480 cells were used. Briefly, proteins were extracted using lysis
buffer, which was a component of this kit, supplemented with 10
µg/ml Aprotinin (Sigma-Aldrich; Merck KGaA) and 10
µg/ml leupeptin (Sigma-Aldrich; Merck KGaA). After blocking,
arrayed antibody membranes were incubated with equal quantities of
protein at 4°C overnight. Subsequently, the membranes were washed 3
times in 1X wash buffer and incubated with horseradish peroxidase
(HRP)-conjugated antibodies (R&D Systems) for 2 h at room
temperature. After washing again, the membranes were incubated with
Streptavidin-HRP (R&D Systems) for 30 min at room temperature.
All antibodies and reagents (unless stated otherwise) were part of
the used kit. As stated, all steps were carried out according to
the manufacturer's instructions. Signals were visualized using the
chemiluminescent substrate, detected using a LAS-4000 mini
Luminescent Image Analyser and quantified using Multi Gauge version
3.2. The intensities of the signal spots of the target proteins
were determined with subtraction of the averaged background
negative control spot intensity. Data are presented as the relative
expression normalized to the positive control spot intensity.
Reverse transcription-quantitative PCR
(RT-qPCR)
Total RNA was extracted from the cells using TRIzol
reagent (Sigma-Aldrich; Merck KGaA) according to the manufacturer's
protocol. First-strand cDNA was prepared from 1 µg RNA with
50 ng/µl random hexamer primers using SuperScript™ III First
Strand Synthesis SuperMix (Invitrogen; Thermo Fisher Scientific,
Inc.) according to the manufacturer's protocol. qPCR was performed
using TaqMan® Gene Expression assays (Applied
Biosystems; Thermo Fisher Scientific, Inc.) for IL-8
(Hs00174103_m1), CXCR1 (Hs00174304_m1), CXCR2 (Hs00174146_m1);
GAPDH (Hs02786624_g1) was used as the housekeeping gene. qPCR
reactions included 7.5 µl TaqMan Gene Expression Mastermix,
0.75 µl 2X TaqMan assay, RNase-free water and 2 µl
cDNA (100 ng) in a total volume of 15 µl. The thermocycling
conditions were as follows: 50°C for 2 min, 95°C for 10 min;
followed by 50 cycles of 95°C for 15 sec and 60°C for 1 min, in a
StepOnePlus™ Real-Time PCR system (Applied Biosystems; Thermo
Fisher Scientific, Inc.). StepOne version 2.0 software was used to
measure the qPCR curves. Finally, Cq values were exported and
analysed in Microsoft Excel to determine the 2−ΔΔCq
values (22). All experiments were
performed at least 3 times.
Enzyme-linked immunosorbent assay
(ELISA)
Human CRC cells were seeded at 5×10⁵
cells per well in 6-well plates. Following 48 h of incubation, the
media were collected, centrifuged at 200 × g for 5 min at room
temperature and stored at −20°C until further use. The secretion of
IL-8 was determined using ELISA with a Human IL-8/CXCL8 Quantikine
ELISA kit (cat. no. D8000C; R&D Systems) according to the
manufacturer's protocol. Duplicates of undiluted cell culture media
were used for measurements and protein standard dilutions together
with the negative controls were. The optical density was detected
at 450 nm using an EnVision 2104 Multilabel Reader (PerkinElmer,
Inc.). All experiments were performed at least 3 times.
Isolation of neutrophilic granulocytes
and chemotaxis assays
Neutrophilic granulocytes were isolated from blood
and collected in EDTA-tubes using polymorphprep solution (Progen
Biotechnik). A total of 7.5 ml polymorphprep solution was placed
into a 15 ml falcon tube, then overlayed with blood, at a ratio of
1:1 and centrifuged at 450 × g for 30 min at room temperature. The
yellow plasma layer was discarded, and the neutrophilic
granulocytes were placed into a fresh 15 ml falcon tube. The
neutrophils were washed with PBS by centrifugation at 250 × g for
10 min at room temperature. The pellet was resuspended in 1 ml red
blood cell lysis buffer (Roche Diagnostics), incubated at 37°C for
5 min and centrifuged again at 250 × g for 5 min at room
temperature. Finally, the supernatant was removed, the neutrophilic
granulocytes were diluted in 1.5 ml serum-free DMEM, counted and
used for the chemotaxis assay.
The chemotaxis assay was performed by seeding
5×10⁵ neutrophils in 100 µl serum-free DMEM in
the upper chamber of a 24-Transwell plate. A CytoSelect™ 24-Well
Chemotaxis assay 3 µm (Cell Biolabs) was used according to
the manufacturer's protocol. A total of 500 µl DMEM with or
without 10% FBS and 1% penicillin-streptomycin and other additives
was added to the lower chambers. As a positive control DMEM with
10% FCS and penicillin-streptomycin as well as 100 ng recombinant
human IL-8 (R&D Systems) was added to the lower chamber. As a
negative control, DMEM with 10% FCS and penicillin-streptomycin
without further supplements was used. A total of 500 µl
media obtained from SPTAN1 knockdown cells or pLKO.1 transduced
control cell lines was added to the lower chamber. The 24-transwell
plate was then incubated for 24 h with 5% CO2 at
37°C.
Subsequently, each insert was transferred to a new
well and incubated with 200 µl cell detachment solution
(Cell Biolabs) for 30 min at 37°C to remove neutrophilic
granulocytes adhering to the Transwell chamber. To combine
migratory cells in the medium and on the bottom side of the
Transwell, 400 µl of the 500 µl medium solution
containing migratory cells from the lower chambers of the starting
24-Transwell plate was added. Subsequently, 180 µl of the
neutrophil containing mixture was transferred into a 96-well plate,
60 µl CyQuant GR Dye solution (Cell Biolabs; diluted 1:75 in
4× lysis buffer) was added, and the samples were incubated for 20
min at room temperature. For measurements, 200 µl of each
sample was transferred into a 96-well solid black micro-plate
suitable for fluorescence measurements and measured at an
excitation/emission spectra of 485/510 nm in an EnVision 2104
Multilabel Reader. The resulting data were expressed as relative
fluorescence units (RFU). All experiments were performed at least 3
times.
Analysis of IL-8-251T>A
polymorphism
The genotype of single nucleotide polymorphism
(SNP)-251 (rs4073) (T>A) was determined in all cell lines by
sequencing. Following amplification of the SNP region (forward
primer, 5′-ATC CAT GAT CTT GTT CTA AC-3′ and reverse primer, 5′-CCC
TAC TAG AGA ACT TAT GC-3′) and generation of a 316 bp PCR product,
the PCR product was purified using QIAquick PCR Purification kit
(Qiagen, Inc.) and the SNP was determined by sequencing using
BigDye Terminator 3.1 Ready Reaction mix (Thermo Fisher Scientific,
Inc.) and DyeEx® 2.0 Spin kit (Qiagen, Inc.) on a 3130xl
Genetic Analyser (Applied Biosystems; Thermo Fisher Scientific,
Inc.). The human sequence of IL-8 rs4073 (NG_029889.1) was used as
the reference.
Immunohistochemical analysis
IL-8 expression was analysed by immunohistochemistry
using FFPE MLH1-deficient or MLH1-proficient CRC tissue, as
previously described (7,18). Briefly, 2 µm sections of
samples were cut from the FFPE invasively growing CRC specimens.
Surrounding healthy colonic mucosa served as the control. Sections
were deparaffinised twice with xylene and rehydrated in a
decreasing series of 5 alcohol solutions. Antigen retrieval was
performed by heating in a pressure cooker for 15 min in EDTA
buffer, pH 8.0. This was followed by incubation for 10 min with 3%
H2O2 to block endogenous peroxidase activity.
Sections were washed with 1X PBS (Gibco; Thermo Fisher Scientific,
Inc.) before and in between incubation steps. Primary IL-8 antibody
(C4; cat. no. LS-C663556; LifeSpan BioSciences, Inc.; 15
µg/ml, 1:76) was diluted in PBS containing 1% bovine serum
albumin (BSA). Sections were incubated with the primary antibody at
4°C overnight, followed by application of the EnVision System mouse
(cat. no. K4000; Agilent Technologies, Inc.), which employs the
enzyme HRP coupled to a secondary antibody and the chromogen
3,3′-diaminobenzidine (DAB). Samples were incubated with 4 drops of
the secondary HRP-antibody for 30 min at room temperature and
peroxidase reagent DAB for 10 min, diluted to 1 drop of DAB
chromogen per ml of DAB substrate buffer (cat. no. K3467; Agilent
Technologies, Inc.). Sections were counterstained for 2 min using
Gill's haematoxylin solution (Sigma-Aldrich; Merck KGaA).
Immunohistochemical staining was examined using a Keyence
microscope (Model BZ-9000; Keyence Corp.). Negative controls were
processed in parallel to exclude non-specific staining.
Statistical analysis
Data are expressed as the means ± standard deviation
as appropriate. Data were analysed using BiAS for Windows (version
9.11) (23). RT-qPCR and
chemotaxis assay data were compared using the Student's t-test or
Kruskal-Wallis test for comparisons of >2 groups followed by
multiple Conover-Iman post hoc tests with Bonferroni-Holm
correction. Differences between IL-8 secretion measurements using
ELISA were assessed for statistical significance using one-way
ANOVA and post hoc Scheffe analysis. P-values are two-sided and
P<0.05 was considered to indicate a statistically significant
difference. Experiments were performed at least 3 times.
Results
Knockdown of SPTAN1 and MLH1 increases
expression of IL-8
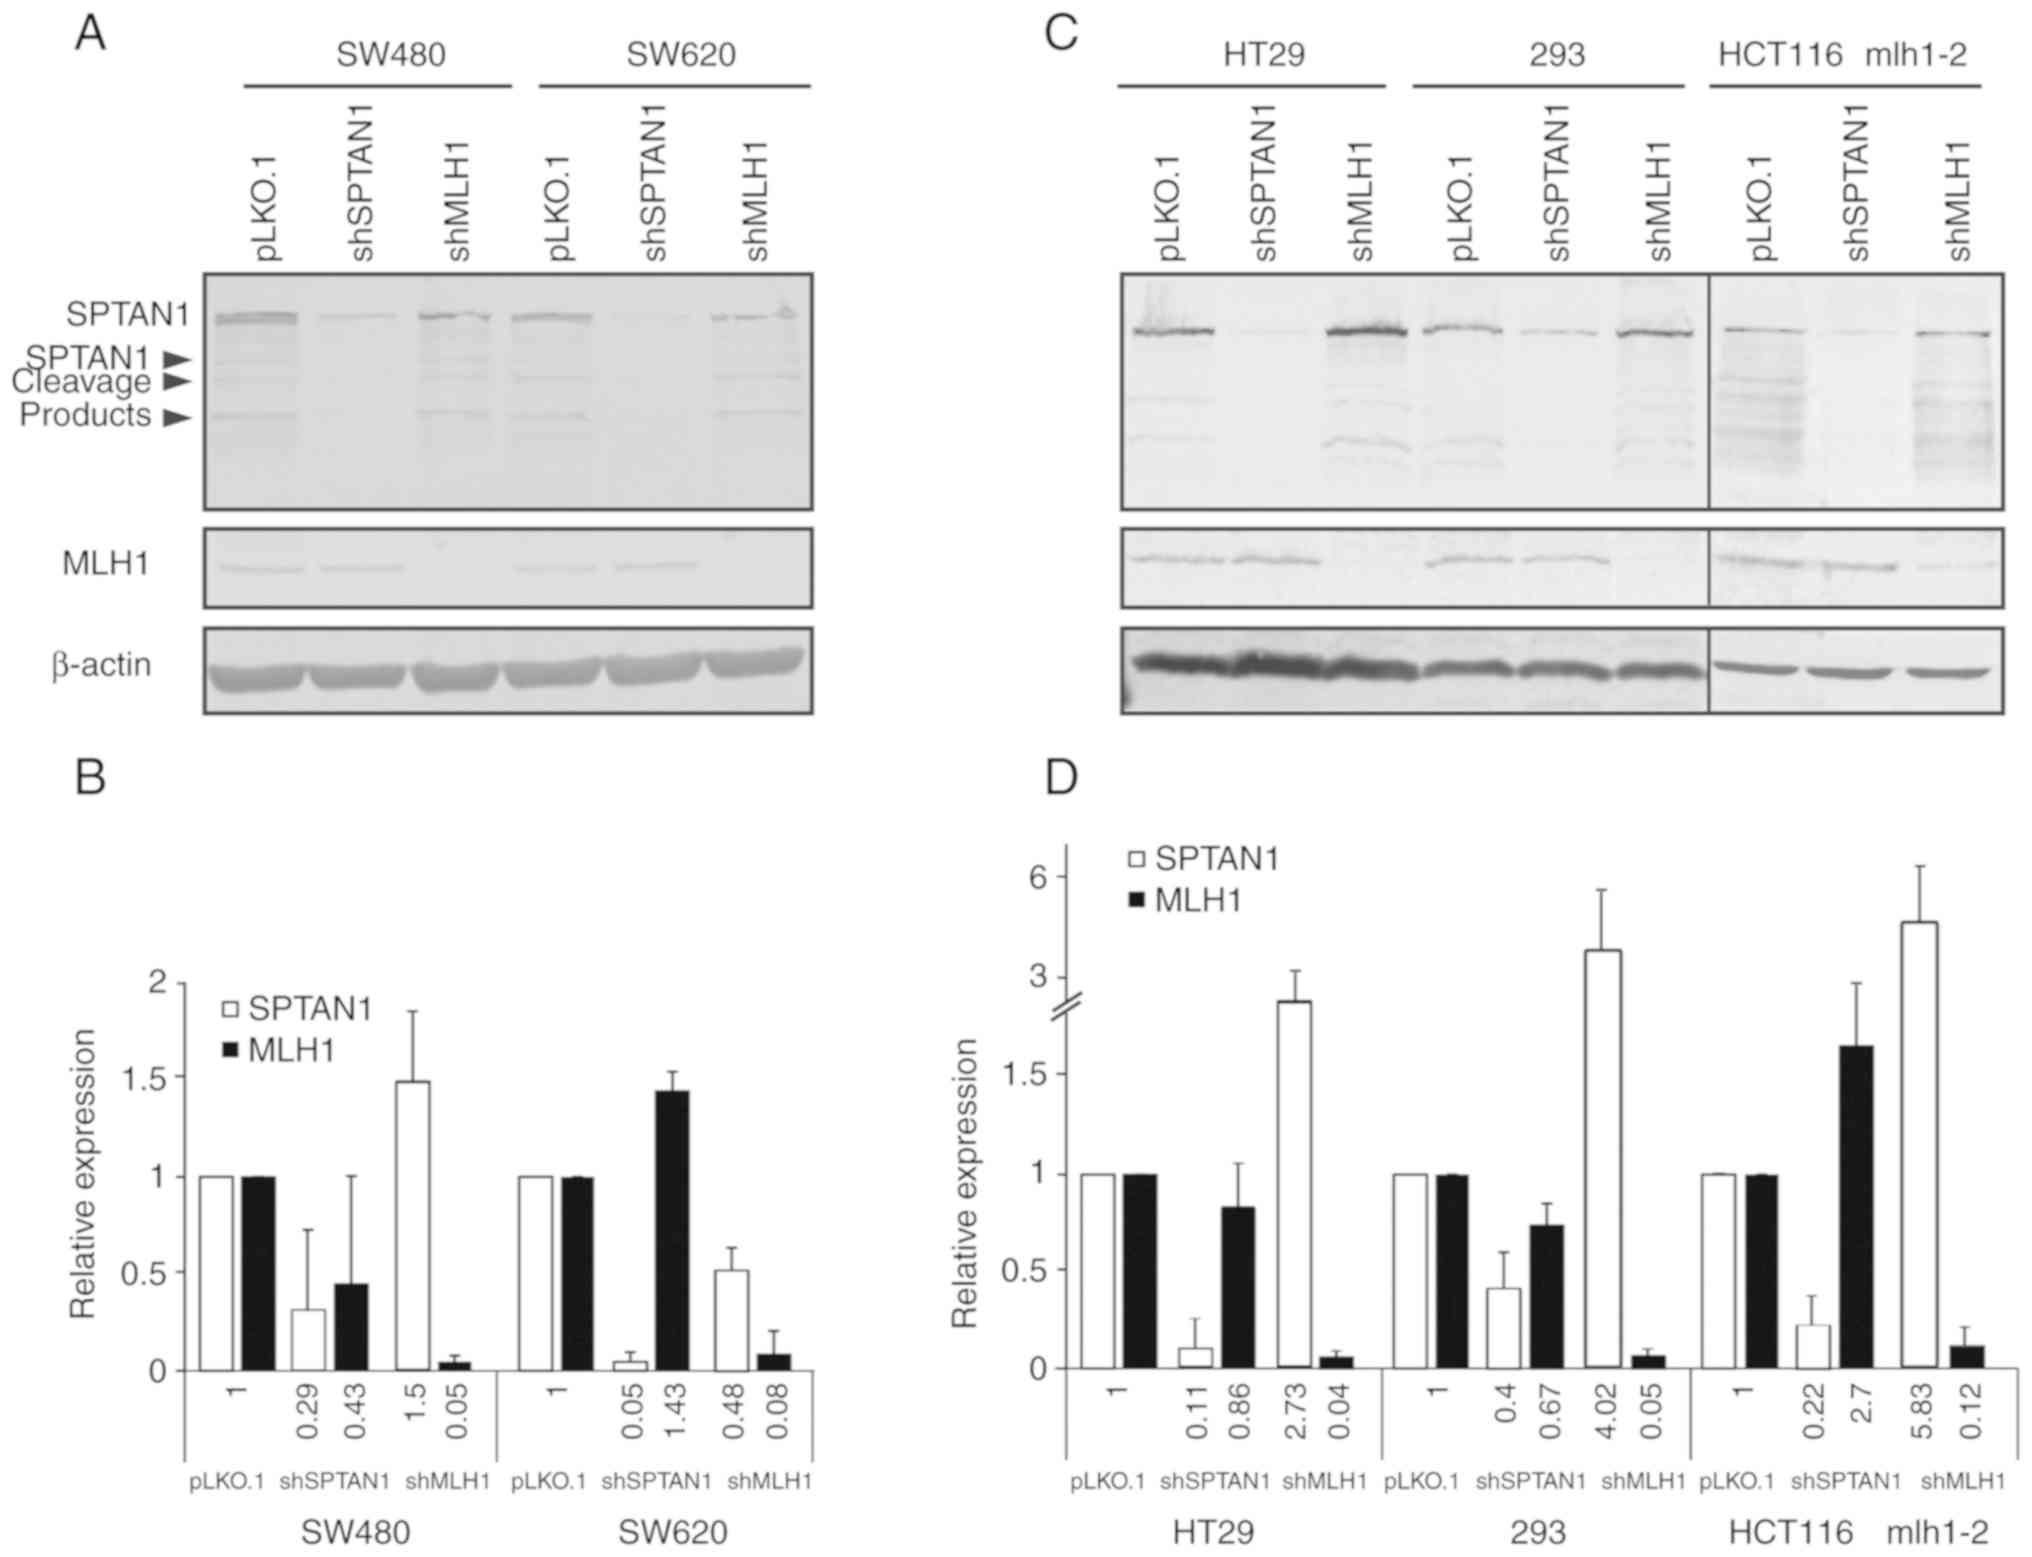
Using SW480 and SW620 cells stably transduced with
shMLH1 or shSPTAN1 and the corresponding controls (Fig. 1A and B), the Proteome Profiler
Human Soluble Receptor Array was used to analyse the cellular
expression levels of 119 different chemokines and soluble
receptors. The resulting mean pixel density of each spot was
calculated, an averaged background signal was subtracted, and
values were compared relative to the positive controls on the
membrane of the human common analytes array (part C) (Fig. S1). There was a clear difference in
the expression levels of the pro-inflammatory cytokine IL-8 in the
cells in which SPTAN1 was knocked down in both cell lines. While
the shSPTAN1-transduced SW480 cells exhibited a notable decrease in
IL-8 expression (Fig. S1A and E),
the shSPTAN1-transduced SW620 cells exhibited increased IL-8
expression levels (Fig. S1C and
E). By contrast, the reduction of MLH1 expression in the SW480
cells resulted in an increased IL-8 expression (Fig. S1B and E), whereas MLH1 knockdown
in the SW620 cells had no effect on the IL-8 levels (Fig. S1D and E).
To exclude the possibility that changes in IL-8
expression were caused by MLH1 or SPTAN1 knockdown, the induced
accumulation of frameshift mutations in genes encompassing coding
microsatellites, MSI was analysed in single cell clones of shMLH1-
or shSPTAN1-transduced SW480 and SW620 cells. On the whole, 76
different cell clones were analysed; 12 clones of
shSPTAN1-transduced SW480 cells, 14 clones of shMLH1-transduced
SW480 cells, 15 clones of pLKO.1-transduced SW480 cells, 12 clones
of shSPTAN1-transduced SW620 cells, 7 clones of shMLH1-transduced
SW620 cells and 16 clones of pLKO.1-transduced SW620 cells. MSI was
not detected in the SW480 or SW620 cells transduced with shMLH1 or
shSPTAN1 (Fig. S2 and Table
SI).
Increased IL-8 mRNA expression levels are
associated with a decreased SPTAN1 expression
In order to determine the effects of SPTAN1 or MLH1
knockdown on IL-8 in other cell lines, 3 additional
stably-transduced shMLH1 and shSPTAN1 cell lines were generated:
HT29, 293 and HCT116 mlh1-2. These cell lines (Figs. 1C and D, and S3B and C), together with the panel of
SW480 and SW620 cells (Figs. 1A and
B, and S3A) were used for
RT-qPCR to analyse the mRNA expression levels of IL-8 (Fig. 2, left panels). The decreased
expression of SPTAN1 was associated with an enhanced mRNA
expression of IL-8 in 4 of the 5 tested cell lines. IL-8 was
significantly enhanced in the shSPTAN1-transduced 293 (P=0.004) and
HCT116 mlh1-2 cells (P=0.008), and exhibited a notable increase in
the shSPTAN1-transduced SW620 (P=0.055) and HT29 (P=0.057) cells,
although the increase was not considered statistically significant
(Fig. 2B-E, left panels). By
contrast, the knockdown of SPTAN1 significantly decreased the mRNA
expression levels of IL-8 in the SW480 cells (P= 0.008; Fig. 2A, left panel). The knockdown of
MLH1 resulted in significantly reduced IL-8 mRNA expression levels
in the HCT116 mlh1-2 (P=0.008) cells (Fig. 2E, left panel), whereas the
expression of IL-8 was significantly increased in the SW480
(P=0.008) and 293 (P=0.033) cells (Fig. 2A, C and D, left panels) and also
increased in the HT29 cells in which MLH1 was knocked down,
although with no statistically significance (P= 0.057). The
knockdown of MLH1 in the SW620 cells had no marked effect on the
expression of IL-8 (Fig. 2B, left
panel).
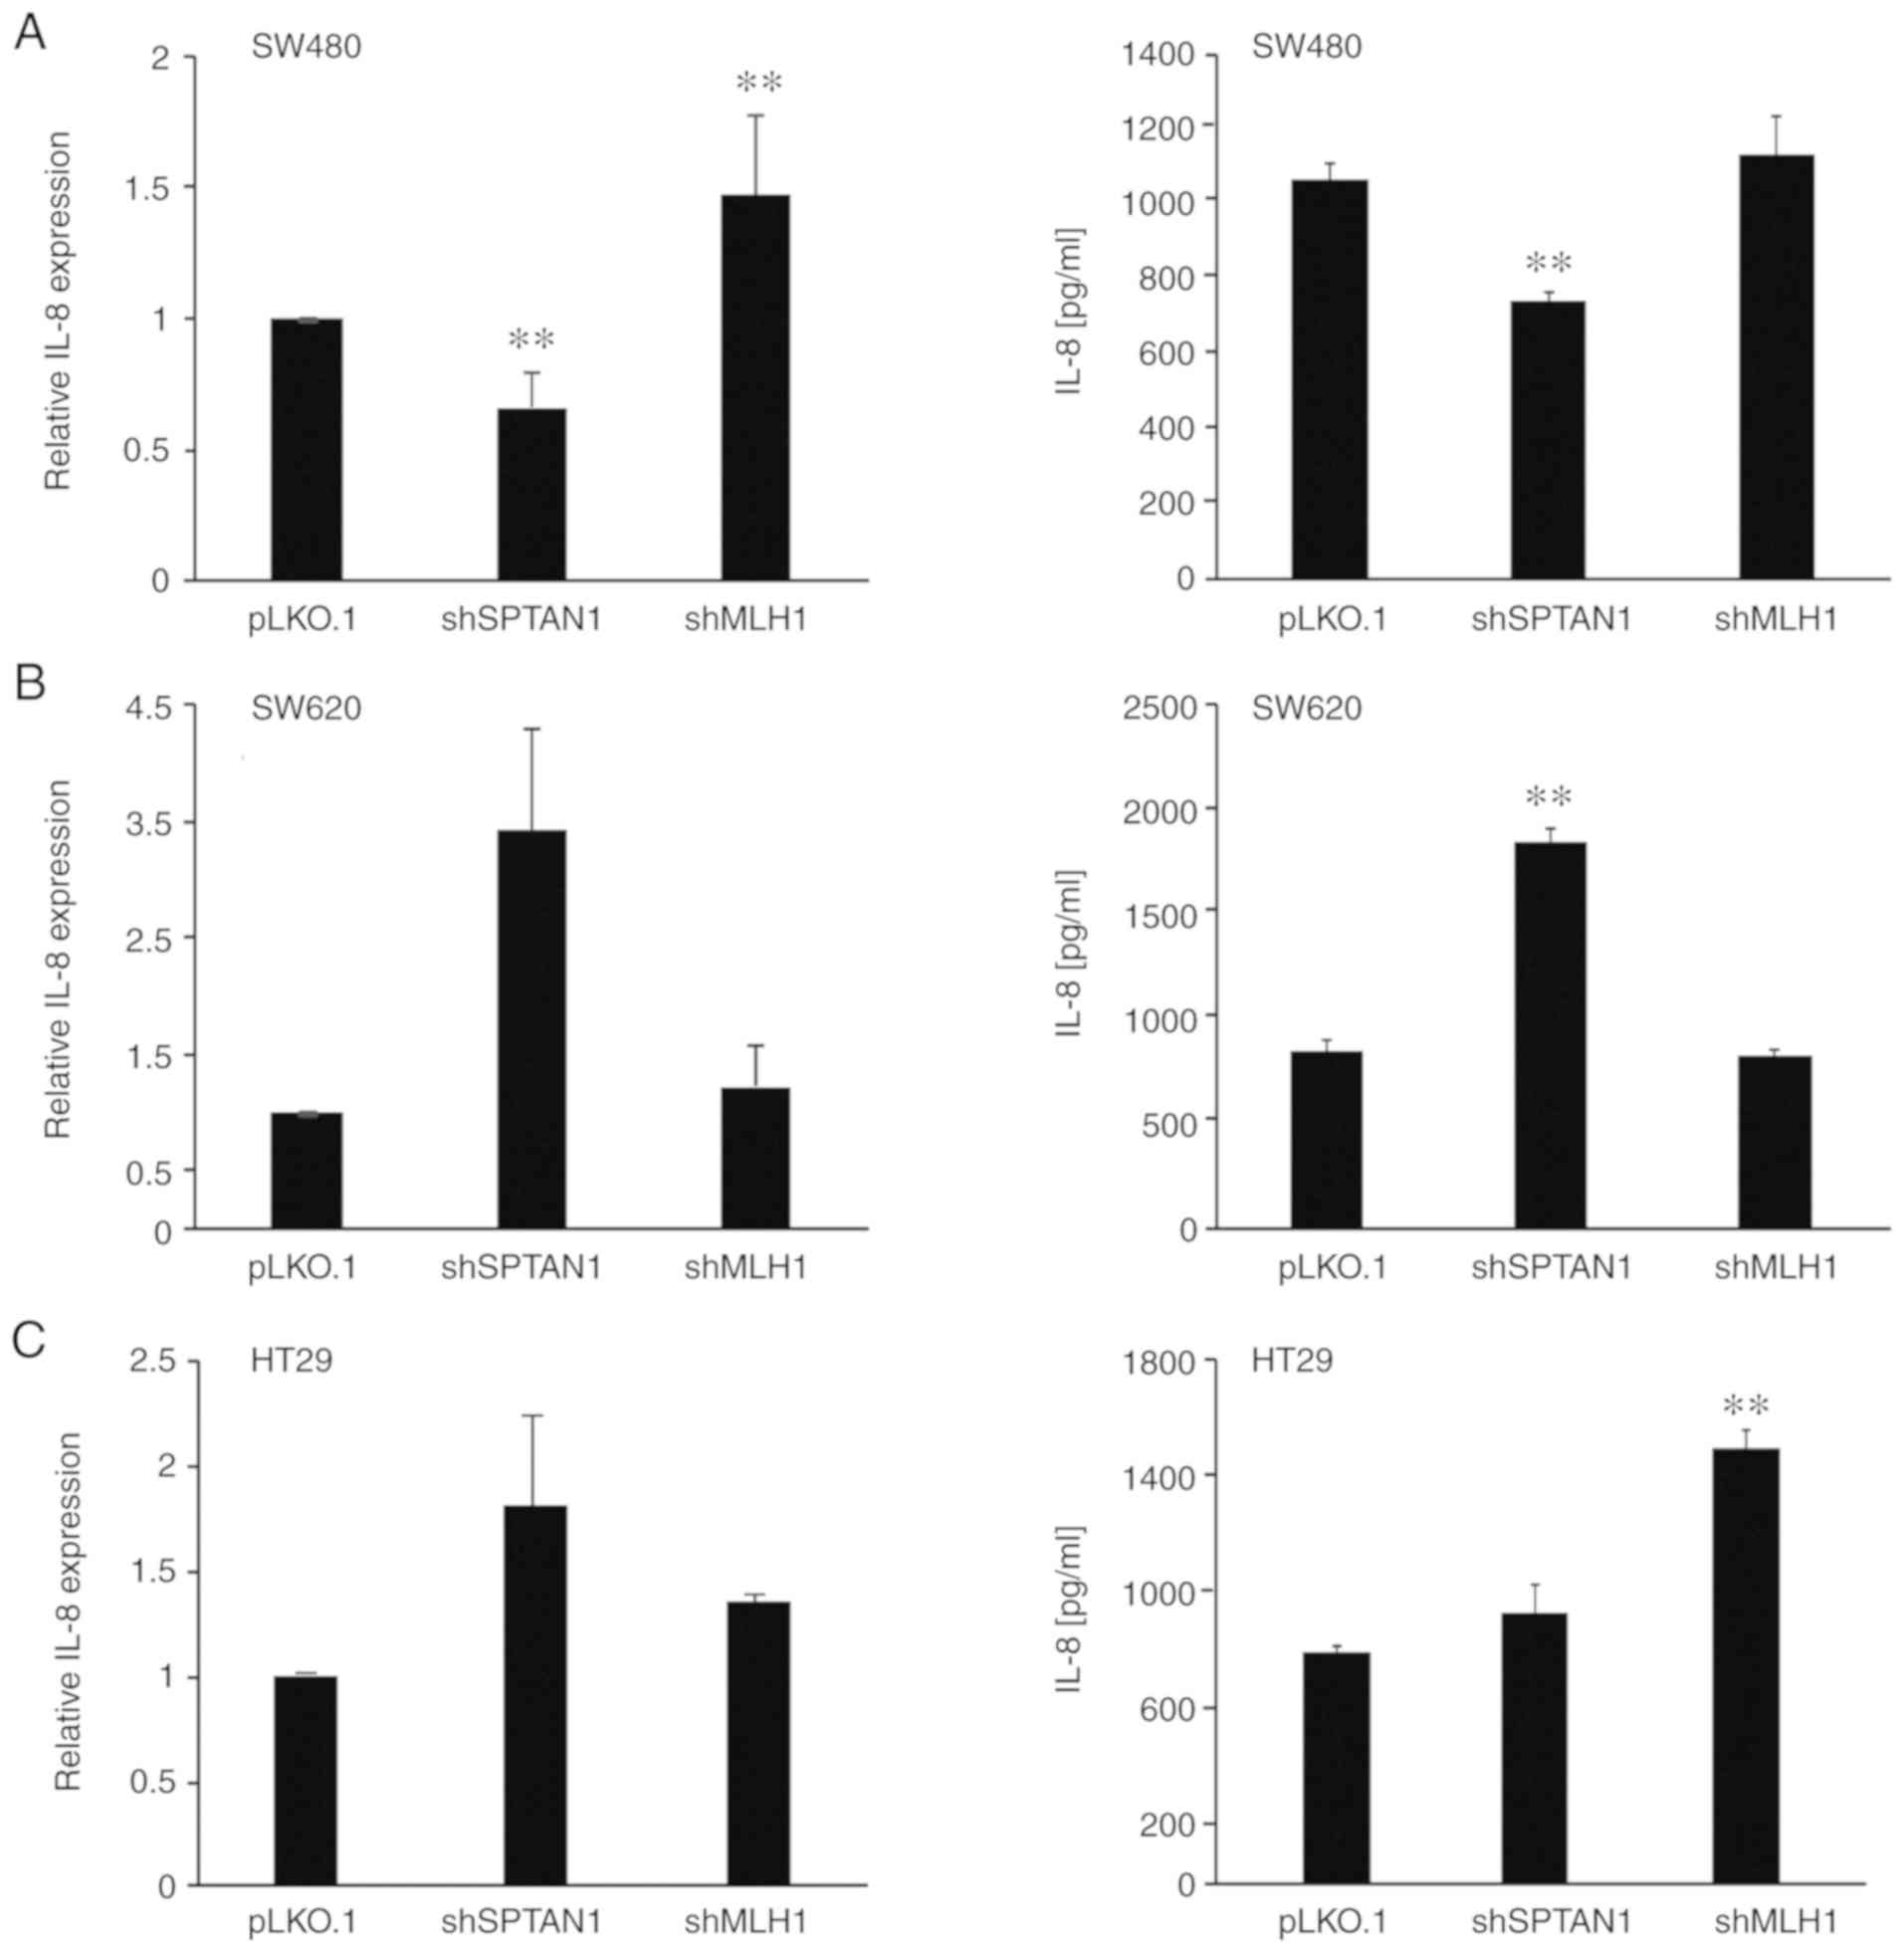 | Figure 2Relative mRNA expression and
secretion of IL-8 in cells in which SPTAN1 and MLH1 were knocked
down. Cells in which SPTAN1 and MLH1 were knocked down (A) SW480,
(B) SW620, (C) HT29, (D) 293 and (E) HCT116 mlh1-2 were used to
determine the relative mRNA expression of IL-8 (left panels), and
the media from these cell lines were used to detect secreted IL-8
(right panels). Expression data are presented relative to the
pLKO.1 transduced control. ELISA quantification was performed using
a protein standard curve. Cells with a high IL-8 expression
exhibited an increased secretion of IL-8, whereas cells with a low
IL-8 expression exhibited a decreased secretion of IL-8 compared
with the control cells, respectively. *P<0.05,
**P<0.01, compared to the control. SPTAN1,
non-erythroid spectrin αII; MLH1, mutL homologue 1. |
Differential expression of IL-8 affects
IL-8 secretion in cells in which SPTAN1 and MLH1 are knocked
down
The secretion of IL-8 in the previously described
knockdown cell lines was assessed using ELISA (Fig. 2, right panels) compared with the
control shRNA-transfected cells. The secretion of IL-8 was
associated with the mRNA expression levels of IL-8 in almost all
cell lines. SW620 cells transduced with shSPTAN1 (P<0.000;
Fig. 2B, right panel) and the
shSPTAN1-transduced 293 cells (P<0.000; Fig. 2D, right panel) exhibited a
significantly increased IL-8 secretion, whereas the
shSPTAN1-transduced SW480 cells secreted significantly lower levels
of IL-8 (P<0.002; Fig. 2A,
right panel) compared with the control cells. The secretion of IL-8
in the shSPTAN1-transduced HT29 cells (Fig. 2C, right panel) and
shSPTAN1-transduced HCT116 mlh1-2 cells (Fig. 2E, right panel) did not differ
notably from that of the control cell lines, although the mRNA
levels were increased (Fig. 2C and
E, left panels).
HT29 cells transduced with shMLH1 (P<0.000), as
well as the shMLH1-transduced 293 cells (P=0.068) exhibited an
increased IL-8 secretion (Fig. 2C and
D, right panels). Of note, the shMLH1-transduced HCT116 mlh1-2
cells (P<0.000) exhibited a significantly decreased secretion of
IL-8 (Fig. 2E, left panel).
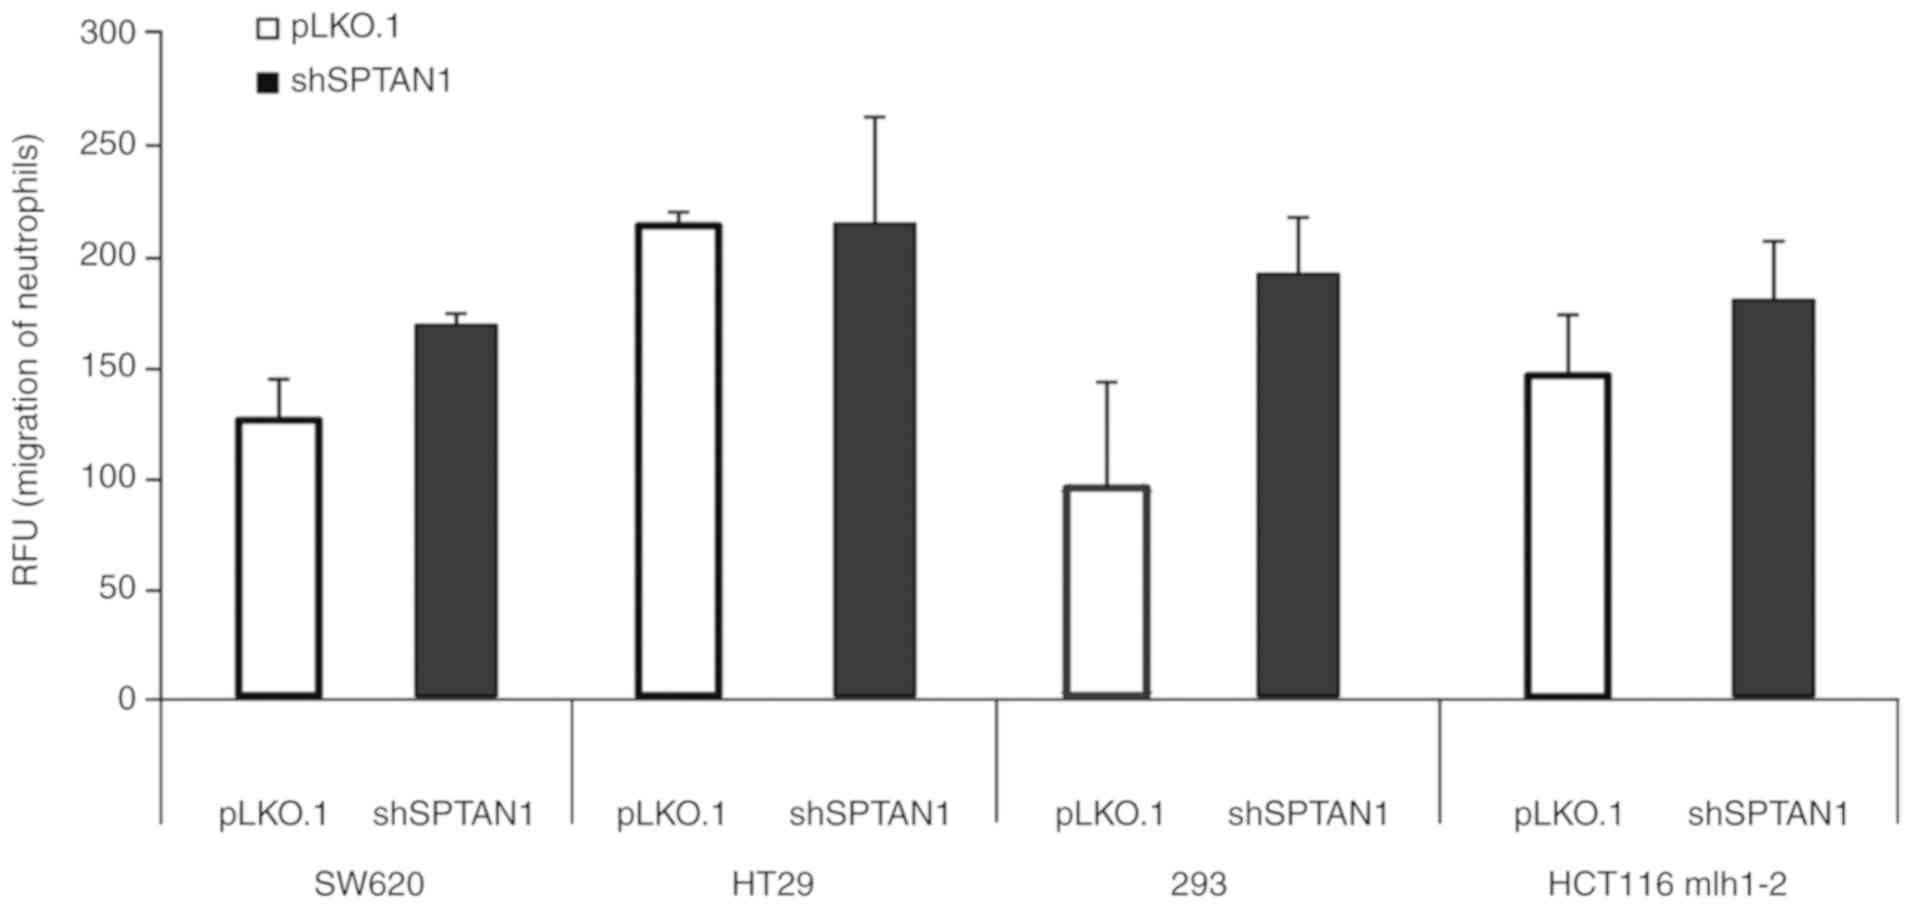
Induction of neutrophil migration by IL-8
using media from cell lines in which SPTAN1 was knocked down
Chemotaxis assays were performed using the media
from 4 cell lines in which SPTAN1 was knocked down, the SW620,
HT29, 293 and HCT116 mlh1-2 cells (Fig. 3), which all exhibited an increased
secretion of IL-8 (Fig. 2). The
migration of neutrophilic granulocytes was induced by the media
from the shSPTAN1-transduced SW620 (P=0.069), 293 (P=0.217) and
HCT116 mlh1-2 cells (P=0.218) compared with the pLKO.1-transduced
controls, respectively, although the differences were not
statistically significant. An induction of granulocyte migration
using the media from the shSPTAN1-transduced HT29 cells (P=0.984)
was not detectable (Fig. 3).
IL-8 secretion in shSPTAN1- and
shMLH1-co-transduced SW620 cells is initiated by the loss of
SPTAN1
To determine whether the loss of SPTAN1 expression
may also result in an increased IL-8 secretion in shMLH1-transduced
CRC cells, a cell line in which SPTAN1 and MLH1 were co-knocked
down was generated using the SW620 cells (Fig. 4A) and compared to sister cells in
which MLH1, SPTAN1 or control shRNA were used alone. As shown in
Fig. 4B, the shSPTAN1-transduced
(P<0.000), as well as shSPTAN1- and shMLH1-co-transduced
(P<0.000) SW620 cells exhibited a significantly increased IL-8
secretion, as detected by ELISA. However, the secretion of IL-8
from the SW620 cells in which MLH1 was knocked down (P<0.000)
was significantly decreased compared with that of the control cell
line. In line with these data, the chemotaxis assay revealed an
increased induction of the migration of neutrophilic granulocytes
by media from the shSPTAN1-transduced SW620 cells (P=0.239), which
was significantly increased using the media from shSPTAN1- and
shMLH1-co-transduced SW620 cells (P=0.046) compared with the
control (Fig. 4C). Media from the
SW620 cells in which MLH1 was knocked down resulted in the
decreased induction of neutrophilic granulocyte migration (P=0.254,
Fig. 4C).
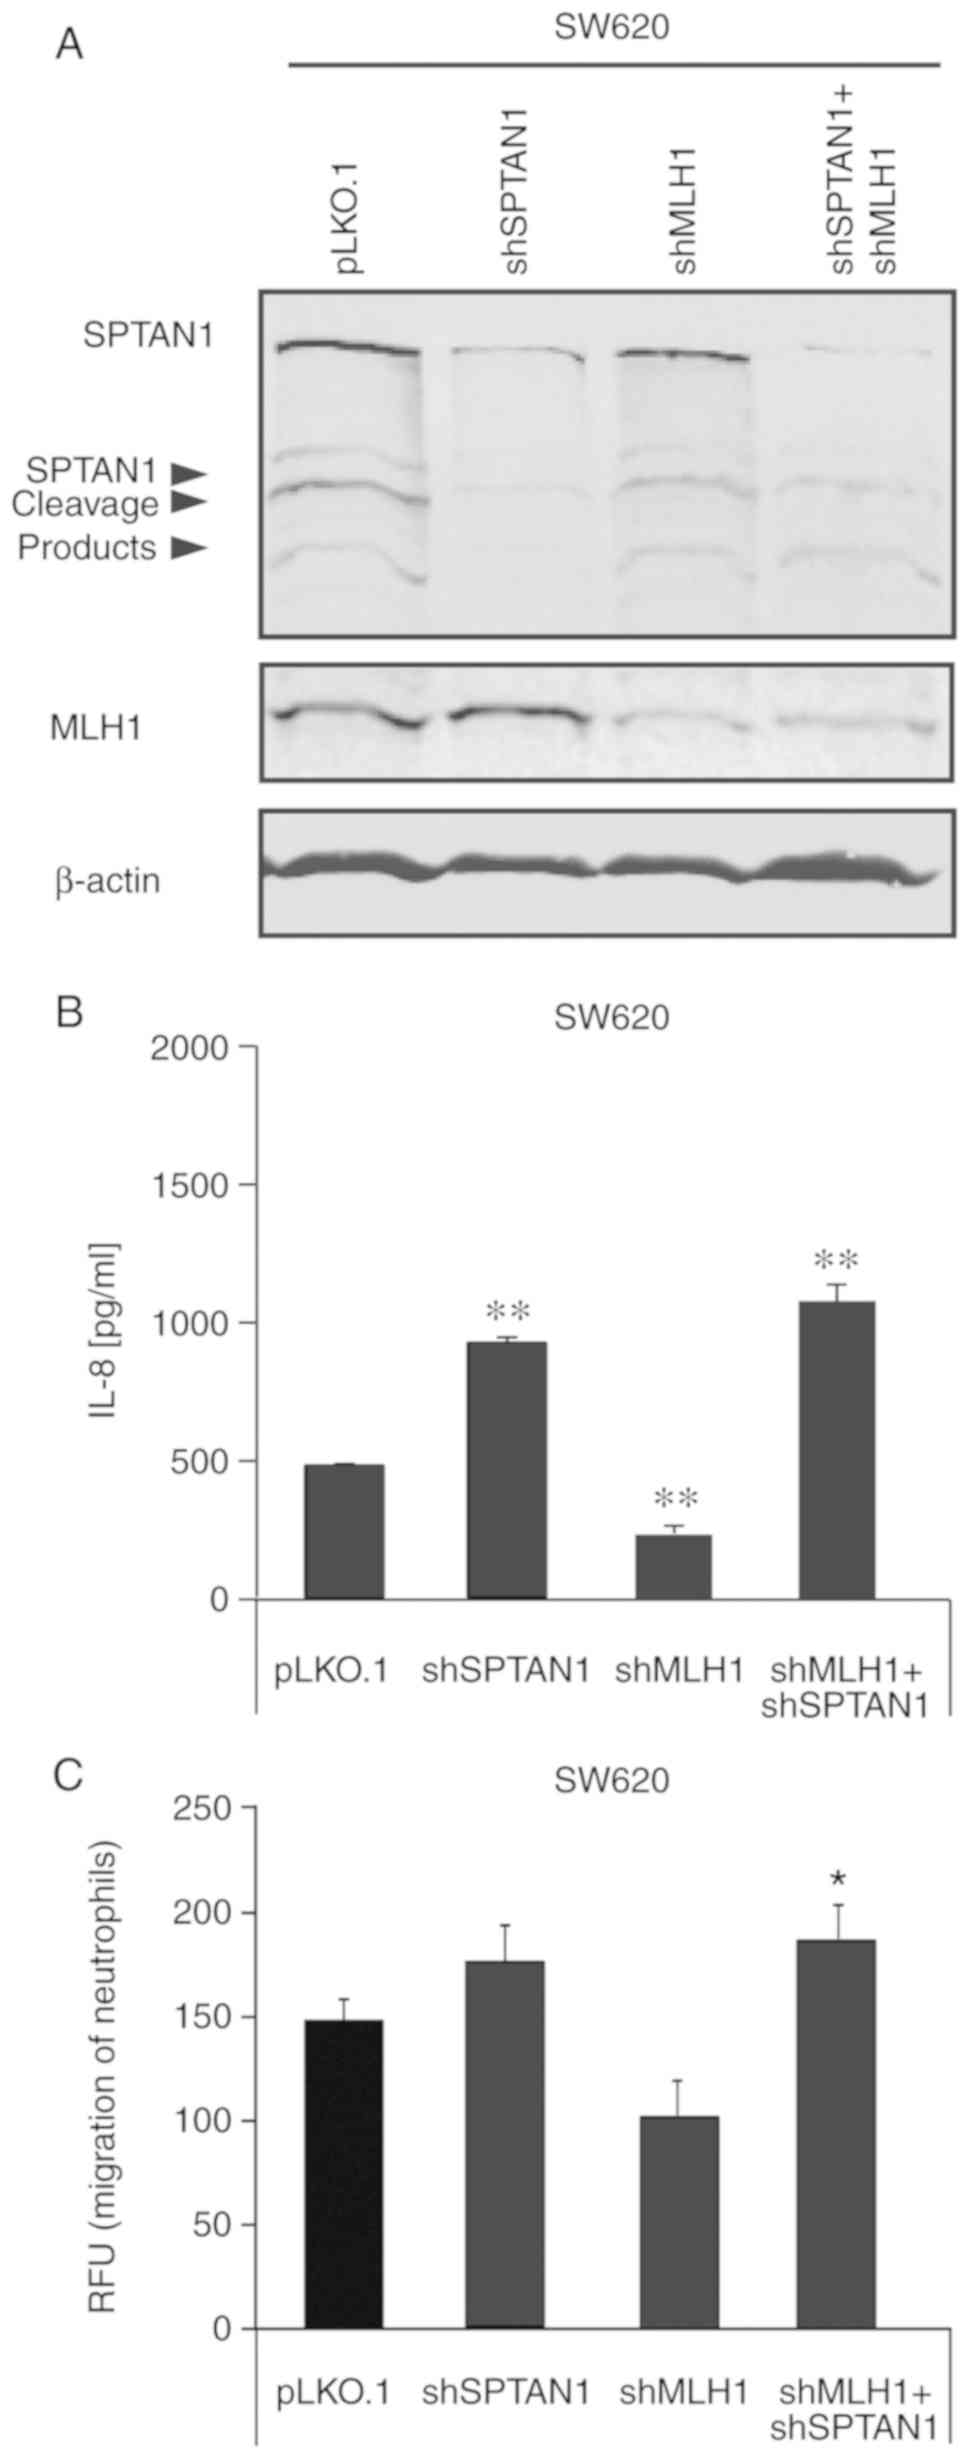 | Figure 4Loss of SPTAN1 expression underlies
the increased IL-8 secretion in shSPTAN1- and shMLH1-co-transduced
SW620 cells. SW620 cells transduced with shMLH1, shSPTAN1 or
co-transduced with shMLH1 and shSPTAN1 were generated and (A) the
success of stable transduction was confirmed using by blot
analysis. The corresponding full-length western blot is shown in
Fig. S3D. Media from shMLH1,
SPTAN1 or co-transduced cells were used to analyse (B) IL-8
secretion and (C) effect on the migration of neutrophilic
granulocytes, and the resulting data were compared with the
pLKO.1-transduced controls, respectively. (B and C) IL-8 secretion
in media from shMLH1-transduced SW620 cells were significantly
reduced and resulted in the decreased migration of neutrophils,
whereas IL-8 levels in the media from cells in which SPTAN1 was
knocked down, and in media from MLH1- and SPTAN1-co-knockdown SW620
cells were significantly increased; the migration of neutrophils
was also significantly increased compared with the control cells.
Black arrows mark the cleavage products of SPTAN1.
*P<0.05, **P<0.01, compared to the
control. sh, short hairpin; SPTAN1, non-erythroid spectrin αII;
MLH1, mutL homologue 1. |
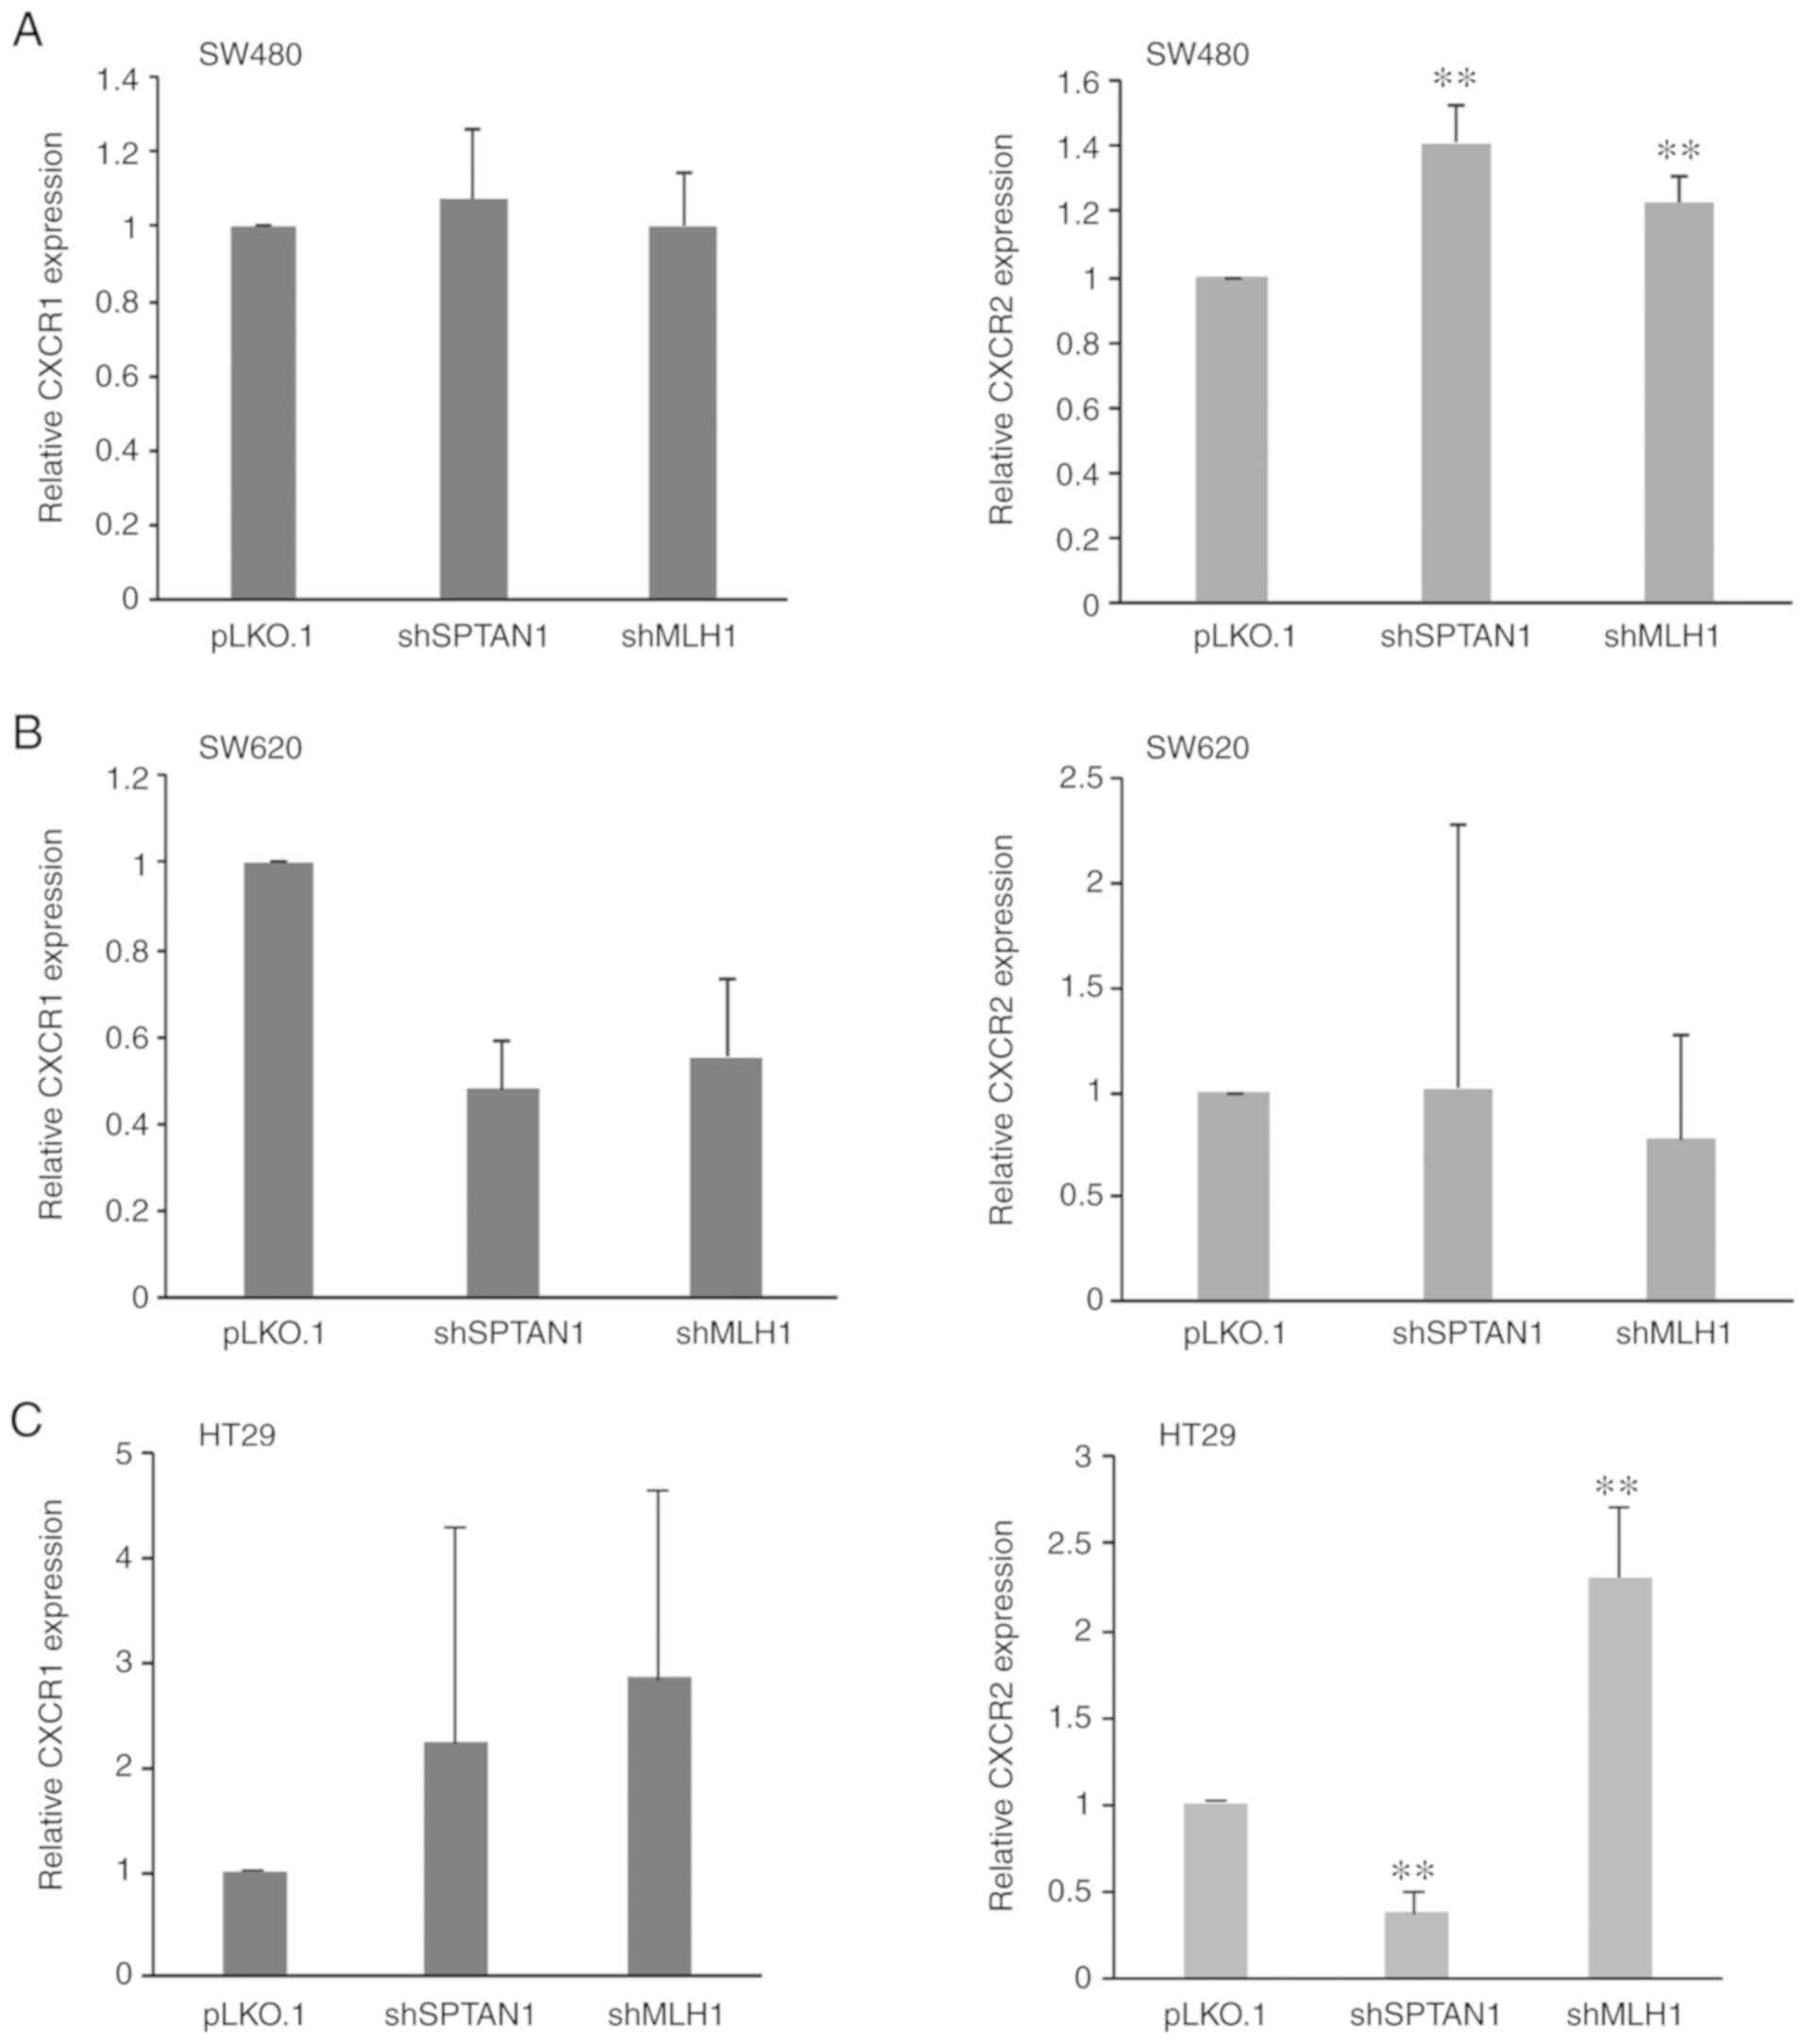
Expression of CXCR1 and CXCR2 is not
associated with IL-8 expression
Using RT-qPCR, the expression of the corresponding
IL-8 receptors, CXCR1 and CXCR2, was assessed. A consistent trend
was not detected following SPTAN1 or MLH1 knockdown. In the SW480
cells, the expression of CXCR1 mRNA was not affected by the
knock-down of SPTAN1 or MLH1 (Fig.
5A, left panel); however, the expression of CXCR2 was
significantly increased in the shSPTAN1-transduced SW480 cells
(P<0.000) and in the shMLH1-transduced SW480 cells (P=0.008,
Fig. 5A, right panel). The SW620
cells transduced with shSPTAN1 and shMLH1 exhibited decreased CXCR1
mRNA levels (P=0.060, respectively; Fig. 5B, left panel); however, there was
no difference in the CXCR2 mRNA levels compared with the control
(Fig. 5B, right panel). The
decreased expression of SPTAN1 and MLH1 resulted in the enhanced
mRNA expression of CXCR1 in the HT29 cells (P=0.725, Fig. 5C, left panel), whereas CXCR2
expression was significantly decreased in the shSPTAN1-transduced
cells (P=0.008) and significantly increased in the
shMLH1-transduced HT29 cells (P=0.008; Fig. 5C, right panel). The mRNA expression
levels of CXCR1 (P=0.202) and CXCR2 (P=0.063) were increased in the
293 cells following SPTAN1 knockdown (Fig. 5D); however, in the
shMLH1-transduced 293 cells, CXCR1 expression was decreased,
whereas CXCR2 expression was slightly increased (Fig. 5D). The shSPTAN1- and
shMLH1-transduced HCT116 mlh1-2 cells exhibited decreased CXCR1
mRNA levels (P=0.061, Fig. 5E,
left panel), whereas increased expression levels of CXCR2 were
observed in the shMLH1-transduced HCT116 mlh1-2 cells (P=0.138;
Fig. 5E, right panel).
Cellular IL-8 expression is not related
to the IL-8 (rs4073)-251 T/A polymorphism
A SNP in the IL-8 gene (rs4073) at position-251
(T>A) has been demonstrated to be associated with inflammatory
diseases and CRC (24-30). The allele A of SNP-251 (rs4073) has
been shown to be associated with an increased risk of tumour
development/cancer and metastasis, and a worse prognosis (25,28-31).
Other studies have demonstrated that the IL-8 SNP has no effect or
reduced tumour risk for the IL-8-251A genotype (24,32,33).
In order to determine whether the IL-8 (rs4073)-251 T/A
polymorphism was present, the DNA of all cell lines was analysed.
The SW480, as well as the SW620 cells harboured the TT genotype of
SNP-251 (rs4073), whereas the HT29, HCT116 mlh1-2 and 293 cells
possessed the AA genotype. The results of the IL-8 SNP analysis are
summarized in Table II.
| Table IIIL-8-251 T/A (rs4073) SNP genotype of
the analysed CRC cell lines. |
Table II
IL-8-251 T/A (rs4073) SNP genotype of
the analysed CRC cell lines.
| Cell line | -251 T>A
genotype (rs4073) |
|---|
| SW480 | T/T |
| SW620 | T/T |
| HT29 | A/A |
| HCT116 mlh1-2 | A/A |
| 293 | A/A |
Immunohistochemical analysis of IL-8
To examine IL-8 expression in vivo, FFPE CRC
tissue from 10 patients were analysed using immunohistochemistry;
exemplarily images are presented in Fig. 6. Of the samples, 10 tumours were
MLH1-deficient and SPTAN1 expression was weak, and 10 were
MLH1-proficient and SPTAN1 expression was strong, as previously
described (7). Immunohistochemical
IL-8 data were visually evaluated with regard to staining intensity
and the results are summarized in Table I. IL-8 was detectable in all tested
samples; however, significant differences in IL-8 expression were
not observed between the MLH1-deficient and weakly
SPTAN1-expressing CRC tissues, and the MLH1-proficient and strongly
SPTAN1-expressing tumours. A negative control sample (without a
primary antibody) of a MLH1-proficient CRC (Table I; patient 15) was processed in
parallel (Fig. 6D).
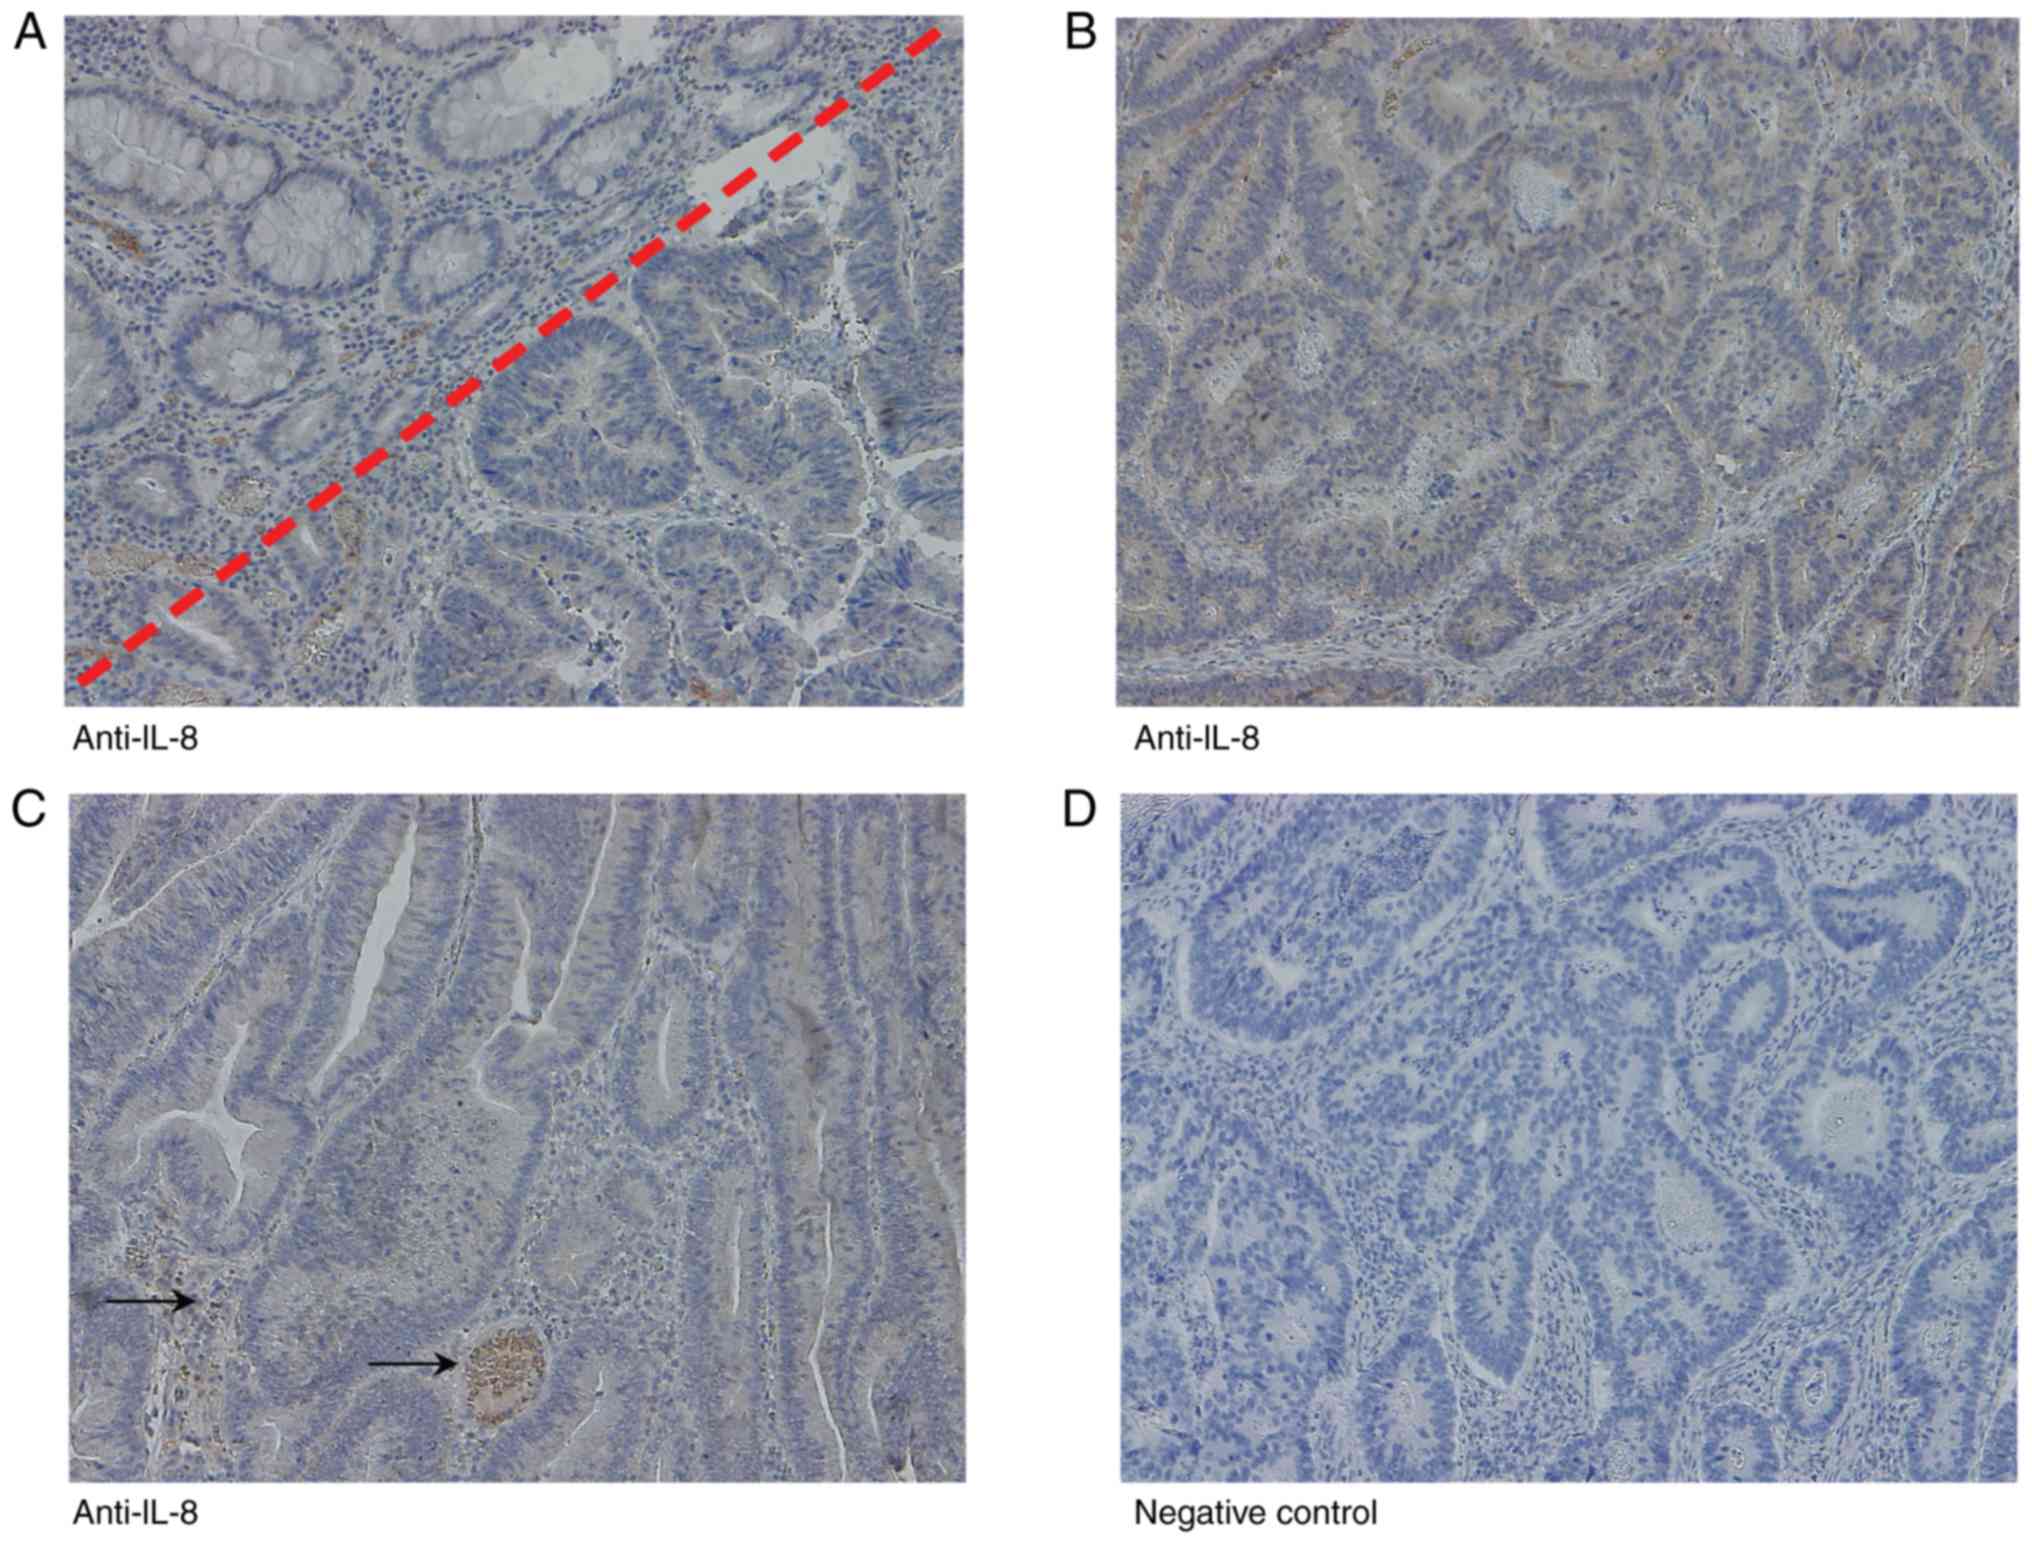 | Figure 6IL-8 protein expression in
MLH1-deficient and MLH1-proficient CRC tissue samples.
Immunohistochemistry images of (A) MLH1-proficient CRC (Table I, patient 18) with adjacent healthy
mucosa (right lower corner), (B) a MLH1-proficient CRC (Table I, patient 15) and (C) a
MLH1-deficient CRC (Table I,
patient 173). (D) A negative control sample (without primary
antibody) of a MLH1-proficient CRC (Table I, patient 15) was processed in
parallel. Magnification, ×10. (A) An MLH1-proficient CRC tissues
with high SPTAN1 staining intensity exhibited increased cytoplasmic
expression of IL-8 compared with the healthy mucosa. (B and C)
MLH1-proficient (high SPTAN1 expressing) and MLH1-deficient (low
SPTAN1 expressing) did not exhibit any significant differences in
IL-8 expression. Lymphocytes and neutrophilic granulocytes in
peritumoral infiltrates, as well as erythrocytes in vessels (black
arrows) served as the internal positive control for IL-8 staining.
CRC, colorectal cancer; SPTAN1, non-erythroid spectrin αII; MLH1,
mutL homologue 1. |
Discussion
The molecular background between MSI-CRC and
sporadic CRC varies significantly (34). The elucidation of the molecular
factors which are associated with improved survival rates, reduced
aggressiveness or a more favourable prognosis of MSI-CRC are the
focus of clinical research (5,6). In
a previous study by the authors, it was demonstrated that ~40% of
MLH1-deficient CRC cases were associated with reduced expression of
SPTAN1 and reduced tumour aggressiveness (7). In the present study, the knockdown of
SPTAN1 in cell lines significantly increased the levels of IL-8.
Using MSI analysis, it was shown that the increase in IL-8 levels
was not caused by the knockdown-dependent accumulation of
frame-shift mutations in genes encompassing coding microsatellites.
Of the 5 cell lines transduced with shSPTAN1, 4 exhibited enhanced
IL-8 mRNA levels and increased secretion of IL-8 in the media, and
the media was capable of inducing migration of neutrophilic
granulocytes.
IL-8, which is a member of the CXC chemokine
super-family of structurally and functionally related inflammatory
cytokines, is an interesting target protein in the context of the
molecular differences between MSI-CRC and sporadic CRC (34). It has been demonstrated that
several types of human carcinomas, in particular CRC, express high
levels of IL-8 compared with the corresponding healthy tissue
(35-37). IL-8 produced by tumour cells can
directly modulate neighbouring cells through its corresponding
chemokine G-protein-coupled serpentine receptors, CXCR1 and CXCR2.
Thuringer et al (38)
demonstrated that the CRC line, SW620, can activate CXCR2 expressed
on surrounding endothelial cells by secreting IL-8, and thus
contribute to metastasis. Brew et al (39) demonstrated that IL-8 acts as an
autocrine growth factor on HCT116A, HCT116B and HT29 colorectal
cancer cells. Furthermore, Addison et al (40) and Heidemann et al (41) demonstrated that IL-8 affects
angiogenesis, and this was also mediated via CXCR2.
Additionally, secreted IL-8 is an important immune
response mediator that stimulates the ability of neutrophilic
granulocytes to attack injured or inflamed tissue, and
chemoattractants released from these neutrophils are able to
specifically attract CD8+ T-cells to the site of
neutrophil release (42,43). Several groups have demonstrated
that the secretion of IL-8 by CRC cells results in the stimulation
and migration of neutrophilic granulocytes (44,45),
which mediate T-cell and monocyte accumulation (43). This has also been confirmed in
vivo by David et al (46) where it was demonstrated that IL-8
and its receptors can substantially alter the infiltration of
leukocytes into the tumour, which results in the accumulation of
immunosuppressive and pro-tumorigenic immune cells, and results in
the dysfunction of antitumor immune cells.
As demonstrated in the present study, high levels of
IL-8 were associated with a decreased SPTAN1 expression, and this
has previously been associated in vivo with MLH1-deficiency
in CRC (7). As there was no clear
impact of the differential secretion of IL-8 on the mRNA expression
of CXCR1 and CXCR2 in the tested CRC cell lines, it was not
possible to determine the effects of IL-8 on neighbouring tumour
cells. However, the enhanced chemotaxis detected after using the
media from shSPTAN1-transduced cells compared with the media from
control cells, suggested that an enhanced IL-8 expression in
colorectal tumours with a decreased SPTAN1 expression may influence
the migration of neutrophilic granulocytes, which in turn may
increase the invasion of the surrounding T-cells. Consistent with
this hypothesis, it has been demonstrated that the enhanced
infiltration of cytotoxic T-cells is associated with MMR deficiency
in CRC (47,48). Therefore, an enhanced IL-8
expression and secretion may underlie increased T-cell infiltration
and the reduced tumour aggressiveness of MSI-CRC (5).
During cancer or severe injury conditions, an
expansion of immature and mature neutrophils has been observed to
inhibit T-cell proliferation (49). These so-called myeloid-derived
suppressor cells (MDSCs) can invade rapidly in tumour tissues which
is induced by IL-8 (49,50). In addition, IL-8 has also been
found to stimulate activated MDSCs, resulting in released DNA, and
the formation of neutrophil extracellular traps (NETs) (50). NETs consist of extracellular
chromatin fibers and neutrophil granular proteins adorned with
antimicrobial proteins (51), and
the formation of NETs in the tumour micro-environment seems to play
a relevant role in the inhibition of the immune response against
tumours (52-54).
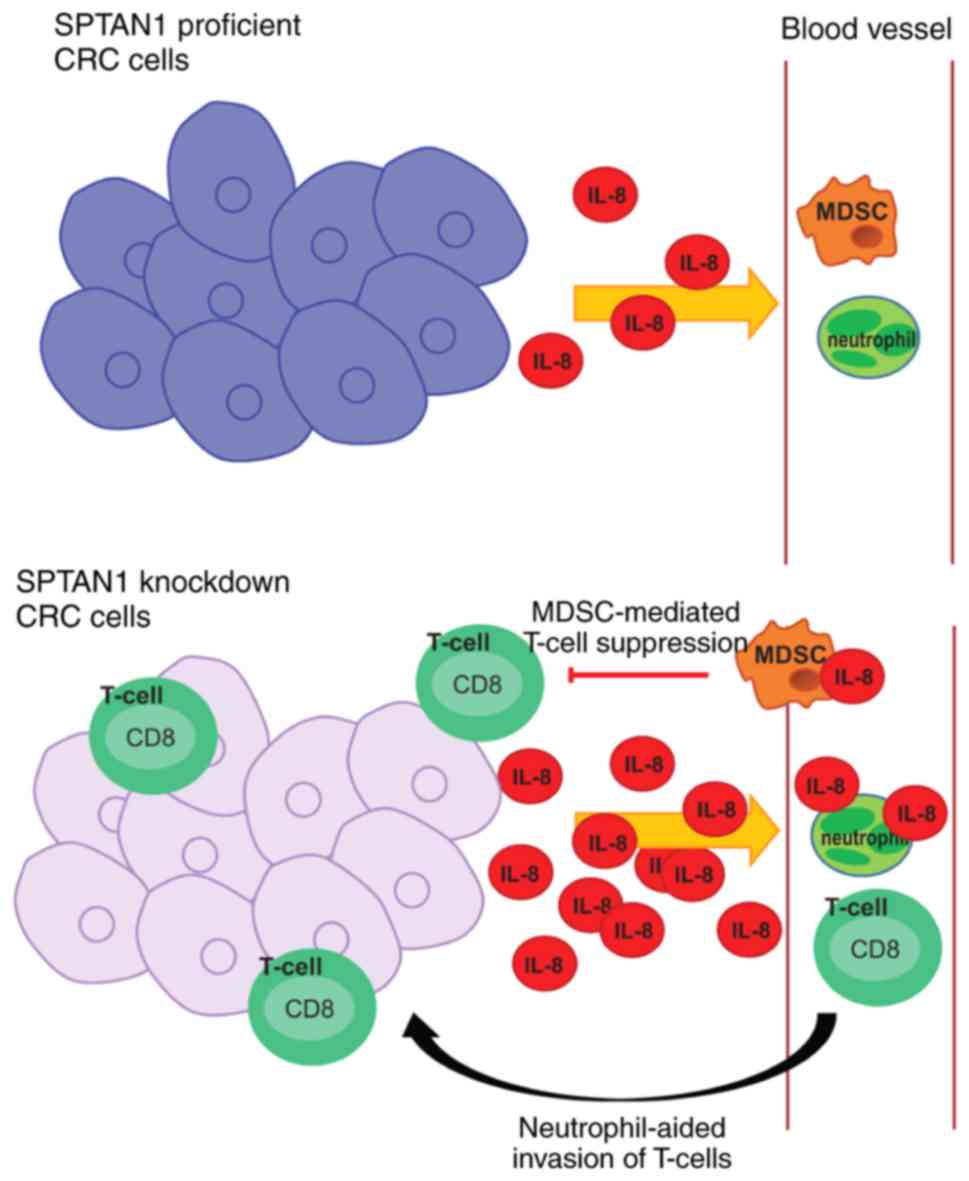
Taken together, it can be hypothesized that
increased IL-8 levels result in an enhanced CD8+ T-cell
tumour infiltration, although in parallel, it increases activation
of MDSCs which may result in the cancelling of each other's effects
(Fig. 7). The observation of an
enhanced infiltration of cytotoxic T-cells in MMR deficient CRC
fits this hypothesis (47,48).
Of note, the increased expression of IL-2 and TNF-α
has recently been demonstrated to be associated with low levels of
expression of MLH1, MSH2 and MSH6 in CRC (55). Although it was postulated that the
detected IL-2 and TNF-α levels may be regulated by T-cells, the
results of the present and previous studies (56) demonstrated that cancer cells are
able to actively secrete chemokines. Therefore, the detected
expression of high IL-2 and TNF-α levels shown in the study by
Germini et al (55) may
also be the result of the tumour cells themselves.
The question remains why the effect of MLH1
knockdown on IL-8 varied and why these results were not completely
consistent with those generated by shSPTAN1-transduced cells, even
though there was an association between MLH1-deficiency and SPTAN1
expression in CRC (7,18). The loss of MLH1 was associated with
enhanced IL-8 levels in only 2 of the 5 cell lines, whereas two
other cell lines exhibited a decrease in IL-8 levels and one cell
line did not exhibit any notable changes. It may be possible that
the SNP in IL-8 at position-251 (T>A) (rs4073) affects the
expression levels of IL-8 in the present study. However, the
influence of the IL-8 polymorphisms at position-251 could be
excluded, since two different CRC cell lines from the same patient
[SW480 (from the primary tumour) and SW620 cells (from the
metastasis)], which harbour the same IL-8 SNP [-251 TT (rs4073)],
exhibited differential effects with regards to IL-8 expression
following SPTAN1 or MLH1 knockdown. Therefore, it may be the case
that the time period allowed for shMLH1 transduction was not
sufficient to induce the reduction in SPTAN1 expression in all of
the cell lines and to thus increase IL-8 secretion. The results of
the present study demonstrated that cells in which MLH1 and SPTAN1
were co-knocked down (exemplarily demonstrated with the SW620
cells) exhibited an increased secretion of IL-8 and an enhanced
induction of neutrophil migration compared to the cells transduced
only with shMLH1. MLH1 knockdown alone was not sufficient to
enhance the quantity of IL-8 secreted in this cell line, whereas
SPTAN1 knockdown was sufficient.
Finally, the analysis of IL-8 expression was
investigated in vivo using a small panel of CRC tissues,
consisting of 10 MLH1-deficient and 10 MLH1-proficient CRC tissues.
The intensity of IL-8 in the analysed tissues was low, whereas the
general detection of IL-8 was successful, as the IL-8 of
erythrocytes (used as a positive control) was detectable (57). Overall, there were no significant
differences in IL-8 levels detected between MLH1-deficient and
MLH1-proficient tumours. However, it is necessary to verify these
results using a larger study cohort. Thus, the effect of IL-8 on
tumour progression of MLH1-deficient tumours and sporadic CRC
should not be excluded.
In conclusion, the present study demonstrated that
SPTAN1 knockdown in CRC cells significantly increased IL-8 levels
and induced the migration of neutrophil granulocytes. Further
studies are required to determine whether IL-8 secreted by CRC
cells in which SPTAN1 is knocked down can also induce the formation
of NETs and to determine the underlying signalling pathways, as
IL-8 may serve as a suitable target for personalized therapy of
patients with CRC.
Supplementary Data
Abbreviations:
|
DAB
|
3,3′-diaminobenzidine
|
|
BSA
|
bovine serum albumin
|
|
CRC
|
colorectal cancer
|
|
MMR
|
DNA mismatch repair
|
|
MSI
|
microsatellite instability
|
|
ELISA
|
enzyme-linked immunosorbent assay
|
|
MLH1
|
mutL homologue 1
|
|
MSH2
|
mutS homologue 2
|
|
MSH6
|
mutS homologue 6
|
|
SPTAN1
|
non-erythroid spectrin αII
|
|
PMS2
|
postmeiotic segregation increased
2
|
|
RFUs
|
relative fluorescence units
|
Acknowledgements
The authors would like to thank Dr Ria Winkelmann
(Dr. Senckenberg Institute of Pathology, University Hospital
Frankfurt, Frankfurt am Main, Germany) for the classification of
the tissues. The results shown in this manuscript are in part data
of the PhD thesis of Anne Ackermann.
Funding
The present study was supported by the Wilhelm
Sander Foundation (grant no. 2014.169.1), Paul und Ursula
Klein-Stiftung and institutional funds of the University Clinic
Frankfurt. The funders provided salaries for research staff or
consumables and had no role in design of the study, data collection
and analysis, decision to publish, or preparation of the
manuscript.
Availability of data and materials
All data generated or analysed during this study are
included in this published article.
Authors' contributions
AA and AB were responsible for the collection and
interpretation of the data. AA, AB, GP and SZ were responsible for
the conception and design of the study. AA performed the majority
of the experiments and analysed the data. BL performed reverse
transcription-quantitative PCR and ELISA in part, and the
chemotaxis assays. AA, GP and SZ critically revised and edited the
manuscript. AB wrote the manuscript.
Ethics approval and consent to
participate
The study was approved by the Local Ethics Committee
of the University Hospital Frankfurt, all research was performed in
accordance with relevant guidelines/regulations, and all patients
provided written informed consent.
Patient consent for publication
Not applicable.
Competing interests
The authors declare that they have no competing
interests.
References
|
1
|
Lynch HT, Snyder CL, Shaw TG, Heinen CD
and Hitchins MP: Milestones of Lynch syndrome: 1895-2015. Nat Rev
Cancer. 15:181–194. 2015. View
Article : Google Scholar : PubMed/NCBI
|
|
2
|
Peltomäki P: Lynch syndrome genes. Fam
Cancer. 4:227–232. 2005. View Article : Google Scholar : PubMed/NCBI
|
|
3
|
Bonadona V, Bonaïti B, Olschwang S,
Grandjouan S, Huiart L, Longy M, Guimbaud R, Buecher B, Bignon YJ,
Caron O, et al: Cancer risks associated with germline mutations in
MLH1, MSH2, and MSH6 genes in Lynch syndrome. JAMA. 305:2304–2310.
2011. View Article : Google Scholar : PubMed/NCBI
|
|
4
|
Deng G, Bell I, Crawley S, Gum J, Terdiman
JP, Allen BA, Truta B, Sleisenger MH and Kim YS: BRAF mutation is
frequently present in sporadic colorectal cancer with methylated
hMLH1, but not in hereditary nonpolyposis colorectal cancer. Clin
Cancer Res. 10:191–195. 2004. View Article : Google Scholar : PubMed/NCBI
|
|
5
|
Gryfe R, Kim H, Hsieh ET, Aronson MD,
Holowaty EJ, Bull SB, Redston M and Gallinger S: Tumor
microsatellite instability and clinical outcome in young patients
with colorectal cancer. N Engl J Med. 342:69–77. 2000. View Article : Google Scholar : PubMed/NCBI
|
|
6
|
Jeong SY, Shin KH, Shin JH, Ku JL, Shin
YK, Park SY, Kim WH and Park JG: Microsatellite instability and
mutations in DNA mismatch repair genes in sporadic colorectal
cancers. Dis Colon Rectum. 46:1069–1077. 2003. View Article : Google Scholar : PubMed/NCBI
|
|
7
|
Ackermann A, Schrecker C, Bon D,
Friedrichs N, Bankov K, Wild P, Plotz G, Zeuzem S, Herrmann E,
Hansmann ML and Brieger A: Downregulation of SPTAN1 is related to
MLH1 deficiency and metastasis in colorectal cancer. PLoS One.
14:e02134112019. View Article : Google Scholar : PubMed/NCBI
|
|
8
|
Michel S, Benner A, Tariverdian M,
Wentzensen N, Hoefler P, Pommerencke T, Grabe N, von Knebel
Doeberitz M and Kloor M: High density of FOXP3-positive T cells
infiltrating colorectal cancers with microsatellite instability. Br
J Cancer. 99:1867–1873. 2008. View Article : Google Scholar : PubMed/NCBI
|
|
9
|
Kloor M, Huth C, Voigt AY, Benner A,
Schirmacher P, von Knebel Doeberitz M and Bläker H: Prevalence of
mismatch repair-deficient crypt foci in Lynch syndrome: A
pathological study. Lancet Oncol. 13:598–606. 2012. View Article : Google Scholar : PubMed/NCBI
|
|
10
|
Kelderman S, Schumacher TN and Haanen JB:
Acquired and intrinsic resistance in cancer immunotherapy. Mol
Oncol. 8:1132–1139. 2014. View Article : Google Scholar : PubMed/NCBI
|
|
11
|
Ribic CM, Sargent DJ, Moore MJ, Thibodeau
SN, French AJ, Goldberg RM, Hamilton SR, Laurent-Puig P, Gryfe R,
Shepherd LE, et al: Tumor microsatellite-instability status as a
predictor of benefit from fluorouracil-based adjuvant chemotherapy
for colon cancer. N Engl J Med. 349:247–257. 2003. View Article : Google Scholar : PubMed/NCBI
|
|
12
|
Mandal R, Samstein RM, Lee KW, Havel JJ,
Wang H, Krishna C, Sabio EY, Makarov V, Kuo F, Blecua P, et al:
Genetic diversity of tumors with mismatch repair deficiency
influences anti-PD-1 immunotherapy response. Science. 364:485–491.
2019. View Article : Google Scholar : PubMed/NCBI
|
|
13
|
Stepanenko AA and Dmitrenko VV: HEK293 in
cell biology and cancer research: Phenotype, karyotype,
tumorigenicity, and stress-induced genome-phenotype evolution.
Gene. 569:182–190. 2015. View Article : Google Scholar : PubMed/NCBI
|
|
14
|
Jacob S, Aguado M, Fallik D and Praz F:
The role of the DNA mismatch repair system in the cytotoxicity of
the topoisomerase inhibitors camptothecin and etoposide to human
colorectal cancer cells. Cancer Res. 61:6555–6562. 2001.PubMed/NCBI
|
|
15
|
DSMZ: Catalogue of human and animal cell
lines. 2012.
|
|
16
|
Dirks WG, Faehnrich S, Estella IA and
Drexler HG: Short tandem repeat DNA typing provides an
international reference standard for authentication of human cell
lines. ALTEX. 22:103–109. 2005.PubMed/NCBI
|
|
17
|
Hinrichsen I, Ackermann A, Düding T,
Graband A, Filmann N, Plotz G, Zeuzem S and Brieger A: Loss of MLH1
sensitizes colon cancer cells to DNA-PKcs inhibitor KU60648. Mol
Carcinog. 56:1816–1824. 2017. View Article : Google Scholar : PubMed/NCBI
|
|
18
|
Hinrichsen I, Ernst BP, Nuber F, Passmann
S, Schäfer D, Steinke V, Friedrichs N, Plotz G, Zeuzem S and
Brieger A: Reduced migration of MLH1 deficient colon cancer cells
depends on SPTAN1. Mol Cancer. 13:112014. View Article : Google Scholar : PubMed/NCBI
|
|
19
|
Peng W, Tan S, Xu Y, Wang L, Qiu D, Cheng
C, Lin Y, Liu C, Li Z, Li Y, et al: LC-MS/MS metabolome analysis
detects the changes in the lipid metabolic profiles of dMMR and
pMMR cells. Oncol Rep. 40:1026–1034. 2018.PubMed/NCBI
|
|
20
|
Suraweera N, Duval A, Reperant M, Vaury C,
Furlan D, Leroy K, Seruca R, Iacopetta B and Hamelin R: Evaluation
of tumor microsatellite instability using five quasimonomorphic
mono-nucleotide repeats and pentaplex PCR. Gastroenterology.
123:1804–1811. 2002. View Article : Google Scholar : PubMed/NCBI
|
|
21
|
Brieger A, Plotz G, Zeuzem S and Trojan J:
Thymosin beta 4 expression and nuclear transport are regulated by
hMLH1. Biochem Biophys Res Commun. 364:731–736. 2007. View Article : Google Scholar : PubMed/NCBI
|
|
22
|
Livak KJ and Schmittgen TD: Analysis of
relative gene expression data using real-time quantitative PCR and
the 2(-Delta Delta C(T)) method. Methods. 25:402–408. 2001.
View Article : Google Scholar
|
|
23
|
Ackermann H: Bias-a program package for
biometrical analysis of samples. Computational Statistics Data
Analysis. 11:223–224. 1991. View Article : Google Scholar
|
|
24
|
Landi S, Moreno V, Gioia-Patricola L,
Guino E, Navarro M, de Oca J, Capella G and Canzian F; Bellvitge
Colorectal Cancer Study Group: Association of common polymorphisms
in inflam-matory genes interleukin (IL)6, IL8, tumor necrosis
factor alpha, NFKB1, and peroxisome proliferator-activated receptor
gamma with colorectal cancer. Cancer Res. 63:3560–3566.
2003.PubMed/NCBI
|
|
25
|
Gunter MJ, Canzian F, Landi S, Chanock SJ,
Sinha R and Rothman N: Inflammation-related gene polymorphisms and
colorectal adenoma. Cancer Epidemiol Biomarkers Prev. 15:1126–1131.
2006. View Article : Google Scholar : PubMed/NCBI
|
|
26
|
Mustapha MA, Shahpudin SN, Aziz AA and
Ankathil R: Risk modification of colorectal cancer susceptibility
by interleukin-8-251T>A polymorphism in Malaysians. World J
Gastroenterol. 18:2668–2673. 2012. View Article : Google Scholar : PubMed/NCBI
|
|
27
|
Walczak A, Przybylowska K, Dziki L, Sygut
A, Chojnacki C, Chojnacki J, Dziki A and Majsterek I: The lL-8 and
IL-13 gene polymorphisms in inflammatory bowel disease and
colorectal cancer. DNA Cell Biol. 31:1431–1438. 2012. View Article : Google Scholar : PubMed/NCBI
|
|
28
|
Bondurant KL, Lundgreen A, Herrick JS,
Kadlubar S, Wolff RK and Slattery ML: Interleukin genes and
associations with colon and rectal cancer risk and overall
survival. Int J Cancer. 132:905–915. 2013. View Article : Google Scholar
|
|
29
|
Wang N, Zhou R, Wang C, Guo X, Chen Z,
Yang S and Li Y: -251 T/A polymorphism of the interleukin-8 gene
and cancer risk: A HuGE review and meta-analysis based on 42
case-control studies. Mol Biol Rep. 39:2831–2841. 2012. View Article : Google Scholar
|
|
30
|
Gonzalez-Hormazabal P, Romero S, Musleh M,
Bustamante M, Stambuk J, Pisano R, Lanzarini E, Chiong H, Rojas J,
Castro VG, et al: IL-8-251T>A (rs4073) polymorphism is
associ-ated with prognosis in gastric cancer patients. Anticancer
Res. 38:5703–5708. 2018. View Article : Google Scholar : PubMed/NCBI
|
|
31
|
Lurje G, Zhang W, Schultheis AM, Yang D,
Groshen S, Hendifar AE, Husain H, Gordon MA, Nagashima F, Chang HM
and Lenz HJ: Polymorphisms in VEGF and IL-8 predict tumor
recurrence in stage III colon cancer. Ann Oncol. 19:1734–1741.
2008. View Article : Google Scholar : PubMed/NCBI
|
|
32
|
Cacev T, Radosevic S, Krizanac S and
Kapitanović S: Influence of interleukin-8 and interleukin-10 on
sporadic colon cancer development and progression. Carcinogenesis.
29:1572–1580. 2008. View Article : Google Scholar : PubMed/NCBI
|
|
33
|
Wilkening S, Tavelin B, Canzian F, Enquist
K, Palmqvist R, Altieri A, Hallmans G, Hemminki K, Lenner P and
Försti A: Interleukin promoter polymorphisms and prognosis in
colorectal cancer. Carcinogenesis. 29:1202–1206. 2008. View Article : Google Scholar : PubMed/NCBI
|
|
34
|
Ali H, Bitar MS, Al Madhoun A, Marafie M
and Al-Mulla F: Functionally-focused algorithmic analysis of high
resolution microarray-CGH genomic landscapes demonstrates
comparable genomic copy number aberrations in MSI and MSS sporadic
colorectal cancer. PLoS One. 12:e01716902017. View Article : Google Scholar : PubMed/NCBI
|
|
35
|
Lee YS, Choi I, Ning Y, Kim NY,
Khatchadourian V, Yang D, Chung HK, Choi D, LaBonte MJ, Ladner RD,
et al: Interleukin-8 and its receptor CXCR2 in the tumour
microenvironment promote colon cancer growth, progression and
metastasis. Br J Cancer. 106:1833–1841. 2012. View Article : Google Scholar : PubMed/NCBI
|
|
36
|
McClelland MR, Carskadon SL, Zhao L, White
ES, Beer DG, Orringer MB, Pickens A, Chang AC and Arenberg DA:
Diversity of the angiogenic phenotype in non-small cell lung
cancer. Am J Respir Cell Mol Biol. 36:343–350. 2007. View Article : Google Scholar
|
|
37
|
Waugh DJ and Wilson C: The interleukin-8
pathway in cancer. Clin Cancer Res. 14:6735–6741. 2008. View Article : Google Scholar : PubMed/NCBI
|
|
38
|
Thuringer D, Berthenet K, Cronier L,
Solary E and Garrido C: Primary tumor- and metastasis-derived colon
cancer cells differently modulate connexin expression and function
in human capillary endothelial cells. Oncotarget. 6:28800–28815.
2015. View Article : Google Scholar : PubMed/NCBI
|
|
39
|
Brew R, Erikson JS, West DC, Kinsella AR,
Slavin J and Christmas SE: Interleukin-8 as an autocrine growth
factor for human colon carcinoma cells in vitro. Cytokine.
12:78–85. 2000. View Article : Google Scholar : PubMed/NCBI
|
|
40
|
Addison CL, Daniel TO, Burdick MD, Liu H,
Ehlert JE, Xue YY, Buechi L, Walz A, Richmond A and Strieter RM:
The CXC chemokine receptor 2, CXCR2, is the putative receptor for
ELR+ CXC chemokine-induced angiogenic activity. J Immunol.
165:5269–5277. 2000. View Article : Google Scholar : PubMed/NCBI
|
|
41
|
Heidemann J, Ogawa H, Dwinell MB, Rafiee
P, Maaser C, Gockel HR, Otterson MF, Ota DM, Lugering N, Domschke W
and Binion DG: Angiogenic effects of interleukin 8 (CXCL8) in human
intestinal microvascular endothelial cells are mediated by CXCR2. J
Biol Chem. 278:8508–8515. 2003. View Article : Google Scholar
|
|
42
|
Hess C, Means TK, Autissier P, Woodberry
T, Altfeld M, Addo MM, Frahm N, Brander C, Walker BD and Luster AD:
IL-8 responsiveness defines a subset of CD8 T cells poised to kill.
Blood. 104:3463–3471. 2004. View Article : Google Scholar : PubMed/NCBI
|
|
43
|
Taub DD, Anver M, Oppenheim JJ, Longo DL
and Murphy WJ: T lymphocyte recruitment by interleukin-8 (IL-8).
IL-8-induced degranulation of neutrophils releases potent
chemoattractants for human T lymphocytes both in vitro and in vivo.
J Clin Invest. 97:1931–1941. 1996. View Article : Google Scholar : PubMed/NCBI
|
|
44
|
Kelly CP, Keates S, Siegenberg D, Linevsky
JK, Pothoulakis C and Brady HR: IL-8 secretion and neutrophil
activation by HT-29 colonic epithelial cells. Am J Physiol.
267:G991–G997. 1994.PubMed/NCBI
|
|
45
|
Godaly G, Hang L, Frendèus B and Svanborg
C: Transepithelial neutrophil migration is CXCR1 dependent in vitro
and is defective in IL-8 receptor knockout mice. J Immunol.
165:5287–5294. 2000. View Article : Google Scholar : PubMed/NCBI
|
|
46
|
David JM, Dominguez C, Hamilton DH and
Palena C: The IL-8/IL-8R Axis: A double agent in tumor immune
resistance. Vaccines (Basel). 4:pii: E22. 2016.
|
|
47
|
Buckowitz A, Knaebel HP, Benner A, Bläker
H, Gebert J, Kienle P, von Knebel Doeberitz M and Kloor M:
Microsatellite instability in colorectal cancer is associated with
local lympho-cyte infiltration and low frequency of distant
metastases. Br J Cancer. 92:1746–1753. 2005. View Article : Google Scholar : PubMed/NCBI
|
|
48
|
Kloor M and von Knebel Doeberitz M: The
immune biology of microsatellite-unstable cancer. Trends Cancer.
2:121–133. 2016. View Article : Google Scholar : PubMed/NCBI
|
|
49
|
Aarts CEM and Kuijpers TW: Neutrophils as
myeloid-derived suppressor cells. Eur J Clin Invest. 48 (Suppl 2):
e129892018. View Article : Google Scholar : PubMed/NCBI
|
|
50
|
Alfaro C, Teijeira A, Oñate C, Pérez G,
Sanmamed MF, Andueza MP, Alignani D, Labiano S, Azpilikueta A,
Rodriguez-Paulete A, et al: Tumor-produced Interleukin-8 attracts
human myeloid-derived suppressor cells and elicits extrusion of
neutrophil extracellular traps (NETs). Clin Cancer Res.
22:3924–3936. 2016. View Article : Google Scholar : PubMed/NCBI
|
|
51
|
Brinkmann V, Reichard U, Goosmann C,
Fauler B, Uhlemann Y, Weiss DS, Weinrauch Y and Zychlinsky A:
Neutrophil extracellular traps kill bacteria. Science.
303:1532–1535. 2004. View Article : Google Scholar : PubMed/NCBI
|
|
52
|
Gonzalez-Aparicio M and Alfaro C:
Influence of Interleukin-8 and Neutrophil Extracellular Trap (NET)
formation in the tumor microenvironment: Is there a pathogenic
role? J Immunol Res. 2019:62521382019. View Article : Google Scholar : PubMed/NCBI
|
|
53
|
Najmeh S, Cools-Lartigue J, Rayes RF,
Gowing S, Vourtzoumis P, Bourdeau F, Giannias B, Berube J, Rousseau
S, Ferri LE and Spicer JD: Neutrophil extracellular traps sequester
circulating tumor cells via β1-integrin mediated interactions. Int
J Cancer. 140:2321–2330. 2017. View Article : Google Scholar : PubMed/NCBI
|
|
54
|
Alfaro C, Sanmamed MF, Rodriguez-Ruiz ME,
Teijeira Á, Oñate C, González Á, Ponz M, Schalper KA, Pérez-Gracia
JL and Melero I: Interleukin-8 in cancer pathogenesis, treatment
and follow-up. Cancer Treat Rev. 60:24–31. 2017. View Article : Google Scholar : PubMed/NCBI
|
|
55
|
Germini DE, Franco MIF, Fonseca FLA, de
Sousa Gehrke F, da Costa Aguiar Alves Reis B, Cardili L, Oshima
CTF, Theodoro TR and Waisberg J: Association of expression of
inflammatory response genes and DNA repair genes in colorectal
carcinoma. Tumour Biol. 42:10104283198430422019.PubMed/NCBI
|
|
56
|
Setrerrahmane S and Xu H: Tumor-related
interleukins: Old validated targets for new anti-cancer drug
development. Mol Cancer. 16:1532017. View Article : Google Scholar : PubMed/NCBI
|
|
57
|
Darbonne WC, Rice GC, Mohler MA, Apple T,
Hébert CA, Valente AJ and Baker JB: Red blood cells are a sink for
interleukin 8, a leukocyte chemotaxin. J Clin Invest. 88:1362–1369.
1991. View Article : Google Scholar : PubMed/NCBI
|