Introduction
Ovarian cancer (OC) is the second leading cause of
gynecological cancer-related deaths in women worldwide (1). The current therapy for patients with
advanced-stage OC is cytoreductive surgery combined with
platinum-taxane chemotherapy (2).
Most patients with OC are sensitive to initial chemotherapy, but
some eventually develop chemoresistance and relapse (3). Therefore, the treatment of recurrent
OC remains a key challenge.
The occurrence and formation of chemoresistance
consist of a diverse range of determinants, including inherent
genetic mutations in tumors, cancer stem cells (CSCs), activation
of intrinsic signaling pathways and pharmacological factors
(4). The multidrug resistance 1
(MDR1) gene, also termed ATP-binding cassette sub-family B
member 1 (ABCB1), encodes a protein called P-glycoprotein
(P-gp) and is aberrantly expressed in most cancers, which promotes
the efflux of intracellular chemotherapy drugs and facilitates the
development of chemoresistance (5). A number of types of cancer, including
OC, contain CSCs, which are considered cells that are resistant to
chemotherapy (6). Our previous
study showed that the paclitaxel (PTX)-resistant cells act as stem
cell-like cells that expressed stem cell biomarkers such as CD44
(7). CD44 is a cell surface
glycoprotein that correlates with chemoresistance in OC (8,9) and
can upregulate MDR1 in doxorubicin-resistant cells (10).
N6-methyladenosine
(m6A) modification is the richest and reversible mRNA
modification dynamically regulated by methyltransferase complexes
(also called 'Writer'), demethylases ('Eraser') and
m6A-binding proteins ('Reader') (11). RNA methylation is a
post-transcriptional regulation process that affects the
transcription, splicing, translation and stability of mRNAs. A
previous study indicated that m6A modification is
closely correlated with tumorigenesis, cell proliferation,
metastasis and chemoresistance in malignant tumors (12). RNA-binding motif protein 15 (RBM15;
also termed OTT1) is a member of the split-end (SPEN) protein
family, comprising three N-terminal RNA recognition motifs, also
known as the RNA binding domain or ribonucleoprotein domain
(13). RBM15 is an essential
regulator of RNA m6A methylation modification and a
critical component of the methyltransferase complex that binds and
recruits the Wilms' tumor 1-associating protein-methyltransferase
like 3 complex to specific RNA sites (14). A number of studies have shown that
RBM15 facilitates tumor progression as an m6A mediator
in several types of cancer (15-18).
Evidence has emerged that cell signaling pathways, such as the
TGF-β signaling pathway, regulate downstream gene expression
through m6A processing (19). However, the role and molecular
mechanisms of RBM15 in OC and chemoresistance have not yet been
completely explored.
The present study evaluated the expression, function
and regulation of RBM15 in OC in vivo and in vitro
and explored for the first time, to the best of the authors'
knowledge, that RBM15 mediated MDR1 expression through mRNA
m6A methylation. Moreover, the association of RBM15 with
PTX resistance and the prognosis of patients with OC was assessed.
Finally, regulation of the RBM15/MDR1 axis by the TGF-β signaling
pathway was examined.
Materials and methods
Cell lines and culture
The human immortal ovarian surface epithelial cell
line IOSE-80 (originating from normal ovarian epithelium; OriGene
Technologies, Inc.) and the human OC cell line OVCAR-3 (originating
from ovarian adenocarcinoma derived from ascites; ATCC) were
cultured in RPMI-1640 medium (Gibco; Thermo Fisher Scientific,
Inc.) with 10 and 20% fetal bovine serum (FBS; Invitrogen; Thermo
Fisher Scientific, Inc.), respectively. Human OC cell lines ES2
[originating from ovarian clear cell carcinoma but the genetic
profile closely related to serous carcinoma (20); ATCC], A2780 (originating from
ovarian endometrioid adenocarcinoma) and its PTX-resistant
counterpart A2780-PTX (Nanjing KeyGen Biotech Co., Ltd.) were
cultured in DMEM (Gibco; Thermo Fisher Scientific, Inc.)
supplemented with 10% FBS. The human OC cell line SK-OV-3
(originating from ovarian endometrioid adenocarcinoma derived from
ascites; ATCC) and its PTX-resistant counterpart SK3R-PTX
[established in our laboratory) (21) were cultured in 10% FBS McCoy's 5A
medium (Biological Industries]. Cell line 293T (Shanghai Fuheng
Biotechnology Co., Ltd.) was cultured in DMEM supplemented with 10%
FBS. All the cells were cultured in a humidified incubator at 37°C
and 5% CO2. All cell lines were authenticated by short
tandem repeat analysis with routine detection of pathogen-free and
mycoplasma-negative.
Overexpressing plasmid and small
interfering (si)RNA transfection and short hairpin (sh)RNA
infection
The RBM15-overexpressing plasmid was generated by
inserting a coding sequence of the RBM15 gene at positions 30-2963
(GenBank Accession no. NM_022768.5) into the multiple cloning site
of the pcDNA3.1 vector (Invitrogen; Thermo Fisher Scientific,
Inc.). siRNA and shRNA targeting RBM15 were synthesized by Shanghai
GenePharma Co., Ltd. The sequences are listed in Supplementary
Table SI. X-tremeGENE siRNA
Transfection Reagent (Roche Applied Science) was used for the
transfection of siRNAs and overexpressing plasmids according to the
manufacturer's instructions. After the incubation of transfection
mixture at room temperature for 15 min, cells were transfected with
either 2 μg/well of siRNAs or 2.5 μg/well
overexpressing plasmids in a 6-well plate for 24 h at 37°C,
followed by subsequent experimentation. RBM15-shRNAs and negative
control shRNA (sh-NC) were synthesized by Genewiz, Inc. and cloned
into lentiviral shRNA-overexpressing plasmids (Hanbio Biotechnology
Co., Ltd.). Cells were seeded in 12-well plates and were infected
at 20-30% confluence by adding the lentiviral RBM15-shRNA
overexpressing plasmid or the control lentiviral supernatant for 48
h at 37°C, followed by subsequent experimentation.
RNA extraction and reverse
transcription-quantitative (RT-q) PCR
Total RNA was extracted when cell density reached at
90% confluence using the RNA-Quick Purification Kit (Shanghai
Yishan Biotechnology Co., Ltd.; cat. no. ES-RN001). RT of RNA to
complementary DNA was performed using a qPCR RT kit (Roche
Diagnostics). PCR was performed using BeyoFast SYBR Green qPCR Mix
(2X; High ROX; Beyotime Institute of Biotechnology). RNA
extraction, cDNA synthesis, and qPCR were performed according to
the manufacturer's protocols and cycling conditions were: Initial
denaturation at 95°C for 1 min followed by 40 cycles of
denaturation at 95°C for 10 sec and annealing/extension at 60°C for
30 sec. The threshold cycle (Cq) was determined using the 7300
real-time PCR system (version 1.4, Applied Biosystems; Thermo
Fisher Scientific, Inc.). Actin was used as an internal control for
gene expression. According to the obtained Cq values, the
expression of target genes was quantitatively analyzed by
2−(∆∆Cq) (22).
Experiments were repeated at least three times. The PCR primer
sequences are listed in Table
SI.
Protein extraction and western blot
analysis
The cells were lysed with sodium dodecyl sulfate
lysate (Beyotime Institute of Biotechnology) containing 1%
phenylmethanesulfonyl fluoride (Beyotime Institute of
Biotechnology) and 1% phosphatase inhibitor. After the total
protein was extracted, the protein concentration was measured using
a BCA protein assay kit (Beyotime Institute of Biotechnology) by
microplate spectrophotometer (Epoch, BioTek Instruments, Inc.).
Protein samples (25 μg/lane) were subjected to 10% sodium
dodecyl sulfate-polyacrylamide gel electrophoresis and transferred
to PVDF membranes. After the membranes were blocked with 5% non-fat
milk for 1 h at room temperature, they were incubated with primary
antibodies at 4°C overnight. The following antibodies were used:
Anti-RBM15 antibody (1:1,000 dilution; cat. no. 10587-1-AP) and
anti-β-actin (1:5,000 dilution; cat. no. 66009-1-Ig) from
Proteintech Group, Inc. anti-MDR1 (1:5,000 dilution; cat. no.
13342S), anti-cyclin D1 (1:2,000 dilution; cat. no. 2978S),
anti-phosphorylated (p)-Smad2 (1:1,000 dilution; cat. no. 3101S)
and anti-Smad2 (1:1,000 dilution; cat. no. 3103S) from Cell
Signaling Technology, Inc. The secondary antibody anti-mouse IgG
(1:5,000 dilution; Proteintech Group, Inc.; cat. no. SA00001-1) or
anti-rabbit IgG (1:5,000 dilution; Proteintech Group, Inc.; cat.
no. SA00001-2) was then used at room temperature for 1 h. Protein
bands were photographed and quantified using a chemiluminescence
imaging system (Tanon-4500, software v4.1.5; Tanon Science and
Technology Co., Ltd.).
Human ovarian tissue preparation and
immunohistochemistry (IHC) staining
A total of nine non-tumor ovarian tissues and 18 OC
tissues, including 1 clear cell carcinoma (CCC), 2 endometrioid
carcinomas (EC), 11 high-grade serous carcinomas (HGSC) and four
low-grade serous carcinomas (LGSC), were obtained from the Jinshan
Hospital of Fudan University for the initial IHC study. None of the
patients had received chemotherapy or radiotherapy before surgery.
Ethics approval was approved by The Ethics Committee of Jinshan
Hospital (approval no. JYLLKY-2019-01-01). For IHC analysis, 4%
paraformaldehyde (PFA)-fixed paraffin-embedded tissue specimens
were sectioned (4 μm thick). After deparaffinization in
xylene and rehydration in a descending alcohol series, 3% hydrogen
peroxide in methanol was applied to quench the endogenous peroxide
activity. After blocking with 10% normal goat serum (Fuzhou Maixin
Biotech. Co., Ltd.) for 40 min at room temperature, the sections
were incubated with a primary anti-RBM15 antibody (1:150 dilution;
Proteintech Group, Inc.; cat. no. 10587-1-AP) at 4°C overnight,
followed by a biotinylated secondary anti-rabbit antibody (cat. no.
KIT-5020; Fuzhou Maixin Biotech. Co., Ltd.) for 1 h at room
temperature. After staining with a DAB kit (cat. no. DAB-1031;
Fuzhou Maixin Biotech. Co., Ltd), images were captured using a
light microscope (BX43; Olympus Corporation).
Tissue microarray
A tissue microarray containing 45 OC tissues paired
with 45 adjacent-noncancerous tissues was obtained from Shanghai
Outdo Biotech Co., Ltd. (cat. no. OVC0901). Ethical approval was
obtained from the Ethics Committee of the Shanghai Outdo Biotech
Company (approval no. TRLL-2020-035-01). Detailed clinical
information was obtained. Histological assessment and
classification were determined according to the criteria of tumor,
node and metastasis classification by the American Joint Committee
on Cancer (https://www.facs.org/quality-programs/cancer-programs/amer-ican-joint-committee-on-cancer/version-9/).
The tumor stage was diagnosed based on the International Federation
of Gynaecological Oncologists system (https://www.figo.org/). IHC was performed using a
primary anti-RBM15 antibody (1:150 dilution; Proteintech Group,
Inc.; cat. no. 10587-1-AP) and a biotinylated secondary anti-rabbit
antibody (Fuzhou Maixin Biotech. Co., Ltd.; 50 μl; cat. no.
KIT-5020) at room temperature for 30 min. After IHC on 45 pairs of
samples, six pairs were either invalid or missing during the
process and the final 39 pairs of valid samples (8 EC, 16 HGSC, 14
LGSC and 1 CCC) were evaluated using a Pannoramic 250 FLASH scanner
(3DHISTECH Ltd.). After staining with a DAB kit (Fuzhou Maixin
Biotech. Co., Ltd.), the results were assessed blindly by two
independent investigators according to the staining area and
intensity. The staining index (SI) of RBM15 was calculated by the
sum point of i) one of the percentage scores of immuno-positive
cells: 0 (no positive cells), 1 (≤25%), 2 (26-50%), 3 (51-75%), 4
(>75%) and ii) one of the staining intensity score: 0 (no
coloration), 1 (pale brown), 2 (brown), 3, (dark brown), as
described previously (23).
Finally, the SI of RBM15 was clustered into three groups: negative
expression (0-2 sum points), low expression (3-5 sum points) and
high expression (6-7 sum points). In addition, the overall survival
(OS) and disease-free survival (DFS) time of OC patients were
analyzed by Kaplan-Meier analysis using 'survival' (version 3.3.1)
(https://github.com/therneau/survival), 'survminer'
(https://rpkgs.datanovia.com/survminer/index.html),
'ggplot2' (version 3.3.6) (https://github.com/tidyverse/ggplot2) R packages.
Analyses of gene/protein expression from
the public database
The data for differentially expressed genes between
OC and normal ovarian samples were extracted from the Gene
Expression Omnibus (GEO, https://www.ncbi.nlm.nih.gov/geo/) (24) and analyzed using the 'impute'
(version 1.64.0) and 'limma' (version 3.46.0) (25) R packages. Protein expression data
extracted from the Clinical Proteomic Tumor Analysis Consortium
(CPTAC) were analyzed using the UALCAN database (http://ualcan.path.uab.edu/index.html)
(26). RNA-seq data from various
OC cell lines were downloaded from the CCLE website (https://sites.broadinstitute.org/ccle)
and analyzed. After screening for RBM15-associated genes, Gene
Ontology (GO) enrichment analysis and Kyoto Encyclopedia of Genes
and Genomes (KEGG) pathway enrichment analysis were performed using
'limma' (version 3.46.0) (25),
'ggplot2' (version 3.3.6) (https://github.com/tidyverse/ggplot2), 'ggpubr'
(version 0.6.0) (https://rpkgs.datanovia.com/ggpubr/), 'ggExtra'
(version 0.10.0) (https://github.com/daattali/ggExtra),
'clusterProfiler' (version 4.8.1) (27), 'org.Hs.eg.db' (version 3.17.0)
(https://www.bioconductor.org/),
'enrichplot' (version 1.20.0) (https://www.bioconductor.org/) R packages and Gene Set
Enrichment Analysis (GSEA; version 4.1.0; Broad Institute, Inc.).
The data on RBM15 expression associated with patient survival were
analyzed using the Kaplan-Meier Plotter (http://kmplot.com/analysis) (28). The specific procedure was stepped
as inputting the Gene symbol RBM15 first, selecting 'the Auto
select best cutoff' and finally analyzing OS and PFS, respectively
(retaining the default values for other parameters). Gene
Expression Profiling Interactive Analysis (GEPIA), an online
analytical database (http://gepia.cancer-pku.cn/) based on gene expression
data from tumor and normal samples in The Cancer Genome Atlas
(TCGA) and Genotype-Tissue Expression databases (29), was used for analyzing the
correlation between RBM15 and MDR1 expression in OC.
Drug sensitivity analysis
The 'pRRophetic' (30) R package (http://genemed.uchicago.edu/~pgeeleher/pRRophetic/)
was used to measure the difference in the half-maximal inhibitory
concentration (IC50) of different drugs between the
RBM15 high and the low expression group from TCGA-Ovarian
Cancer.
Immunofluorescence staining
Cells were seeded in a 35 mm confocal culture dish
with a 20 mm glass bottom at 105 cells/dish. After
confluence reached 50-70%, cells were fixed with 4% PFA for 15 min
and washed with phosphate-buffered saline (PBS) for 5 min. After
the cells were permeabilized with 0.1% Triton X-100 in PBS for 15
min, QuickBlock Blocking Buffer for Immunol Staining (Beyotime
Institute of Biotechnology) was applied for 1 h at room
temperature. Cells were incubated with the primary anti-RBM15
antibody (1:200; Proteintech Group, Inc.; cat. no. 10587-1-AP) at
4°C overnight, followed by incubation with the secondary antibody
(Alexa Fluor 594-conjugated goat anti-rabbit IgG; 1:500 dilution;
cat. no. 8760S; Cell Signaling Technology Inc.) for 2 h at room
temperature in the dark. After staining with DAPI (Beyotime
Institute of Biotechnology) for 5 min, images were captured using a
BioTek Cytation C10 Confocal Image Reader (Agilent Technologies,
Inc.).
Cell viability, EdU and colony
formation
For the cell viability assay, A2780-PTX and SK3R-PTX
cells were transfected with RBM15-siRNAs and A2780 and SK-OV-3
cells were transfected with RBM15-overexpressing plasmids.
A2780/A2780-PTX and SK-OV-3/SK3R-PTX cells were seeded in 96-well
plates at densities of 3×10³ and 5×10³
cells/well, respectively. Cell viability was determined at 0, 24,
48 and 72 h by measuring absorbance at 450 nm using a CCK-8 kit
(Beyotime Institute of Biotechnology) using Multiscan Spectrum
(BioTek Instruments, Inc.).
For the EdU cell proliferation assay, cells were
seeded in 24-well plates with 104 cells/well and
cultured to 30-40% confluence. Cells were labeled using the
BeyoClick EdU-555 kit (Beyotime Institute of Biotechnology)
according to the manufacturer's instructions and images captured
under a fluorescence microscope (Olympus Corporation) at ×100
magnification.
For the colony formation assay, the cells were
seeded in 6-well plates at a density of 1×10³ cells/well
and cultured for ~2 weeks. When the cell colonies reached the
optimum confluence, 4% PFA was applied for 30 min at room
temperature to fix them. A 1% crystal violet solution
(MilliporeSigma) was used to stain the colonies for 30 min at room
temperature. The number of cell colonies was analyzed using the
ImageJ software (version 1.46r; National Institutes of Health,
Bethesda, MD, USA).
Paclitaxel sensitivity assay
PTX-resistant cells were transfected with 2
μg/well of RBM15-siRNA (si-RBM15) or negative control siRNA
(si-NC) and PTX-sensitive cells were transfected with 2.5
μg/well of RBM15-overexpressing plasmid (oe-RBM15) or
negative control empty plasmid (oe-NC) in 6-well plates at the cell
density of 70-80% confluence using X-tremeGENE siRNA Transfection
Reagent (Roche Applied Science). After transfection at 37°C for 24
h, cells were detached and replated into 96-well plates at a
density of 7×10³ cells/well for 24 h. For dose-dependent
experiments, the transfected cells were treated with different
concentrations of PTX for 48 h. Cell viability was determined using
a CCK-8 kit and the IC50 was calculated by nonlinear
regression analysis using a model of 'Log(inhibitor) vs. normalized
response-Variable slope' under the 'Dose-response-Inhibition'
section and presented with a 95% confidence interval (95% CI).
Next, a time-course experiment was performed using a CCK-8 kit
after the cells were treated with PTX at the IC50
concentration for 24, 48 and 72 h.
Detection of cell apoptosis by flow
cytometry
Cells were seeded into the 6-well plate with
105 cells/well. After transfection with 2 μg/well
of RBM15-siRNA or 2.5 μg/well of RBM15-overexpressing
plasmids at 37°C for 24 h using X-tremeGENE siRNA Transfection
Reagent (Roche Applied Science), the cells were treated with or
without PTX (IC50 concentration) for 24 h when cell
confluence reached ~90%. Next, the cells were digested with an
EDTA-free trypsin (GENOMBIO), washed with pre-cooled PBS and
resuspended in 100 μl of 1X binding buffer, followed by the
addition of 1 μl of Annexin V-FITC and/or 2 μl of
propidium iodide according to the manufacturer's instructions (BD
Biosciences). After incubation at room temperature in the dark for
15 min and the addition of 400 μl of 1X binding buffer to
each tube, apoptotic cells were detected by flow cytometry
(Gallios; Beckman Coulter, Inc.). The apoptotic rate was calculated
as the percentage of early + late apoptotic cells using FlowJo
v10.6.2 (FlowJo LLC).
Spheroid formation of cancer stem
cell-like cells
RBM15-shRNA- or NC-shRNA-infected cells were seeded
in a 6-well ultra-low attachment culture plate (Corning, Inc.) at a
density of 1×10³ cells/well and cultured in serum-free
DMEM/F12 cell medium (Gibco; Thermo Fisher Scientific, Inc.)
supplemented with 20 ng/ml epidermal growth factor (EGF; Thermo
Fisher Scientific, Inc.), 20 ng/ml basic fibroblast growth factor
(bFGF; Thermo Fisher Scientific, Inc.), 4 μg/ml heparin
(MilliporeSigma) and 0.4 μg/ml B27 (Thermo Fisher
Scientific, Inc.). The grown spheroids were recorded every 2 days
until day 11 and the diameter radius (r) of a microspheroid was
determined by measuring two mutually perpendicular (length d1 and
width d2) using the formula r=1/2×√(d1×d2).
Tumor xenograft mouse model
Animal studies were approved by the Laboratory
Animal Welfare and Ethics Committee of the Shanghai Public Health
Clinical Center (approval no. GWLL2020-A0270-01). A total of 15 5-
to 6-week-old female BALB/c nude mice (weight 17-20 g; Shanghai
Super-B&K Laboratory Animal Corp. Ltd.) received water and food
ad libitum and were provided constant temperature (22-25°C),
humidity (50-60%) and a 12-h light/dark cycle in the animal
facility. A total of 5×10⁶ NC-shRNA- or
RBM15-shRNA-infected A2780-PTX cells in 100 μl medium were
subcutaneously injected into the right flank of mice (n=5/group).
Mice without any intervention were used as blank controls (n=5).
Body weight, tumor initiation and tumor progression were monitored
every other day for 29 days (day of tumor formation=day 1). Tumor
volume was calculated using the formula V=ab2/2, where V
was the volume and a and b represent the tumor length and width,
respectively. On day 30, the animals were anesthetized using 20
μl/g of 2% tribromoethanol by intraperitoneal injection and
sacrificed by cervical dislocation and the tumors were excised and
images captured.
Methylated RNA immunoprecipitation
(MeRIP)-PCR assay
The MDR1 m6A methylation region was
predicted using a sequence-based RNA adenosine methylation site
predictor (SRAMP; http://www.cuilab.cn/sramp) (31) and primers were designed to amplify
the high-m6A region. Total RNA was extracted from si-NC-
and si-RBM15-transfected A2780-PTX and SK3R-PTX cells using TRIzol
(Thermo Fisher Scientific, Inc.) when the cell confluence reached
at 90%. Immunoprecipitation (IP) of m6A-containing mRNAs
was performed using a Methylated RNA Immunoprecipitation Kit
(Guangzhou BersinBio Biotechnology Co., Ltd.). Briefly, after
concentration measurement, 100 μg RNA was chemically
fragmented and diluted in 850 μl IP buffer plus 4 μl
RNase Inhibitor. Then, 50 μl RNA was used for input and the
remaining RNA (400 μl each) was incubated with
N6-methyladenosine antibody or negative immunoglobulin G
(lgG) antibody supplied by the kit at 4°C for 4 h and subsequently
bound with magnetic beads at 4°C for 2 h according to the
manufacturer's instructions. After washing with the IP buffer, a
25:24:1 mixture of phenol, chloroform and isoamyl alcohol
(MilliporeSigma) was applied to extract and purify RNA. Finally,
RT-qPCR was conducted to quantify the input RNA, isolated
m6A-containing RNA and isolated IgG control RNA. The
cycling condition was the same as it in the above RT-qPCR
subsection. The 2−∆Cq values were calculated using a
formula of ∆Cq=[Cq(IP)-Cq(Input)-log2DF], where DF
indicates the input dilution factor, to assess RNA expression from
the eluate over the input samples as a percentage.
TGF-β1 treatment
SK3R-PTX cells were seeded in a 6-well plate
overnight, followed by treatment with 10 ng/ml recombinant human
TGF-β1 (R&D Systems, Inc.) at 37°C for 24 h. For the inhibition
of TGF-β signaling, cells were pretreated with the TGF-β receptor
kinase inhibitor SB431542 (10 μM; MilliporeSigma) for 0.5 h
and followed by TGF-β1 (10 ng/ml) treatment for 24 h.
Dual-luciferase reporter assay
According to the scoring of the binding sites of the
Smad Binding Element (SBE) predicted by JASPAR (https://jaspar.genereg.net/) (32), the length of the DNA sequence with
the highest score was chosen for cloning. Briefly, two different
lengths of RBM15 promoter with or without SBE [-1081 and -780 bp
upstream from the transcription start site (TSS)] were amplified
and ligated into the pGL4-Basic vector (Promega Corporation) to
generate P1081 and P780 plasmids. 293T cells were cotransfected
with pGL4 and the control Renilla luciferase vector pRL-SV40
for 24 h using Lipo8000 (Beyotime Institute of Biotechnology),
followed by treatment with or without 10 ng/ml TGF-β1 for 24 h.
Luciferase activity was measured using a Dual-Luciferase Reporter
Gene Assay Kit (Shanghai Yeasen Biotechnology Co., Ltd.) by
Fluoroskan Ascent FL (Thermo, Thermo Fisher Scientific, Inc.) with
the formula: Luciferase
activity=(Fexperimental-Fbackgroud)/(Rexperimental-Rbackgroud),
where F indicates luminescence value of Firefly luciferase and R
indicates luminescence value of Renilla luciferase.
Statistical analysis
All data were analyzed using GraphPad Prism 8.0
(Dotmatics) and R version 4.1.3 (R Foundation for Statistical
Computing, Vienna, Austria) (http://www.R-project.org/). Unpaired Student's t-test
was used for two-group comparisons. Multiple t-tests were used for
multiple groups comparison. One-way ANOVA followed by the Tukey or
Dunnett test and two-way ANOVA followed by the Sidak or Tukey test
were used to compare continuous variables among ≥3 groups according
to the type of experiment where indicated. For a non-parametric
analysis when the sample distributions were not normally
distributed, a Mann-Whitney test was used. To determine non-random
associations between two categorical variables, a Fisher's exact
test was used. To compare unpaired two samples, a Wilcoxon test was
used. P<0.05 was considered to indicate a statistically
significant difference.
Results
RBM15 is overexpressed in OC cell lines
and OC tissues
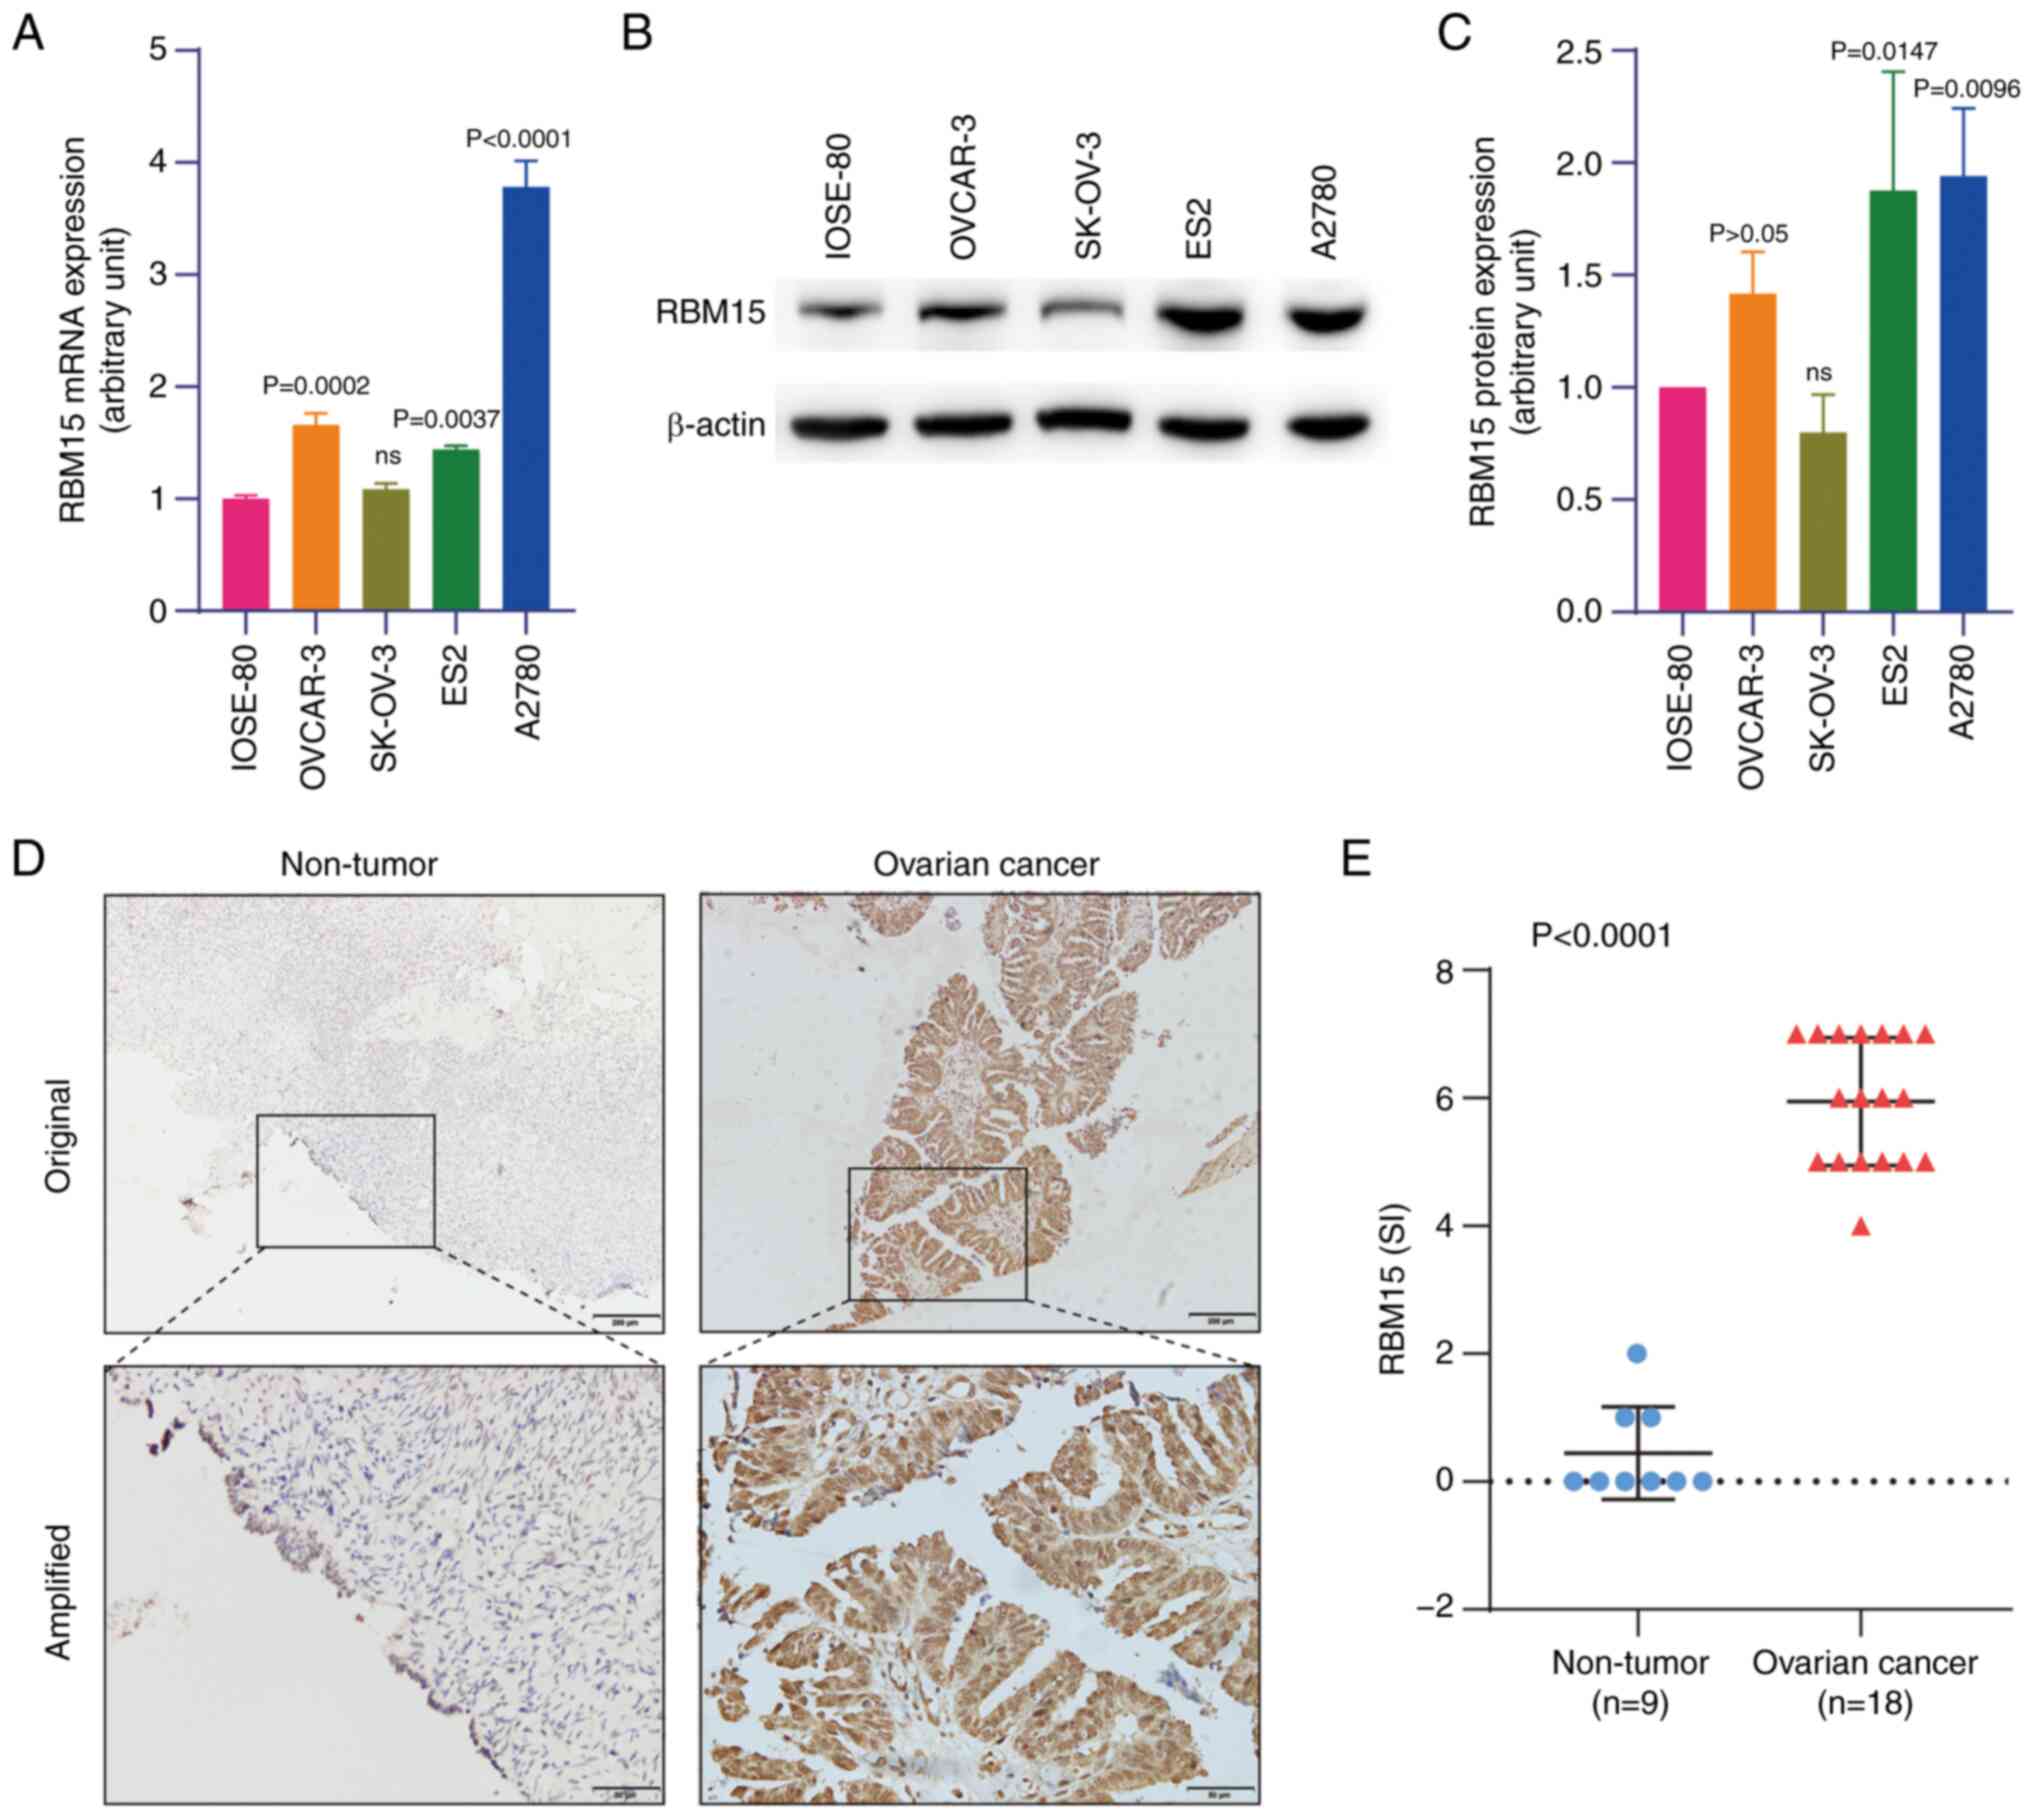
Compared with the normal human ovarian surface
epithelial (IOSE-80) cells, RBM15 expression was higher in OC cells
(OVCAR-3, ES2 and A2780) at the mRNA and protein levels, as
detected by RT-qPCR and western blotting, respectively (Fig. 1A-C). High expression of RBM15
protein was also observed in OC tissues (n=18) compared with
non-tumorous ovarian tissue (n=9), as detected by IHC staining
(Fig. 1D and E). By analyzing
public data extracted from two GEO datasets GSE14407 (12 serous
papillary OC cases) (33) and
GSE12470 (35 advanced serous OC cases and 8 early serous OC cases)
(34), it was found that RBM15
mRNA was overexpressed in ovarian primary malignant tumor tissues
compared with that in normal ovarian epithelial tissues (Fig. S1A). Furthermore, the expression
level of RBM15 protein was also higher in ovarian primary malignant
tumor tissues than in normal ovarian epithelial tissues when
analyzing data from the CPTAC database (Fig. S1B). Tissue microarray analysis
confirmed the high expression of RBM15 in ovarian malignant tumor
tissues compared with adjacent non-cancerous tissues among 39 OC
cases (P<0.001; Fig. S1C and
D). These findings indicated that RBM15 was a tissue biomarker
for OC.
High expression of RBM15 is associated
with poor prognosis of OC patients
Next, the present study examined the association
between RBM15 expression and clinicopathological features. Based on
the IHC index scores, the high expression (index score >5) and
low expression (index score ≤5) groups were defined. Clinical data
analysis from 39 OC cases demonstrated that high expression of
RBM15 was positively associated with advanced stage (P=0.045),
higher level of serum biomarker CA125 (P=0.036) and recurrence
(P=0.045; Table SII). Further
analysis showed that high RBM15 expression was associated with
shorter OS and DFS in patients with OC (Fig. S2A and B). Further analysis of the
clinical dataset using the Kaplan-Meier Plotter database
(http://kmplot.com/analysis/index.php?P=service&cancer=ovar)
confirmed that high expression of RBM15 was associated with poor
prognosis in OC patients (dataset # 1555760_a_at; Fig. S2C and D). These data indicated the
prognostic value of RBM15 in OC patients.
RBM15 is overexpressed in OC
PTX-resistant cells and increases cell viability
By comparing PTX-resistant cells with their
PTX-sensitive counterparts, it was found that RBM15 mRNA expression
was higher in A2780-PTX and SK3R-PTX cells than in A2780 and
SK-OV-3 cells, as detected by RT-qPCR (Fig. S3A). Western blotting showed high
expression of the RBM15 protein in A2780-PTX and SK3R-PTX cells
(Fig. S3B and C), as confirmed by
immunofluorescence (Fig. S3D and
E).
To examine the function of RBM15 in OC cells,
RBM15-siRNA was synthesized and RBM15-shRNA and
RBM15-overexpressing plasmids generated. A2780-PTX cells were
transfected with three RBM15-siRNAs and the transfection efficacy
was evaluated after the detection of the RBM15 protein by western
blotting (Fig. S4A). The sequence
of one RBM15-siRNA was used to generate the RBM15-shRNA
plasmid, which was cloned into the lentivirus. It
was found that sh-RBM15 was more efficient in knocking down the
target gene in PTX-resistant cells (Fig. S4B). The efficacy of
RBM15-overexpressing plasmid was tested in PTX-sensitive cells. It
was found that RBM15 mRNA and protein levels were increased in
SK-OV-3 and A2780 cells, as detected by RT-qPCR and western
blotting (Fig. S4C and D).
Next, the present study explored the effect of RBM15
on the proliferation of PTX-resistant and PTX-sensitive cells.
Loss-of-function and gain-of-function approaches showed that cell
viability was decreased after the knockdown of RBM15 by si-RBM15
and increased after the overexpression of RBM15 by oe-RBM15 in a
time-course manner (Fig. 2A, C, E and
G). Moreover, the EdU assay verified that the knockdown of
RBM15 decreased DNA replication, whereas overexpression of RBM15
increased DNA replication in A2780-PTX, SK3R-PTX, A2780 and SK-OV-3
cells (Fig. 2B, D, F and H).
Western blotting further detected a decrease in the protein
expression of cyclin D1, a cell proliferation-related marker, after
the knockdown of RBM15 in PTX-resistant OC cells (Fig. S4E). These data indicated that
RBM15 may regulate cell proliferation.
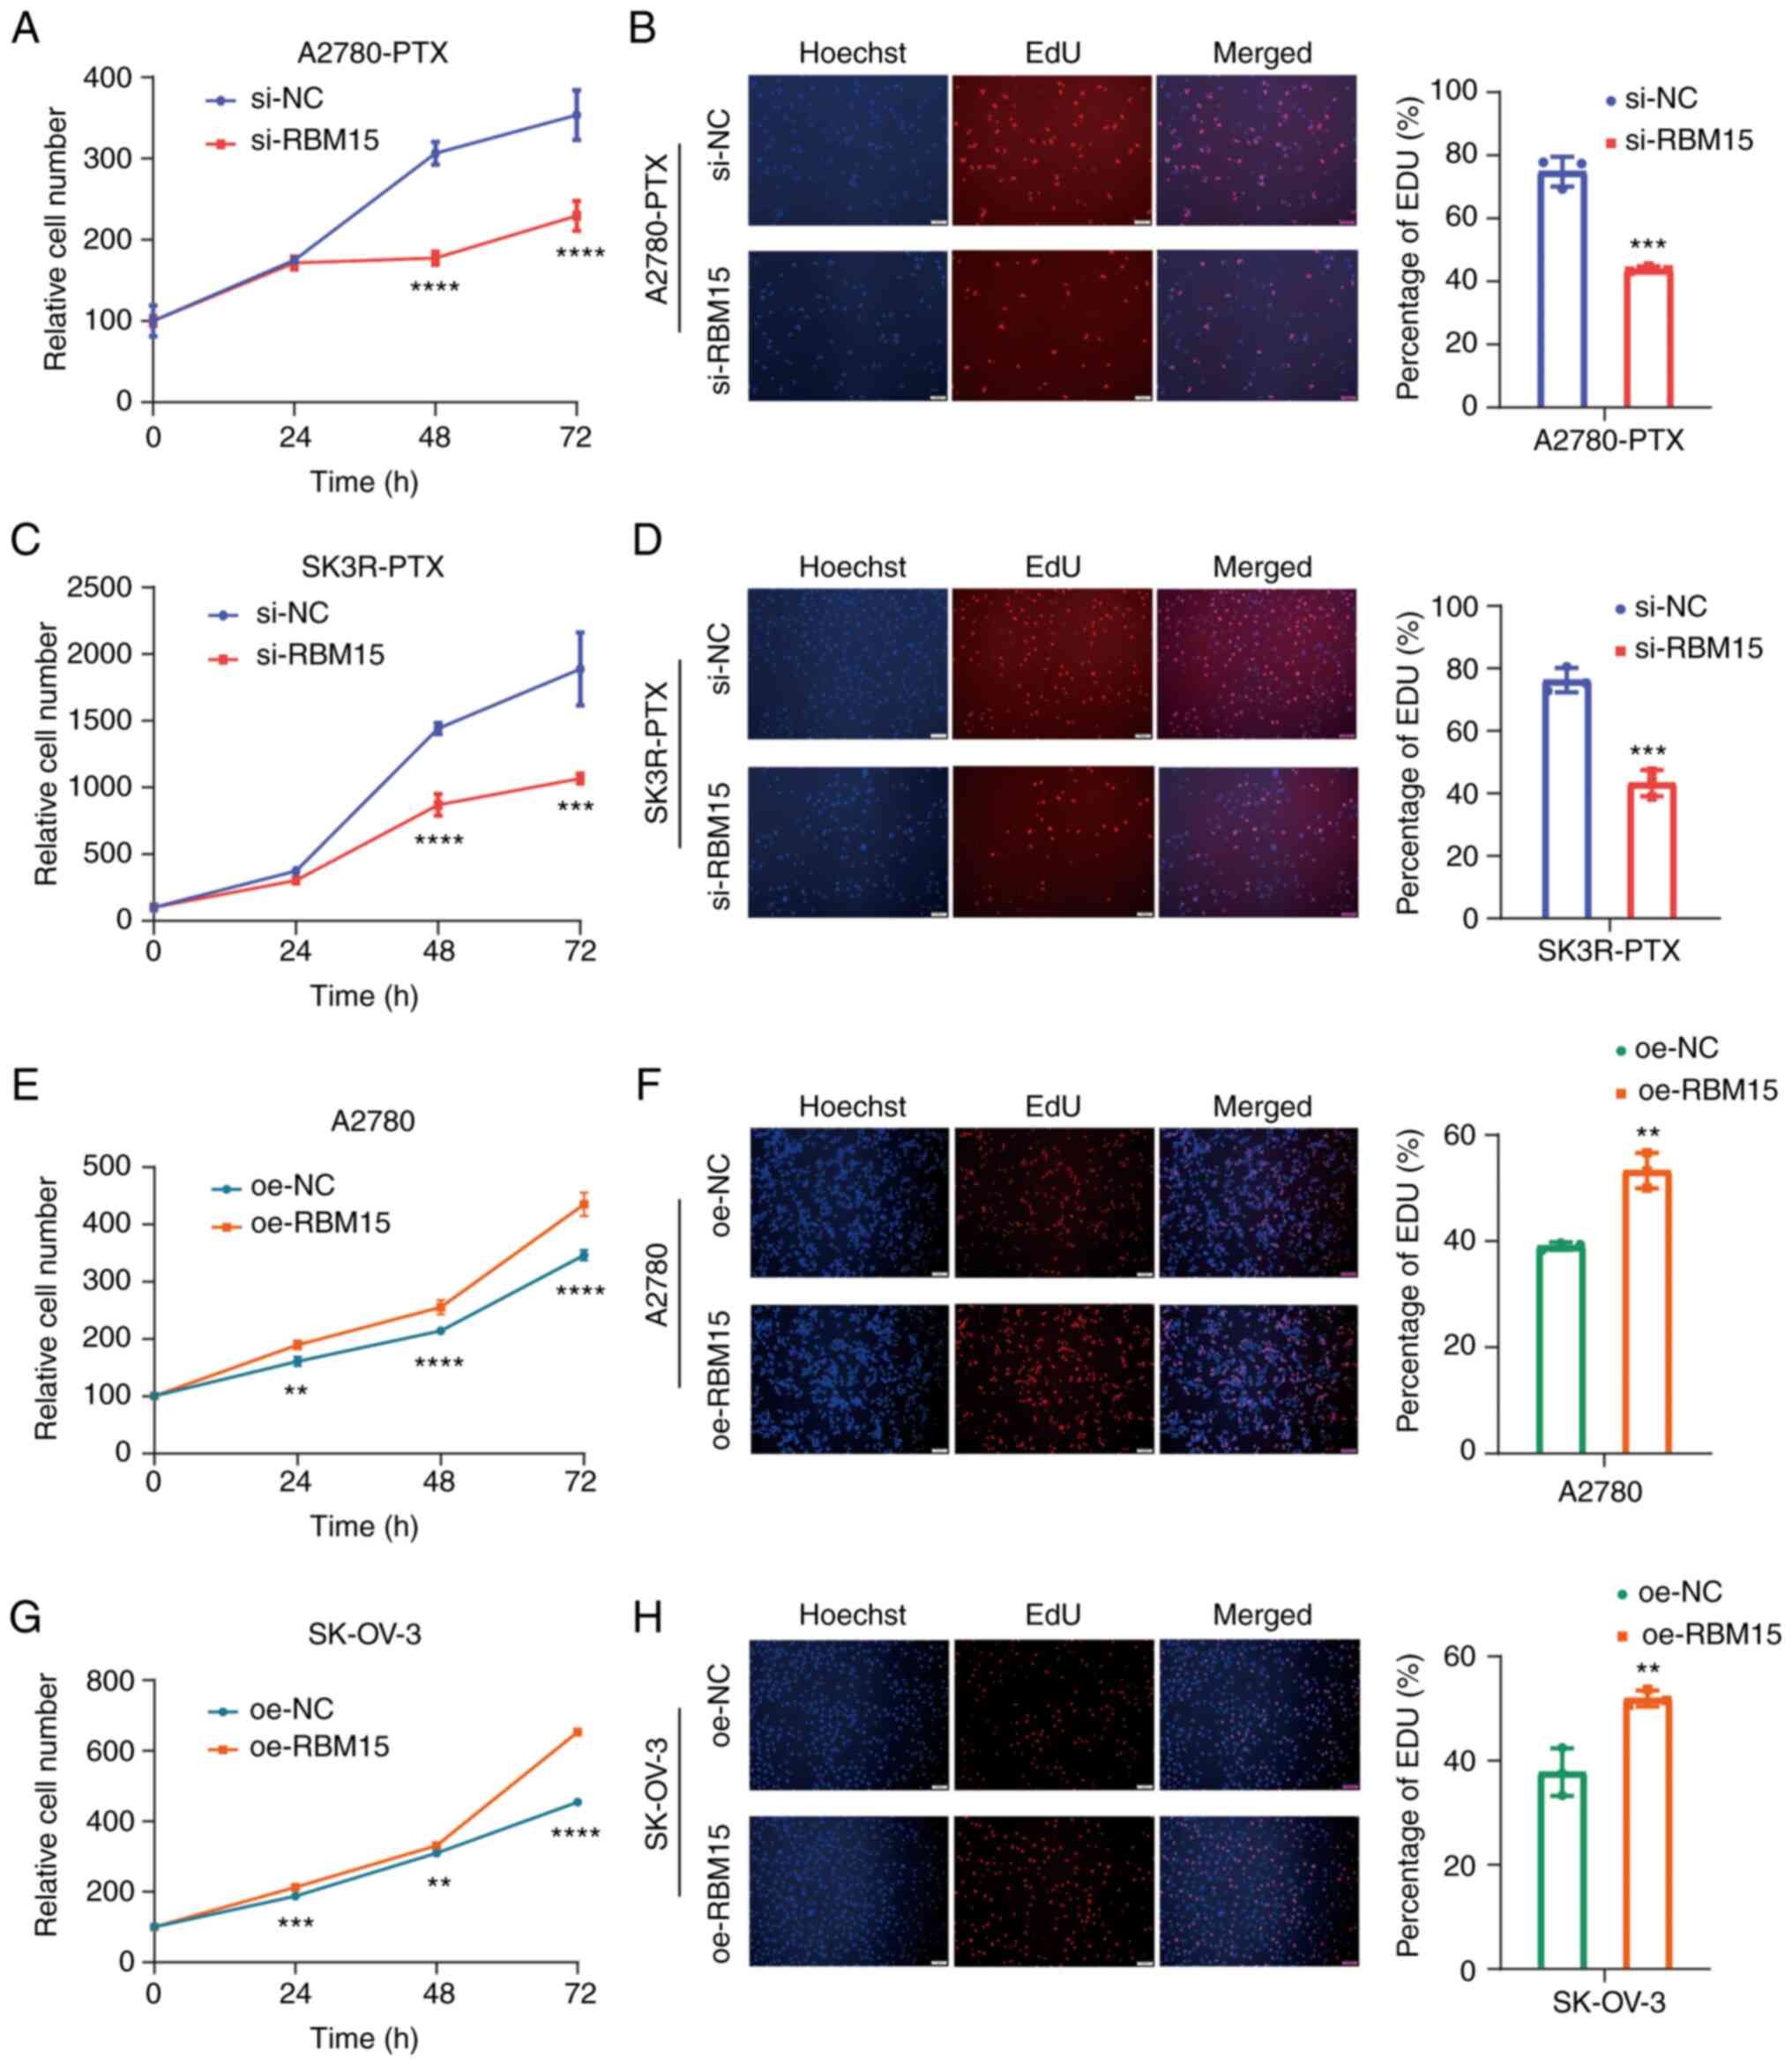 | Figure 2Effect of RBM15 on OC cell
proliferation. (A, C, E and G) Detection of cell viability by the
CCK-8 assay after RBM15-siRNA (si-RBM15) or RBM15-overexpressing
plasmid (oe-RBM15) transfection for 0, 24, 48 and 72 h in
A2780-PTX, SK3R-PTX, A2780 and SK-OV-3 cells. Two-way ANOVA
followed by the Sidak test was used. Data presented as mean ± SD
(n=3). A2780-PTX: 48 h, P<0.0001; 72 h P<0.0001. SK3R-PTX: 48
h, P<0.0001; 72 h, P<0.0001. A2780: 24 h, P=0.0006, 48 h,
P=0.0036; 72 h P<0.0001. SK-OV-3: 24 h, P=0.0018; 48 h,
P<0.0001; 72 h, P<0.0001. (B, D, F and H) The EdU assay and
statistical analysis following si-RBM15 or oe-RBM15 transfection
for 48 h. Original magnification, ×100; Scale bar, 100 μm.
All assays were repeated at least three times. An unpaired
Student's t-test was used. A2780-PTX, P=0.0004; SK3R-PTX, P=0.0006;
A2780, P=0.0019; SK-OV-3, P=0.0070. Data presented as mean ± SD.
**P<0.01; ***P<0.001;
****P<0.0001. RBM15, RNA binding motif protein 15;
OC, ovarian cancer; si, small interfering; oe, overexpressing; NC,
negative control; PTX, paclitaxel. |
Knockdown of RBM15 leads to an inhibition
of colony formation in vitro and tumor formation in vivo
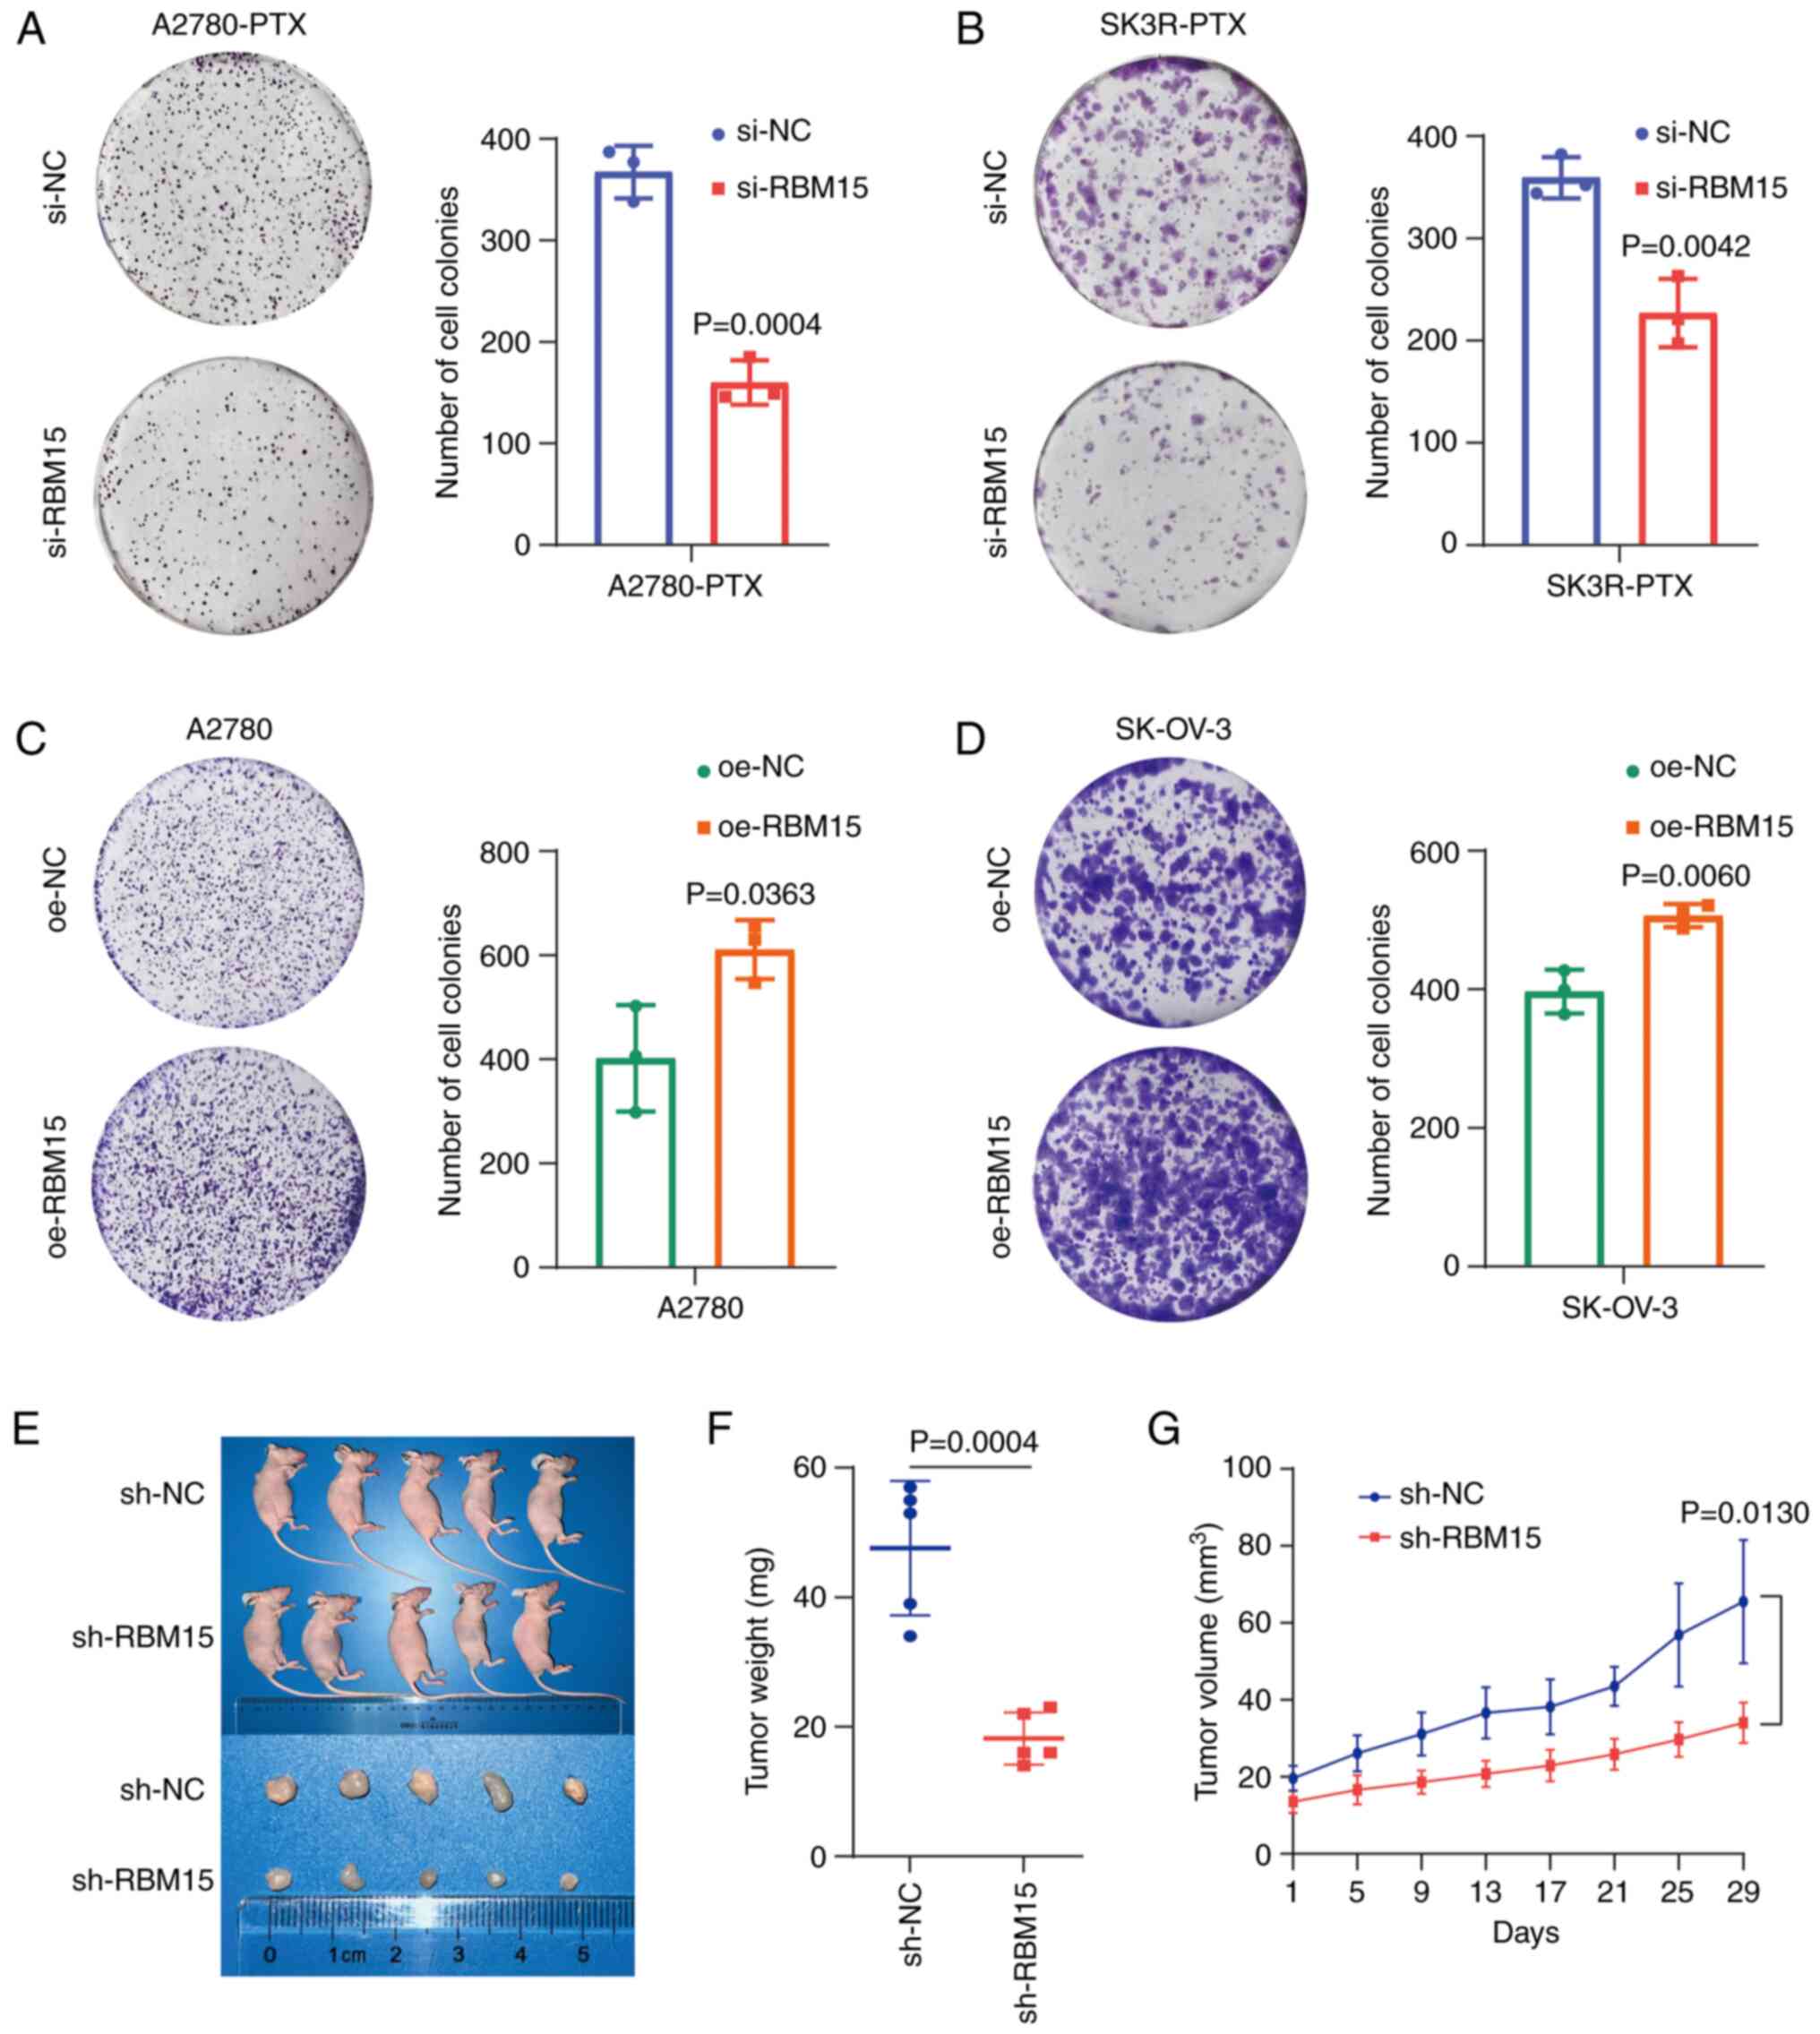
The colony formation assays showed that the
knockdown of RBM15 by RBM15-siRNA suppressed colony formation in
A2780-PTX and SK3R-PTX cells (Fig. 3A
and B), whereas overexpression of RBM15 by overexpressing
plasmids significantly accelerated colony formation in A2780 and
SK-OV-3 cells (Fig. 3C and D)
compared with the negative control group. Next, stable
RBM15-overexpressing A2780-PTX cells were generated and
subcutaneously injected into nude mice to validate the effect of
RBM15 on tumor growth in vivo. It was found that tumor
formation was suppressed in sh-RBM15 mice (Fig. 3E). The tumor weight and volume were
decreased in sh-RBM15 mice, indicating that RBM15 knockdown
inhibited tumor growth (Fig. 3F and
G).
Knockdown of RBM15 resensitizes
PTX-resistant cells to paclitaxel
Since the level of RBM15 expression was higher in
PTX-resistant OC cells than in their sensitive counterparts,
whether knockdown or overexpression of RBM15 affected cell
sensitization to PTX was tested. The cytotoxicity assay showed a
change in PTX-resistant cell viability after knockdown or
overexpression of RBM15, as evaluated by measuring the
IC50 of PTX. RBM15 knockdown increased the sensitivity
of A2780-PTX and SK3R-PTX cells, whereas RBM15 overexpression
increased the resistance of A2780 and SK-OV-3 cells to PTX in a
dose-dependent manner (Fig. 4A and
B). The IC50 value decreased from 8.768 μM
(95% CI 6.377 to 12.06) to 1.457 μM (95%CI 0.8106 to 2.619)
in A2780-PTX cells and from 2.646 μM (95%CI 0.3162 to 22.14)
to 0.909 μM (95%CI 0.08733 to 9.470) in SK3R-PTX cells after
si-RBM15 transfection (Fig. 4A),
whereas it increased from 0.021 μM (95%CI 0.007197 to
0.06488) to 0.093 μM (95%CI 0.03337 to 0.2151) in A2780
cells and from 0.038 μM (95%CI 0.004525 to 0.3230) to 0.139
μM (95%CI 0.01688 to 1.148) in SK-OV-3 cells after oe-RBM15
transfection (Fig. 4B). Repeated
experiments showed that the average IC50 value
significantly declined from 7.365±1.308 μM to 1.581±0.337
μM in A2780-PTX cells (n=3; P=0.0018) and from 2.465±0.161
μM to 0.833±0.079 μM in SK3R-PTX cells (n=3;
P<0.0001) after si-RBM15 transfection (Fig. 4C), whereas it raised from
0.034±0.013 μM to 0.118±0.035 μM (n=3; P=0.0172) in
A2780 cells and from 0.064±0.026 μM to 0.148±0.039 μM
(n=3; P=0.0371) in SK-OV-3 cells after oe-RBM15 transfection
(Fig. 4D). Although the sigmoidal
nature of these plots in Fig. 4A and
B was not ideal, the results for the IC50
calculations (Fig. 4C and D) were
sufficient to indicate the differences in cell viability and
IC50 between the NC and RBM15 knockdown/overexpression
groups. Knockdown of RBM15 decreased the viability of A2780-PTX and
SK3R-PTX cells, while overexpression of RBM15 increased the
viability of A2780 and SK-OV-3 cells in a time-dependent manner
after treatment with IC50 dose of PTX (Fig. 4E and F). These results indicated
that high expression of RBM15 was positively associated to the high
IC50 value of PTX. Further, it was analyzed whether
RBM15 expression was associated to other anti-cancer drugs in OC
treatment. Using a public data source (http://genemed.uchicago.edu/~pgeeleher/pRRophetic/),
it was found that veliparib, cyclopamine, elesclomol, pictilisib,
lapatinib, temsirolimus and vinblastine were associated with RBM15
expression (Fig. S5A-G). These
data suggested that RBM15 is an anti-cancer drug resistance-related
gene. One of the reasons for chemoresistance is the reduction in
cell apoptosis. Next, the effect of RBM15 on PTX-resistant cell
apoptosis was examined by flow cytometry. RBM15 knockdown or
overexpression alone did not affect apoptosis. However, the number
of apoptotic cells was significantly increased in the si-RBM15
group of A2780-PTX and SK3R-PTX cells but decreased in the oe-RBM15
group of A2780 and SK-OV-3 cells after PTX treatment (Fig. S6A-F). These data indicated that
RBM15 is a therapeutic target for PTX resistance in terms of
proliferation and that RBM15-siRNA is a sensitizer of PTX in terms
of apoptosis.
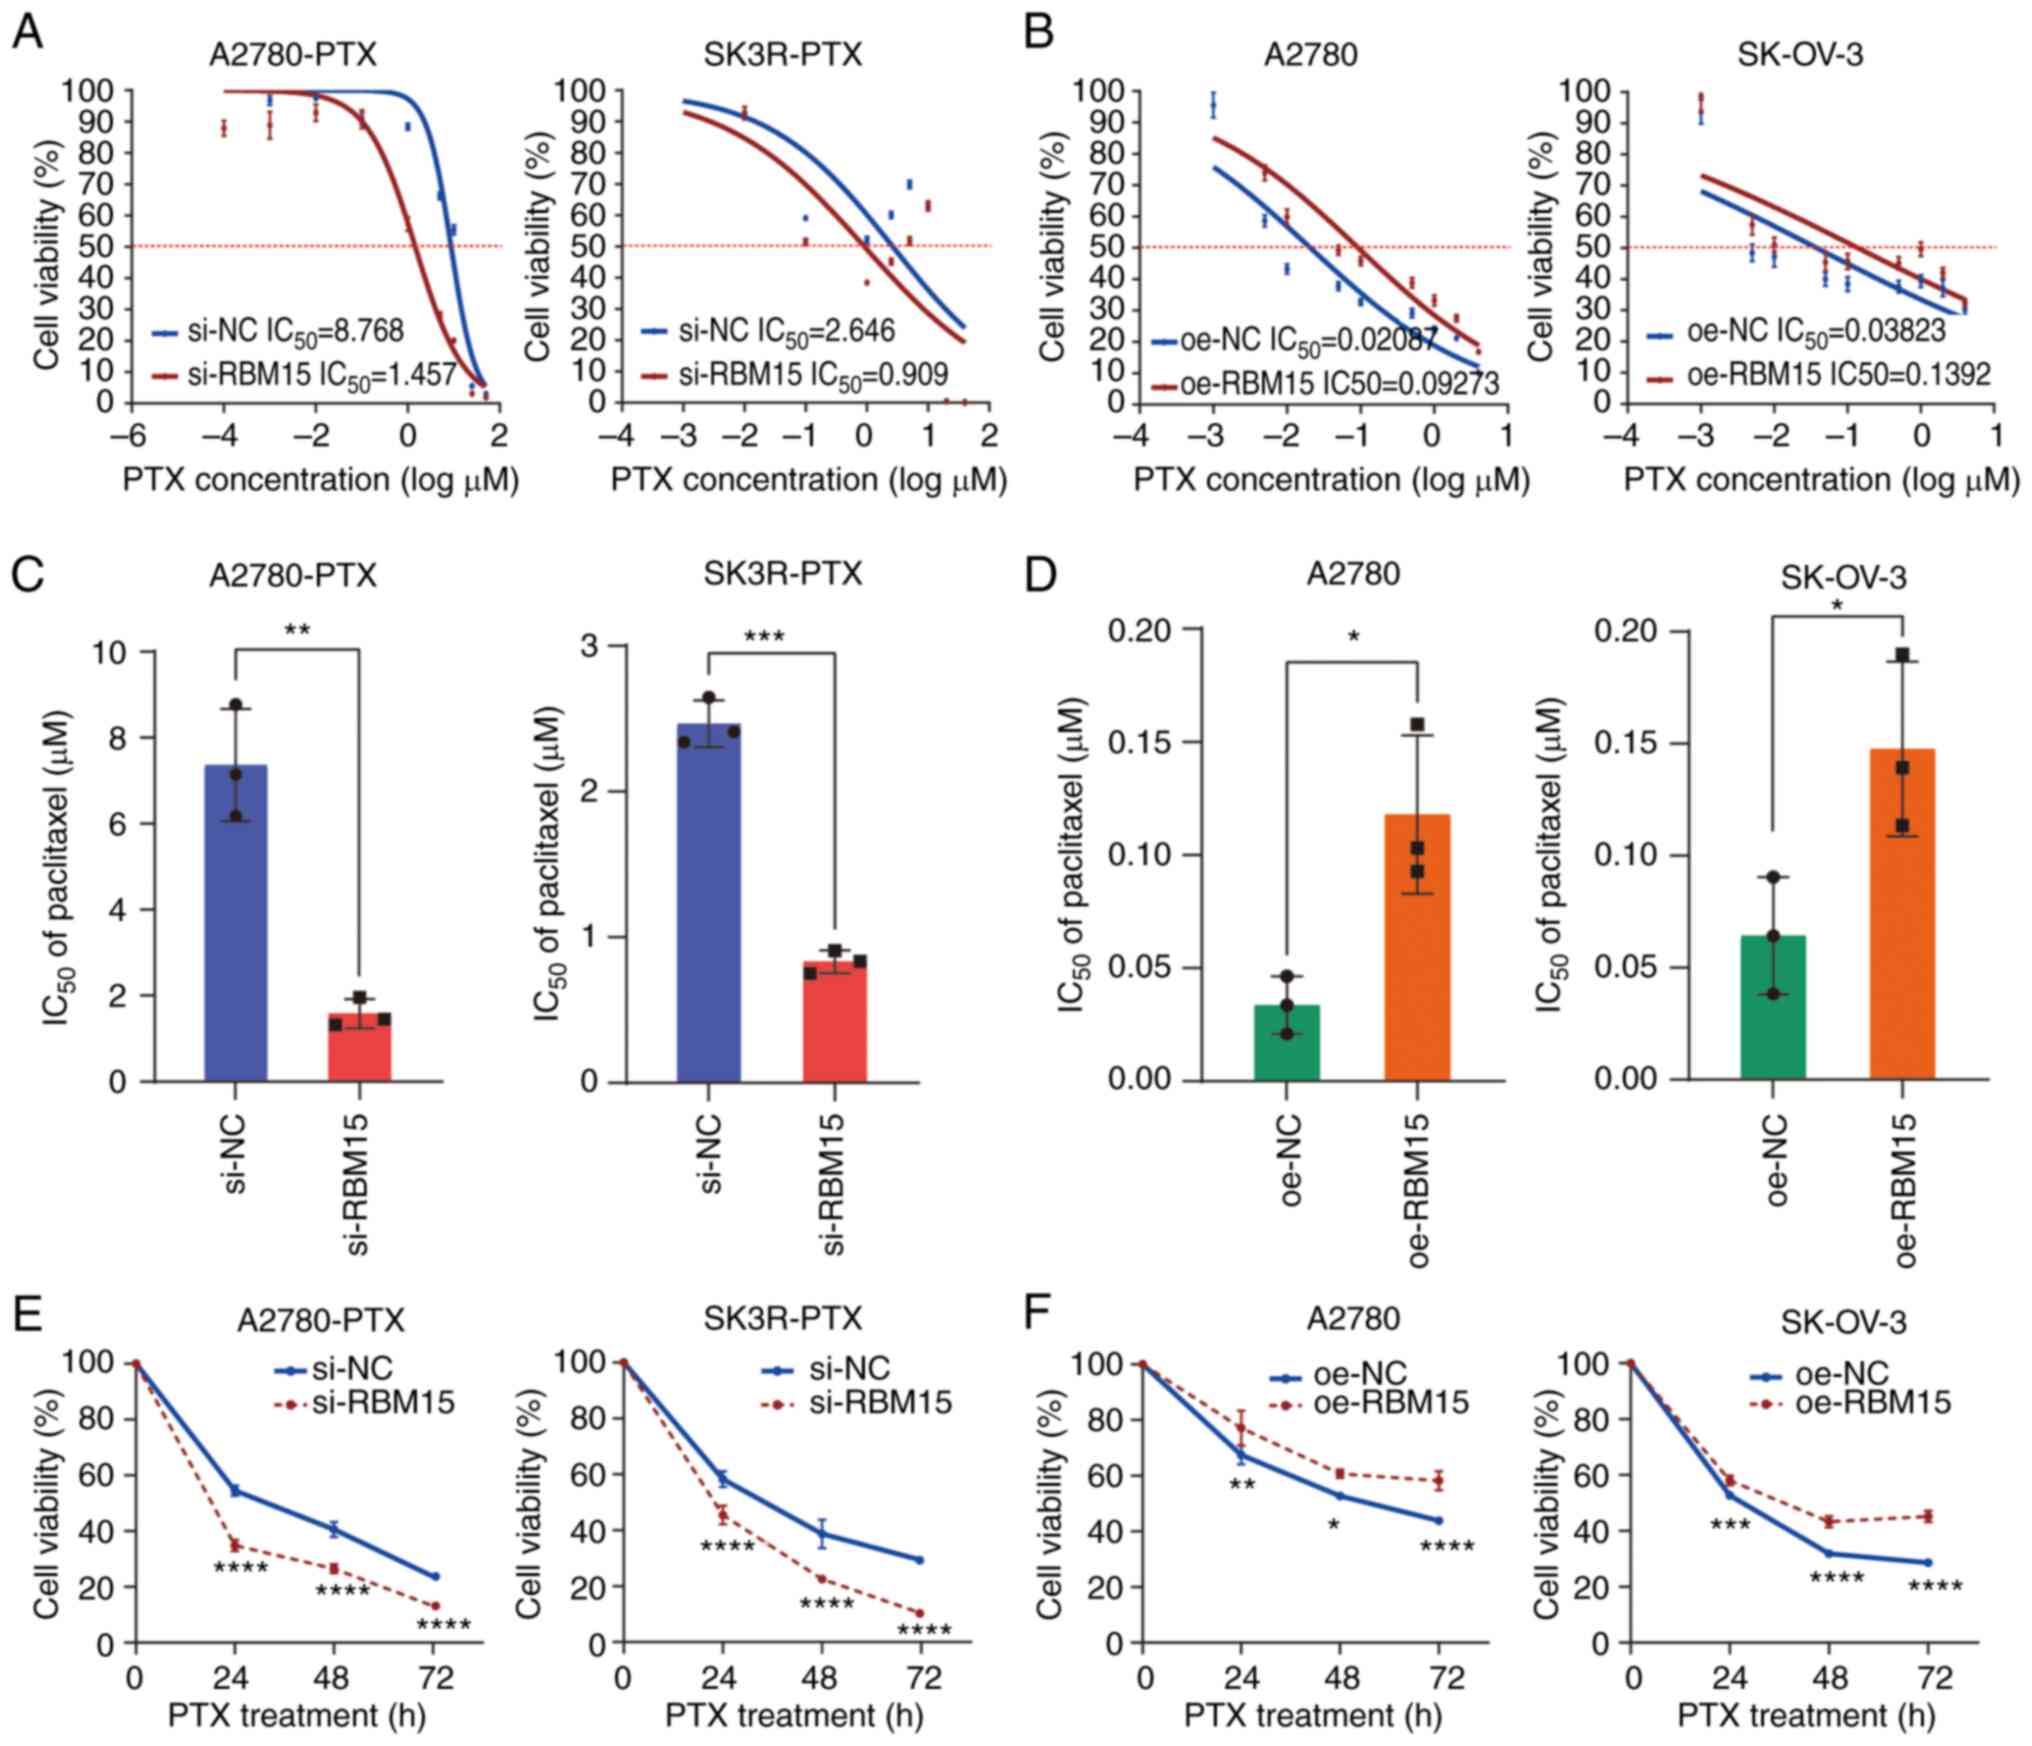 | Figure 4Effect of RBM15 on paclitaxel
sensitivity. (A and B) Detection of cell viability by the CCK-8
assays after knockdown or overexpression of RBM15 in A2780-PTX and
SK3R-PTX cells treated with different doses of PTX. The
IC50 was calculated by nonlinear regression analysis
using a model of 'Log(inhibitor) vs. normalized response-Variable
slope' under the 'Dose-response-Inhibition' section. Data presented
as mean ± SD (n=4). (C and D) Measurement of IC50 after
PTX treatment in siRNA transfected A2780-PTX (P=0.0018) and
SK3R-PTX (P<0.0001) cells and overexpressing plasmid transfected
A2780 (P=0.0172) and SK-OV-3 (P=0.0371) cells. An unpaired
Student's t-test was used. Data presented as mean ± SD (n=3). (E
and F) Detection of cell viability by the CCK-8 assays after
knockdown in A2780-PTX and SK3R-PTX cells or overexpression of
RBM15 in A2780 and SK-OV-3 cells treated with IC50 dose
of PTX for 24, 48 and 72 h. A2780-PTX: 24 h, P<0.0001; 48 h,
P<0.0001; 72 h, P<0.0001. SK3R-PTX: 24 h, P<0.0001; 48 h,
P<0.0001; 72 h, P<0.0001. A2780: 24 h, P=0.0039; 48 h,
P=0.0170; 72 h, P<0.0001. SK-OV-3: 24 h, P=0.0003; 48 h,
P<0.0001; 72 h, P<0.0001. Two-way ANOVA followed by the Sidak
test was used. Data presented as mean ± SD. *P<0.05;
**P<0.01; ***P<0.001;
****P<0.0001. RBM15, RNA binding motif protein 15;
si, small interfering; oe, overexpressing; NC, negative control;
PTX, paclitaxel; IC50, half-maximal inhibitory
concentration. |
Knockdown of RBM15 inhibits PTX-resistant
cell stemness
Next, whether RBM15 also affects cancer cell
stemness in PTX-resistant cells was explored, since PTX resistance
is positively correlated with stem cell characteristics (7). A2780-PTX and SK3R-PTX cells were
stably infected with sh-RBM15 or sh-NC virus and these stable cells
were then seeded in an ultra-low attachment culture plate. The
growth of stem cell-like cells was measured by spheroid formation
assays. It was found that the spheroid-forming capacity of sh-RBM15
cells was remarkably lower than that of sh-NC cells (Fig. S7A-C). These data suggested that
the knockdown of RBM15 may inhibit PTX-resistant cell stemness.
Silencing of RBM15 decreases MDR1 mRNA
m6A methylation
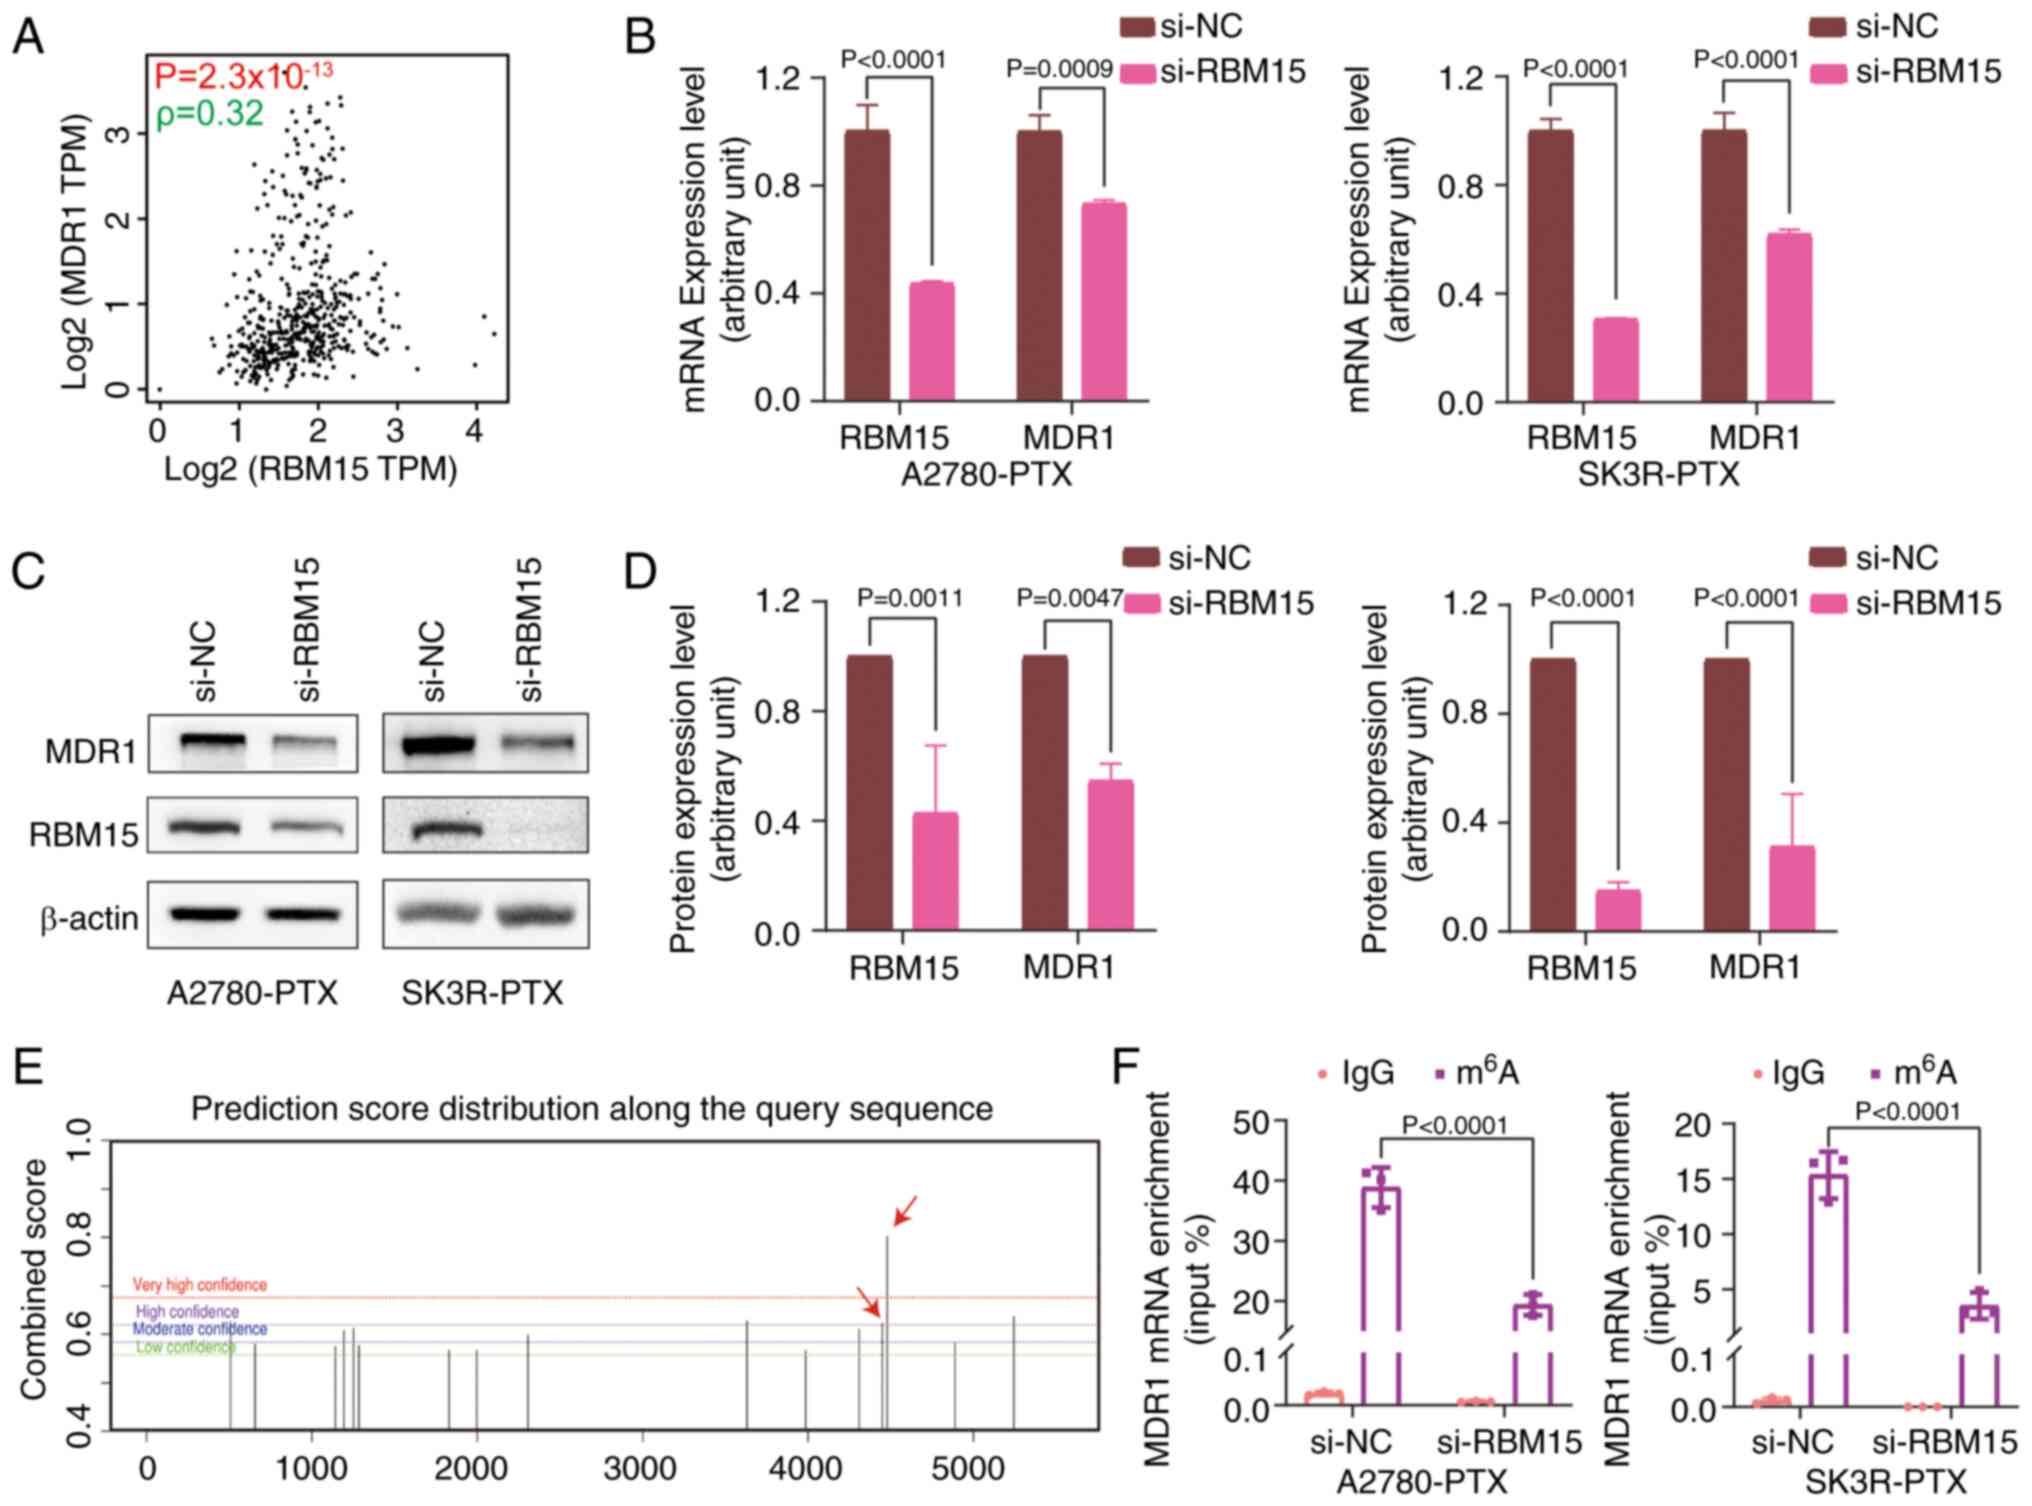
To further explore the specific molecular mechanism
regulating resistance in OC, the correlation between RBM15
expression and MDR1 expression in OC was assessed using the GEPIA
database and measured by Spearman Correlation Coefficient (Fig. 5A). The effect of RBM15 on MDR1
expression was validated by RT-qPCR and western blotting. Knockdown
of RBM15 significantly inhibited MDR1 mRNA and protein expression
(Fig. 5B-D). As RBM15 is a
critical component of the m6A methyltransferase complex
(14) and since RBM15 affects MDR1
expression, the SRAMP database was next applied to predict the
possible distribution of m6A sites in MDR1 mRNA.
Multiple m6A modification sites in MDR1 mRNA were found
(Fig. 5E). Subsequently, the
MeRIP-qPCR assay demonstrated that RBM15 knockdown significantly
reduced the m6A level of MDR1 mRNA, covering 4,449 and
4,478 sites (Fig. 5F). These data
suggested that RBM15 regulates MDR1 expression through
m6A modifications.
RBM15/MDR1 expression is downregulated by
activating the TGF-β/Smad2 signaling pathway
To understand the biological functions of RBM15 in
OC, RNA-seq data from 47 OC cells were downloaded from CCLE
(https://sites.broadinstitute.org/ccle) and analyzed.
There were 79 genes significantly associated with RBM15 expression
by correlation test (P<0.001). GO term analysis revealed that
these genes were primarily involved in the Smad protein complex and
DNA-binding transcription activator activity (Fig. S8A). In addition, KEGG pathway
analysis showed that RBM15-correlated (positively or negatively)
genes were gathered at the pathways of cellular senescence, RNA
degradation, TGF-β signaling and mRNA surveillance (Fig. S8B).
Based on GO and KEGG enrichment analyses, RBM15
expression is related to the TGF-β signaling pathway. Next, the
effect of TGF-β signaling on RBM15 expression was examined. The
expression of RBM15 and MDR1 was significantly reduced after TGF-β1
treatment at the mRNA and protein levels (Fig. 6A-E). The activation of TGF-β1 was
abolished by the addition of the TGF-β receptor inhibitor SB431542.
p-Smad2 was markedly low in SK3R-PTX cells compared with SK-OV-3
cells, as detected by western blotting (Fig. S9) and was used as an indicator of
TGF-β signaling activation. The SBE site was found in the promoter
region of RBM15 and the Smad-binding motif is indicated (Fig. 6F). From the JASPAR database, it was
predicted that Smad proteins, as transcription factors, could
directly bind to the promoter of RBM15. The predicted Smad2 binding
sites with different scores in the promoter region-2,000 bp
upstream from the TSS of RBM15 are illustrated (Fig. 6G). After constructing two plasmids
(P1081 and P780; Fig. 6H), a
dual-luciferase reporter gene assay was performed. The results
showed that the relative luciferase activity was significantly
decreased in 293T cells transfected with the P1081 plasmid, but not
with the P780 plasmid, in the presence of 10 ng/ml TGF-β1 (Fig. 6I). These data indicated that TGF-β1
affects RBM15 expression through direct Smad-binding events.
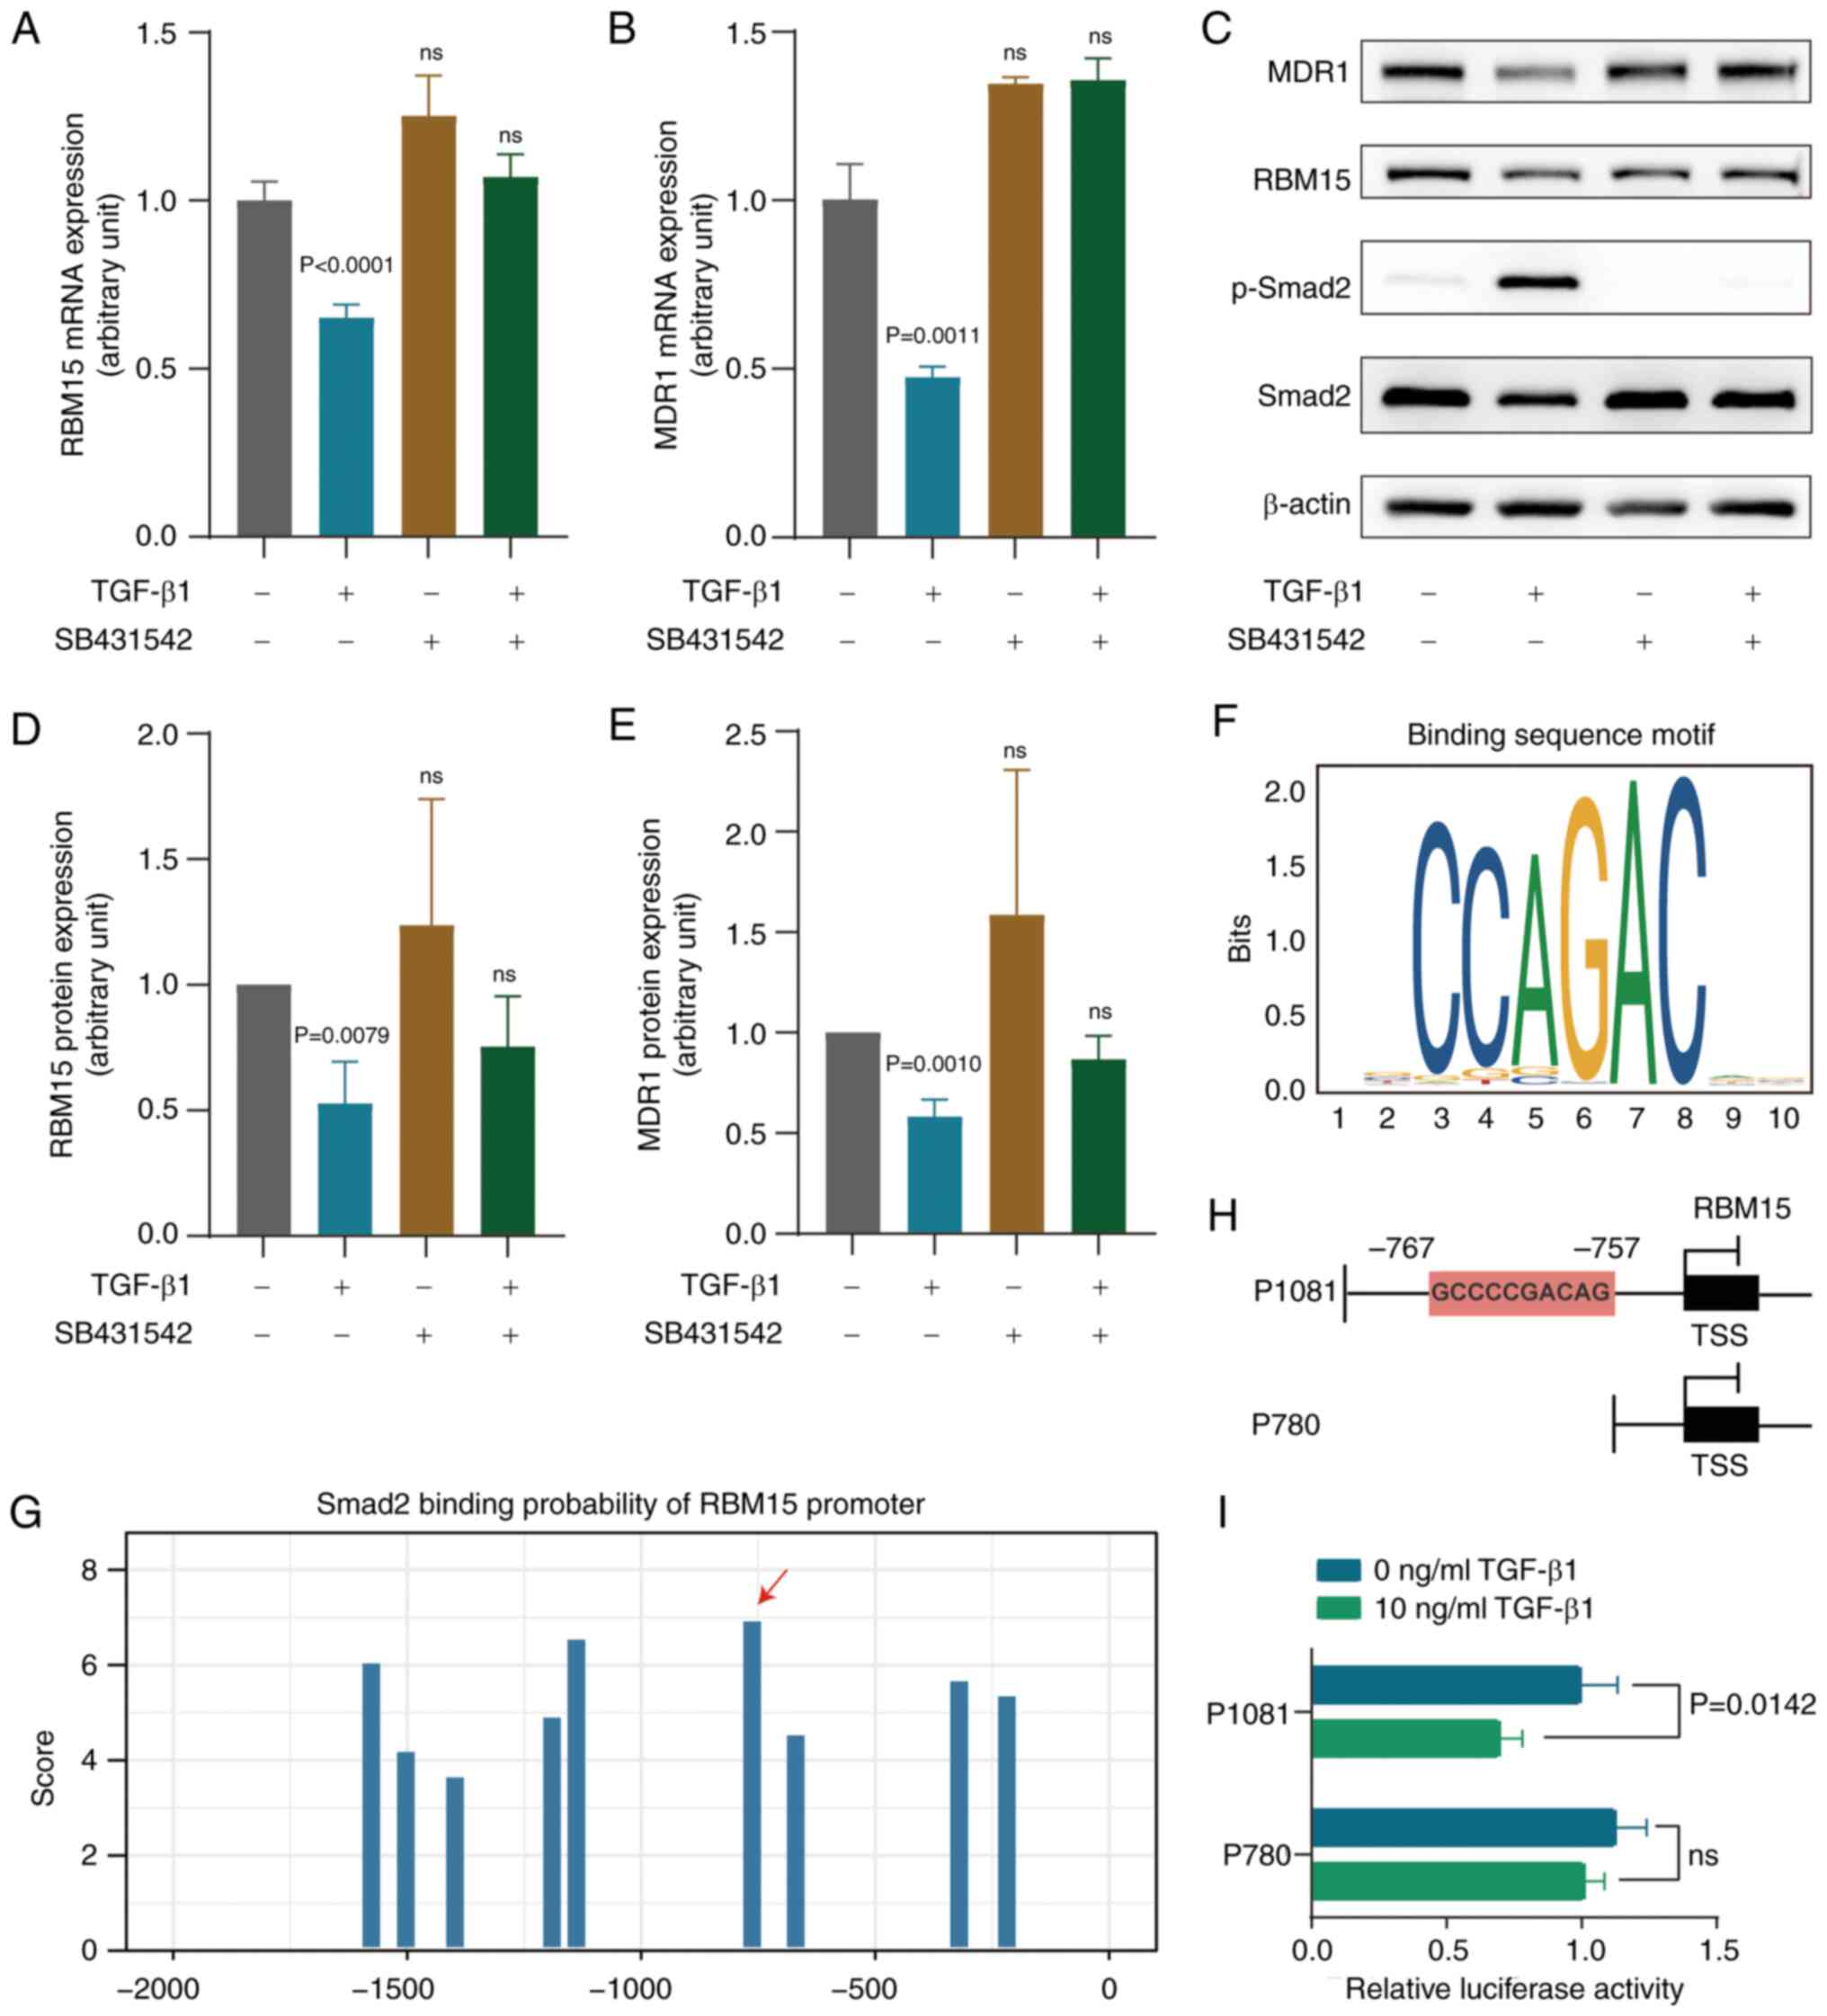 | Figure 6Effect of TGF-β1 on RBM15 and
expression. (A and B) Detection of RBM15 and MDR1 mRNA expression
by RT-qPCR after TGF-β1 (10 ng/ml) treatment in the presence or
absence of SB431542 (10 mM) in SK3R-PTX cells. Multiple t-tests
were used for multiple groups comparison. Data presented as mean ±
SD (n=3). (C) Detection of MDR1, RBM15, phosphor-Smad2 and Smad2
proteins by western blotting after TGF-β1 (10 ng/ml) treatment in
the presence or absence of SB431542 (10 mM) in SK3R-PTX cells. (D
and E) Semiquantitative of membranes in C. Multiple t-tests were
used for multiple groups comparison. Data presented as mean ± SD
(n-3). (F) The Smad binding motif. (G) The binding sites of Smad2
in the region-2,000 bp upstream of the RBM15 TSS were predicted
from the JASPAR database. (H) Schematic illustrations of two RBM15
plasmid constructs (P1081 and P780): -1,081 bp and -780 bp upstream
from TSS in the RBM15 promoter region. (I) Luciferase activities
were detected in 293T cells transfected with different RBM15
promoter-reporter plasmids in the presence or absence of TGF-β1 (10
ng/ml). Two-way ANOVA followed by the Sidak test was used. Data
presented as mean ± SD (n=3). ns, not significant (P>0.05).
RBM15, RNA binding motif protein 15; MDR1, multidrug resistance 1;
RT-qPCR, reverse transcription-quantitative PCR; PTX, paclitaxel;
TSS, transcriptional start site; p-, phosphorylated. |
Discussion
The present study demonstrated that RBM15 was
upregulated in OC tissues and PTX-resistant cells and was
associated with poor prognosis in OC patients. Overexpression of
RBM15 modulated cell proliferation, chemoresistance and cancer cell
stemness, whereas knockdown RBM15 reduced colony formation in
vitro and tumor formation in vivo. Furthermore,
TGF-β/Smad directly regulated RBM15, which methylates MDR1 mRNA in
an m6A-dependant manner to mediate chemoresistance.
It has been reported that RBM15 is capable of
facilitating cell proliferation in some cancers (16,17,35),
but this has not been reported in OC. For example, RBM15 enhances
the proliferation, migration and invasion of clear cell renal cell
carcinoma (36). The knockdown of
RBM15 reduces the proliferation of laryngeal squamous cell cancer
both in vitro and in vivo (16). The current study demonstrated the
oncogenic role of RBM15: Overexpression accelerated cell
proliferation and colony formation in vitro and knockdown of
RBM15 suppressed tumor formation in vivo. Furthermore, the
involvement of RBM15 in PTX resistance in OC was reported.
CSCs, the main culprit of cancer resistance, are a
subgroup of bulk tumors with stem cell-like properties and
tumorigenic abilities (37,38).
The current study observed that PTX-resistant cells had
spheroid-forming capabilities, suggesting the existence of a stem
cell-like cell subpopulation. To date, CSC subpopulations have been
identified in malignant ovarian tumors, ascites and cancer cell
lines by several groups, including ours (7,8,39).
It has been reported that CSCs are involved in the development of
metastasis, recurrence and drug resistance of OC (40). CSC marker CD44 can upregulate MDR1
expression, leading to increasing the resistance of osteosarcoma
cells to doxorubicin (10).
Notably, direct regulation of MDR1 expression by RBM15 was
observed. Silencing of RBM15 resensitized OC cells to PTX by
decreasing MDR1 expression. Using the SRAMP database to predict the
possible distribution of m6A sites in MDR1 mRNA, the
present study explored, for the first time to the best of the
authors' knowledge, that RBM15 mediated MDR1 expression through
mRNA m6A methylation. It has been shown that RBM15 acts
as an m6A writer to reduce target RNA m6A
modifications (41,42), ultimately reducing target
expression. MDR1 is the best-characterized transporter protein
whose overexpression can confer resistance to cytotoxic and
targeted chemotherapy (43). A
number of studies have shown that MDR1 is a primary target for
reversing drug resistance in OC (44-46)
and m6A modification of RNA primarily affects RNA
processing, degradation and translation to regulate gene
expression, tumorigenesis and progression (47). The findings of the present study
supported the role of RBM15 in the regulation of MDR1 expression,
at least through m6A modifications.
The present study also examined the upstream
regulation of RBM15 via the TGF-β signaling pathway. TGF-β is a
cytokine closely involved in a number of cancer cell processes,
including cell death, proliferation, metastasis,
mesenchymal-epithelial transition, cancer cell stemness and
chemoresistance (48,49). Our previous study found that the
TGF-β signaling pathway was deficient in PTX-resistant OC cells
(21). The present study observed
that enhancement of TGF-β signaling led to the downregulation of
RBM15 expression at the mRNA and protein levels in PTX-resistant OC
cells by directly binding to the RBM15 promoter through the SBE
site. These data indicated that the TGF-β/RBM15/MDR1 axis is
involved in the development of chemoresistance in OC cells.
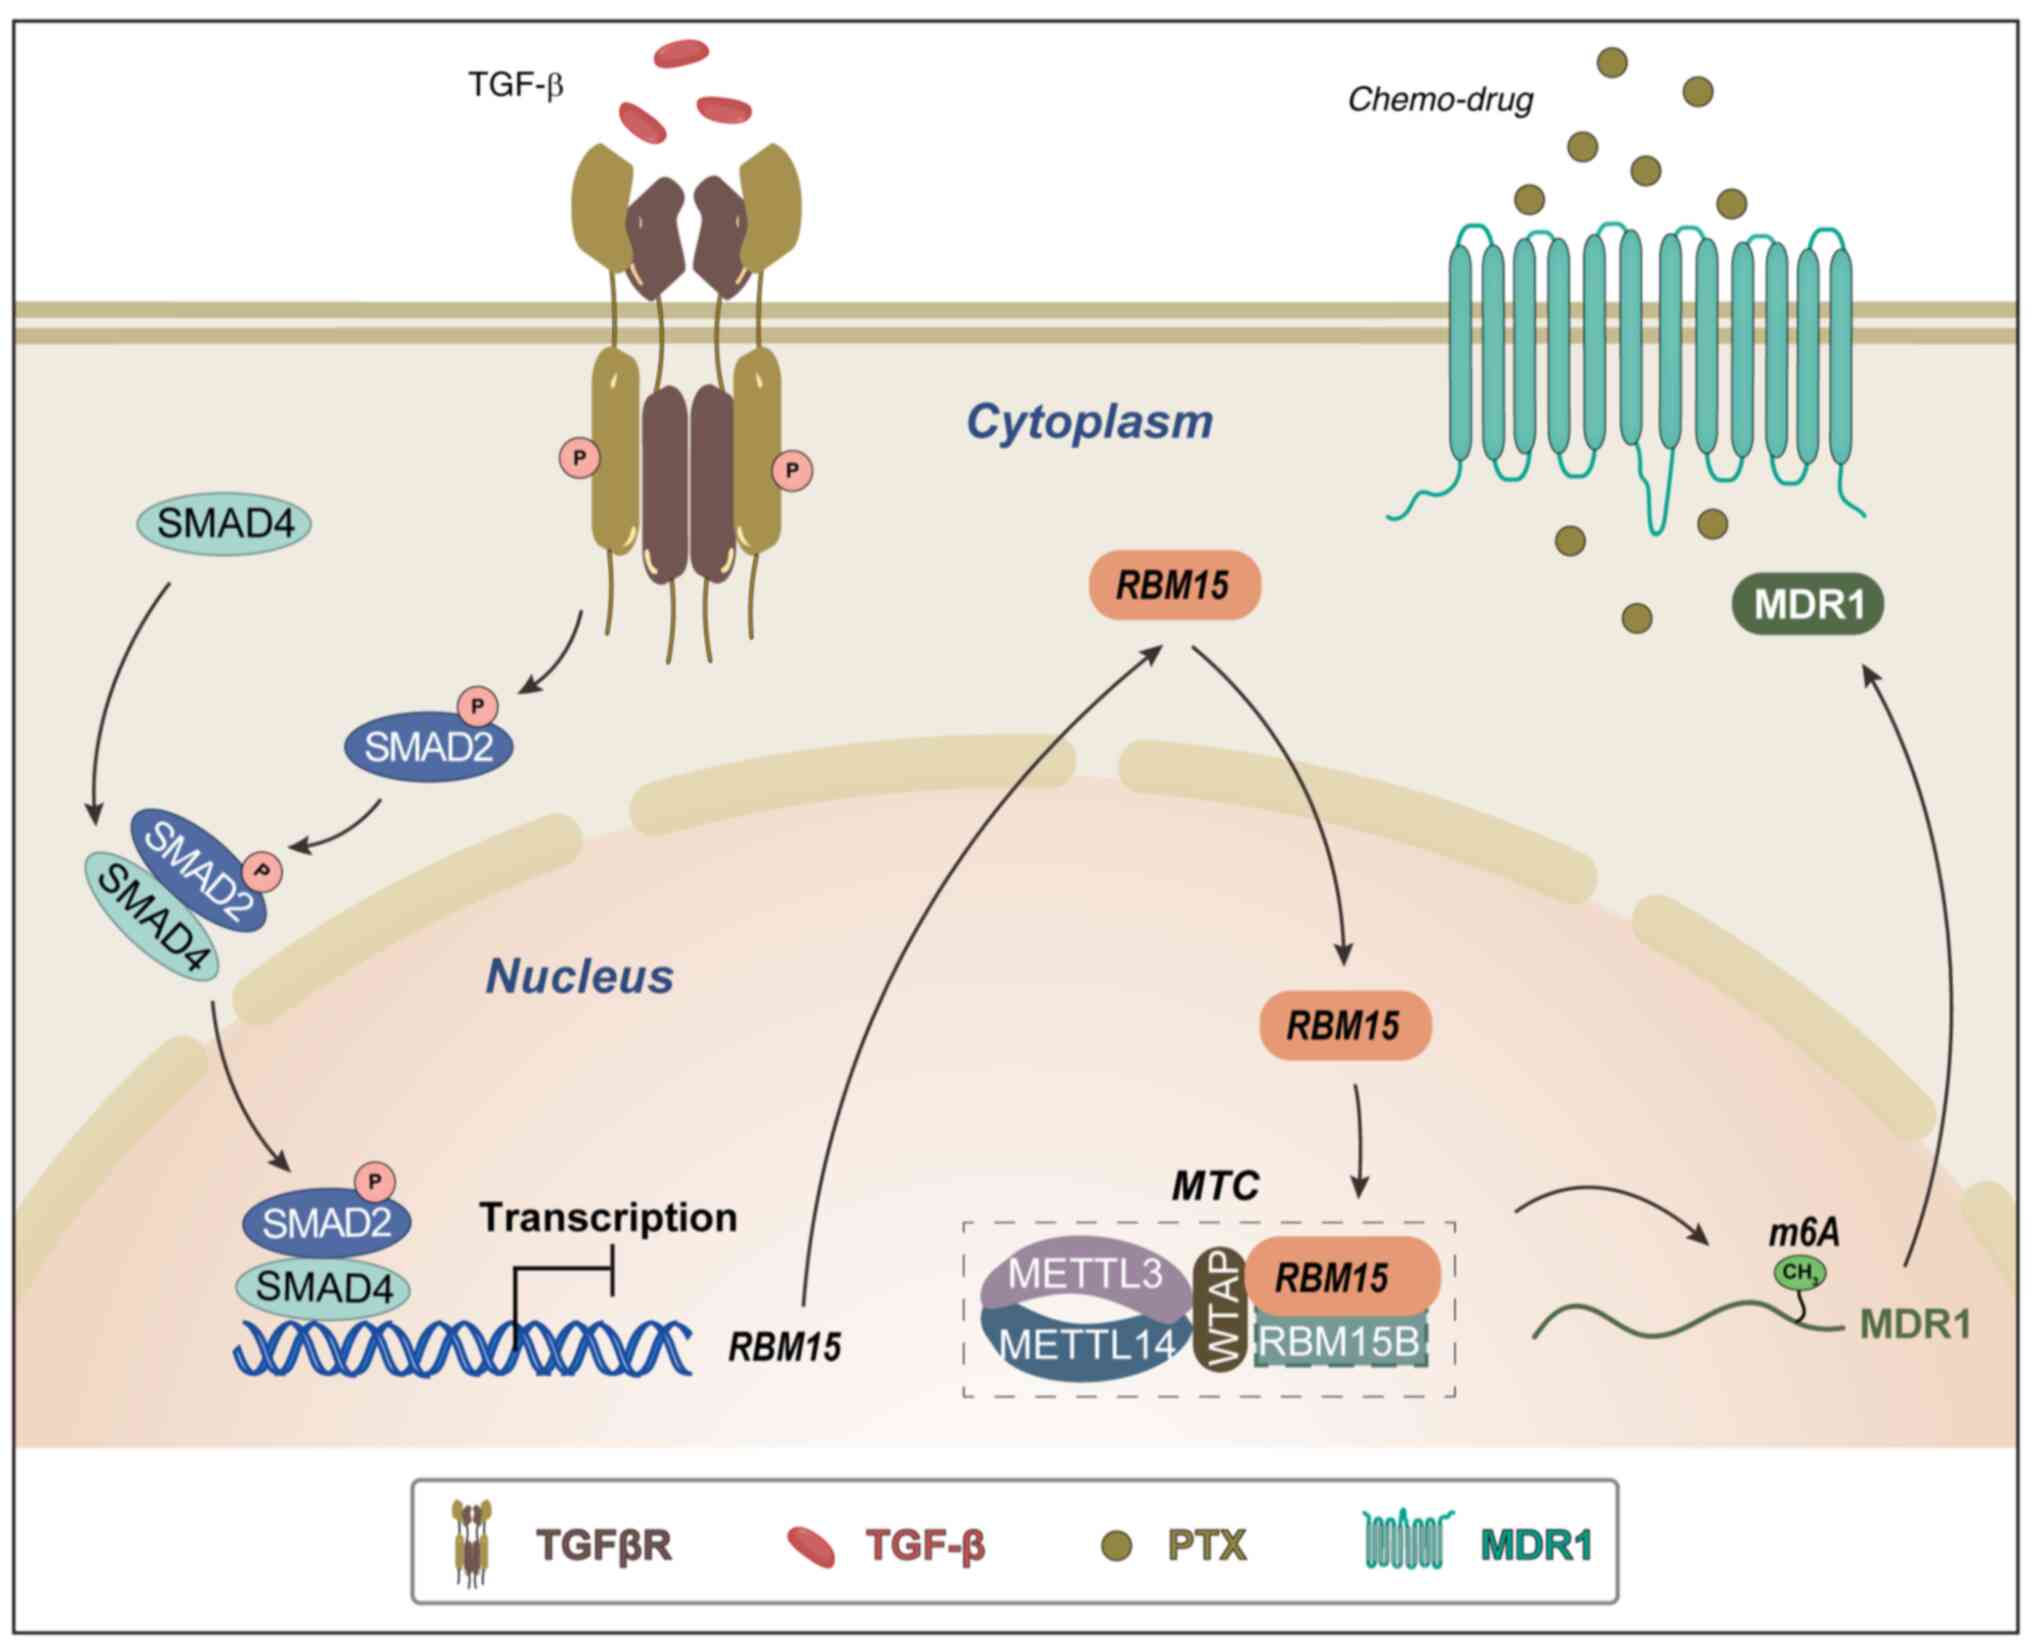
In conclusion, RBM15 was upregulated in OC tissues
and PTX-resistant cells. High expression of RBM15 was associated
with poor prognosis in OC patients. Silencing of RBM15
downregulated the expression MDR1 by decreasing MDR1 mRNA
m6A methylation. The TGF-β signaling pathway activates
and phosphorylates Smad2, which directly binds to RBM15 on its
promoter, thereby suppressing RBM15 expression. These findings
revealed RBM15 as a tissue biomarker for OC and PTX resistance and
a TGF-β/RBM15/MDR1 regulatory mechanism. Targeting RBM15 may
provide a novel therapeutic strategy for the treatment of
PTX-resistant OC (Fig. 7).
Supplementary Data
Availability of data and materials
The datasets used and/or analyzed during the
current study are available from the corresponding author on
reasonable request.
Authors' contributions
JY contributed to experimental performance, data
analyses, figure preparation and manuscript drafts. WG contributed
to the design of the siRNA and qPCR primers and data analysis. XL,
FW and HL contributed to the cell culture, bioinformatics analysis
and validation. GX contributed to the supervision,
conceptualization and project administration and wrote and edited
the final manuscript. JY, WG and GX confirm the authenticity of all
the raw data. All authors contributed to the manuscript and
approved the final version.
Ethics approval and consent to
participate
The ethical approval for human subjects was
approved by the Ethics Committee of Jinshan Hospital (approval no.
JYLLKY-2019-01-01) and was approved by the Ethics Committee of the
Shanghai Outdo Biotech Company (approval no. TRLL-2020-035-01).
Animal studies were approved by the Laboratory Animal Welfare and
Ethics Committee of the Shanghai Public Health Clinical Center
(approval no. GWLL2020-A0270-01).
Patient consent for publication
Not applicable.
Competing interests
The authors declare that they have no competing
interests.
Authors' information
Professor Guoxiong Xu ORCID:
0000-0002-9074-8754.
Acknowledgments
The authors thank Dr Jiming Shi (Jinshan Hospital
of Fudan University) for the pathological evaluation.
Funding
The present study was supported by grants from the National
Natural Science Foundation of China (grant no. 81872121) and the
Science and Technology Commission of Shanghai Municipality (grant
no. 23ZR1408900) to GX.
Abbreviations:
|
CCC
|
clear cell carcinoma
|
|
CSCs
|
cancer stem cells
|
|
DFS
|
disease-free survival
|
|
EC
|
endometrioid carcinoma
|
|
HGSC
|
high-grade serous carcinoma
|
|
IP
|
immunoprecipitation
|
|
LGSC
|
low-grade serous carcinoma
|
|
IC50
|
the half-maximal inhibitory
concentration
|
|
IHC
|
immunohistochemistry
|
|
MDR1
|
multidrug resistance 1
|
|
MeRIP
|
methylated RNA
immunoprecipitation
|
|
OC
|
ovarian cancer
|
|
OS
|
overall survival
|
|
PBS
|
phosphate-buffered saline
|
|
PFA
|
paraformaldehyde
|
|
PFS
|
progression-free survival
|
|
PTX
|
paclitaxel
|
|
RT-qPCR
|
reverse transcription-quantitative
PCR
|
|
RBM15
|
RNA binding motif protein 15
|
|
RT
|
reverse transcription
|
|
SBE
|
Smad binding element
|
|
shRNA
|
short hairpin RNA
|
|
siRNA
|
small interfering RNA
|
|
TSS
|
transcriptional start site
|
References
|
1
|
Siegel RL, Miller KD, Fuchs HE and Jemal
A: Cancer statistics, 2022. CA Cancer J Clin. 72:7–33. 2022.
View Article : Google Scholar : PubMed/NCBI
|
|
2
|
Lheureux S, Braunstein M and Oza AM:
Epithelial ovarian cancer: Evolution of management in the era of
precision medicine. CA Cancer J Clin. 69:280–304. 2019.PubMed/NCBI
|
|
3
|
Lheureux S, Gourley C, Vergote I and Oza
AM: Epithelial ovarian cancer. Lancet. 393:1240–1253. 2019.
View Article : Google Scholar : PubMed/NCBI
|
|
4
|
Ramos A, Sadeghi S and Tabatabaeian H:
Battling chemoresistance in cancer: Root causes and strategies to
uproot them. Int J Mol Sci. 22:94512021. View Article : Google Scholar : PubMed/NCBI
|
|
5
|
Hrycyna CA: Molecular genetic analysis and
biochemical characterization of mammalian P-glycoproteins involved
in multidrug resistance. Semin Cell Dev Biol. 12:247–256. 2001.
View Article : Google Scholar : PubMed/NCBI
|
|
6
|
Ahmed N, Escalona R, Leung D, Chan E and
Kannourakis G: Tumour microenvironment and metabolic plasticity in
cancer and cancer stem cells: Perspectives on metabolic and immune
regulatory signatures in chemoresistant ovarian cancer stem cells.
Semin Cancer Biol. 53:265–281. 2018. View Article : Google Scholar : PubMed/NCBI
|
|
7
|
Wang F, Zhang L, Liu J, Zhang J and Xu G:
Highly expressed STAT1 contributes to the suppression of stemness
properties in human paclitaxel-resistant ovarian cancer cells.
Aging (Albany NY). 12:11042–11060. 2020. View Article : Google Scholar : PubMed/NCBI
|
|
8
|
Foster R, Buckanovich RJ and Rueda BR:
Ovarian cancer stem cells: Working towards the root of stemness.
Cancer Lett. 338:147–157. 2013. View Article : Google Scholar
|
|
9
|
Garson K and Vanderhyden BC: Epithelial
ovarian cancer stem cells: Underlying complexity of a simple
paradigm. Reproduction. 149:R59–R70. 2015. View Article : Google Scholar
|
|
10
|
Gerardo-Ramirez M, Keggenhoff FL, Giam V,
Becker D, Groth M, Hartmann N, Straub BK, Morrison H, Galle PR,
Marquardt JU, et al: CD44 contributes to the regulation of MDR1
protein and doxorubicin chemoresistance in osteosarcoma. Int J Mol
Sci. 23:86162022. View Article : Google Scholar : PubMed/NCBI
|
|
11
|
Zaccara S, Ries RJ and Jaffrey SR:
Reading, writing and erasing mRNA methylation. Nat Rev Mol Cell
Biol. 20:608–624. 2019. View Article : Google Scholar
|
|
12
|
Lan Q, Liu PY, Bell JL, Wang JY,
Hüttelmaier S, Zhang XD, Zhang L and Liu T: The emerging roles of
RNA m6A methylation and demethylation as critical
regulators of tumorigenesis, drug sensitivity, and resistance.
Cancer Res. 81:3431–3440. 2021. View Article : Google Scholar : PubMed/NCBI
|
|
13
|
Hiriart E, Gruffat H, Buisson M, Mikaelian
I, Keppler S, Meresse P, Mercher T, Bernard OA, Sergeant A and
Manet E: Interaction of the Epstein-Barr virus mRNA export factor
EB2 with human Spen proteins SHARP, OTT1, and a novel member of the
family, OTT3, links Spen proteins with splicing regulation and mRNA
export. J Biol Chem. 280:36935–36945. 2005. View Article : Google Scholar : PubMed/NCBI
|
|
14
|
Yang Y, Hsu PJ, Chen YS and Yang YG:
Dynamic transcriptomic m6A decoration: writers, erasers,
readers and functions in RNA metabolism. Cell Res. 28:616–624.
2018. View Article : Google Scholar :
|
|
15
|
Yang F, Liu Y, Xiao J, Li B, Chen Y, Hu A,
Zeng J, Liu Z and Liu H: Circ-CTNNB1 drives aerobic glycolysis and
osteosarcoma progression via m6A modification through interacting
with RBM15. Cell Prolif. 56:e133442023. View Article : Google Scholar
|
|
16
|
Wang X, Tian L, Li Y, Wang J, Yan B, Yang
L, Li Q, Zhao R, Liu M, Wang P and Sun Y: RBM15 facilitates
laryngeal squamous cell carcinoma progression by regulating TMBIM6
stability through IGF2BP3 dependent. J Exp Clin Cancer Res.
40:802021. View Article : Google Scholar : PubMed/NCBI
|
|
17
|
Zhao Z, Ju Q, Ji J, Li Y and Zhao Y:
N6-methyladenosine methylation regulator RBM15 is a potential
prognostic biomarker and promotes cell proliferation in pancreatic
adenocarcinoma. Front Mol Biosci. 9:8428332022. View Article : Google Scholar : PubMed/NCBI
|
|
18
|
Wang H, Zhao X and Lu Z: m6A
RNA methylation regulators act as potential prognostic biomarkers
in lung adenocarcinoma. Front Genet. 12:6222332021. View Article : Google Scholar
|
|
19
|
Jang KH, Heras CR and Lee G:
m6A in the signal transduction network. Mol Cells.
45:435–443. 2022. View Article : Google Scholar : PubMed/NCBI
|
|
20
|
Kwok AL, Wong OG, Wong ES, Tsun OK, Chan
KK and Cheung AN: Caution over use of ES2 as a model of ovarian
clear cell carcinoma. J Clin Pathol. 67:921–922. 2014. View Article : Google Scholar
|
|
21
|
Zhang J, Guan W, Xu X, Wang F, Li X and Xu
G: A novel homeostatic loop of sorcin drives paclitaxel-resistance
and malignant progression via Smad4/ZEB1/miR-142-5p in human
ovarian cancer. Oncogene. 40:4906–4918. 2021. View Article : Google Scholar : PubMed/NCBI
|
|
22
|
Livak KJ and Schmittgen TD: Analysis of
relative gene expression data using real-time quantitative PCR and
the 2(-Delta Delta C(T)) method. Methods. 25:402–408. 2001.
View Article : Google Scholar
|
|
23
|
Zhang L, Zhou D, Guan W, Ren W, Sun W, Shi
J, Lin Q, Zhang J, Qiao T, Ye Y, et al: Pyridoxine 5'-phosphate
oxidase is a novel therapeutic target and regulated by the TGF-β
signalling pathway in epithelial ovarian cancer. Cell Death Dis.
8:32142017. View Article : Google Scholar
|
|
24
|
Edgar R, Domrachev M and Lash AE: Gene
expression omnibus: NCBI gene expression and hybridization array
data repository. Nucleic Acids Res. 30:207–210. 2002. View Article : Google Scholar :
|
|
25
|
Ritchie ME, Phipson B, Wu D, Hu Y, Law CW,
Shi W and Smyth GK: limma powers differential expression analyses
for RNA-sequencing and microarray studies. Nucleic Acids Res.
43:e472015. View Article : Google Scholar : PubMed/NCBI
|
|
26
|
Chandrashekar DS, Bashel B, Balasubramanya
SAH, Creighton CJ, Ponce-Rodriguez I, Chakravarthi BVSK and
Varambally S: UALCAN: A portal for facilitating tumor subgroup gene
expression and survival analyses. Neoplasia. 19:649–658. 2017.
View Article : Google Scholar : PubMed/NCBI
|
|
27
|
Yu G, Wang LG, Han Y and He QY:
clusterProfiler: An R package for comparing biological themes among
gene clusters. OMICS. 16:284–287. 2012. View Article : Google Scholar : PubMed/NCBI
|
|
28
|
Gyorffy B, Lánczky A and Szállási Z:
Implementing an online tool for genome-wide validation of
survival-associated biomarkers in ovarian-cancer using microarray
data from 1287 patients. Endocr Relat Cancer. 19:197–208. 2012.
View Article : Google Scholar : PubMed/NCBI
|
|
29
|
Tang Z, Li C, Kang B, Gao G, Li C and
Zhang Z: GEPIA: A web server for cancer and normal gene expression
profiling and interactive analyses. Nucleic Acids Res. 45(W1):
W98–W102. 2017. View Article : Google Scholar : PubMed/NCBI
|
|
30
|
Geeleher P, Cox N and Huang RS:
pRRophetic: An R package for prediction of clinical
chemotherapeutic response from tumor gene expression levels. PLoS
One. 9:e1074682014. View Article : Google Scholar : PubMed/NCBI
|
|
31
|
Zhou Y, Zeng P, Li YH, Zhang Z and Cui Q:
SRAMP: Prediction of mammalian N6-methyladenosine (m6A) sites based
on sequence-derived features. Nucleic Acids Res. 44:e912016.
View Article : Google Scholar : PubMed/NCBI
|
|
32
|
Castro-Mondragon JA, Riudavets-Puig R,
Rauluseviciute I, Lemma RB, Turchi L, Blanc-Mathieu R, Lucas J,
Boddie P, Khan A, Manosalva Pérez N, et al: JASPAR 2022: The 9th
release of the open-access database of transcription factor binding
profiles. Nucleic Acids Res. 50(D1): D165–D173. 2022. View Article : Google Scholar :
|
|
33
|
Bowen NJ, Walker LD, Matyunina LV, Logani
S, Totten KA, Benigno BB and McDonald JF: Gene expression profiling
supports the hypothesis that human ovarian surface epithelia are
multipotent and capable of serving as ovarian cancer initiating
cells. BMC Med Genomics. 2:712009. View Article : Google Scholar : PubMed/NCBI
|
|
34
|
Yoshihara K, Tajima A, Komata D, Yamamoto
T, Kodama S, Fujiwara H, Suzuki M, Onishi Y, Hatae M, Sueyoshi K,
et al: Gene expression profiling of advanced-stage serous ovarian
cancers distinguishes novel subclasses and implicates ZEB2 in tumor
progression and prognosis. Cancer Sci. 100:1421–1428. 2009.
View Article : Google Scholar : PubMed/NCBI
|
|
35
|
Dong H, Zhang H, Mao X, Liu S, Xu W and
Zhang Y: RBM15 promates the proliferation, migration and invasion
of pancreatic cancer cell lines. Cancers (Basel). 15:10842023.
View Article : Google Scholar : PubMed/NCBI
|
|
36
|
Zeng X, Chen K, Li L, Tian J, Ruan W, Hu
Z, Peng D and Chen Z: Epigenetic activation of RBM15 promotes clear
cell renal cell carcinoma growth, metastasis and macrophage
infiltration by regulating the m6A modification of CXCL11. Free
Radic Biol Med. 184:135–147. 2022. View Article : Google Scholar : PubMed/NCBI
|
|
37
|
Ayob AZ and Ramasamy TS: Cancer stem cells
as key drivers of tumour progression. J Biomed Sci. 25:202018.
View Article : Google Scholar : PubMed/NCBI
|
|
38
|
Abdullah LN and Chow EKH: Mechanisms of
chemoresistance in cancer stem cells. Clin Transl Med. 2:32013.
View Article : Google Scholar : PubMed/NCBI
|
|
39
|
Elzarkaa AA, Sabaa BE, Abdelkhalik D,
Mansour H, Melis M, Shaalan W, Farouk M, Malik E and Soliman AA:
Clinical relevance of CD44 surface expression in advanced stage
serous epithelial ovarian cancer: A prospective study. J Cancer Res
Clin Oncol. 142:949–958. 2016. View Article : Google Scholar : PubMed/NCBI
|
|
40
|
Gao Y, Foster R, Yang X, Feng Y, Shen JK,
Mankin HJ, Hornicek FJ, Amiji MM and Duan Z: Up-regulation of CD44
in the development of metastasis, recurrence and drug resistance of
ovarian cancer. Oncotarget. 6:9313–9326. 2015. View Article : Google Scholar : PubMed/NCBI
|
|
41
|
Cai X, Chen Y, Man D, Yang B, Feng X,
Zhang D, Chen J and Wu J: RBM15 promotes hepatocellular carcinoma
progression by regulating N6-methyladenosine modification of YES1
mRNA in an IGF2BP1-dependent manner. Cell Death Discov. 7:3152021.
View Article : Google Scholar : PubMed/NCBI
|
|
42
|
Fang J, Wu X, He J, Zhang H, Chen X, Zhang
H, Novakovic B, Qi H and Yu X: RBM15 suppresses hepatic insulin
sensitivity of offspring of gestational diabetes mellitus mice via
m6A-mediated regulation of CLDN4. Mol Med. 29:232023. View Article : Google Scholar : PubMed/NCBI
|
|
43
|
Takara K, Sakaeda T and Okumura K: An
update on overcoming MDR1-mediated multidrug resistance in cancer
chemotherapy. Curr Pharm Des. 12:273–286. 2006. View Article : Google Scholar : PubMed/NCBI
|
|
44
|
Huang W, Yang S, Cheng YS, Sima N, Sun W,
Shen M, Braisted JC, Lu W and Zheng W: Terfenadine resensitizes
doxorubicin activity in drug-resistant ovarian cancer cells via an
inhibition of CaMKII/CREB1 mediated ABCB1 expression. Front Oncol.
12:10684432022. View Article : Google Scholar : PubMed/NCBI
|
|
45
|
Su S, Sun X, Zhang Q, Zhang Z and Chen J:
CCL20 promotes ovarian cancer chemotherapy resistance by regulating
ABCB1 expression. Cell Struct Funct. 44:21–28. 2019. View Article : Google Scholar : PubMed/NCBI
|
|
46
|
Vaidyanathan A, Sawers L, Gannon AL,
Chakravarty P, Scott AL, Bray SE, Ferguson MJ and Smith G: ABCB1
(MDR1) induction defines a common resistance mechanism in
paclitaxeland olaparib-resistant ovarian cancer cells. Br J Cancer.
115:431–441. 2016. View Article : Google Scholar : PubMed/NCBI
|
|
47
|
Wang T, Kong S, Tao M and Ju S: The
potential role of RNA N6-methyladenosine in Cancer progression. Mol
Cancer. 19:882020. View Article : Google Scholar : PubMed/NCBI
|
|
48
|
Ikushima H and Miyazono K: TGFbeta
signalling: A complex web in cancer progression. Nat Rev Cancer.
10:415–424. 2010. View Article : Google Scholar : PubMed/NCBI
|
|
49
|
Katsuno Y, Meyer DS, Zhang Z, Shokat KM,
Akhurst RJ, Miyazono K and Derynck R: Chronic TGF-β exposure drives
stabilized EMT, tumor stemness, and cancer drug resistance with
vulnerability to bitopic mTOR inhibition. Sci Signal.
12:eaau85442019. View Article : Google Scholar
|