Introduction
Acute promyelocytic leukemia (APL) is identified as
the M3 subtype of acute myeloid leukemia (AML) and it appears to be
the most malignant form of AML, characterized by a severe bleeding
tendency and a fatal course of only weeks. Cytogenetically, a
specific chromosome translocation, t(15;17)(q22;q21), occurs in
more than 95% of APL patients which results in the rearrangement of
the promyelocytic leukemia (PML) and retinoic acid receptor α
(RARα) genes and the expression of PML-RARα chimeric protein
(1,2). The frontline treatment for APL is
chemotherapy, including the use of anthracycline and cytosine
arabinoside, with a complete remission (CR) rate of 75 to 80% in
newly diagnosed patients. The use of arsenic trioxide (ATO) from
the early 1990s has further improved the clinical outcome of
refractory or relapsed APL, as well as newly diagnosed APL
(3,4). NB4, a maturation inducible cell line
with a t(15;17) marker, is the cell model most commonly used in APL
research (5).
Following genomics and transcriptomics, proteomics
is considered to be the next step in the study of biological
systems (6). Proteomics is the
large-scale study of proteins, particularly their structures and
functions (7). One of the most
promising developments to come from the study of human proteins has
been the identification of potential new drugs for the treatment of
disease (8). This relies on
proteomic information to identify proteins associated with a
disease, which computer software may then use as targets in the
design of new drugs (8). A
proteome is the entire set of proteins expressed by a genome, cell,
tissue or organism. More specifically, it is the set of expressed
proteins in a given type of cell or organism at a given time under
defined conditions (9–11). Proteomics, the study of the
proteome, has largely been practiced through the separation of
proteins by two-dimensional gel electrophoresis (2-DE) (12,13).
In the first dimension, the proteins are separated by isoelectric
focusing (IEF), which resolves proteins on the basis of charge. In
the second dimension, proteins are separated by molecular weight
using SDS-PAGE. The gel is dyed with Coomassie Brilliant Blue or
silver to visualize the proteins. Spots on the gel are proteins
that have migrated to specific locations. The mass spectrometer has
augmented proteomics (14,15). Peptide mass fingerprinting (PMF)
involves identifying a protein by cleaving it into short peptides
and then deducing the protein’s identity by matching the observed
peptide masses against a sequence database (16,17).
Tandem mass spectrometry, however, is able to obtain sequence
information from individual peptides by isolating them, colliding
them with a non-reactive gas and then cataloging the fragments
produced (18,19).
However, due to the high variability of protein
expression, certain conditions, including the lysis solution
formula, protein preparation method and volume of protein sample,
may be suitable for one sample but not be the best choice for
another. Therefore, establishing and optimizing the 2-DE technology
to suit our particular research objectives became the key challenge
of our proteomics study.
Materials and methods
Cell culture
The NB4 cell line was received as a gift from the
Shanghai Institute of Hematology, Ruijin Hospital. The cells
(1×10⁶/ml) were inoculated in RPMI-1640 medium
(Invitrogen, Carlsbad, CA, USA) with 10% heated-fetal bovine serum
(Gibco-BRL, Carlsbad, CA, USA) in a humidified incubator containing
5% CO2 and 95% air at 37°C.
Preparation of protein samples
Frozen cells were removed from liquid nitrogen and
equilibrated for 10 min at room temperature, then dissolved in
lysis buffer (100 μl per 107 cells) containing 40 mmol/l
Tris, 7 mol/l urea, 2 mol/l thiourea, 4% CHAPS, 1% dithiothreitol
(DTT), 1 mmol/l EDTA, 0.1 mg/ml RNase A, 0.1 mg/ml DNase and 1X
protease inhibitor cocktail. The cell precipitate was resuspended
and oscillated by vortex for ~1–2 min, then frozen and thawed 3
times, with the additional use of ultrasound for improved
solubilization. Following centrifugation at 14,000 rpm for 30 min
at 4°C, the supernatant was used as the 2-DE sample and the protein
concentration was determined using the Bradford assay kit (Bio-Rad,
Hercules, CA, USA). The protein samples were stored in aliquots and
frozen at −80°C until use.
2-DE
Analysis using 2-DE was performed as described by
Görg et al (20). IEF was
carried out using commercial immobilized pH gradient (IPG) dry
strips (18 cm, pH 3.0–10.0 nonlinear; Amersham Pharmacia Biotech)
which were rehydrated for 12 h at 20°C in the presence of 140, 160
and 180 μg protein lysate, respectively. The proteins were then
focused using the IPGphor system (Amersham Pharmacia Biotech)
according to the manufacturer’s instructions. Following IEF, the
strips were equilibrated twice for 15 min in equilibration buffer
containing 6 mol/l urea, 30% glycerol and 2% SDS in 50 mmol/l
Tris-HCl buffer (pH 8.8) supplemented with 65 mmol/l DTT for the
first treatment and 259 mmol/l iodoacetamide for the second
treatment. Second-dimension SDS-PAGE was carried out using a
Protean II cell (Bio-Rad) with a 13% SDS-polyacrylamide gel at a
constant current of 20 mA/gel for the first 40 min and 30 mA/gel
thereafter until the bromophenol blue dye marker reached the bottom
of the gel. Each sample was run 3 times. Silver nitrate staining,
according to the method of Pasquali et al (21), and Coomassie Brilliant Blue R-250
(0.25% Brilliant Blue) staining was used for the analytical and
micropreparative gels, respectively. For differential analysis, the
gels were scanned using an ImageScanner and analyzed using
ImageMaster™ 4.01 software (both from Amersham Pharmacia). Only
variations above 2 were considered as lower variations were not
reproducible.
In-gel digestion and extraction of
peptides
Firstly, the proteomics of the NB4 cells at various
times were established by silver nitrate-staining. The
differentially expressed protein spots were screened using image
analysis software and artificially compared. Protein samples (1.2
mg) were then obtained for 2-DE electrophoresis and dyeing by
Coomassie Brilliant Blue. The corresponding differential protein
spots were identified, cut, decolorized and in-gel digested and the
peptides were extracted according to the Themo Finnigan operation
process.
PMF by matrix-assisted laser
desorption/ionization time of flight-mass spectrometry
(MALDI-TOF-MS)
Following the matching of the micropreparative gel
images and in-gel digestion, 1 μl sample solution and an equal
volume of the saturated matrix solution were mixed and applied to
the target plate. All mass spectra were obtained using a Bruker
Reflex III MALDI-TOF-MS (Bruker-Franzen, Bremen, Germany) in
positive ion mode at an accelerating voltage of 20 kV. Monoisotopic
peptide masses were used to search the database, allowing a peptide
mass accuracy of 0.3 Da and one partial cleavage. Oxidation of
methionine and carbamidomethyl modification of cysteine were
considered. The obtained peptide mass fingerprints were used to
search through the SWISS-PROT and NCBInr databases using the Mascot
search engine. Protein identification was repeated at least once
with spots from separate gels.
Further confirmation by electrospray
ionization tandem mass spectrometry (ESI-MS/MS)
Certain spots, which we thought significant or for
which we could not obtain confirmed results through searching of
the SWISS-PROT or NCBInr databases, were further investigated by
ESI-MS/MS using a quadrupole-time of flight 2 (Q-TOF2) hybrid
quadrupole/TOF mass spectrometer (Micromass, Manchester, UK) with a
nanoflow Z-spray source. The mass spectrometer was operated in the
positive ion mode with a source temperature of 80°C and a potential
of 800–1,000 V applied to the Nanospray probe. The database search
was carried out using the Mascot search engine with a Mascot MS/MS
ion search. In addition, the amino acid sequences of the peptides
were deduced using the peptide sequencing program MasSeq.
Statistical analysis
The results are the mean ± standard deviations (SD)
of 3 experiments performed in duplicate. Statistical analysis was
carried out by the Student’s test or one-way analysis of variance
(ANOVA) using SPSS software 17.0. The Newman-Keuls test was used
for the identification of statistically significant differences in
spot vol% among samples. P<0.05 was considered to indicate a
statistically significant result.
Results
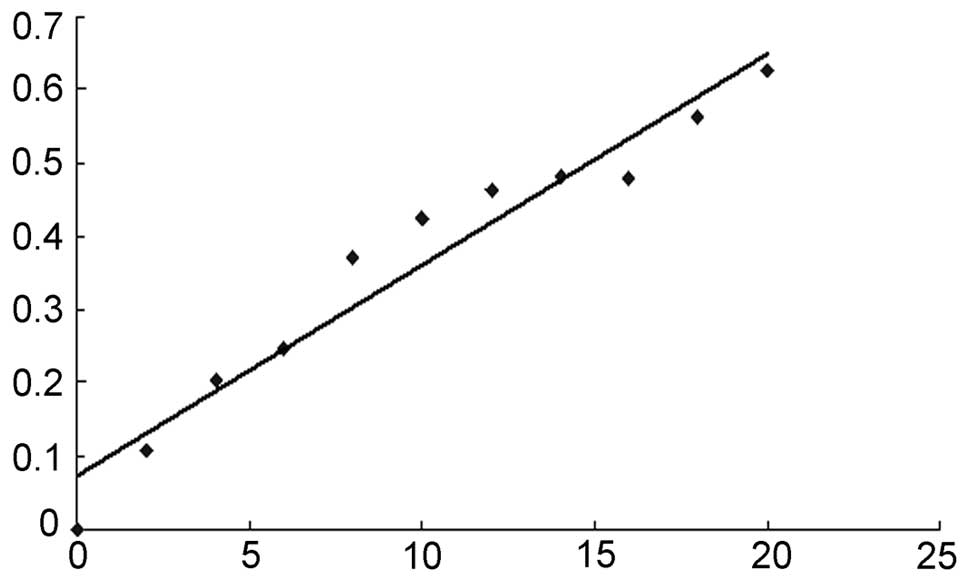
Protein quantitation
The Bradford assay data were used to draw a standard
curve for protein quantitation (Fig.
1). The linear equation was calculated to be: y = 0.0288x +
0.0726. The protein concentration of our sample was 11.83
mg/ml.
Proteome expression maps of NB4
cells
Proteome expression maps of the NB4 cells were
generated by 2-DE. We detected 1160±51 protein spots on the
silver-stained gel using ImageMaster™ 2D Platinum software and
manual clear-up. Approximately 96.3% of all spots were matched and
had no significant change in intensity on duplicate gels. All maps
demonstrated considerable similarity in their protein expression
patterns; the 2-DE fingerprint matching rate of the same cell
samples in separate batches was 81%. The spots were distributed in
the greatest density at isoelectric points of 4–9 and relative
molecular masses of 14–66 kDa (Fig.
2).
Effect of variations in protein sample
size on the 2-DE mapping of NB4 cells
In order to confirm the optimum quantity of protein
for use in the 2-DE mapping of NB4 cells, we compared and analyzed
the effects of various protein sample sizes (140, 160 and 180 μg)
on the 2-DE maps. When 140 μg protein was used, some of the protein
spots appeared unclear or lost, and when the sample size was 180
μg, some of the spots appeared agglutinated or sedimented. The
protein spots were clearest when a 160 μg sample size was used
(Fig. 3).
Identification of proteins: MALDI-TOF-MS,
MALDI-TOF/TOF and UPLC-MS/MS analysis
We identified 10 proteins by mass spectrometry and
database queries. Some of these were products of oncogenes and
others were involved in cell cycle regulation and signal
transduction (Table I).
 | Table IIdentification of proteins:
MALDI-TOF-MS, MALDI-TOF/TOF and UPLC-MS/MS analysis. |
Table I
Identification of proteins:
MALDI-TOF-MS, MALDI-TOF/TOF and UPLC-MS/MS analysis.
| Spot | Protein | NCBInr ID no. | Mw (Da) | pI | Peptides
(MALDI/MS) | Sequence coverage
(%) | Score |
|---|
|
|
|
|---|
| Theor. | Observ. | Theor. | Observ. | Match | Total |
|---|
| M160-1 | CRP55 | gi|4757900 | 48,245 | 41,610 | 4.33 | 3.73 | 8 | 16 | 23 | 95 |
| M160-2 | CRT | gi|1905911 | 48,112 | 19,441 | 5.26 | 6.49 | 9 | 22 | 51 | 91 |
| M160-2 | HSP70 | gi|52783267 | 70,854 | 19,823 | 5.37 | 7.07 | 11 | 18 | 19 | 81 |
| M160-2 | HMGB1 | gi|25090900 | 24,878 | 14,841 | 5.62 | 5.00 | 7 | 20 | 33 | 70 |
| M160-2 | RanGAP1 | gi|62911375 | 23,439 | 27,647 | 5.21 | 5.25 | 6 | 17 | 30 | 76 |
| M160-2 | PGM 1 | gi|10177166 | 28,786 | 26,711 | 6.64 | 5.93 | 11 | 29 | 51 | 119 |
| M160-2 | EF-1-β | gi|18203449 | 24,748 | 32,071 | 4.50 | 4.38 | 6 | 13 | 37 | 70 |
| M160-2 | cofilin 1 | gi|37496526 | 18,491 | 19,179 | 8.22 | 8.51 | 10 | 23 | 53 | 101 |
| M160-2 | TM | gi|66808019 | 28,938 | 33,947 | 4.79 | 4.70 | 12 | 25 | 28 | 137 |
| M160-2 | P4H | gi|46095107 | 57,081 | 59,783 | 4.76 | 4.67 | 14 | 19 | 37 | 176 |
Discussion
Proteomics is a new research field of the
post-genomic era, and its aim is the study of the expression and
functions of all proteins in cells, tissues and organisms.
Proteomic studies enable us to understand vital processes (22,23).
There are three pivotal technologies involved in proteomics: 2-DE,
mass spectrometric analysis and bioinformatic analysis (24). Therefore, the analytical procedure
is usually divided into three steps: firstly, the separation of
proteins from samples by 2-DE; secondly, the identification of the
isolated proteins by mass spectrometry, and finally the storing,
handling and comparison of data relating to proteins by
bioinformatic analysis. Proteomics is rapidly developing and has
become a research hotspot in the field of life science. therefore,
how to get 2-DE maps with high resolution, high throughput and high
reproducibility is the main bottleneck of proteomic technology
development. Although the invention of IPG adhesive strips has
greatly improved the reproducibility of the separation of proteins
by 2-DE, there are numerous persistently complicating factors that
had to be mastered as we established a 2-DE technology that was
suitable for our particular research objectives (25). Therefore, in the current study we
optimized each technical link of the proteomics technology in order
to explore the optimum conditions for establishing a 2-DE map of
NB4 cells.
Protein sample preparation is the first step in the
2-DE process; it is also the promoter of the technical system.
Therefore, the quality of the protein preparation is likely to
directly affect the effectiveness of 2-DE and determine the
accuracy and comprehensiveness of the final results. NB4 is a
suspension cell line. We followed the basic principles of protein
sample preparation and referred to the related literature (26) for filtered cells and extracted
proteins. We added the protease inhibitor to a lysis solution and
used repeated liquid nitrogen freeze-thawing to improve protein
solubility prior to total protein extraction. Ultrasound and
nucleic acid enzymes were additionally applied to remove the
influence of nucleic acid contaminants. Following centrifugation at
14,000 rpm for 30 min at 4°C, the impact of lipids and
polysaccharides were minimized as well.
Protein sample size in IEF directly affects the 2-DE
spectrum resolution and reproducibility (27,28).
When the sample size was too small, some of the protein spots
appeared unclear or lost, while when the sample size was too large,
some of the spots appeared agglutinated or sedimented. In our
study, when a 160 μg protein sample was used, the protein spots
appeared comprehensive and clear. Moreover, the parameter settings
of the IPGphor IEF and the SDS-PAGE vertical electrophoresis
apparatus (29), the distribution
of the acrylamide gel, the closeness of the contact between the IPG
strip and the SDS-PAGE gel during electrophoretic transfer, dyeing
methods and other factors also impact 2-DE mapping results
(30).
Using these protein sample preparation, 2-DE, gel
staining and scanning and image analysis methods and a series of
other standardized operations, we obtained high resolution,
reproducible 2-DE maps of the NB4 cells and successfully identified
10 differentially expressed protein spots, setting up a study
platform for the NB4 cell proteome. Furthermore, this experiment
not only provides useful information for further analysis and for
building a related protein expression database, but also lays a
foundation in the search for valuable tumor markers and a
therapeutic molecular target for APL.
Acknowledgements
This study was supported by the Natural Science
Foundation of China (no. 30701133) and the Shaanxi Province Science
and Technology Development Fund of China (2010K01-135). We express
our gratitude to Dr Hongli Wang for access to the Proteome
Laboratory of the Institute of Basic Medical Sciences, National
Center of Biomedical Analysis (Beijing, China).
References
|
1
|
Gowri M, Jahan SK, Kavitha,
Prasannakumari, Madhumathi and Appaji L: Acute promyelocytic
leukemia with unusual karyotype. Indian J Hum Genet. 17:235–237.
2011. View Article : Google Scholar : PubMed/NCBI
|
|
2
|
Guo Y, Dolinko AV, Chinyengetere F, et al:
Blockade of the ubiquitin protease UBP43 destabilizes transcription
factor PML/RARα and inhibits the growth of acute promyelocytic
leukemia. Cancer Res. 70:9875–9885. 2010.PubMed/NCBI
|
|
3
|
Wang ZY and Chen Z: Acute promyelocytic
leukemia: from highly fatal to highly curable (Review). Blood.
111:2505–2515. 2008. View Article : Google Scholar : PubMed/NCBI
|
|
4
|
Kogan SC: Curing APL: differentiation or
destruction? Cancer Cell. 15:7–8. 2009. View Article : Google Scholar : PubMed/NCBI
|
|
5
|
Lanotte M, Martin-Thouvenin V, Najman S,
Balerini P, Valensi F and Berger R: NB4, a maturation inducible
cell line with t(15;17) marker isolated from a human acute
promyelocytic leukemia (M3). Blood. 77:1080–1086. 1991.PubMed/NCBI
|
|
6
|
Wilkins MR, Appel RD, Van Eyk JE, et al:
Guidelines for the next 10 years of proteomics. Proteomics. 6:4–8.
2006.PubMed/NCBI
|
|
7
|
Müller K, Job C, Belghazi M, Job D and
Leubner-Metzger G: Proteomics reveal tissue-specific features of
the cress (Lepidium sativum L.) endosperm cap proteome and
its hormone-induced changes during seed germination. Proteomics.
10:406–416. 2010.PubMed/NCBI
|
|
8
|
Abu-Farha M, Elisma F, Zhou H, et al:
Proteomics: from technology developments to biological applications
(Review). Anal Chem. 81:4585–4599. 2009. View Article : Google Scholar : PubMed/NCBI
|
|
9
|
Washburn MP, Wolters D and Yates JR III:
Large-scale analysis of the yeast proteome by multidimensional
protein identification technology. Nat Biotechnol. 19:242–247.
2001. View Article : Google Scholar : PubMed/NCBI
|
|
10
|
Anderson NL, Polanski M, Pieper R, et al:
The human plasma proteome: a nonredundant list developed by
combination of four separate sources. Mol Cell Proteomics.
3:311–326. 2004.PubMed/NCBI
|
|
11
|
Andersen JS, Lam YW, Leung AK, et al:
Nucleolar proteome dynamics. Nature. 433:77–83. 2005. View Article : Google Scholar : PubMed/NCBI
|
|
12
|
Rabilloud T: Two-dimensional gel
electrophoresis in proteomics: old, old fashioned, but it still
climbs up the mountains. Proteomics. 2:3–10. 2002. View Article : Google Scholar : PubMed/NCBI
|
|
13
|
Wilkins MR, Gasteiger E, Sanchez JC,
Bairoch A and Hochstrasser DF: Two-dimensional gel electrophoresis
for proteome projects: the effects of protein hydrophobicity and
copy number. Electrophoresis. 19:1501–1505. 1998. View Article : Google Scholar : PubMed/NCBI
|
|
14
|
Yates JR, Ruse CI and Nakorchevsky A:
Proteomics by mass spectrometry: approaches, advances, and
applications. Annu Rev Biomed Eng. 11:49–79. 2009. View Article : Google Scholar : PubMed/NCBI
|
|
15
|
Han X, Aslanian A and Yates JR III: Mass
spectrometry for proteomics. Curr Opin Chem Biol. 12:483–490. 2008.
View Article : Google Scholar
|
|
16
|
Doran P, Donoghue P, O’Connell K, Gannon J
and Ohlendieck K: Proteomic profiling of pathological and aged
skeletal muscle fibres by peptide mass fingerprinting (Review). Int
J Mol Med. 19:547–564. 2007.PubMed/NCBI
|
|
17
|
Concu R, Dea-Ayuela MA, Perez-Montoto LG,
et al: Prediction of enzyme classes from 3D structure: a general
model and examples of experimental-theoretic scoring of peptide
mass fingerprints of Leishmania proteins. J Proteome Res.
8:4372–4382. 2009. View Article : Google Scholar : PubMed/NCBI
|
|
18
|
Nesvizhskii AI, Vitek O and Aebersold R:
Analysis and validation of proteomic data generated by tandem mass
spectrometry (Review). Nat Methods. 4:787–797. 2007. View Article : Google Scholar : PubMed/NCBI
|
|
19
|
Swaney DL, McAlister GC and Coon JJ:
Decision tree-driven tandem mass spectrometry for shotgun
proteomics. Nat Methods. 5:959–964. 2008. View Article : Google Scholar : PubMed/NCBI
|
|
20
|
Görg A, Obermaier C, Boguth G, et al: The
current state of two-dimensional electrophoresis with immobilized
pH gradients (Review). Electrophoresis. 21:1037–1053. 2000.
|
|
21
|
Pasquali C, Fialka I and Huber LA:
Preparative two-dimensional gel electrophoresis of membrane
proteins. Electrophoresis. 18:2573–2581. 1997. View Article : Google Scholar : PubMed/NCBI
|
|
22
|
González-Díaz H, González-Díaz Y, Santana
L, Ubeira FM and Uriarte E: Proteomics, networks and connectivity
indices (Review). Proteomics. 8:750–778. 2008.
|
|
23
|
Hanash SM, Bobek MP, Rickman DS, et al:
Integrating cancer genomics and proteomics in the post-genome era.
Proteomics. 2:69–75. 2002. View Article : Google Scholar : PubMed/NCBI
|
|
24
|
Wittmann-Liebold B, Graack HR and Pohl T:
Two-dimensional gel electrophoresis as tool for proteomics studies
in combination with protein identification by mass spectrometry.
Proteomics. 6:4688–4703. 2006. View Article : Google Scholar : PubMed/NCBI
|
|
25
|
Gygi SP, Corthals GL, Zhang Y, Rochon Y
and Aebersold R: Evaluation of two-dimensional gel
electrophoresis-based proteome analysis technology. Proc Natl Acad
Sci USA. 97:9390–9395. 2000. View Article : Google Scholar : PubMed/NCBI
|
|
26
|
Oh-Ishi M and Maeda T: Disease proteomics
of high-molecular-mass proteins by two-dimensional gel
electrophoresis with agarose gels in the first dimension (Agarose
2-DE) (Review). J Chromatogr B Analyt Technol Biomed Life Sci.
849:211–222. 2007. View Article : Google Scholar : PubMed/NCBI
|
|
27
|
Wisniewski JR, Zougman A, Nagaraj N and
Mann M: Universal sample preparation method for proteome analysis.
Nat Methods. 6:359–362. 2009. View Article : Google Scholar : PubMed/NCBI
|
|
28
|
Isola D, Marzban G, Selbmann L, Onofri S,
Laimer M and Sterflinger K: Sample preparation and 2-DE procedure
for protein expression profiling of black microcolonial fungi.
Fungal Biol. 115:971–977. 2011. View Article : Google Scholar : PubMed/NCBI
|
|
29
|
Pluskal T, Castillo S, Villar-Briones A
and Oresic M: MZmine 2: modular framework for processing,
visualizing, and analyzing mass spectrometry-based molecular
profile data. BMC Bioinformatics. 11:3952010. View Article : Google Scholar : PubMed/NCBI
|
|
30
|
Ahmed FE: Sample preparation and
fractionation for proteome analysis and cancer biomarker discovery
by mass spectrometry (Review). J Sep Sci. 32:771–798.
2009.PubMed/NCBI
|