Introduction
Cardiomyopathy has been one of the primary causes of
mortality over the past decade; however, the mechanism underlying
the development of cardiomyopathy remains unclear. In vivo
and in vitro studies have demonstrated that multiple gene
networks, as well as factors other than blood pressure, may be
involved during the initiation of cardiac hypertrophy (1,2).
Apoptosis has been suggested to be a major contributor to heart
failure, with myocyte apoptosis observed during acute cardiac
dysfunction (3). Furthermore, the
apoptotic marker, p53, is significantly increased during cardiac
hypertrophy (4,5).
In normal cells, protein metabolism is a dynamic
process of continuous degradation and re-synthesis. The
ubiquitin-proteasome system is responsible for between 80 and 90%
of this degradation. Alterations in the ubiquitin pathway have been
reported to lead to protein metabolism disorders, which may lead to
cardiomyopathy (4,6). Weekes et al (7) proposed that abnormalities in the
ubiquitin system may cause myocardial hypertrophy and dilated
cardiomyopathy.
Ubiquitin-protein ligase E3a (Ube3a) is an ubiquitin
ligase that is responsible for recognizing target proteins in the
ubiquitin-proteasome pathway. Ube3a is expressed in a number of
tissues, including, the heart, liver and brain
(GeneCards®; www.genecards.org). Since 1997, research has
predominantly focused on the role of Ube3a in Angelman Syndrome
(8,9). However, the role of Ube3a has also
been investigated in Prader-Willi syndrome (10), autism (11) and Huntington's disease (12). In neural cells, Ube3a is capable of
initiating the degradation of p53 in the ubiquitin-mediated pathway
(13,14). Furthermore, in hypertrophic
myocardial tissue, mouse double minute 2 homolog (Mdm2), a member
of the E3 family, is significantly increased and has been proposed
to regulate the expression of p53 (14).
In the present study, H2O2 was
used to induce apoptosis in H9C2 cardiomyocytes. The pattern of
Ube3a and p53 expression was analyzed to assess their roles in
cardiomyocyte apoptosis. To the best of our knowledge, this is the
first report to demonstrate an association between Ube3a and p53
upon H2O2 treatment in H9C2 cardiomyocytes.
Ube3a and p53 may have a significant role in ubiquitin degradation
in cardiomyocyte apoptosis.
Materials and methods
Data pre-processing and
normalization
A total of 9 cardiomyopathy datasets were analyzed,
including six oligonucleotide and three cDNA microarray datasets.
The first oligonucleotide microarray dataset (GDS411) (15) consisted of 53 samples, including 12
normal, 12 heart failure, 12 rescue heart failure and 17 other
types of samples. The second dataset (GDS651) comprised 37 samples,
including 11 normal, 15 idiopathic dilated and 11 ischemic
cardiomyopathy (ICM) samples. The third dataset (GDS1264) (16) consisted of 23 samples, including 11
normal and 12 cardiomyopathy samples. The fourth dataset (GDS1362)
(17) contained 30 samples,
including 15 normal and 15 ICM samples. The fifth dataset (GDS3386)
(18,19) contained 32 samples, including 16
normal and 16 myocardial hypertrophy samples. The sixth dataset
(GDS2145) (20) consisted of 28
samples, including 15 normal and 13 dilated cardiomyopathy samples.
Regarding the cDNA microarray datasets, the first dataset (GDS2206)
(21) comprised 20 samples,
including normal samples and those from patients with myocardial
infarction (MI). The second dataset (GSE1616) (22) consisted of 37 samples, from six
normal and 21 nonischemic patients, as well as 10 patients with
ICM. The third dataset (GSE18224) (23) contained 24 samples, including 12
normal and 12 MI samples.
The cDNA data was log2-transformed and
each array was subsequently normalized as median zero and standard
deviation (SD) one per array, as adopted from the Oncomine database
(24). CloneIDs with a missing
rate >20% were deleted. The remaining missing values were
replaced using the k nearest neighbor imputation algorithm (k=15)
(25). The Affymetrix GeneChip
data were pre-processed using the robust multi-array analysis
algorithm and then the between-array median was normalized
(26).
Selection of differentially expressed
genes (DEGs)
The significance analysis of microarrays (SAM)
method was performed using the samr R package (27) to select DEGs. Multiple statistical
tests were controlled by false discovery rate (FDR), defined as the
expected percentage of false positives among the claimed DEGs
(28). The FDR estimation of SAM
may be overly conservative (29,30);
therefore, the FDR estimation method suggested by Zhang (30) and influenced by Xie et al
(29), was also employed and
referred to as the modified SAM method.
Cell cultures
H9C2 cells (Chinese Academy of Sciences, Shanghai,
China) were cultured on 96-well plates in Dulbecco's modified
Eagle's Medium (DMEM) containing 1 g/l glucose supplemented with
10% heat-inactivated fetal bovine serum (Wisent Bioproducts, St.
Bruno, QC, Canada), 100 U/ml penicillin and 100 μg/ml streptomycin
(Invitrogen Life Technologies, Carlsbad, CA, USA) in a humidified
atmosphere at 37°C in 5% CO2. To prevent cell loss,
cells were subcultured prior to confluence, at a ratio of ~1:2,
every two days. Cells in the logarithmic growth phase were used in
the experiments.
H2O2 treatment
Following inoculation for 24 h, H9C2 cells were
treated with the indicated concentrations of
H2O2 (Sangon Biotech, Shanghai, China), which
was added to the culture medium. Cells were then incubated further
for the indicated times.
Cell viability
Following exposure to H2O2 for
4 h, H9C2 cells were treated with MTT (Nanjing KeyGen Biotech Co.
Ltd., Nanjing, China) and then incubated for 4 h at 37°C in the
dark. The supernatant was subsequently removed and 150 μl
dimethylsulfoxide was added to each well. The optical density (OD)
was measured at a wavelength of 550 nm once the crystals had
dissolved. Cell viability was calculated as the percentage of the
control OD.
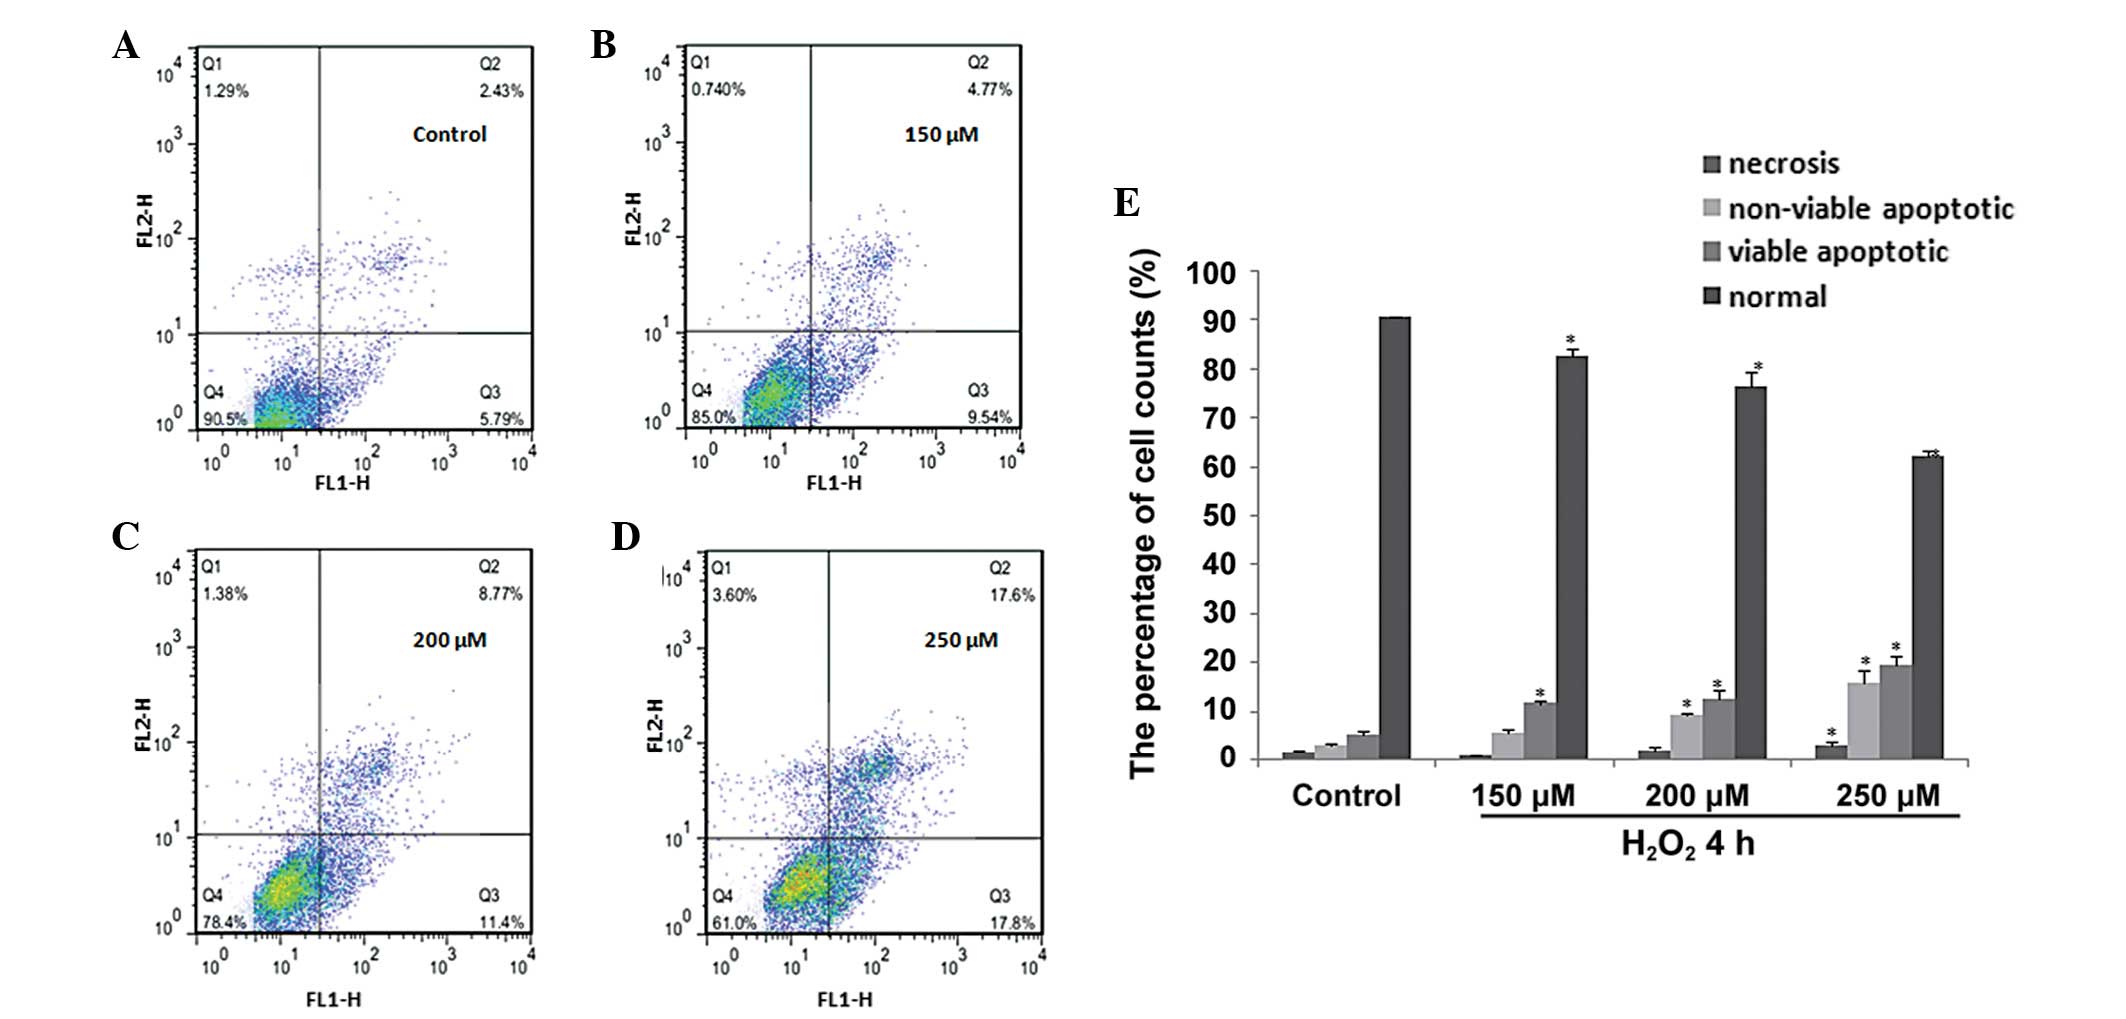
Apoptosis assay
The percentage of apoptotic cells was measured using
the Annexin V-fluorescein isothiocyanate (FITC) Apoptosis Detection
kit (Nanjing KeyGen Biotech Co. Ltd.) according to the
manufacturer's instructions. Following exposure to
H2O2 for 48 h, cells were harvested using
0.25% Trypsin without ethylenediaminetetraacetic acid, and then
washed twice with phosphate-buffered saline (PBS), prior to
resuspension in 500 μl binding buffer with 5 μl Annexin V-FITC and
5 μl propidium iodide (PI). Subsequent to incubation for 15 min in
the dark, the samples were analyzed using flow cytometry (BD
Biosciences, Franklin Lakes, NJ, USA). The number of cells in
different quadrants represented different cell populations, with
the lower left quadrant representing normal cells, the lower right
representing viable apoptotic cells, the upper right representing
non-viable apoptotic cells and the upper left representing necrotic
cells.
Western blot analysis
Subsequent to the relevant treatment, cells were
washed twice with ice-cold PBS and then lysed in cell lysis buffer
containing 1% phenylmethylsulfonyl fluoride (PMSF) for 30 min on
ice. The lysate was centrifuged at 15,249 × g at 4°C for 20 min to
remove the insoluble materials, followed by collection of the
supernatants. All samples were mixed with 5X loading buffer and
boiled for 5 min. Samples were separated using 8% SDS-PAGE and then
transferred to polyvinylidene fluoride (PVDF) membranes (Billerica,
Millipore, MA, USA). Membranes were blocked for 1 h using 5%
non-fat milk in Tris-buffered saline containing 1% Tween-20 (TBST)
at room temperature and then incubated with anti-UBE3A (Cell
Signaling Technology, Danvers, MA, USA), anti-p53 (BioWorld
Products Inc., Visalia, CA, USA) and anti-GAPDH (Epitomics Inc.,
Burlingame, CA, USA) antibodies overnight at 4°C. Membranes were
washed with TBST three times every 10 min, then incubated with a
horseradish peroxidase-conjugated secondary antibody (Beyotime
Institute of Technology, Haimen, China) for 1 h at room
temperature. Following the secondary antibody incubation, membranes
were further washed with TBST and the immunoreactive bands were
visualized using the enhanced chemiluminescence method. The images
were analyzed using the Quantity One® software (Bio-Rad,
Hercules, CA, USA).
Quantitiative polyermase chain reaction
(qPCR) analysis
RNA was prepared using TRIzol® Reagent
(Invitrogen Life Technologies) and RNA concentration and purity
were then determined using a spectrophotometer (Thermo Fisher
Scientific, Waltham, MA, USA). Total RNA was subsequently converted
into cDNA by reverse transcription using the High-Capacity cDNA
Reverse Transcription kit (Applied Biosystems, Carlsbad, CA, USA).
qPCR was performed in triplicate using Power SYBR® Green
PCR Master mix and a 7500 Fast Real-Time PCR system (Applied
Biosystems) according to the manufacturer's instructions. Analysis
was performed using the software supplied with the instrument.
Primer sequences were as follows: Forward: 5′-GAGGACTCG
GAAAATTGAAGATG-3′ and reverse: 5′-CCGGAAGTA AAAGGACATTAAAGC-3′ for
Ube3a; and forward: 5′-CCA TCAACGACCCCTTCATT-3′ and reverse:
5′-GACCAG CTTCCCATTCTCAG-3′ for GAPDH.
Statistical analysis
Statistical analyses were performed using the SPSS
14.0 statistical software (SPSS, Inc., Chicago, IL, USA). All data
are expressed as the mean ± SEM from at least three independent
experiments. Results were analyzed using one-way analysis of
variance. P<0.05 was considered to indicate a statistically
significant difference.
Experimental procedures
Each experiment was repeated at least three times
with comparable results, unless indicated otherwise.
Results
DEG selection
Current FDR control procedures, including that
adopted in SAM (27), may be
unstable in small samples particularly in the presence of
correlated expression changes. Therefore, in the present study, the
actual FDR of DEGs detected in simulated small samples was
evaluated, according to predefined DEGs. Based on the simulated
results, using SAM with 0.05% FDR control, the DEGs obtained from
the full samples were defined as a nominal gold standard set
(31). As shown in Table I, this procedure identified various
DEGs. Although false positives were detected in the selected DEGs,
this was a preliminary procedure to prepare for the subsequent
analysis of various datasets.
 | Table INumber of differentially expressed
genes selected from different datasets (FDR control values). |
Table I
Number of differentially expressed
genes selected from different datasets (FDR control values).
| ID | <0.001 | <0.01 | <0.05 | <0.1 |
|---|
| GDS411 | 6 | 6 | 7 | 18 |
| GDS651 | 155 | 1656 | 6407 | 10497 |
| GDS1264 | 93 | 259 | 869 | 1721 |
| GDS1362 | 66 | 405 | 2067 | 5136 |
| GDS3386 | 5 | 5 | 5 | 19 |
| GDS2145 | 304 | 818 | 1637 | 2130 |
| GDS2206 | 941 | 2648 | 5491 | 7480 |
| GSE1616 | 78 | 203 | 751 | 1259 |
| GSE18224 | 89 | 290 | 904 | 1411 |
Generation of cardiomyopathy-associated
E3 ubiquitin ligase genes
Different datasets supply different information. The
DEGs selected using the aforementioned method were associated with
numerous cardiomyopathy-associated genes. A total of five DEGs were
selected, all of which belong to the E3 ubiquitin ligase family,
and were termed cardiomyopathy-associated E3 ubiquitin ligase
genes. These DEGs were: Ube3a; WW domain containing E3 ubiquitin
protein ligase 1 (Wwp1); itchy E3 ubiquitin protein ligase (Itch);
HECT, C2 and WW domain containing E3 ubiquitin protein ligase 1
(Kiaa0322) and SMAD specific E3 ubiquitin protein ligase 2
(Smurf2). The mRNA levels of these five candidate genes were
detected using qPCR analysis. Ube3a mRNA levels were observed to be
significantly higher in the H2O2-treated
group than in the control group; therefore, Ube3a was selected as a
candidate myocyte apoptosis-associated gene for further
investigation.
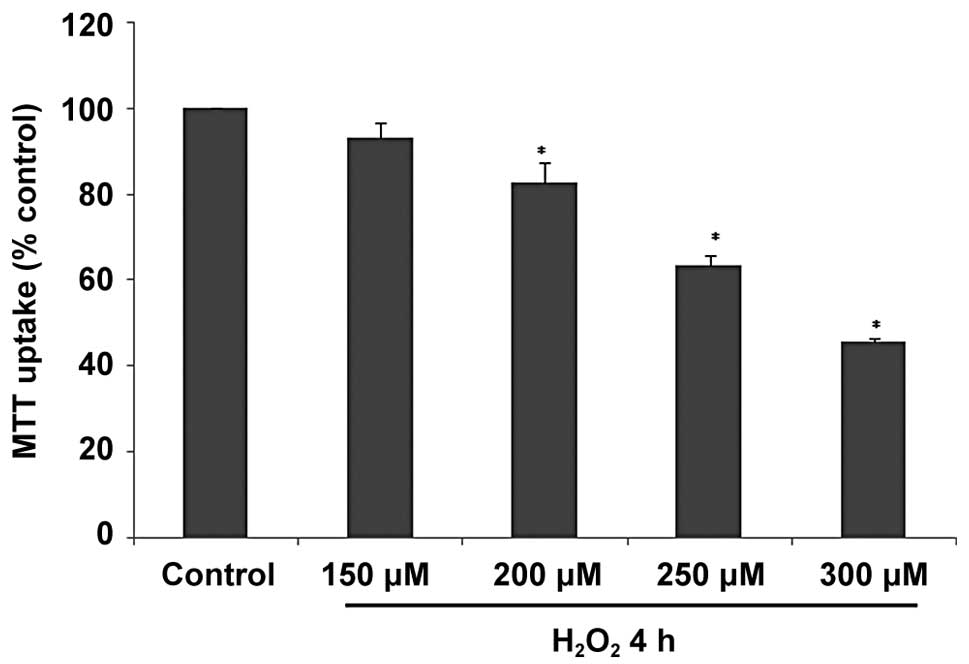
H2O2 exposure
decreases cell viability in H9C2 cells
H9C2 cells were exposed to increasing concentrations
of H2O2 ranging between 150 and 300 μM for 4
h. Cell viability was then assessed by MTT uptake. The results
showed that in the H2O2-treated group, cell
viability decreased in a dose-dependent manner compared with the
PBS-treated control group (Fig.
1).
H2O2 exposure
induces apoptosis in H9C2 cells
Reports have shown that H2O2
is capable of inducing myocardial hypertrophy at low concentrations
and apoptosis at higher concentrations (32). Annexin V/PI staining and flow
cytometry were used to determine the apoptotic response of H9C2
cells to high concentrations of H2O2. Cells
were harvested following exposure to H2O2
(150–250 μM) for 4 h. As shown in Fig.
2A–D, the Annexin V/PI point diagram exhibited a significant
dose-dependent increase in apoptotic cells in response to
H2O2. Following treatment with 250 μM
H2O2 for 4 h, the percentage of apoptotic
H9C2 cells increased approximately five-fold compared with the
PBS-treated control cells (Fig.
2E). These results suggest that H2O2
exposure is capable of inducing apoptosis in a dose-dependent
manner in H9C2 cells.
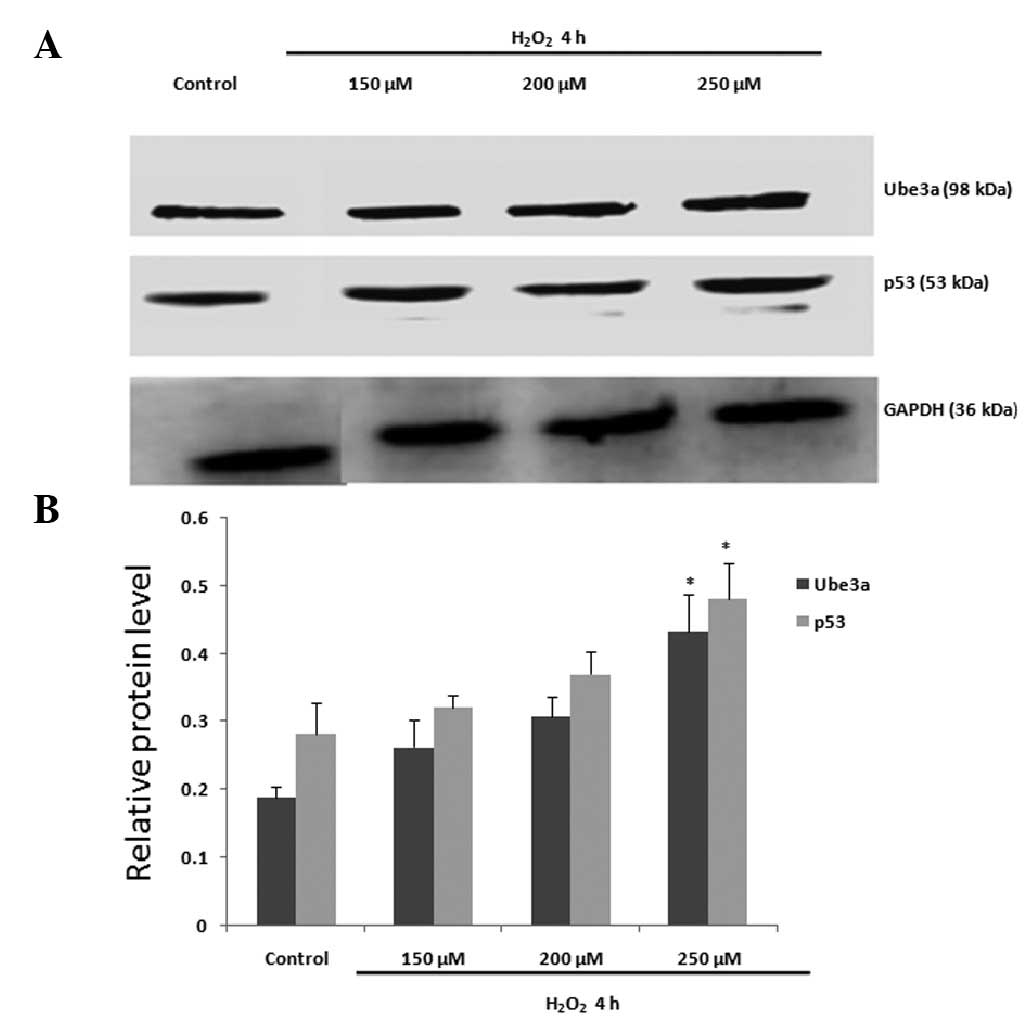
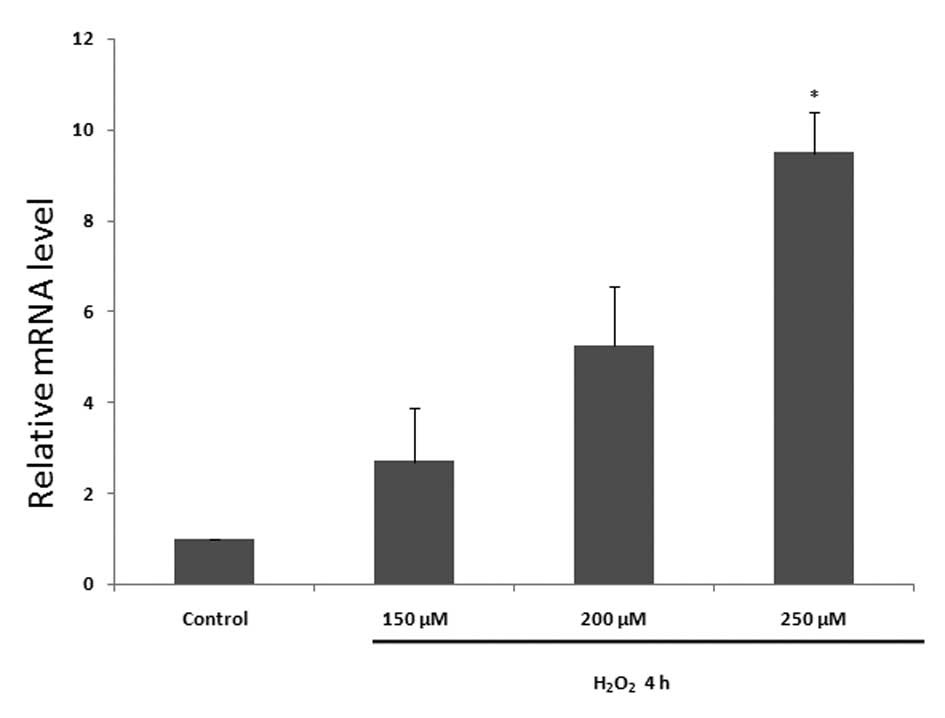
Ube3a transcription and translation
increase in response to apoptosis in H9C2 cells
To examine the effect of
H2O2-induced apoptosis on Ube3a levels in
H9C2 cells, cells were treated with H2O2 in
accordance with the aforementioned method. Ube3a protein levels
were observed to increase in the same manner as that of p53
(Fig. 3). An increase in Ube3a
transcription was also observed following
H2O2 treatment (Fig. 4).
Discussion
The mechanism underlying cardiomyopathy is complex
and its initiating mechanisms have yet to be elucidated. Different
datasets supply different information; therefore, in the present
study, several microarray datasets were integrated and Ube3a was
selected as a cardiomyopathy-associated gene. Substantial evidence
has suggested that apoptosis may be involved in the pathophysiology
of cardiomyopathies; therefore, in the present study,
H2O2 was used to induce apoptosis in H9C2
cells to assess whether Ube3a is responsible for degrading the
apoptotic protein, p53.
In this study, H9C2 cell viability was found to
decrease in a dose-dependent manner upon 4 h of exposure to
H2O2 at concentrations ranging between 150
and 300 μM, detected using MTT assay (Fig. 1). In order to detect whether
apoptosis occurred under these conditions, flow cytometry was used.
H2O2 treatment at concentrations ranging
between 150 and 250 μM for 4 h was observed to induce apoptosis in
a dose-dependent manner in H9C2 cells (Fig. 2). p53 protein levels were also
observed to increase upon induction of apoptosis. These results
demonstrated that apoptosis occurred under
H2O2 stimulation in H9C2 cells. Furthermore,
the transcriptional and translational levels of Ube3a were
increased in a similar manner to that of p53 (Figs. 3 and 4), suggesting that an association may
exist between Ube3a and apoptosis.
Based on the results in the present study, it was
hypothesized that Ube3a may have an important role in the process
of cardiomyopathy. Ube3a is a member of the E3 family, which is
responsible for recognizing target proteins in the
ubiquitin-proteasome pathway. The ubiquitin proteasome system has
an important role in the process of protein metabolism in normal
cells. Therefore, it was hypothesized in the present study that
when Ube3a protein levels are altered, homeostasis of the
ubiquitin-proteasome system may be lost. This may induce
abnormalities in protein degradation and ultimately lead to
apoptosis or cardiomyopathy. Many researches are focusing on the
potential role of Ube3a at the brain, particulary Angelman
syndrome. The present study is the first time that novel function
of Ube3a has been reported in the heart, which is likely to reveal
its new features in cardiomyopathy.
Acknowledgements
The authors would like to thank the staff involved
in the study for their valued contributions. This study was
supported by the Young Talents Scheme of Tongji University (no.
1500219046) and the Shanghai Municipal Health Bureau Project (no.
z0124y166).
References
|
1
|
Sarkar S, Leaman DW, Gupta S, et al:
Cardiac overexpression of myotrophin triggers myocardial
hypertrophy and heart failure in transgenic mice. J Biol Chem.
279:20422–20434. 2004. View Article : Google Scholar : PubMed/NCBI
|
|
2
|
Schaub MC, Hefti MA and Zaugg M:
Integration of calcium with the signaling network in cardiac
myocytes. J Mol Cell Cardiol. 41:183–214. 2006. View Article : Google Scholar : PubMed/NCBI
|
|
3
|
Sarkar S, Chawla-Sarkar M, Young D, et al:
Myocardial cell death and regeneration during progression of
cardiac hypertrophy to heart failure. J Biol Chem. 279:52630–52642.
2004. View Article : Google Scholar : PubMed/NCBI
|
|
4
|
Shi PP, Cao XR, Sweezer EM, et al:
Salt-sensitive hypertension and cardiac hypertrophy in mice
deficient in the ubiquitin ligase Nedd4-2. Am J Physiol Renal
Physiol. 295:F462–F470. 2008. View Article : Google Scholar : PubMed/NCBI
|
|
5
|
Haupt S, Berger M, Goldberg Z and Haupt Y:
Apoptosis - the p53 network. J Cell Sci. 116:4077–4085. 2003.
View Article : Google Scholar : PubMed/NCBI
|
|
6
|
Li HH, Willis MS, Lockyer P, et al:
Atrogin-1 inhibits Akt-dependent cardiac hypertrophy in mice via
ubiquitin-dependent coactivation of Forkhead proteins. J Clin
Invest. 117:3211–3223. 2007. View
Article : Google Scholar : PubMed/NCBI
|
|
7
|
Weekes J, Morrison K, Mullen A, Wait R,
Barton P and Dunn MJ: Hyperubiquitination of proteins in dilated
cardiomyopathy. Proteomics. 3:208–216. 2003. View Article : Google Scholar : PubMed/NCBI
|
|
8
|
Matsuura T, Sutcliffe JS, Fang P, et al:
De novo truncating mutations in E6-AP ubiquitin-protein ligase gene
(UBE3A) in Angelman syndrome. Nat Genet. 15:74–77. 1997. View Article : Google Scholar : PubMed/NCBI
|
|
9
|
Huang HS, Allen JA, Mabb AM, et al:
Topoisomerase inhibitors unsilence the dormant allele of Ube3a in
neurons. Nature. 481:185–189. 2011. View Article : Google Scholar : PubMed/NCBI
|
|
10
|
Bürger J, Horn D, Tönnies H, Neitzel H and
Reis A: Familial interstitial 570 kbp deletion of the UBE3A gene
region causing Angelman syndrome but not Prader-Willi syndrome. Am
J Med Genet. 111:233–237. 2002.PubMed/NCBI
|
|
11
|
Veenstra-VanderWeele J, Gonen D, Leventhal
BL and Cook EH Jr: Mutation screening of the UBE3A/E6-AP gene in
autistic disorder. Mol Psychiatry. 4:64–67. 1999. View Article : Google Scholar : PubMed/NCBI
|
|
12
|
Maheshwari M, Samanta A, Godavarthi SK,
Mukherjee R and Jana NR: Dysfunction of the ubiquitin ligase Ube3a
may be associated with synaptic pathophysiology in a mouse model of
Huntington disease. J Biol Chem. 287:29949–29957. 2012. View Article : Google Scholar : PubMed/NCBI
|
|
13
|
Long X, Boluyt MO, Hipolito ML, et al: p53
and the hypoxia-induced apoptosis of cultured neonatal rat cardiac
myocytes. J Clin Invest. 99:2635–2643. 1997. View Article : Google Scholar : PubMed/NCBI
|
|
14
|
Shi L, Nikolic D, Liu S, Lu H and Wang S:
Activation of renal renin-angiotensin system in upstream
stimulatory factor 2 transgenic mice. Am J Physiol Renal Physiol.
296:F257–F265. 2009. View Article : Google Scholar : PubMed/NCBI
|
|
15
|
Blaxall BC, Spang R, Rockman HA and Koch
WJ: Differential myocardial gene expression in the development and
rescue of murine heart failure. Physiol Genomics. 15:105–114.
2003.PubMed/NCBI
|
|
16
|
Rysä J, Leskinen H, Ilves M and Ruskoaho
H: Distinct upregulation of extracellular matrix genes in
transition from hypertrophy to hypertensive heart failure.
Hypertension. 45:927–933. 2005.PubMed/NCBI
|
|
17
|
da Silva R, Lucchinetti E, Pasch T, Schaub
MC and Zaugg M: Ischemic but not pharmacological preconditioning
elicits a gene expression profile similar to unprotected
myocardium. Physiol Genomics. 20:117–130. 2004.
|
|
18
|
Fliegner D, Schubert C, Penkalla A, et al:
Female sex and estrogen receptor-beta attenuate cardiac remodeling
and apoptosis in pressure overload. Am J Physiol Regul Integr Comp
Physiol. 298:R1597–R1606. 2010. View Article : Google Scholar : PubMed/NCBI
|
|
19
|
Kararigas G, Fliegner D, Gustafsson JÅ and
Regitz-Zagrosek V: Role of the estrogen/estrogen-receptor-beta axis
in the genomic response to pressure overload-induced hypertrophy.
Physiol Genomics. 43:438–446. 2011. View Article : Google Scholar : PubMed/NCBI
|
|
20
|
Barth AS, Kuner R, Buness A, et al:
Identification of a common gene expression signature in dilated
cardiomyopathy across independent microarray studies. J Am Coll
Cardiol. 48:1610–1617. 2006. View Article : Google Scholar : PubMed/NCBI
|
|
21
|
Husberg C, Nygård S, Finsen AV, et al:
Cytokine expression profiling of the myocardium reveals a role for
CX3CL1 (fractalkine) in heart failure. J Mol Cell Cardiol.
45:261–269. 2008. View Article : Google Scholar : PubMed/NCBI
|
|
22
|
Kittleson MM, Minhas KM, Irizarry RA, et
al: Gene expression analysis of ischemic and nonischemic
cardiomyopathy: shared and distinct genes in the development of
heart failure. Physiol Genomics. 21:299–307. 2005. View Article : Google Scholar : PubMed/NCBI
|
|
23
|
Andersson KB, Florholmen G, Winer LH,
Tønnessen T and Christensen G: Regulation of neuronal type genes in
congestive heart failure rats. Acta Physiol (Oxf). 186:17–27. 2006.
View Article : Google Scholar : PubMed/NCBI
|
|
24
|
Rhodes DR, Kalyana-Sundaram S, Mahavisno
V, et al: Oncomine 3.0: genes, pathways, and networks in a
collection of 18,000 cancer gene expression profiles. Neoplasia.
9:166–180. 2007. View Article : Google Scholar : PubMed/NCBI
|
|
25
|
Troyanskaya O, Cantor M, Sherlock G, et
al: Missing value estimation methods for DNA microarrays.
Bioinformatics. 17:520–525. 2001. View Article : Google Scholar : PubMed/NCBI
|
|
26
|
Irizarry RA, Warren D, Spencer F, et al:
Multiple-laboratory comparison of microarray platforms. Nat
Methods. 2:345–350. 2005. View
Article : Google Scholar : PubMed/NCBI
|
|
27
|
Tusher VG, Tibshirani R and Chu G:
Significance analysis of microarrays applied to the ionizing
radiation response. Proc Natl Acad Sci USA. 98:5116–5121. 2001.
View Article : Google Scholar : PubMed/NCBI
|
|
28
|
Klipper-Aurbach Y, Wasserman M,
Braunspiegel-Weintrob N, et al: Mathematical formulae for the
prediction of the residual beta cell function during the first two
years of disease in children and adolescents with insulin-dependent
diabetes mellitus. Med Hypotheses. 45:486–490. 1995.PubMed/NCBI
|
|
29
|
Xie Y, Pan W and Khodursky AB: A note on
using permutation-based false discovery rate estimates to compare
different analysis methods for microarray data. Bioinformatics.
21:4280–4288. 2005. View Article : Google Scholar : PubMed/NCBI
|
|
30
|
Zhang S: A comprehensive evaluation of
SAM, the SAM R-package and a simple modification to improve its
performance. BMC Bioinformatics. 8:2302007. View Article : Google Scholar : PubMed/NCBI
|
|
31
|
Pavlidis P, Li Q and Noble WS: The effect
of replication on gene expression microarray experiments.
Bioinformatics. 19:1620–1627. 2003. View Article : Google Scholar : PubMed/NCBI
|
|
32
|
Clerk A, Kemp TJ, Zoumpoulidou G and
Sugden PH: Cardiac myocyte gene expression profiling during
H2O2-induced apoptosis. Physiol Genomics.
29:118–127. 2007. View Article : Google Scholar : PubMed/NCBI
|