Introduction
Subarachnoid hemorrhage (SAH) is a type of stroke,
which affects 1–12 individuals per 100,000 annually, worldwide.
Despite advances in management strategies, the prognosis of SAH
remains poor and the mortality rate has remained relatively
unchanged (1). Accumulating
evidence has indicated that early brain injury (EBI) is one of the
leading causes of mortality worldwide in patients with SAH
(2). However, the mechanism
underlying the early pathophysiological consequences of SAH, and
how to alleviate them, remain to be elucidated. Previous studies
have revealed that certain pathways and genes associated with
inflammation are involved in these pathophysiological processes and
affect cell apoptosis or necrosis following SAH; therefore,
targeting these pathways or genes can significantly ameliorate
brain injury (3–8). Additionally, with developments of
genomics, numerous genes have been reported to be differentially
expressed in SAH (9,10). However, the molecular regulatory
mechanism in EBI following SAH remains to be fully elucidated.
Long non-coding R NAs (LncR NAs), which contain
>200 nucleotides, have been demonstrated to regulate the
biological behavior of cells (11–13).
Previous studies have revealed that LncRNAs are involved in various
pathophysiological processes in brain disease and that targeting
LncRNAs effectively reverses the progress of ischemic stroke,
Alzheimer’s disease and brain tumors (14–17).
LncRNAs have specific expression profiles in brain tissues and are
potential independent prognostic molecular markers (18). There is evidence to suggest that
LncRNAs may be important for regulating the process of brain
disease (14–18). However, the expression and function
of LncRNAs in EBI following SAH remain to be elucidated. Thus, the
present study aimed to investigate whether differently expressed
LncRNAs are important in the early pathophysiological stage
following SAH.
The present study established a rat SAH model, as
previously reported (2,19) and used microarray assays to
identify the expression profiles of LncRNAs and mRNAs in tissues of
the temporal lobe cortex 24 h after SAH. Thie five differentially
expressed LncRNAs identified were further confirmed in additional
SAH samples via reverse transcription quantitative polymerase chain
reaction (RT-qPCR). In addition, differentially expressed mRNAs
were analyzed using the Gene Ontology (GO) and the Kyoto
Encyclopedia of Genes and Genomes (KEGG) databases to clarify their
biological functions. Therefore, the present study aimed to
investigate the LncRNA and mRNA expression profiles and functions
in EBI following SAH.
Materials and methods
Animal model and sample preparation
Adult male Wistar rats (250–300 g; n=16) were
purchased from Yisi Laboratory Animal Technology Co., Ltd.
(Changchun, China). The rats were housed in a room under an
alternating 12-h light/dark cycle, with a controlled temperature
(22–24°C) and humidity of ~55%. The rats were anesthetized with 10
% chloral hydrate (0.3 ml/100 g body weight; Hubei Jusheng
Technology Co., Ltd, Tianmen, China). Non-heparinized fresh
autologous arterial blood (0.3 ml) was slowly injected into the
pre-chias-matic cistern for 25 sec using a syringe (Jiangxi Hongda
Medical Equipment Group, Ltd., Jiangxi, China). Control animals
were injected with 0.3 ml saline (Harbin Pharmaceutical Group Co.,
Ltd, Shanghai, China). Images of the rats brains were captured
using a Canon IXY 31S camera (Canon, Inc., Tokyo, Japan) under the
following conditions: Aperture value, f/2; exposure time, 1/20 sec;
and focal distance, 4 mm. The temporal lobe cortex was dissected 24
h following SAH and the brain samples were rapidly frozen with
liquid nitrogen (Harbin, Liming Gas Group, Co., Ltd., Harbin,
China) and then stored at -80°C until further use. The present
study was approved by the Ethical Committee of the First Affiliated
Hospital of Harbin Medical University (Harbin, China).
RNA extraction and quality control
The total RNA was extracted from three-paired
samples from the SAH and control groups using TRIzol reagent
(Invitrogen Life Technologies, Carlsbad, CA, USA) according to the
manufacturer’s instructions. The quantification and quality of the
RNA was measured using a NanoDrop ND-1000 spectrophotometer
(NanoDrop Technologies, Inc., Wilmington, DE, USA). The integrity
of the RNA and DNA contamination were assessed using denaturing
agarose gel electrophoresis (Invitrogen Life Technologies). The
gels were prepared with agarose (111860; Beijing Borunlaite Science
& Technology Co., Ltd. Beijing, China), 10XMOPS running buffer
[M00138; Genscript (Nanjing) Co., Ltd., Nanjing, China] and 37%
formaldehyde (M134–500ML; Shanghai Haoran Bio-Technology Co., Ltd.,
Shanghai, China). Subsequently, six wells were prepared with the
10XMOPS running buffer. Finally, the prepared samples were loaded
into the wells, electrophoresis was conducted and then the gels
were visualized using a UV transilluminator (170–8170; Bio-Rad
Laboratories, Inc., Hercules, CA, USA).
Array hybridization and data
analysis
Preparation of the three-paired samples and
microarray assays were performed using the Agilent array platform
(Agilent Technologies, Inc., Santa Clara, CA, USA) according to the
manufacturer’s instructions, with modifications. Briefly, the mRNAs
were amplified and transcribed into fluorescent complementary
(c)RNAs using a random priming method, according to Agilent’s Quick
Amp Labeling instructions (version 5.7; Agilent Technologies,
Inc.). The cRNAs were purified using an RNeasy Mini kit (Qiagen,
Hilden, Germany) and mixed with Agilent Gene Expression
Hybridization Kit (p/n 5188–5242; Agilent Technologies, Inc.)
containg 10X blocking agent, 25X fragmentation buffer, 2X GEx
hybridization buffer HI-RPM. The mixture was then transferred to
the rat LncRNs array v2.0 expression slide (4×44K; Arraystar,
Shanghai, China). Following washing and fixing using Gene
Expression Buffer 1 (p/n, 5188–5325; Agilent Technologies, Inc.)
and Buffer 2 (p/n, 5188–5326; Agilent Technologies, Inc.),
respectively, the arrays were scanned using an Agilent DNA
Microarray Scanner (G2505C; Agilent Technologies, Inc.). Images
were acquired and were analyzed using Agilent Feature Extraction
software (version 11.0.1.1; Agilent Technologies, Inc.) and
subsequent data processing was performed using GeneSpring GX
v11.5.1 software (Agilent Technologies, Inc.). The data were
filtered using a Volcano plot and then differentially expressed
(>2.0 fold; P<0.05) LncRNAs and mRNAs were assessed by
constructing a box plot and scatter plot, respectively, to ensure
the quality of the data. Based on the expression levels
(log2 ratio) of the differentially expressed mRNAs
(>3.0 fold change; P<0.05) and lncRNAs (>3.0 fold change;
P<0.05), the two-way hierarchical clustering were carried out
using the R package ‘pheatmap’, version 0.7.7 (http://cran.r-project.org/web/packages/pheatmap/).
The microarray data were prepared and analyzed by Oebiotech Co.,
Ltd. (Shanghai, China).
GO and KEGG pathway analysis
The differentially expressed mRNAs were selected for
GO and KEGG pathway analysis. The GO project describes gene
attributes, including biological process (BP), cellular component
(CC) and molecular function (MF). Based on the GO categories
(http://www.geneontology. org), the differentially
expressed mRNAs were classified under different GO terms according
to their characteristics and the enrichment of the GO terms was
calculated. The KEGG database (http://www.genome.jp/kegg) was used to analyze the
differentially expressed mRNAs and the enrichment of different
pathways was also calculated. The P-value indicated the
significatnce of the GO term and KEGG pathway enrichment
(P<0.05). The false discovery rate (FDR) was used to evaluate
the significance of the P-value and an FDR<0.05 was recommended.
The GO and KEGG pathway analyses were performed by Oebiotech Co.,
Ltd. (Shanghai, China).
RT-qPCR validation
The total RNA was extracted from the SAH and control
groups (five-paired) using TRIzol reagent (Invitrogen Life
Technologies). In order to validate the reliability of the
microarray data, five randomly selected lncRNAs and their
expression levels were further assed by RT-qPCR using a SYBR Green
PCR Master mix kit (Applied Biosystems Life Technologies, Foster
City, CA, USA) on an ABI 7500HT Fast Real-Time PCR instrument
(Applied Biosystems Life Technologies). The raw data were
normalized to the expression of actin. The following primers were
used: MRuc008hvl, forward 5′-GGACATCCAGATGCTGTT-3′ and reverse
5′-ACTGATGGTTTGCTCCATTA-3′; MRAK038897, forward
5′-TGCTGAAGACCAATGAGTTT-3′ and reverse 5′-TCTGACTTGTGATCTACAGGC-3′;
BC092207, forward 5′-TAAGCTGTAATCTACGGGAGG-3′ and reverse 5′-GCT
GTTTCATCAGGTTGTCATA-3′; MRAK017168, forward
5′-TTACCTGGAACTGTACCCTCT-3′ and reverse 5′-CTC
CTCCTAGCCATCTCAAT-3′; XR_006756, forward 5′-ACT GGTAACCTCCTGCTC-3′
and reverse 5′-TGGTGGCTC GTCTACTT-3′ and actin, forward
5′-CCCATCTATGAG GGTTACG-3′ and reverse
5′-ATGTCACGCACGATTTCC-3′.
Statistical analysis
Student’s t-test was used to evaluate the
differences in the expression levels of LncRNAs between the SAH and
control groups using Prism5 statistical software (GraphPad
Software, Inc., La Jolla, CA, USA). P<0.05 was considered to
indicate a statistically significant difference.
Results
Quality assessment of the LncRNA and mRNA
data between the SAH model and the control group
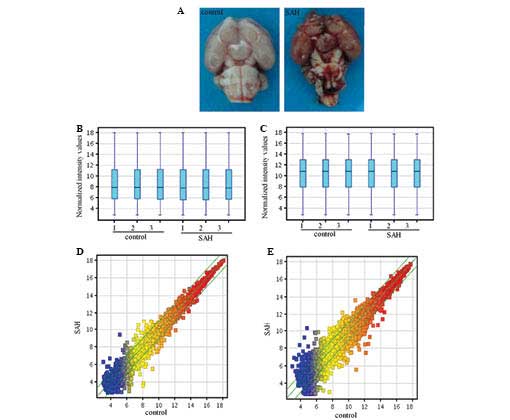
To investigate the expression of LncRNAs in SAH, a
rat SAH model mimicking human SAH was established, as previously
described (2,19). As demonstrated in Fig. 1A, the temporal lobe cortex of the
SAH model and the control rats were resected and images were
captured 24 h after resection. It was evident that the blood was
present in the subarachnoid space of the SAH brain tissues.
Microarray hybridization was performed to detect the expression
profiles of the LncRNAs and mRNAs in the two groups. To ensure the
quality of the microarray data, the microarray results were
evaluated using box-plot and scatter-plot statistical methods. As
indicated in Figs. 1B–E, the
box-plot results demonstrated that the distributions of the
intensities from all the samples were almost identical.
Additionally, scatter-plot analysis indicated that the distribution
of the LncRNA and mRNA profiles varied and were different between
the two groups. In conclusion, these results demonstrated that the
data exhibited a Gaussian distribution and were homogeneous.
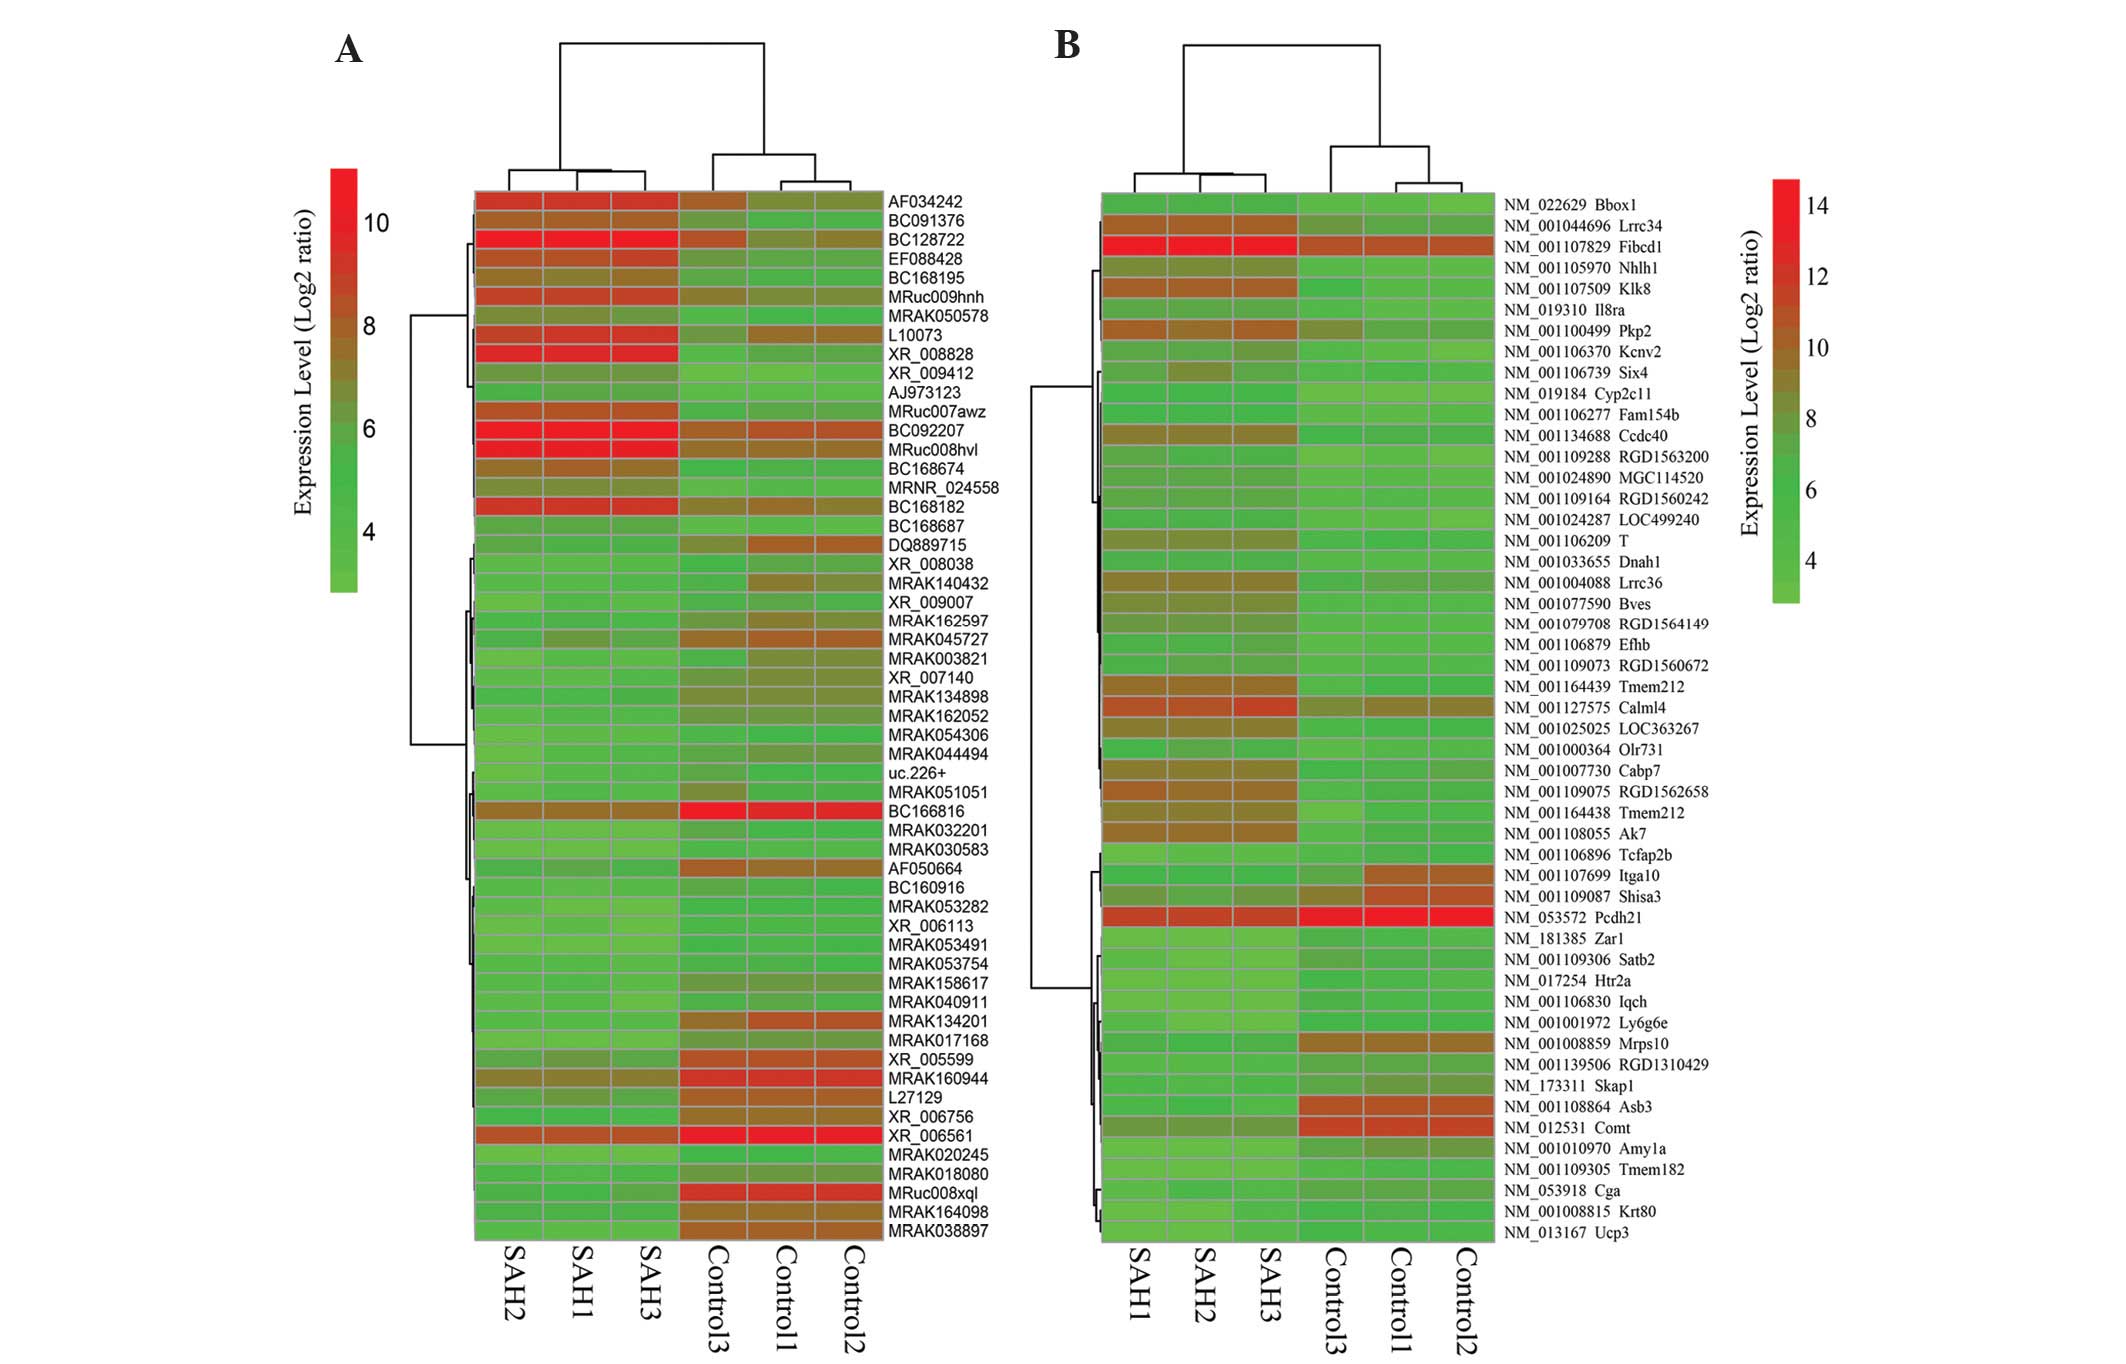
Differentially expressed LncRNAs and
mRNAs between the two groups
Statistically significant differentially expressed
LncRNAs and mRNAs were identified through volcano plot filtering.
There were ~221 upregulated and 181 downregulated mRNAs (fold
change >2.0; P<0.05) and 64 upregulated and 144 downregulated
and LncRNAs in the SAH brain tissues compared with the control
group (>2.0-fold change; P<0.05). In order to further examine
these differentially expressed genes, any genes which changed
≥3-fold were selected to construct a hierarchical clustering map.
As shown in Fig. 2A and B, in
these genes (>3.0 fold change; P<0.05), the number of
upregulated LncRNAs was less than the number of downregulated
LncRNAs, while the opposite effect was observed in the mRNAs.
Notably, these results demonstrated that MRAK038897 was the LncRNA
exhibiting the most marked change (21.8-fold change; P<0.01).
MRAK038897 is associated with ankyrin repeat and suppressor of
cyto-kines signalling box 3 (ASB3), which is involved in the
neuronal inflammatory process of EBI (20–22).
Therefore, MRAK038897 may be a vital factor in the regulation of
EBI. In conclusion, these results revealed that the LncRNAs and
mRNAs had different expression profiles in the SAH group compared
with the control group.
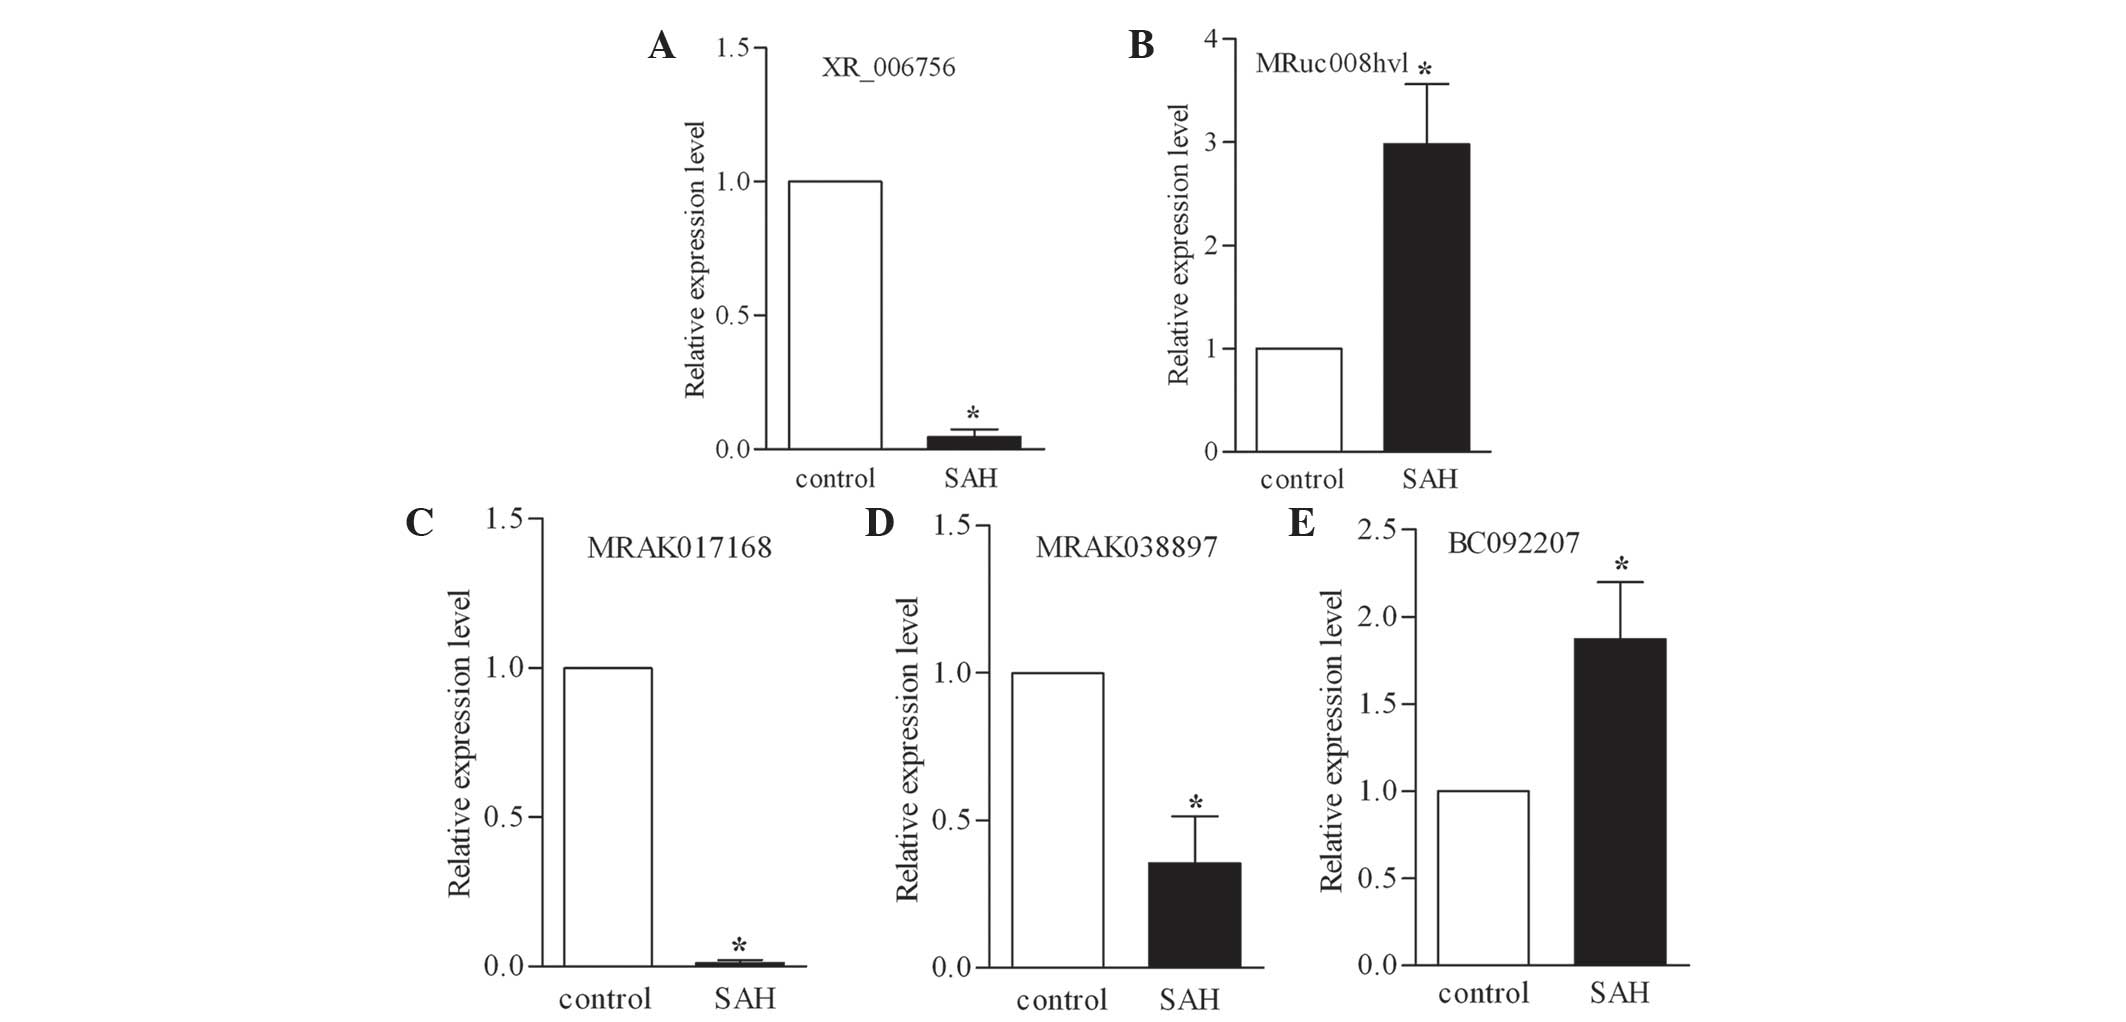
Validation of the expression levels of
the LncRNAs using RT-qPCR
To validate the microarray data, two upregulated
(BC092207, MRuc008hvl) and three downregulated (XR_006756,
MRAK038897 and MRAK017168) LncRNAs, were randomly selected and
their expression levels were further examined using RT-qPCR. The CT
values were normalized to actin. As shown in Figs. 3A–E, the selected LncRNAs were
confirmed to be differentially expressed in the SAH model compared
with the control group. Consistent with the microarray results, the
expression levels of BC092207 and MRuc008hvl were significantly
upregulated and the expression levels of XR_006756, MRAK038897 and
MRAK017168 were markedly downregulated. Therefore, the microarray
results were stable and consistent with the RT-qPCR data.
GO and KEGG analysis of differentially
expressed mRNAs
To clarify the potential function of the mRNAs on
the regulation of the pathological process of SAH, GO categories
were used to describe the BP, CC and MF of the differentially
expressed mRNAs between the SAH group and the control group, as
previously reported (23). The
P-value (<0.05) and the FDR (<0.05) of the listed GO terms
were used to evaluate the significance of the GO term enrichment in
the differentially expressed mRNAs in the SAH group compared with
the control groups. As shown in Fig.
4A–C, the GO analysis revealed that the ‘regulation of system
process’, ‘serine-type endopeptidase activity’ and the
‘extracellular region’ were the enriched GO terms containing
differentially downregulated mRNAs belonging to BP, MF and CC,
respectively. The ‘plasma membrane’ was the most enriched GO term
containing differentially unregulated mRNAs belonging to CC. In
addition, the KEGG pathway analysis demonstrated that the
‘neuroactive ligand-receptor interaction’ and ‘leishmaniasis’ were
the most enriched pathways containing differentially downregulated
or upregulated mRNAs, respectively (Table I).
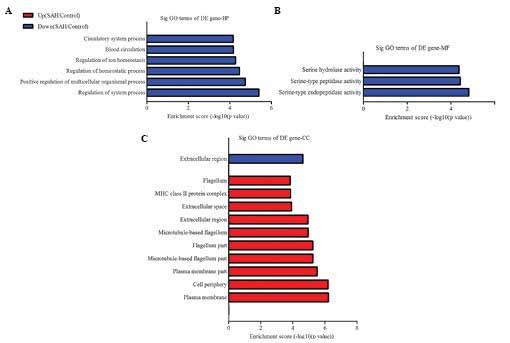 | Figure 4mRNAs that were differentially
expressed were functionally classificated via GO analysis. The most
enriched GO terms, which satisfied the P<0.05 and FDR<0.05
criteria. The downregulated or upregulated mRNAs were classified by
(A) BP, (B) MF and (C) CC GO terms in the SAH model compared with
the control group. SAH, subarachnoid hemorrhage, GO, Gene Ontology,
DE, BP, biological processes; CC, cellular component; MF, molecular
function; FDR, false discovery rate; DE, differentially expressed;
up, upregulated; down, downregulated. |
 | Table IMost enriched pathways associated with
inflammation in early brain injury following subarachnoid
hemorrhage via Kyoto Encyclopedia of Genes and Genomes
analysis. |
Table I
Most enriched pathways associated with
inflammation in early brain injury following subarachnoid
hemorrhage via Kyoto Encyclopedia of Genes and Genomes
analysis.
| Definition | Fisher-P-value | False discovery
rate | Genes |
|---|
| Neuroactive
ligand-receptor interaction | 1.88914E-05 | 0.004892872 | AGTR1A, CGA, CORT,
EDNRB, GCG, GIPR, GRM4, HTR1D HTR2A, PLG, SCTR, TAC1, THRA |
| Leishmaniasis | 6.414E-06 | 0.001661226 | C3, PTGS2, RT1-BA,
RT1-BB, RT1-DA, TGFB3 |
| Calcium signaling
pathway | 2.71687E-05 | 0.003518345 | ADRA1D, CAMK2D, GNA14
ORAI1, P2RX2, P2RX6, PHKG1, PTGER3, RYR2, TRHR |
| Tuberculosis | 0.000118804 | 0.009356411 | C3, CAMK2D, CD74,
NFYA, RT1-BA, RT1-BB, RT1-DA, TGFB3 |
| Asthma | 0.000177772 | 0.009356411 | RT1-BA, RT1-BB,
RT1-DA |
| Staphylococcus
aureus infection | 0.000180626 | 0.009356411 | C3, RT1-BA, RT1-BB,
RT1-DA |
| Chemical
carcinogenesis | 0.000316345 | 0.01365554 | CYP2C11, CYP2E1,
GSTM2, GSTM6, PTGS2, SULT1A1 |
| Antigen processing
and presentation | 0.000428187 | 0.01584293 | CD74, NFYA, RT1-BA,
RT1-BB, RT1-DA |
Discussion
SAH is considered to be an important cause of
mortality in stroke patients (1)
and EBI is an important characteristic of SAH. Early clinical
intervention can significantly reduce the incidence of sequelae and
rate of mortality (2), therefore,
identifying genes that affect the biological process of EBI is
essential for the treatment of SAH. Although LncRNAs have been
identified as important in the regulation of the pathophysiological
process of brain disease (24–26),
the expression profiles of LncRNAs in EBI following SAH remain to
be elucidated. The present study investigated the expression
profiles of LncRNAs in a rat SAH model and demonstrated that the
expression levels of a number of LncRNAs were either upregulated or
downregulated compared with the control group. Due to the abundance
and specific expression of LncRNAs in different regions of the
brain (18), these differentially
expressed LncRNAs may be potential disease markers and key
therapeutic targets.
According to the distribution of LncRNAs and
splicing forms in the chromosome, LncRNAs are divided into sense,
antisense, intronic, intergenic and bidirectional (10,27).
The present study revealed that the majority of the LncRNAs
belonged to these four categories. Additionally, several of the
differently expressed LncRNAs exhibited multiple splicing forms and
were correlated with multiple genes, including MRuc009bks, which
was associated with five genes (Zc3hav1, Ttc26, RGD1310722, Fmc1
and Luc7l2). These results indicated that the transcription and
regulatory mechanisms of LncRNAs are complex and require further
investigation. Previous studies have indicated that the regulatory
mechanisms of EBI correlate with multiple genes and are highly
complex (2). The identification of
these differentially expressed LncRNAs may provide further
understanding of the mechanism underlying these complex biological
regulatory processes.
In order to better understand these differentially
expressed mRNA genes, the KEGG and GO databases were used to
analyze their potential biological functions. The results revealed
that these differentially expressed mRNA genes were involved in
eight pathways, including ‘leishmaniasis’, ‘calcium signaling’,
‘tuberculosis’, ‘asthma’, ‘Staphylococcus aureus infection’,
‘chemical carcinogenesis’, ‘antigen processing and presentation’
and ‘neuroactive ligand-receptor interaction’. These pathways were
mainly associated with inflammation, which has been confirmed to
result in dysfunction of the blood brain barrier and brain edema
(28). Notably, the ‘neuroactive
ligand-receptor interaction’ term contained genes, including
cortistatin, which is associated with neuronal apoptosis and
neurodegenerative disease (29,30).
In addition, the ‘leishmaniasis pathway’, including iNOS, which is
involved in the SAH process and significantly inhibits its activity
has been found to ameliorate cerebral vasospasm following SAH
(8,31).
In conclusion, the present study was the first, to
the best of our knowledge, to investigate the expression profiles
of LncRNAs in SAH. The results demonstrated that the expression
levels of LncRNAs in SAH were significantly different compared with
those in the control group, suggesting that these LncRNAs may be
important in the pathophysiological process of SAH. However, the
rat SAH model used was only partially able to simulate a ruptured
cerebral aneurysm. In addition, LncRNAs have temporally and
spatially differential expression in the brain and the present
study only examined the expression of LncRNAs in the temporal lobe
cortex 24 h after SAH. Therefore, further studies are required to
describe and confirm the expression of LncRNAs in the brain
following SAH. LncRNAs may become potential future biological
targets and prognostic indicators for SAH.
Acknowledgments
This study was funded by the National Natural
Science Foundation of China (no. 81100854 to Bingjie Zheng and no.
81272788 to Shiguang Zhao) and The First Affiliated Hospital of
Harbin Medical University Foundation (no. 2011BS011 to Bingjie
Zheng).
References
|
1
|
Cahill J and Zhang JH: Subarachnoid
hemorrhage: is it time for a new direction? Stroke. 40:S86–S87.
2009. View Article : Google Scholar
|
|
2
|
Sehba FA, Hou J, Pluta RM and Zhang JH:
The importance of early brain injury after subarachnoid hemorrhage.
Prog Neurobiol. 97:14–37. 2012. View Article : Google Scholar : PubMed/NCBI
|
|
3
|
Aladag MA, Turkoz Y, Parlakpinar H, Ozen
H, Egri M and Unal SC: Melatonin ameliorates cerebral vasospasm
after experimental subarachnoidal haemorrhage correcting imbalance
of nitric oxide levels in rats. Neurochem Res. 34:1935–1944. 2009.
View Article : Google Scholar : PubMed/NCBI
|
|
4
|
Cahill J, Calvert JW, Solaroglu I and
Zhang JH: Vasospasm and p53-induced apoptosis in an experimental
model of subarachnoid hemorrhage. Stroke. 37:1868–1874. 2006.
View Article : Google Scholar : PubMed/NCBI
|
|
5
|
Cahill J, Calvert JW, Marcantonio S and
Zhang JH: p53 may play an orchestrating role in apoptotic cell
death after experimental subarachnoid hemorrhage. Neurosurgery.
60:531–545. 2007. View Article : Google Scholar : PubMed/NCBI
|
|
6
|
Yan J, Chen C, Hu Q, et al: The role of
p53 in brain edema after 24 h of experimental subarachnoid
hemorrhage in a rat model. Exp Neurol. 214:37–46. 2008. View Article : Google Scholar : PubMed/NCBI
|
|
7
|
Zhou C, Yamaguchi M, Colohan AR and Zhang
JH: Role of p53 and apoptosis in cerebral vasospasm after
experimental subarachnoid hemorrhage. J Cereb Blood Flow Metab.
25:572–582. 2005. View Article : Google Scholar : PubMed/NCBI
|
|
8
|
Zheng B, Zheng T, Wang L, Chen X, Shi C
and Zhao S: Aminoguanidine inhibition of iNOS activity ameliorates
cerebral vasospasm after subarachnoid hemorrhage in rabbits via
restoration of dysfunctional endothelial cells. J Neurol Sci.
295:97–103. 2010. View Article : Google Scholar : PubMed/NCBI
|
|
9
|
Vikman P, Beg S, Khurana TS,
Hansen-Schwartz J and Edvinsson L: Gene expression and molecular
changes in cerebral arteries following subarachnoid hemorrhage in
the rat. J Neurosurg. 105:438–444. 2006. View Article : Google Scholar : PubMed/NCBI
|
|
10
|
Kapranov P, Cheng J, Dike S, et al: RNA
maps reveal new RNA classes and a possible function for pervasive
transcription. Science. 316:1484–1488. 2007. View Article : Google Scholar : PubMed/NCBI
|
|
11
|
Chu C, Qu K, Zhong FL, Artandi SE and
Chang HY: Genomic maps of long noncoding RNA occupancy reveal
principles of RNA-chromatin interactions. Mol Cell. 44:667–678.
2011. View Article : Google Scholar : PubMed/NCBI
|
|
12
|
Ling H, Fabbri M and Calin GA: MicroRNAs
and other non-coding RNAs as targets for anticancer drug
development. Nat Rev Drug Discov. 12:847–865. 2013. View Article : Google Scholar : PubMed/NCBI
|
|
13
|
Yang L, Lin C, Jin C, et al:
LncRNA-dependent mechanisms of androgen-receptor-regulated gene
activation programs. Nature. 500:598–602. 2013. View Article : Google Scholar : PubMed/NCBI
|
|
14
|
Dharap A, Nakka VP and Vemuganti R: Effect
of focal ischemia on long noncoding RNAs. Stroke. 43:2800–2802.
2012. View Article : Google Scholar : PubMed/NCBI
|
|
15
|
Sun Y, Wang Z and Zhou D: Long non-coding
RNAs as potential biomarkers and therapeutic targets for gliomas.
Med Hypotheses. 81:319–321. 2013. View Article : Google Scholar : PubMed/NCBI
|
|
16
|
Tan L, Yu JT and Hu N: Non-coding RNAs in
Alzheimer’s disease. Mol Neurobiol. 47:382–393. 2013. View Article : Google Scholar
|
|
17
|
Wu P, Zuo X, Deng H, Liu X, Liu L and Ji
A: Roles of long noncoding RNAs in brain development, functional
diversification and neurodegenerative diseases. Brain Res Bull.
97:69–80. 2013. View Article : Google Scholar : PubMed/NCBI
|
|
18
|
Mercer TR, Dinger ME, Sunkin SM, Mehler MF
and Mattick JS: Specific expression of long noncoding RNAs in the
mouse brain. Proc Natl Acad Sci USA. 105:716–721. 2008. View Article : Google Scholar : PubMed/NCBI
|
|
19
|
Zhang J, Zhu Y, Zhou D, Wang Z and Chen G:
Recombinant human erythropoietin (rhEPO) alleviates early brain
injury following subarachnoid hemorrhage in rats: possible
involvement of Nrf2-ARE pathway. Cytokine. 52:252–257. 2010.
View Article : Google Scholar : PubMed/NCBI
|
|
20
|
Chou SH, Feske SK, Atherton J, et al:
Early elevation of serum tumor necrosis factor-alpha is associated
with poor outcome in subarachnoid hemorrhage. J Investig Med.
60:1054–1058. 2012.PubMed/NCBI
|
|
21
|
Jiang Y, Liu DW, Han XY, et al:
Neuroprotective effects of anti-tumor necrosis factor-alpha
antibody on apoptosis following subarachnoid hemorrhage in a rat
model. J Clin Neurosci. 19:866–872. 2012. View Article : Google Scholar : PubMed/NCBI
|
|
22
|
Sozen T, Tsuchiyama R, Hasegawa Y, et al:
Role of interleukin-1beta in early brain injury after subarachnoid
hemorrhage in mice. Stroke. 40:2519–2525. 2009. View Article : Google Scholar : PubMed/NCBI
|
|
23
|
Li JP, Liu LH, Li J, et al: Microarray
expression profile of long noncoding RNAs in human osteosarcoma.
Biochem Biophys Res Commun. 433:200–206. 2013. View Article : Google Scholar : PubMed/NCBI
|
|
24
|
Ng SY, Lin L, Soh BS and Stanton LW: Long
noncoding RNAs in development and disease of the central nervous
system. Trends Genet. 29:461–468. 2013. View Article : Google Scholar : PubMed/NCBI
|
|
25
|
Qureshi IA, Mattick JS and Mehler MF: Long
non-coding RNAs in nervous system function and disease. Brain Res.
1338:20–35. 2010. View Article : Google Scholar : PubMed/NCBI
|
|
26
|
Qureshi IA and Mehler MF: Long Non-coding
RNAs: Novel targets for nervous system disease diagnosis and
therapy. Neurotherapeutics. 10:632–646. 2013. View Article : Google Scholar : PubMed/NCBI
|
|
27
|
Huang Y, Liu N, Wang JP, et al: Regulatory
long non-coding RNA and its functions. J Physiol Biochem.
68:611–618. 2012. View Article : Google Scholar : PubMed/NCBI
|
|
28
|
Ostrowski RP, Colohan AR and Zhang JH:
Molecular mechanisms of early brain injury after subarachnoid
hemorrhage. Neurol Res. 28:399–414. 2006. View Article : Google Scholar : PubMed/NCBI
|
|
29
|
Diniz L, dos Santos TB, Britto LR, et al:
Effects of chronic treatment with corticosterone and imipramine on
fos immunoreactivity and adult hippocampal neurogenesis. Behav
Brain Res. 238:170–177. 2013. View Article : Google Scholar
|
|
30
|
Zhang H, Liu B, Wu J, et al: Icariin
inhibits corticosterone-induced apoptosis in hypothalamic neurons
via the PI3-K/Akt signaling pathway. Mol Med Rep. 6:967–972.
2012.PubMed/NCBI
|
|
31
|
O’Connor DM and O’Brien T: Nitric oxide
synthase gene therapy: Progress and prospects. Expert Opin Biol
Ther. 9:867–878. 2009. View Article : Google Scholar
|