Introduction
Colorectal cancer (CRC) is the third most common
cancer in males and the second most common cancer in females,
accounting for 1.2 million novel cancer cases and 608,700
mortalities worldwide in 2008 (1).
According to the American Cancer Society, 136,830 novel cases and
50,310 mortalities from CRC were estimated for 2014 in the United
States (2). Despite improved
medical treatments and increased awareness for early detection,
approximately 25% of CRC patients present with distant metastases
at initial diagnosis and nearly 50% will develop metastases
(3). Moreover, the relative
five-year survival rate of CRC patients with metastases is only 10%
(4). It has been widely accepted
that conventional therapeutic strategies are helpful for clinical
treatment; however, they are far from sufficient. Deficiencies of
the current therapies for CRC may be partly due to the limited
understanding of its underlying molecular mechanisms.
It is now well established that a developmental
regulatory program, known as the epithelial-mesenchymal transition,
(EMT), broadly participates in invasion and metastasis of
neoplastic malignancies (5).
Through the EMT program, cancer cells can acquire enhanced
abilities to resist apoptosis, to invade and to migrate. The EMT
program is also known as a cadherin switching process leading to
loss of E-cadherin and gain of N-cadherin (6). E-cadherin, a transmembrane protein
mediating cell-cell adhesion, has been widely known as a tumor
suppressor and the best-characterized molecular marker of the EMT
(7). Loss of E-cadherin has been
reported to exert an unfavorable impact on the overall survival
rate of CRC patients (8). However,
N-cadherin, a transmembrane protein similar to E-cadherin, has been
reported to be abnormally expressed in multiple tumors, including
pancreatic (9), gastric (10) and hepatocellular (11) cancers. High expression of
N-cadherin predicts poor outcome in patients with superficial
urothelial carcinoma and gallbladder cancer (12,13).
Moreover, cellular studies have suggested that N-cadherin is able
to drive numerous hallmarks of cancer, including proliferation
(14), invasion (15), metastasis (16) and resistance to chemotherapy
(17).
Despite the increasing number of studies on
N-cadherin, its role in CRC has remained elusive. The present study
demonstrated for the first time, to the best of our knowledge, that
high expression of N-cadherin may be associated with the malignant
progression of CRC and predict poor prognosis in CRC patients.
Furthermore, in vitro RNA interference techniques were used
to investigate the role of N-cadherin in the proliferation and
migration, and therefore, the EMT of CRC cells.
Materials and methods
Tissue samples and patient data
In the present study, a total of 23 fresh primary
CRC tissues and their adjacent normal tissues were prepared for
quantitative real-time polymerase chain reaction and western blot
analyses. In addition, a total of 102 paraffin-embedded primary CRC
tissues and their adjacent normal tissues were prepared for
immunohistochemical analysis. The specimens were collected from
patients with CRC undergoing surgery at Department of Surgery, The
Sixth People’s Hospital affiliated to Shanghai Jiao Tong University
(Shanghai, China). Table I shows
the basic clinical characteristics of patients in the present
study. None of the patients had received pre-operative chemotherapy
or radiotherapy. Overall survival (OS) is defined as the interval
from the date of surgery to the date of death, or the date of the
last follow-up. Disease-free survival (DFS) is defined as the
interval from the date of surgery to the date of tumor recurrence
and progression. Prior to using tissue specimens in the present
study, approval by the ethics committee of the Sixth People’s
Hospital affiliated to Shanghai Jiao Tong University and written
informed consent from patients were obtained.
 | Table ICorrelation between N-cadherin
expression and clinicopathological characteristics in patients with
colorectal cancer. |
Table I
Correlation between N-cadherin
expression and clinicopathological characteristics in patients with
colorectal cancer.
| Characteristic | Total (n) | N-cadherin
| P-value |
|---|
| High expression
(n) | Low expression
(n) |
|---|
| Gender | | | | 0.829 |
| Male | 60 | 42 | 18 | |
| Female | 42 | 28 | 14 | |
| Age (years) | | | | 0.389 |
| ≤60 | 41 | 26 | 15 | |
| >60 | 61 | 44 | 17 | |
| Tumor location | | | | 0.392 |
| Colon | 56 | 36 | 20 | |
| Rectum | 46 | 34 | 12 | |
| Tumor
differentiation | | | | 0.007 |
| Well | 35 | 18 | 17 | |
| Moderate | 31 | 21 | 10 | |
| Poor | 36 | 31 | 5 | |
| Tumor size (cm) | | | | 0.031 |
| ≤5 | 60 | 36 | 24 | |
| >5 | 42 | 34 | 8 | |
| Tumor invasion | | | | 0.021 |
| T1 | 11 | 5 | 6 | |
| T2 | 34 | 19 | 15 | |
| T3 | 42 | 35 | 7 | |
| T4 | 15 | 11 | 4 | |
| Lymph node
metastasis | | | | 0.001 |
| Present | 57 | 47 | 10 | |
| Absent | 45 | 23 | 22 | |
| Distant
metastasis | | | | 0.010 |
| Present | 49 | 40 | 9 | |
| Absent | 53 | 30 | 23 | |
Reverse transcription quantitative
polymerase chain reaction (RT-qPCR)
Total RNA was isolated using TRIzol (Invitrogen Life
Technologies, Carlsbad, CA, USA) according to the manufacturer’s
instructions. The isolated RNA was reversely transcribed into cDNA
by Superscript III Reverse Transcriptase (Promega, Madison, WI,
USA). PCR amplification of the cDNA template was then performed
using SYBR Green mix (TaKaRa, Otsu, Japan) using a StepOne Plus
Real-Time PCR System (Applied Biosystems, Thermo Fisher Scientific,
Waltham, MA, USA). The reaction conditions were as follows: 95°C
for 30 sec, 40 cycles of 95°C for 5 sec and 60°C for 30 sec. The
reactions were repeated in triplicate and the data were normalized
to β-actin. The products of RT-qPCR were electrophoresed on 2%
agarose gel (BD Biosciences, San Jose, CA, USA) using Tris/Boric
Acid/EDTA buffer (BD Biosciences). An AlphaImager Gel Documentation
system (ProteinSimple, San Jose, CA, USA) was then used to detect
product size. The 2−ΔΔT method was employed to calculate
the relative expression levels of the genes. The sequences of PCR
primers (Invitrogen Life Technologies) used in the present study
were as follows: N-cadherin (CDH2) forward,
5′-CAAGATGGGTCAATGGAAATAG-3′ and reverse,
5′-CTCAGGAATACGAGCCTTCAC-3′; E-cadherin (CDH1) forward,
5′-AAGACAAAGAAGGCAAGGT-3′ and reverse, 5′-AGAGAGTGTATGTGGCAATG-3′;
β-actin forward, 5′-AAGGTGACAGCAGTCGGTT-3′ and reverse,
5′-TGTGTGGACTTGGGAGAGG-3′.
Western blot analysis
Protein extracted from fresh tissues was separated
by 10% SDS-PAGE [JRDUN Biotechnology (Shanghai) Co., Ltd.,
Shanghai, China] and transferred to a nitrocellulose membrane
(Merck Millipore, Billerica, MA, USA). The membrane was blocked
with 5 g skimmed milk powder (BD Biosciences) in 100 ml
Tris-buffered saline [JRDUN Biotechnology (Shanghai) Co., Ltd.]
containing 0.05% Tween-20 (Amresco LLC, Solon, OH, USA) (TBST) for
1 h at room temperature. The membrane was then incubated with
rabbit polyclonal anti-N-cadherin (1:5,000; cat. no. ab18203;
Abcam, Cambridge, MA, USA) and rabbit polyclonal anti-β-actin
(1:3,000; cat. no. P30002; Abmart, Shanghai, China) overnight at
4°C. β-actin was used as an internal control. Following incubation
with goat anti-rabbit horseradish peroxidase-conjugated
immunoglobulin (Ig)G (1:2,000; cat. no. M21002; Abmart) for 2 h at
37°C, an enhanced chemiluminescence reagent (Santa Cruz
Biotechnology, Inc., Dallas, TX, USA) was employed for protein
detection. After incubation with enhanced chemiluminescence reagent
for 5 min, the membrane was visualized for 30 sec using
photographic film (Kodak, Rochester, NY, USA) in a cassette
(Kodak). Finally, the film was incubated with developing solution
(Shanghai Sanlian Group Co., Ltd., Shanghai, China) for 2 min and
fixing solution (Shanghai Sanlian Group Co., Ltd.) for 1 min.
Immunohistochemistry and staining
evaluation
Paraffin-embedded tissue specimens were cut into
4-μm sections. The sections were deparaffinized in xylene and
dehydrated in ethanol (Sinopharm Chemical Reagent Co., Ltd.,
Shanghai, China). Following antigen retrieval by microwave for 25
min, 0.3% hydrogen peroxide and methanol (Sinopharm Chemical
Reagent Co., Ltd.) were used to block endogenous peroxidase
activity. The sections were then incubated with rabbit polyclonal
anti-N-cadherin (1:150) and rabbit monoclonal anti-E-cadherin
(1:150; cat. no. ab40772; Abcam) overnight at 4°C. After three
washes with phosphate-buffered saline (PBS; Sinopharm Chemical
Reagent Co., Ltd.), the sections were incubated with polyclonal
goat anti-rabbit IgG (1:250; cat. no. ab150077; Abcam) for 25 min
at 37°C. Finally, the sections were incubated with diaminobenzidine
(Invitrogen Life Technologies) for 5 min and counterstained with
hematoxylin (Invitrogen Life Technologies) for 2 min. Sections
incubated with PBS instead of primary antibody were utilized as
negative controls.
Staining evaluation was performed by two independent
researchers blinded to the clinicopathological characteristics of
the patients. Five bright fields were randomly selected for
evaluation. The semi-quantitative staining evaluation was strictly
based on a product of Staining Intensity (SI) and Percentage of
Positive cells (PP). SI was determined as follows: Negative (score
0), weak (score 1), moderate (score 2) and strong (score 3). PP was
determined as follows: 0 (score 0), ≤10% (score 1), 11–50% (score
2), 51–80% (score 3), >80% (score 4). A final staining score of
0–3 or 3–12 indicated low or high expression, respectively.
Cell culture
All the CRC cell lines (HCT-116, RKO, DLD-1, HT-29
and Caco-2) were purchased from the Type Culture Collection of the
Chinese Academy of Sciences (Shanghai, China). The HCT-116 and
HT-29 cell lines were maintained in McCoy’5a culture medium
(Sigma-Aldrich, St Louis, MO, USA). The RKO and Caco-2 cell lines
were maintained in MEM culture medium (Sigma-Aldrich). The DLD-1
cell line was maintained in RPMI-1640 culture medium
(Sigma-Aldrich). All culture media were supplemented with 10% fetal
bovine serum (Gibco-BRL, Invitrogen Life Technologies) and 1%
penicillin/streptomycin (Gibco-BRL, Invitrogen Life Technologies)
at 37°C in a 5% CO2 humidified atmosphere.
Small interfering RNA transfection
Small interfering RNA (siRNA) for N-cadherin
(Invitrogen Life Technologies) was employed to down-regulate the
expression of N-cadherin in cell lines as described previously
(14,17). The siRNA sequence was
5′-CUAACAGGGAGUCAUAUGGUGGAGC-TdT-3′. A negative control siRNA was
also purchased from Invitrogen Life Technologies and was used for
minimizing nonspecific effects. The sequence of the control siRNA
was 5′-TTCTCCGAACGTGTCACGT-3′. siRNA transfection was performed
with Lipofectamine 2000 transfection reagent (Invitrogen Life
Technologies) according to the manufacturer’s instructions. 24–48 h
after transfection, the cells were collected for the subsequent
assays.
MTT assay
The MTT assay was employed to determine the growth
of cells following transfection. Briefly, the cells were seeded
into 96-well plates at a density of 3×10³ cells per
well. 24, 48 and 72 h following transfection, 150 μl culture medium
containing 0.5 mg/ml MTT was added into each well and the cells
were incubated at 37°C for 4 h. Following removal of the culture
medium, DMSO was added to dissolve the purple precipitate. Finally,
the absorbance at a wavelength of 490 nm was measured using a
SpectraMax 340PC384 microplate reader (Molecular Devices,
Sunnyvale, CA, USA). The assay was repeated three times
independently.
Wound healing assay
To assess cell migration, the wound healing assay
was performed according to a method by Liang et al (18). Briefly, the cells were cultured in
each well to reach 90% confluence. Following aspiration of the
medium, a sterile pipette tip was used to create a wound in the
cell monolayer. The cells were then washed twice and re-cultured
with serum-free medium. Following 24 h, the wound was monitored and
photographed by a CX41 biological microscope (Olympus Corporation,
Tokyo, Japan). The assay was repeated three times
independently.
Statistical analysis
All values are presented as the mean ± standard
deviation. SPSS 17.0 statistical software (SPSS, Inc., Chicago, IL,
USA) was used for statistical analysis. Differences between two
groups were determined using the two-tailed Student’s t-test.
Correlations between N-cadherin expression and clinicopathological
parameters were determined using the χ2 test, while the
correlation between N-cadherin and E-cadherin expression was
determined by a non-parametric Spearman’s rank correlation
coefficient. Survival curves were generated using the Kaplan-Meier
model and the difference between the survival of subgroups was
compared using the log-rank test. Significant independent
prognostic factors were identified by multivariate analysis based
on the Cox proportional hazard model. A P-value <0.05 was
considered to indicate a statistically significant difference
between values.
Results
N-cadherin expression in CRC tissues and
adjacent normal tissues
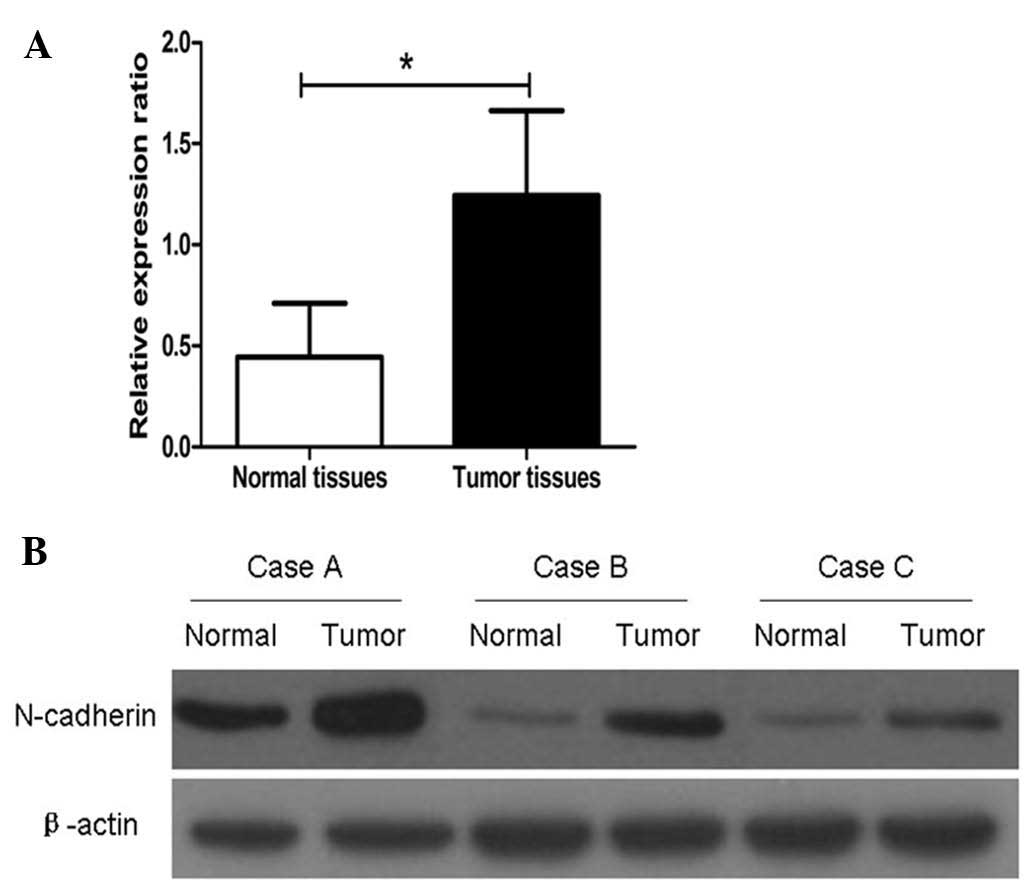
Firstly, the mRNA expression of N-cadherin was
assessed in CRC tissues and adjacent normal tissues. The results
showed that the N-cadherin mRNA expression was upregulated in 19 of
the 23 CRC tissues compared with those in adjacent normal tissues.
As shown in Fig. 1A, the relative
mean expression of N-cadherin mRNA in CRC tissues (1.24±0.42) was
significantly higher than that in adjacent normal tissues
(0.44±0.27, P=0.0028). Western blot analysis showed that N-cadherin
protein levels were similar to mRNA levels in the CRC and adjacent
normal tissues (Fig. 1B).
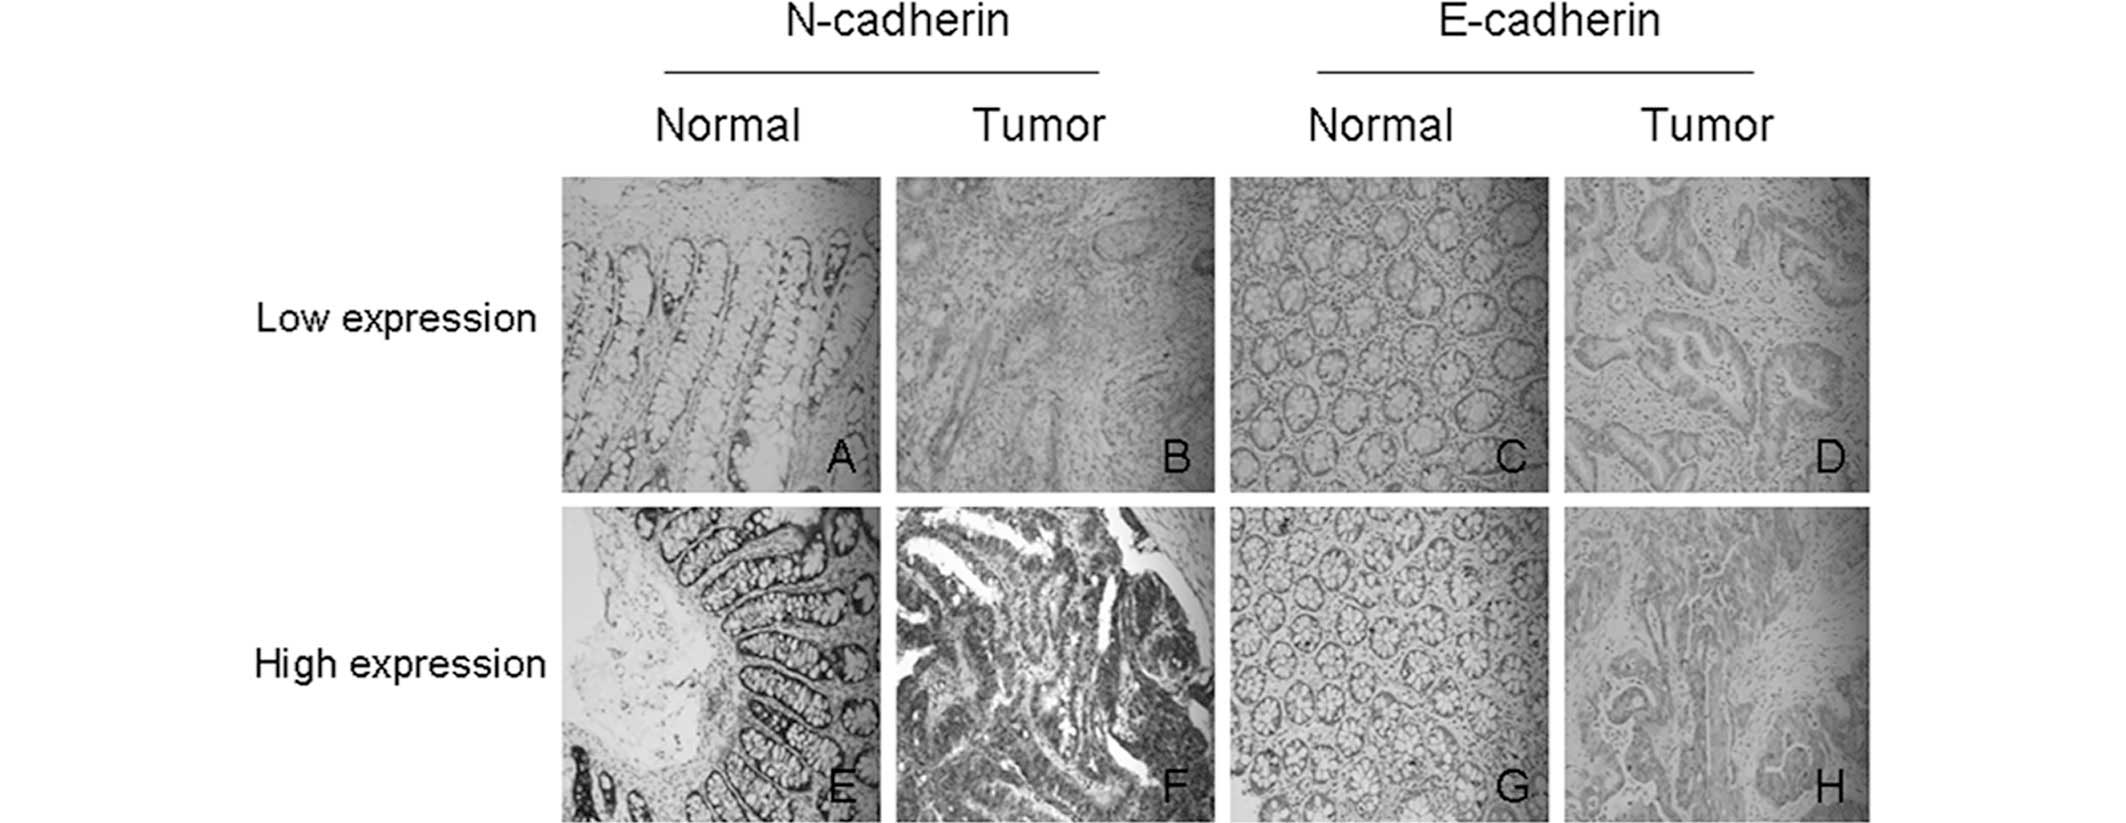
Moreover, immunohistochemical analysis was performed to detect
protein expression of N-cadherin in 102 paraffin specimens. The
results showed that high expression of N-cadherin was present in
68.6% (70/102) of CRC tissues. Figure
2 shows representative results of immunohistochemical staining
for N-cadherin.
Correlation between the protein
expression of N-cadherin and clinicopathological parameters
Correlations between the protein expression of
N-cadherin and clinicopathological parameters are summarized in
Table I. N-cadherin expression was
significantly correlated with tumor differentiation (P=0.007),
tumor size (P=0.031), tumor invasion (P=0.021), lymph node
metastasis (P=0.001) and distant metastasis (P=0.010). However,
N-cadherin expression was not correlated with other parameters,
including gender (P=0.829), age (P=0.389) and tumor location
(P=0.392).
Expression of E-cadherin and its
correlation with N-cadherin in CRC tissues
Since previous studies showed that N-cadherin is
involved in the EMT in certain tumor types and E-cadherin is the
best-characterized molecular marker of the EMT, the present study
performed immunohistochemical staining for E-cadherin in CRC
tissues and investigated its possible association with N-cadherin
(Fig. 2; Table II). According to the established
evaluation principles applied, high expression of E-cadherin was
only detected in 37.3% (38/102) of CRC tissues. Moreover,
correlation analysis suggested that the expression of N-cadherin
and E-cadherin were negatively correlated (r=−0.528, P<0.001;
Table II). Fig. 2 shows representative results of
immunohistochemical staining for E-cadherin.
| Table IICorrelation between N-cadherin
expression and E-cadherin expression in colorectal cancers. |
Table II
Correlation between N-cadherin
expression and E-cadherin expression in colorectal cancers.
| N-cadherin
expression | Total (n) | E-cadherin
| r | P-value |
|---|
| Low expression
(n) | High expression
(n) |
|---|
| Low | 32 | 8 | 24 | −0.528 | <0.001 |
| High | 70 | 56 | 14 | | |
Prognostic significance of N-cadherin and
E-cadherin in CRC patients
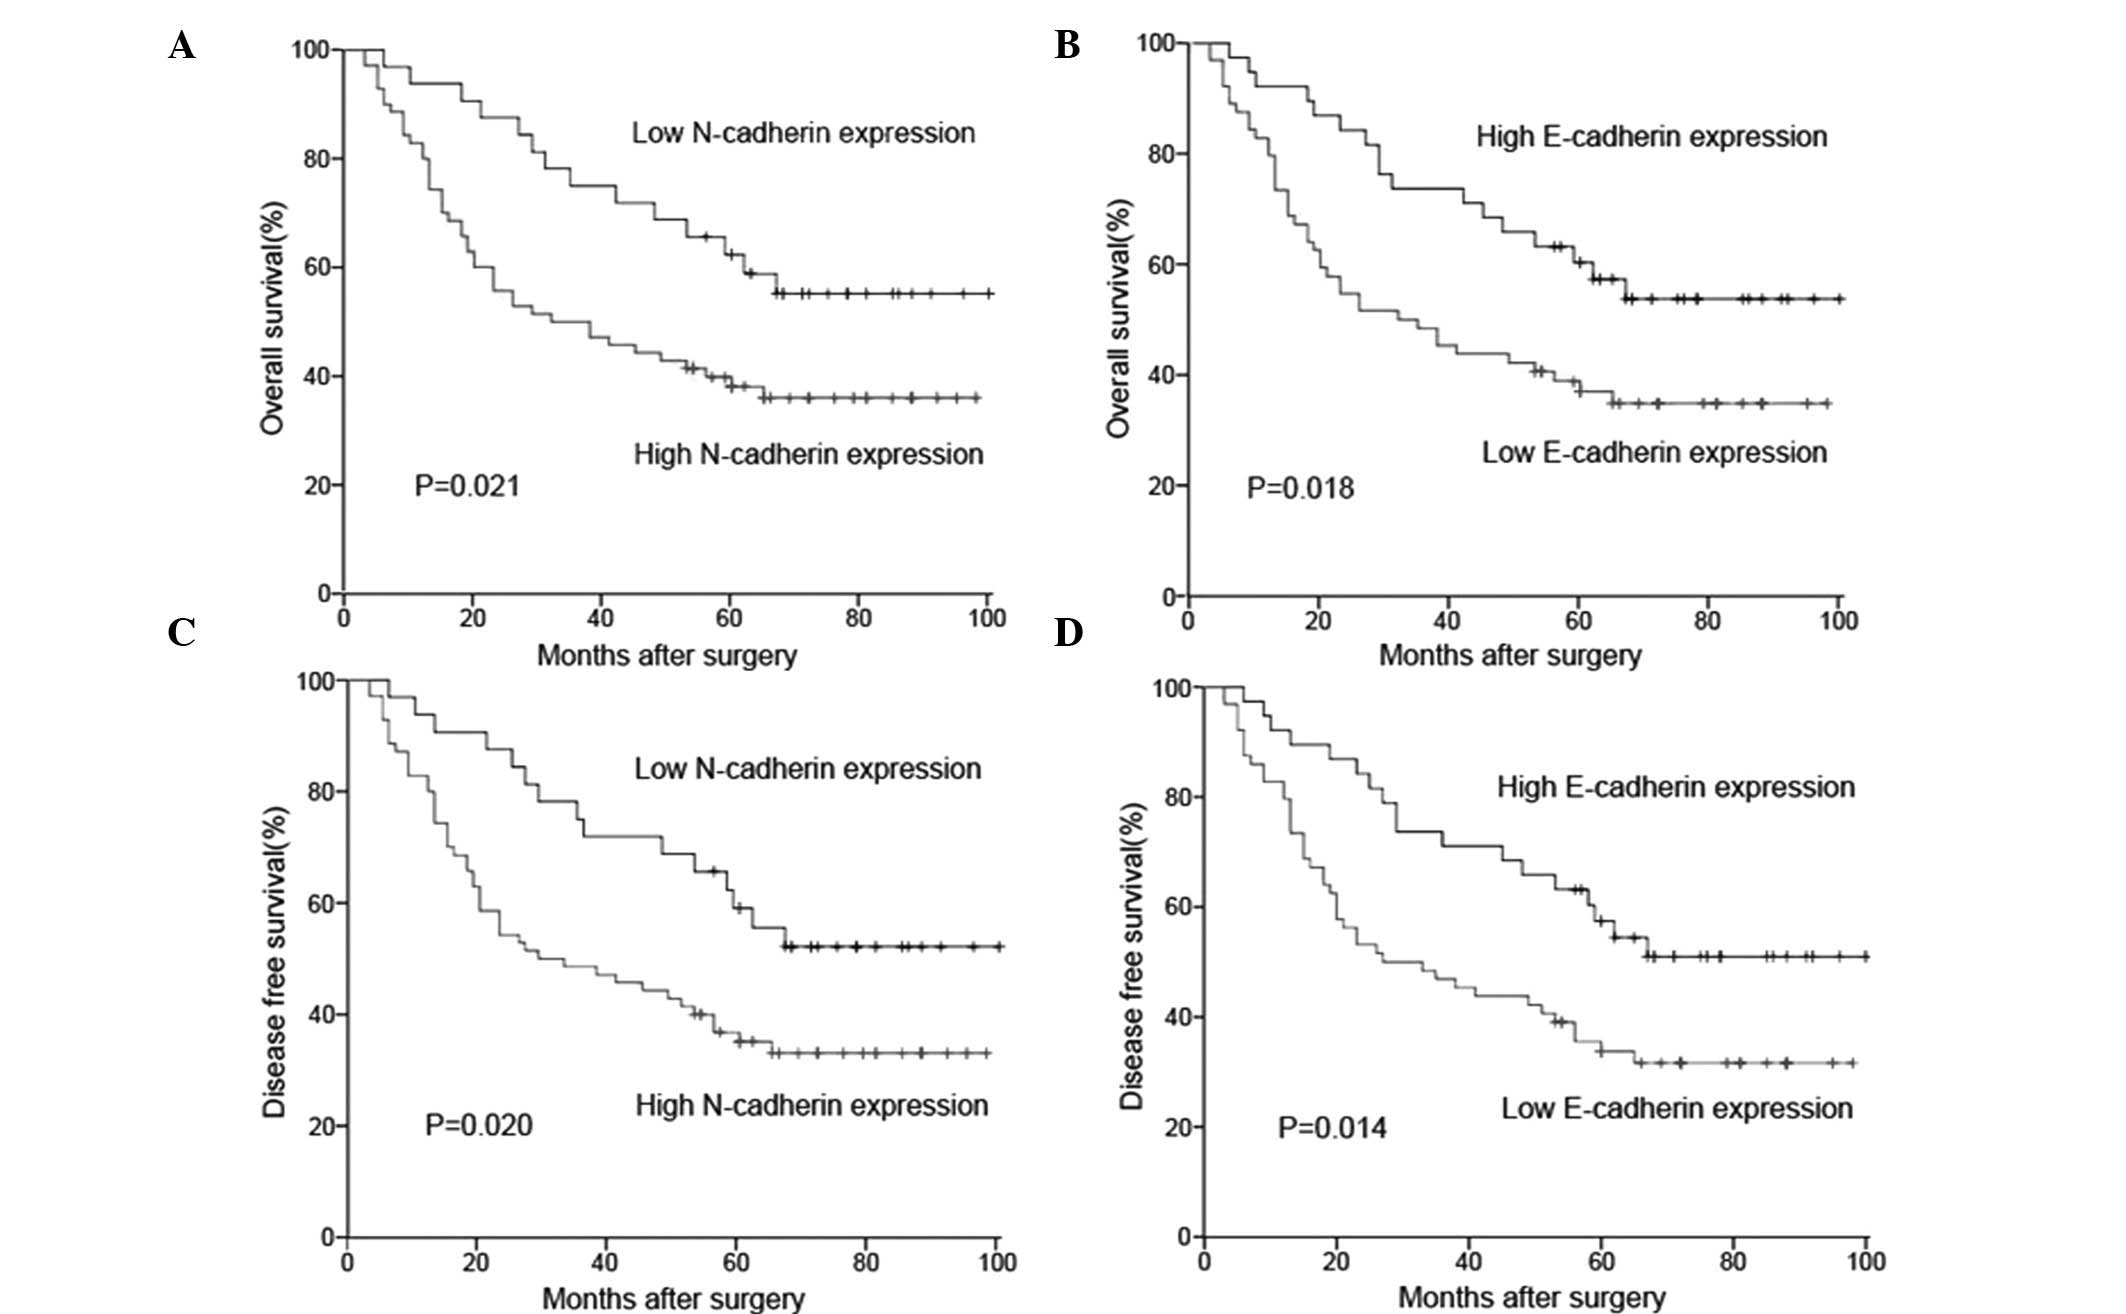
The association between the protein expression and
prognosis for CRC patients was investigated by Kaplan-Meier
survival analysis (Fig. 3). The
log-rank test indicated that the OS rate of patients with high
N-cadherin expression was significantly lower than that in patients
with low N-cadherin expression (Fig.
3A, P=0.021). However, the OS rate of patients with high
E-cadherin expression was significantly higher than that of
patients with low E-cadherin expression (Fig. 3B, P=0.018). Similar results were
also observed in the DFS survival analysis (N-cadherin, P=0.020,
Fig. 3C; E-cadherin, P=0.014,
Fig. 3D).
As shown in Table
III, univariate analysis suggested that N-cadherin expression,
E-cadherin expression, tumor differentiation, tumor invasion, lymph
node metastasis and distant metastasis were significant prognostic
factors for CRC patients (P=0.001, P=0.014, P=0.041, P=0.033,
P=0.030 and P=0.006, respectively), while other clinicopathological
parameters such as gender and age were not. Moreover, multivariate
analysis indicated that N-cadherin expression, E-cadherin
expression and distant metastasis were independent prognostic
factors for CRC patients (P=0.012, P=0.028 and P=0.026,
respectively).
| Table IIIUnivariate and multivariate analysis
of factors influencing the overall survival rate of colorectal
cancer patients. |
Table III
Univariate and multivariate analysis
of factors influencing the overall survival rate of colorectal
cancer patients.
| Variable | Univariate analysis
| Multivariate
analysis
|
|---|
| HR | 95% CI | P-value | HR | 95% CI | P-value |
|---|
| N-cadherin
expression | 3.209 | 1.651–6.238 | 0.001 | 2.672 | 1.241–5.753 | 0.012 |
| E-cadherin
expression | 2.229 | 1.180–4.214 | 0.014 | 2.135 | 1.085–4.203 | 0.028 |
| Age | 1.226 | 0.718–2.094 | 0.456 | 1.286 | 0.734–2.253 | 0.378 |
| Gender | 0.964 | 0.572–1.626 | 0.892 | 0.795 | 0.454–1.392 | 0.422 |
| Tumor location | 0.936 | 0.558–1.571 | 0.803 | 1.047 | 0.598–1.833 | 0.871 |
| Tumor
differentiation | 1.806 | 1.025–3.182 | 0.041 | 0.881 | 0.463–1.679 | 0.701 |
| Tumor size | 0.698 | 0.408–1.193 | 0.189 | 0.451 | 0.246–0.826 | 0.100 |
| Tumor invasion | 1.806 | 1.049–3.109 | 0.033 | 1.321 | 0.723–2.417 | 0.366 |
| Lymph node
metastasis | 1.806 | 1.060–3.076 | 0.030 | 1.362 | 0.763–2.431 | 0.296 |
| Distant
metastasis | 2.092 | 1.232–3.552 | 0.006 | 1.923 | 1.081–3.421 | 0.026 |
Silencing N-cadherin inhibits
proliferation and migration of CRC cells by reversing the EMT
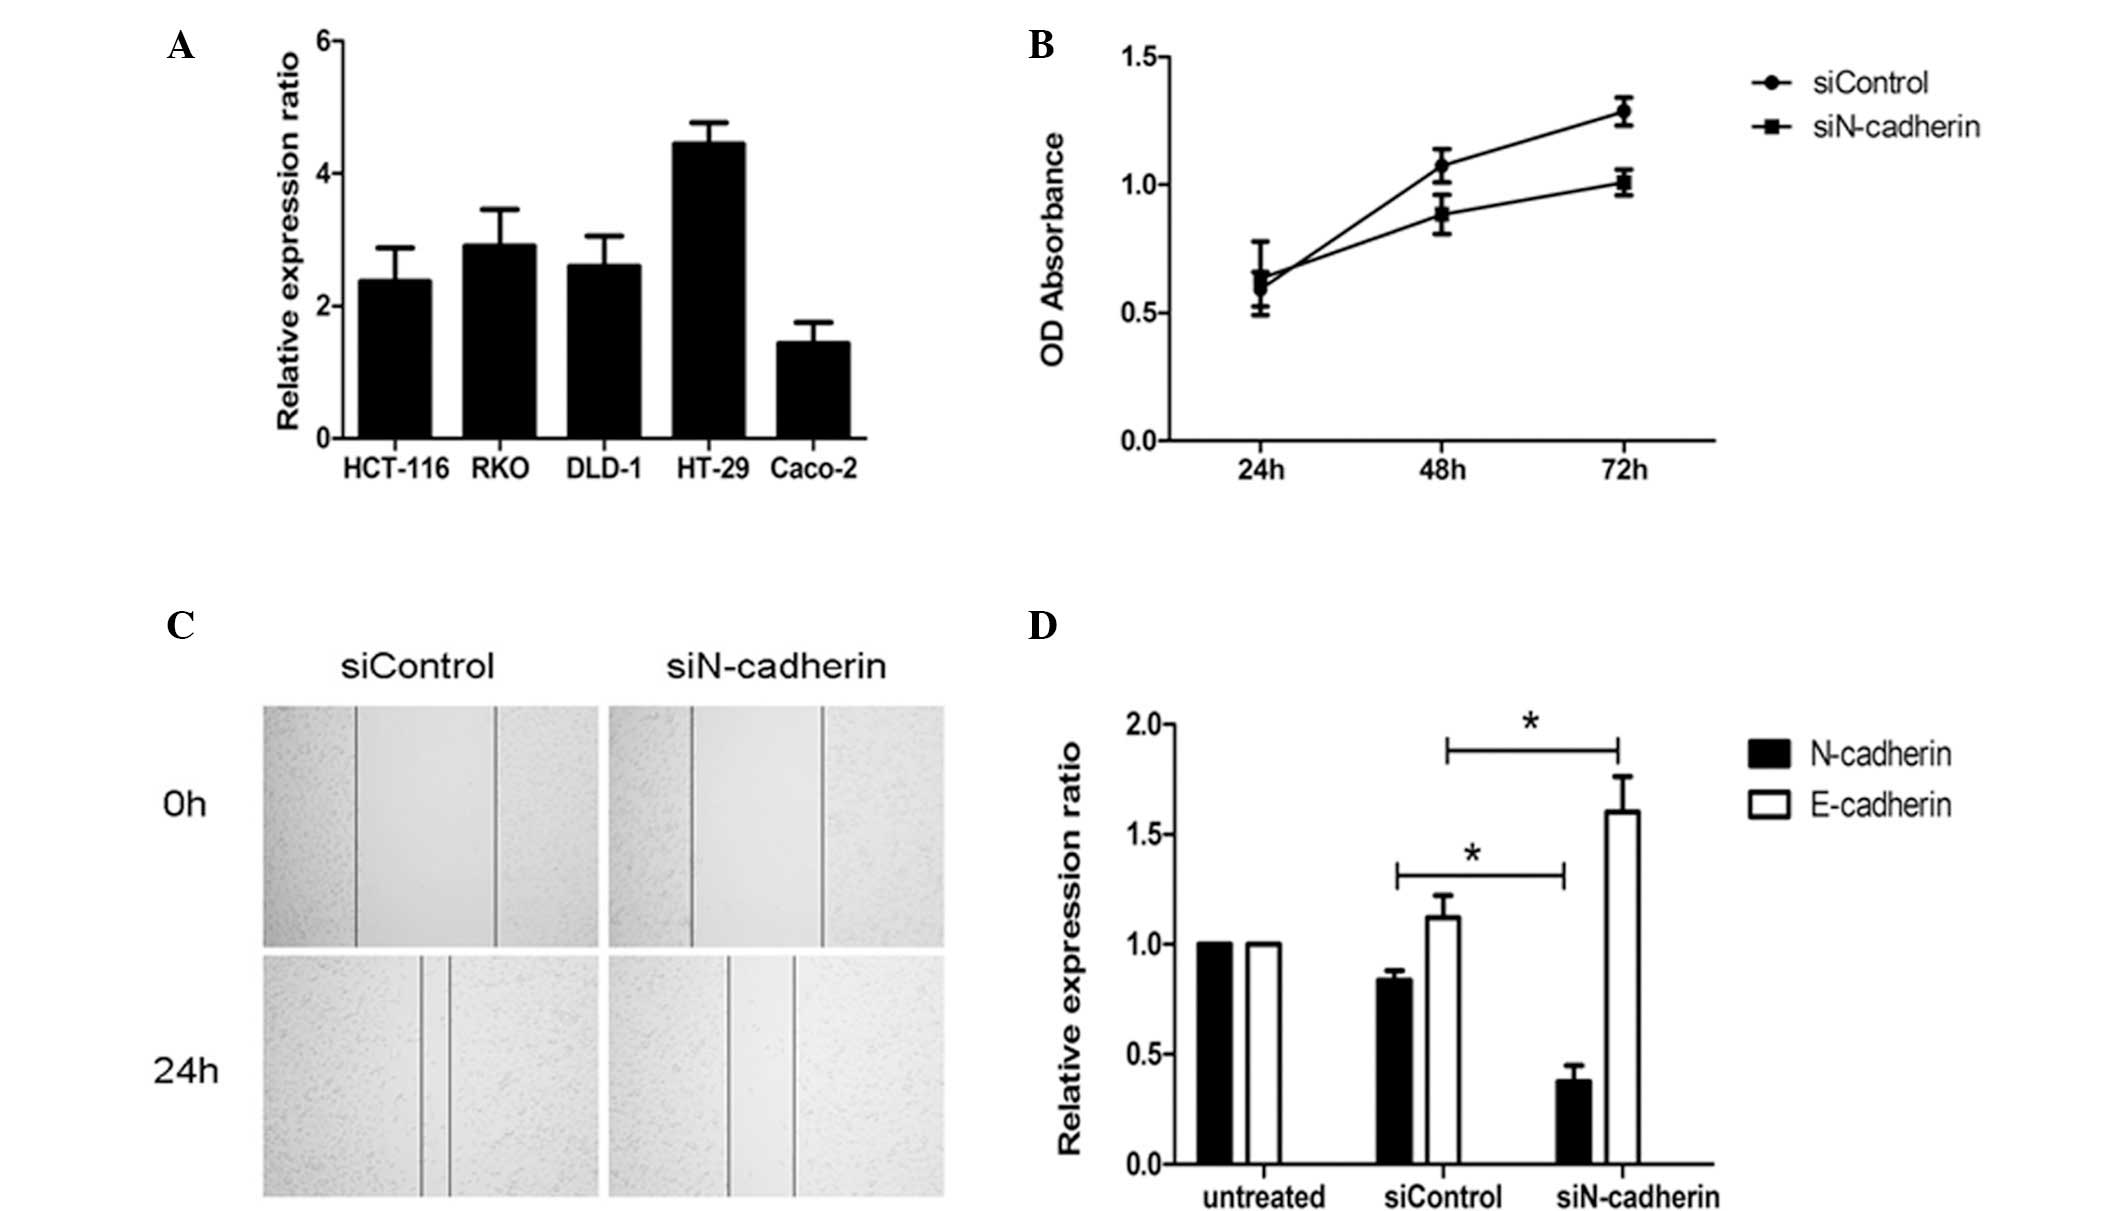
The mRNA expression of N-cadherin in CRC cell lines
was detected by RT-qPCR. As shown in Fig. 4A, N-cadherin was expressed in all
CRC cell lines, while expression was significantly higher in the
HT-29 cell line than that in the other cell lines assessed (HT-29
vs. HCT116, P=0.0042; HT-29 vs. RKO, P=0.0147; HT-29 vs. DLD-1,
P=0.0049; HT-29 vs. Caco-2, P=0.0004). Therefore, the HT-29 cell
line was selected for the subsequent assays. Following
transfection, the proliferation of the HT-29 cell line was assessed
using the MTT method and the results demonstrated that the
proliferation of cells in the N-cadherin-silenced group was
inhibited compared with the control group transfected with a mock
small interfering RNA (Fig. 4B).
Furthermore, the migration of the HT-29 cell line was monitored by
wound healing assay and the results indicated that the migration
rate in the N-cadherin-silenced group was significantly lower than
that in the control-transfected group (Fig. 4C). Of note, following silencing of
N-cadherin in the HT-29 cell line, the expression of E-cadherin was
upregulated (Fig. 4D). This
interesting observation confirmed the results of the
immunohistochemical assays and suggested that N-cadherin may
promote the initiation and development of CRC partly by inducing
the EMT.
Discussion
The development of CRC is a multistep process
involving mutational inactivation of tumor-suppressor genes and
activation of oncogene pathways (19). A comprehensive understanding of CRC
on a molecular level is of great benefit for early detection,
targeted therapy and prognosis. Emerging studies have suggested the
EMT as an important molecular mechanism underlying the initiation
and progression of CRC (20).
During the progression of the EMT, cell-cell junctions are lost and
epithelial markers such as E-cadherin are replaced by N-cadherin
and vimentin, which are commonly defined as mesenchymal markers
(21). Despite the increasing
number of studies on the tumorigenic roles of mesenchymal markers,
knowledge on their roles in CRC remains far from sufficient.
Toiyama et al (22)
analyzed the vimentin expression in surgical tissue specimens and
found that high expression of vimentin was significantly associated
with poor disease-free survival of CRC patients. However, with
regard to N-cadherin, only a few studies are available on its
clinical significance and less is known about its specific role in
CRC (12,13).
The present study showed that the expression of
N-cadherin was significantly higher in CRC tissues than that in
normal tissues. Further experiments demonstrated that N-cadherin
expression was associated with tumor differentiation, tumor size as
well as tumor, nodes and metastasis stage, suggesting a potential
role of N-cadherin in CRC progression. It was also found that OS
and DFS were better in patients with low N-cadherin expression than
those in patients with high N-cadherin expression. Through
multivariate analysis, it was found that high N-cadherin expression
was an independent prognostic factor for CRC patients. These
results are consistent with those of previous studies on other
tumor types, reporting that high expression of N-cadherin was able
to predict poor prognosis in bladder cancer (12) and gallbladder cancer (13). Furthermore, the present study also
investigated the expression of E-cadherin in CRC tissues and
explored the possible association between E-cadherin and
N-cadherin. Correlation analysis suggested that N-cadherin
expression was negatively associated with E-cadherin expression,
implying a possible role of N-cadherin in inducing the EMT of
CRC.
To investigate the specific biological role of
N-cadherin in CRC cells, RNA interference was employed to
down-regulate N-cadherin expression in the HT-29 cell line. Of
note, following N-cadherin silencing, the proliferative and
migratory ability of HT-29 cells was impaired, indicating that
N-cadherin may induce metastatic potential in CRC cells. Moreover,
E-cadherin expression was up-regulated following N-cadherin
silencing, which confirmed the results of the immunohistochemical
analysis. Loss of E-cadherin is the best-characterized marker of
the EMT, and therefore, the results indicated that N-cadherin may
promote CRC progression partly by inducing EMT. This deduction is
also in accordance with a study by Zhang et al (17), which reported that N-cadherin
accelerated the proliferation and invasion of erlotinib-resistant
lung cancer cell lines by inducing the EMT. Another supporting
study also demonstrated that N-cadherin overexpression promotes
growth, invasion and metastasis in castration-resistant prostate
cancer via EMT (23). In spite of
the increasing number of studies on the biological roles of
N-cadherin in cancer cells, the present study was the first, to the
best of our knowledge, to demonstrate that N-cadherin promotes
growth and migration of CRC cells.
Since N-cadherin is regarded as a versatile
oncoprotein due to its stimulation of proliferation, invasion,
metastasis and angiogenesis (24),
pre-clinical tests using N-cadherin interference in animal models
have been performed on several tumor types. Su et al
(25) found that interference with
N-cadherin expression by a monoclonal antibody can effectively
prolong survival in a spontaneous highly metastatic pancreatic
cancer model. ADH-1, a novel pentapeptide antagonizing N-cadherin,
has been proved to markedly augment the anti-tumor effects of
chemotherapy in animal models of melanoma (26). Of note, although ADH-1 has been
recently evaluated in phase I clinical trials on patients with
advanced tumors and has achieved satisfactory responses (27,28),
it was also reported to promote tumor growth by activating AKT
signaling (29). Therefore,
further studies based on cellular and animal models for
investigating the complex interaction between tumor cells and
targeted treatment for N-cadherin are required.
In summary, the present study demonstrated that
N-cadherin expression was upregulated in CRC tissues and negatively
correlated with E-cadherin expression. Furthermore, high expression
of N-cadherin may be an independent prognostic factor for CRC
patients. Moreover, in vitro assays showed that N-cadherin
may promote proliferation and migration of CRC cells, partly by
inducing the EMT. In conclusion, these findings suggested that
N-cadherin is an effective potential target for the treatment of
CRC. However, further cellular assays and animal models studies are
required to explore the specific role of N-cadherin in CRC
initiation and development.
Acknowledgments
This study was supported by the funding of Science
and Technology Commission of Shanghai Municipality (no.
124119a720). The authors would like to thank Professor Yu-Ping Gao
(Department of Pathology, Renji Hospital, School of Medicine,
Shanghai Jiao Tong University) for her technical assistance in the
present study.
References
|
1
|
Jemal A, Bray F, Center MM, Ferlay J, Ward
E and Forman D: Global cancer statistics. CA Cancer J Clin.
61:69–90. 2011. View Article : Google Scholar : PubMed/NCBI
|
|
2
|
Siegel R, Ma J, Zou Z and Jemal A: Cancer
statistics, 2014. CA Cancer J Clin. 64:9–29. 2014. View Article : Google Scholar : PubMed/NCBI
|
|
3
|
Van Cutsem E and Oliveira J; ESMO
Guidelines Working Group: Advanced colorectal cancer: ESMO clinical
recommendations for diagnosis, treatment and follow-up. Ann Oncol.
20(Suppl 4): 61–63. 2009.PubMed/NCBI
|
|
4
|
Jemal A, Siegel R, Ward E, Hao Y, Xu J and
Thun MJ: Cancer statistics, 2009. CA Cancer J Clin. 59:225–249.
2009. View Article : Google Scholar : PubMed/NCBI
|
|
5
|
Hanahan D and Weinberg RA: Hallmarks of
cancer: the next generation. Cell. 144:646–674. 2011. View Article : Google Scholar : PubMed/NCBI
|
|
6
|
Wheelock MJ, Shintani Y, Maeda M, Fukumoto
Y and Johnson KR: Cadherin switching. J Cell Sci. 121(Pt 6):
727–735. 2008. View Article : Google Scholar : PubMed/NCBI
|
|
7
|
Le Bras GF, Taubenslag KJ and Andl CD: The
regulation of cell-cell adhesion during epithelial-mesenchymal
transition, motility and tumor progression. Cell Adh Migr.
6:365–373. 2012. View Article : Google Scholar : PubMed/NCBI
|
|
8
|
He X, Chen Z, Jia M and Zhao X:
Downregulated E-cadherin expression indicates worse prognosis in
asian patients with colorectal cancer: Evidence from meta-analysis.
PLoS One. 8:e708582013. View Article : Google Scholar : PubMed/NCBI
|
|
9
|
Lee SH, Kim H, Hwang JH, et al: CD24 and
S100A4 expression in resectable pancreatic cancers with earlier
disease recurrence and poor survival. Pancreas. 43:380–388. 2014.
View Article : Google Scholar : PubMed/NCBI
|
|
10
|
Huang Z, Zhang N, Zha L, et al: Aberrant
expression of the autocrine motility factor receptor correlates
with poor prognosis and promotes metastasis in gastric carcinoma.
Asian Pac J Cancer Prev. 15:989–997. 2014. View Article : Google Scholar : PubMed/NCBI
|
|
11
|
Fan M, Liu Y, Xia F, et al: Increased
expression of EphA2 and E-N cadherin switch in primary
hepatocellular carcinoma. Tumori. 99:689–996. 2013.
|
|
12
|
Lascombe I, Clairotte A, Fauconnet S,
Bernardini S, Wallerand H, Kantelip B and Bittard H: N-cadherin as
a novel prognostic marker of progression in superficial urothelial
tumors. Clin Cancer Res. 12:2780–2787. 2006. View Article : Google Scholar : PubMed/NCBI
|
|
13
|
Yi S, Yang ZL, Miao X, et al: N-cadherin
and P-cadherin are biomarkers for invasion, metastasis and poor
prognosis of gallbladder carcinomas. Pathol Res Pract. 210:363–368.
2014. View Article : Google Scholar : PubMed/NCBI
|
|
14
|
Yamauchi M, Yoshino I, Yamaguchi R, et al:
N-cadherin expression is a potential survival mechanism of
gefitinib-resistant lung cancer cells. Am J Cancer Res. 1:823–833.
2011.PubMed/NCBI
|
|
15
|
Gao P, Xing AY, Zhou GY, et al: The
molecular mechanism of microRNA-145 to suppress invasion-metastasis
cascade in gastric cancer. Oncogene. 32:491–501. 2013. View Article : Google Scholar
|
|
16
|
Hulit J, Suyama K, Chung S, et al:
N-cadherin signaling potentiates mammary tumor metastasis via
enhanced extracellular signal-regulated kinase activation. Cancer
Res. 67:3106–3116. 2007. View Article : Google Scholar : PubMed/NCBI
|
|
17
|
Zhang X, Liu G, Kang Y, Dong Z, Qian Q and
Ma X: N-cadherin expression is associated with acquisition of EMT
phenotype and with enhanced invasion in erlotinib-resistant lung
cancer cell lines. PLoS One. 8:e576922013. View Article : Google Scholar : PubMed/NCBI
|
|
18
|
Liang CC, Park AY and Guan JL: In vitro
scratch assay: a convenient and inexpensive method for analysis of
cell migration in vitro. Nat Protoc. 2:329–333. 2007. View Article : Google Scholar : PubMed/NCBI
|
|
19
|
Markowitz SD and Bertagnolli MM: Molecular
origins of cancer: Molecular basis of colorectal cancer. N Engl J
Med. 361:2449–2460. 2009. View Article : Google Scholar : PubMed/NCBI
|
|
20
|
Findlay VJ, Wang C, Watson DK and Camp ER:
Epithelial-to-mesenchymal transition and the cancer stem cell
phenotype: insights from cancer biology with therapeutic
implications for colorectal cancer. Cancer Gene Ther. 21:181–187.
2014. View Article : Google Scholar : PubMed/NCBI
|
|
21
|
Micalizzi DS, Farabaugh SM and Ford HL:
Epithelial-mesenchymal transition in cancer: parallels between
normal development and tumor progression. J Mammary Gland Biol
Neoplasia. 15:117–134. 2010. View Article : Google Scholar : PubMed/NCBI
|
|
22
|
Toiyama Y, Yasuda H, Saigusa S, Tanaka K,
Inoue Y, Goel A and Kusunoki M: Increased expression of Slug and
Vimentin as novel predictive biomarkers for lymph node metastasis
and poor prognosis in colorectal cancer. Carcinogenesis.
34:2548–2557. 2013. View Article : Google Scholar : PubMed/NCBI
|
|
23
|
Tanaka H, Kono E, Tran CP, et al:
Monoclonal antibody targeting of N-cadherin inhibits prostate
cancer growth, metastasis and castration resistance. Nat Med.
16:1414–1420. 2010. View
Article : Google Scholar : PubMed/NCBI
|
|
24
|
Mariotti A, Perotti A, Sessa C and Rüegg
C: N-cadherin as a therapeutic target in cancer. Expert Opin
Investig Drugs. 16:451–465. 2007. View Article : Google Scholar : PubMed/NCBI
|
|
25
|
Su Y, Li J, Witkiewicz AK, Brennan D,
Neill T, Talarico J and Radice GL: N-cadherin haploinsufficiency
increases survival in a mouse model of pancreatic cancer. Oncogene.
31:4484–4489. 2012. View Article : Google Scholar
|
|
26
|
Augustine CK, Yoshimoto Y, Gupta M, et al:
Targeting N-cadherin enhances antitumor activity of cytotoxic
therapies in melanoma treatment. Cancer Res. 68:3777–3784. 2008.
View Article : Google Scholar : PubMed/NCBI
|
|
27
|
Perotti A, Sessa C, Mancuso A, et al:
Clinical and pharmacological phase I evaluation of Exherin™(ADH-1),
a selective anti-N-cadherin peptide in patients with
N-cadherin-expressing solid tumours. Ann Oncol. 20:741–745. 2009.
View Article : Google Scholar : PubMed/NCBI
|
|
28
|
Yarom N, Stewart D, Malik R, Wells J,
Avruch L and Jonker DJ: Phase I clinical trial of Exherin (ADH-1)
in patients with advanced solid tumors. Curr Clin Pharmacol.
8:81–88. 2013.
|
|
29
|
Turley RS, Tokuhisa Y, Toshimitsu H, et
al: Targeting N-cadherin increases vascular permeability and
differentially activates AKT in melanoma. Ann Surg. 261:368–377.
2015. View Article : Google Scholar
|