Introduction
The inflammatory response is a complex reaction of
the immune system that is regulated by numerous inflammatory
mediators, such as nitric oxide (NO), cytokines/chemokines and
prostaglandins (1). These
mediators are known to contribute to the regulation of a wide array
of physiological and pathological processes following an immune
response and inflammation (1,2). The
role of macrophages in mediating numerous different
immunopathological phenomena during inflammation, including the
overproduction of inflammatory cytokines and mediators, such as
tumor necrosis factor-α (TNF-α), interleukin (IL)-1β, IL-6, NO and
prostaglandin E2 (PGE2) is crucial. NO is
synthesized by inducible NO synthase (iNOS), and PGE2 is
synthesized by cyclooxygenase-2 (COX-2) (3,4).
Inflammatory chemokines play a fundamental role in
attracting a diverse set of effector leukocytes to sites of
inflammation (5). Various
chemokines have been shown to affect the immunopathology of
inflammatory skin diseases. The thymus- and activation-regulated
chemokine (TARC/CCL17) has been shown to be upregulated by
keratinocytes in atopic dermatitis lesional skin (6); therefore, the modulation of TARC
production in keratinocytes may contribute to the pathological
processes of inflammatory skin diseases, such as atopic dermatitis.
The serum level of the macrophage-derived chemokine (MDC/CCL22) has
been reported to be significantly elevated in patients with atopic
dermatitis, and increased levels of these chemokines were
associated with increased disease severity (7). Furthermore, enhanced production of
regulated upon activation normal T-cell expressed and secreted
(RANTES/CCL5) has been found in inflammatory diseases of the skin,
including atopic dermatitis and psoriasis (8).
The thorns of Gleditsia sinensis
(Leguminosae) are widely used in traditional Chinese and Korean
medicine for the treatment of several diseases, including
tumor-related diseases, obesity and thrombosis (9). Previous studies have investigated the
biological activity of the chemical constituents of G.
sinensis thorns, such as stigmasterol (10), ellagic acid glycosides (11), flavonoids (12) and lupane acid (13); however, the anti-inflammatory
effects of G. sinensis thorn extracts remain unclear. The
aim of the present study, therefore, was to investigate the
anti-inflammatory activities of the solvent fractions from a G.
sinensis extract and its major constituents on the
lipopolysaccharide (LPS)-stimulated production of inflammatory
mediators by RAW 264.7 macrophages and the TNF-α and IFN-γ
(TI)-stimulated production of chemokines by HaCaT
keratinocytes.
Materials and methods
Plant material
Thorns of G. sinensis were purchased in
October 2008 from Omniherb (Yeongcheon, Republic of Korea). The
origin of these materials was confirmed taxo-nomically by
Professors Je-Hyun Lee (Dongkuk University, Gyeongju, Republic of
Korea) and Young-Bae Seo (Daejeon University, Daejeon, Republic of
Korea). A voucher specimen (2008-ST22) has been deposited at the
K-herb Research Center, Korea Institute of Oriental Medicine
(Daejeon, Republic of Korea).
Extraction and solvent fractionation
The dried thorns of G. sinensis (10 kg) were
extracted three times with 70% ethanol by sonication for 1 h. The
extracted solution was filtered through filter paper and evaporated
to dryness (450 g). The ethanol extract was suspended in water (1
liter) and then successively partitioned with n-hexane,
ethyl acetate and n-butanol (1.5 liters each, three times)
to give extracts of 33.8, 103.2 and 119.1 g, respectively.
Chemicals and reagents
(-)-Epicatechin, ethyl gallate and quercetin (all
with purity ≥99.0%) were purchased from ChromaDex, Inc., (Santa
Ana, CA, USA). Caffeic acid, eriodictyol and (+)-catechin (all with
purity ≥99.0%) were obtained from Acros Organics (Fair Lawn, NJ,
USA), Extrasynthèse S.A. (Genay, France) and Fluka AG (Buchs,
Switzerland), respectively. Methanol, high-performance liquid
chromatography (HPLC)-grade reagents, water and acetonitrile were
purchased from JT. Baker Chemical Co. (Phillipsburg, NJ, USA).
Glacial acetic acid was of analytical reagent grade and was
procured from Junsei Chemical Co. (Tokyo, Japan).
Chromatographic conditions
This analysis was performed using a Shimadzu LC-20A
HPLC system (Shimadzu Co., Kyoto, Japan), which consisted of an
on-line degasser, a solvent-delivery unit, an autosampler, a
photoiode array (PDA) detector and a column oven. The data
processor employed the LC solution software (version 1.24; Shimadzu
Co.). A Gemini® C18 analytical column (250×4.6 mm;
particle size 5 µm; Phenomenex, Torrance, CA, USA) was used.
Solvent A (1.0%, v/v, aqueous acetic acid) and solvent B
(acetonitrile with 1.0%, v/v, acetic acid) comprised the mobile
phases. The gradient flow was as follows: 0–50 min, 5–70% solution
B; 50–55 min, 70–100% solution B; 55–60 min, 100% solution B; 60–65
min, 100–105% solution B, 65–80 min, 5% solution B. The column
temperature was maintained at 40°C The analysis was carried out at
a flow rate of 1.0 ml/min with PDA detection from 280 nm. The
volume of the injection was 10 µl.
Preparations of sample and standard
solutions
Standard stock solutions of four flavonoids
[(+)-catechin, (-)-epicatechin, eriodictyol and quercetin)] and two
phenolic compounds (caffeic acid and ethyl gallate) were dissolved
in methanol at a concentration of 1.0 µg/ml and maintained
at <4°C. Working standard solutions were prepared by serial
dilution of stock solutions with methanol. The extracts (40 mg) of
each lyophilized fraction, such as 70% ethanol, n-hexane,
ethyl acetate, n-butanol and water fractions, were each
dissolved in 70% ethanol (20 ml, respectively). The solutions were
filtered through a 0.2-µm syringe filter (Woong Ki Science
Co., Ltd, Seoul, Republic of Korea).
Calibration curves and limits of
quantification (LOQ) and detection (LOD)
All calibration curves were obtained by the
assessment of peak areas from standard solutions in the seven
different concentration ranges, from 0.78 to 50.00 µg/ml.
The LOD and LOQ data were determined based on signal-to-noise
ratios of 3 and 10, respectively.
Cell culture
The HaCaT human keratinocyte and RAW 264.7 murine
macrophage cell lines were obtained from the American Type Culture
Collection (Rockville, MD, USA). These cells were cultured in
Dulbecco's Modified Eagle's Medium (Gibco-BRL, Grand Island, NY,
USA) supplemented with 10% (HaCaT) or 5.5% (RAW 264.7)
heat-inactivated fetal bovine serum (Gibco-BRL), streptomycin (100
µg/ml) and penicillin (100 U/ml) at 37°C in a 5%
CO2 i nc ub at or.
Cytotoxicity assay
Cell viability was assessed using the Cell Counting
Kit-8 (CCK-8) reagent (Dojindo Laboratories, Kumamoto, Japan),
according to the manufacturer's instructions. RAW 264.7
(3×10³ cells/well) and HaCaT (1×10³ cells/wel
l) cells were incubated in 96-well plates with various
concentrations of the test materials for 24 h. Following the
addition of CCK-8 reagent to each well the cells were further
incubated for 4 h. A Benchmark Plus microplate reader (Bio-Rad,
Hercules, CA, USA) was used to measure absorbance at 450 nm, and
the cell viability percentage was calculated using the following
formula: Cell viability (%) = [(mean absorbance in test wells -
mean absorbance in blank wells)/(mean absorbance in control wells -
mean absorbance in blank wells)] x 100.
Measurement of PGE2 and NO
production
RAW 264.7 cells were plated in 48-well plates at a
density of 2.5×10⁵ cells/well and incubated overnight.
The cells were then treated with LPS (1 µg/ml;
Sigma-Aldrich, St. Louis, MO, USA) in the presence or absence of
various concentrations of the test materials. Following incubation
for 24 h, ELISA kits were used to analyze the supernatants for the
levels of PGE2 (Cayman Chemical Co., Ann Arbor, MI, USA)
and NO (Griess Reagent System; Promega Biotech Co., Ltd., Madison,
WI, USA), according to the manufacturers' instructions.
N(G)-Monomethyl-L-arginine (L-NMMA; Sigma-Aldrich) and indomethacin
(Sigma-Aldrich) were used as positive controls to inhibit the
production of NO and PGE2, respectively.
Measurement of chemokine production
HaCaT cells (1×10⁶ cells/well) were
cultured in six-well plates in medium containing 10% fetal bovine
serum. After reaching confluence, the cells were washed and treated
with the test materials in 1 ml serum-free medium containing TI (10
ng/ml TNF-α and 10 ng/ml IFN-γ; R&D Systems Inc., Minneapolis,
MN, USA) for 24 h. The supernatants of the cells were harvested,
and the production of TARC, MDC and RANTES was quantified using
ELISA (R&D Systems, Inc.), which was performed according to the
manufacturer's instructions.
Statistical analysis
All experiments of the present study were performed
at least in triplicate. Significant differences between the
treatment groups were identified using one-way analysis of variance
and multigroup comparisons were performed using the Dunnett's test.
P<0.05 was considered to indicate a statistically significant
difference.
Results
Calibration curves, LOD and LOQ
The linearity of the peak area (y) versus
concentration (x, µg/ml) curve for each component was used
to calculate the contents of the six constituents in each fraction
of the G. sinensis extract. The correlation coefficients
(r2) of the calibration curves of the six
constituents were ≥0.9998. The line equations and
r2 of the calibration curves are shown in
Table I. The ranges of LOD and LOQ
were 0.037–0.425 and 0.124–1.418 µg/ml, respectively
(Table I).
 | Table ILinearities, correlation
coefficients, LODs and LOQs of the six constituents (n=3). |
Table I
Linearities, correlation
coefficients, LODs and LOQs of the six constituents (n=3).
| Compound | Linear range
(Ig/ml) | Regression
equationa | Correlation
coefficient (r2) | LODb (µg/ml) | LOQc (µg/ml) |
|---|
| (+)−Catechin | 0.78–50.00 |
y=2,779.71x+274.75 | 0.9999 | 0.425 | 1.418 |
| Caffeic acid | 0.78–50.00 |
y=34,405.46x−9,908.57 | 0.9998 | 0.039 | 0.132 |
|
(−)−Epicatechin | 0.78–50.00 |
y=7,859.71x+1,909.87 | 0.9999 | 0.130 | 0.433 |
| Ethyl gallate | 0.78–50.00 |
y=24,543.65x+2,271.17 | 0.9999 | 0.051 | 0.171 |
| Eriodictyol | 0.78–50.00 |
y=34,836x+6,410.25 | 0.9999 | 0.037 | 0.124 |
| Quercetin | 0.78–50.00 |
y=13,439.20x−676.53 | 0.9998 | 0.118 | 0.395 |
HPLC analysis
Good separation chromatograms were obtained using
mobile phases consisting of 1.0% (v/v) aqueous acetic acid (solvent
A) and acetonitrile with 1.0% (v/v) acetic acid (solvent B).
Quantification was achieved using PDA detection at 280 nm, based on
retention times and ultraviolet spectra. Fig. 1 shows the representative HPLC
chromatogram of the standards and each fraction of the G.
sinensis extract, with detection of eluents at 280 nm.
Reproducibility was assessed by measuring repeatedly the retention
times and peak areas of six independently prepared samples of
analytes. The reproducibility of the six compounds [(+)-catechin,
caffeic acid, (-)-epicatechin, eriodictyol, ethyl gallate and
quercetin] was less than the relative standard deviation (RSD) 1.5%
for peak responses and less than the RSD 0.2% for retention times
(data not shown). The contents of the six constituents are
summarized in Table II.
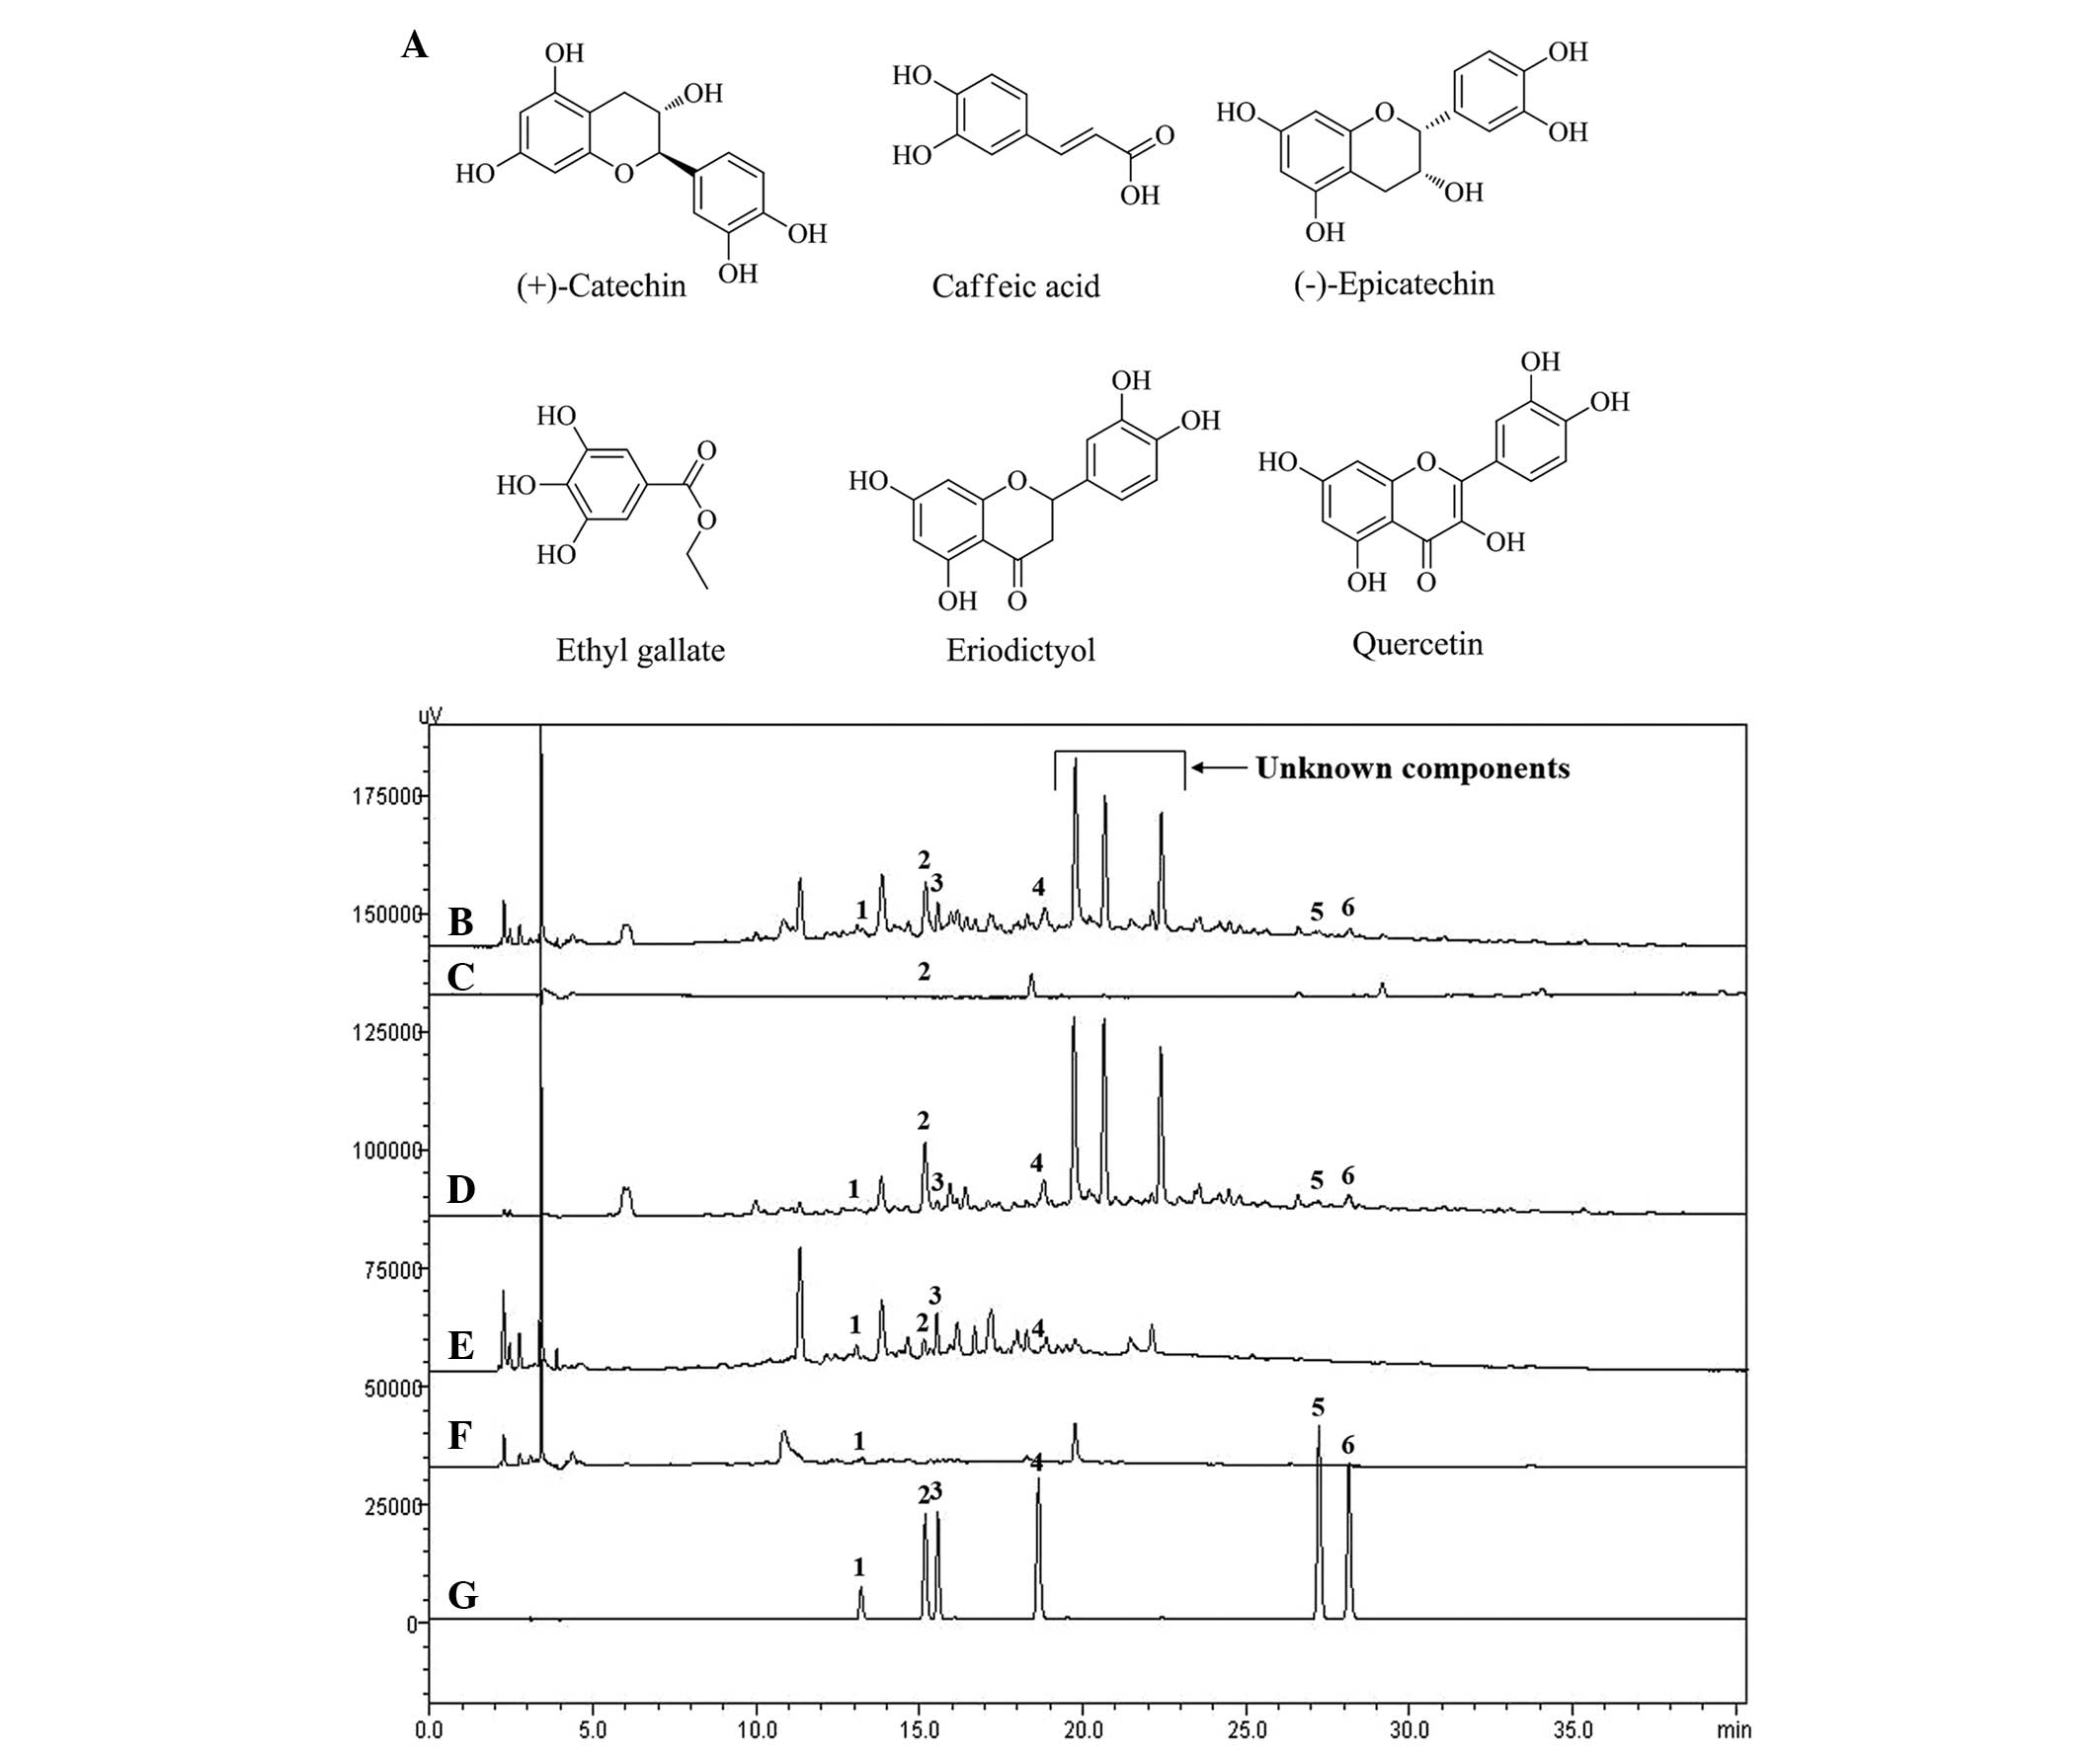 | Figure 1Chemical structures of the six
constituents and high-performance liquid chromatography
chromatogram of Gleditsia sinensis. (A) Chemical structures
of the six constituents. (B-G) Chromatogram of (B) 70% ethanol
extract, (C) n-hexane, (D) ethyl acetate, (E)
n-butanol, (F) water fractions and (G) standard mixture.
Peaks are labeled as follows: 1, (+)-Catechin; 2, caffeic acid; 3,
(-)-epicatechin; 4, ethyl gallate; 5, eriodictyol; and 6,
quercetin. |
| Table IIContents of six constituents of G.
sinensis (n=3). |
Table II
Contents of six constituents of G.
sinensis (n=3).
| Fraction |
Content
(µg/g)
|
|---|
(+)−Catechin
| Caffeic acid
| (−)−Epicatechin
| Ethyl gallate
| Eriodictyol
| Quercetin
|
|---|
| Mean | SD | RSD (%) | Mean | SD | RSD (%) | Mean | SD | RSD (%) | Mean | SD | RSD (%) | Mean | SD | RSD (%) | Mean | SD | RSD (%) |
|---|
| 70% EtOH | 8.63 | 0.18 | 2.07 | 2.79 | 0.04 | 1.44 | 4.92 | 0.03 | 0.55 | 2.89 | 0.06 | 2.04 | 0.39 | 0.01 | 3.55 | 2.54 | 0.06 | 2.21 |
|
n-Hexane | N.D. | – | – | 0.18 | 0.00 | 0.65 | N.D. | – | – | N.D. | – | – | N.D. | – | – | N.D. | – | – |
| EtOAc | 5.33 | 0.08 | 1.45 | 6.07 | 0.02 | 0.33 | 4.88 | 0.06 | 1.20 | 1.26 | 0.04 | 3.06 | 1.13 | 0.03 | 2.24 | 7.00 | 0.03 | 0.37 |
| n-BuOH | 5.28 | 0.05 | 0.98 | 1.04 | 0.01 | 1.30 | 5.61 | 0.06 | 0.99 | 0.96 | 0.02 | 1.79 | N.D. | – | – | N.D. | – | – |
| Water | 3.78 | 0.06 | 1.54 | 0.28 | 0.00 | 1.18 | 0.73 | 0.03 | 3.69 | N.D. | – | – | N.D. | – | – | N.D. | – | – |
G. sinensis extract inhibits NO and
PGE2 production in RAW 264.7 cells and TARC production
in HaCaT cells
The cytotoxic effect of the G. sinensis
extract on RAW 264.7 and HaCaT cells was measured first. The cells
were exposed to various concentrations (2–200 µg/ml) of the
G. sinensis extract for 24 h. The non-toxic concentrations
of the test materials were used in subsequent experiments (data not
shown). To determine the effects of the G. sinensis extract
on NO and PGE2 production in LPS-stimulated RAW 264.7
cells, the cells were treated with different concentrations of the
G. sinensis extract (25, 50 and 100 µg/ml) and then
stimulated by LPS (1 µg/ml) for 24 h. The G. sinensis
extract suppressed LPS-stimulated NO production in a dose-dependent
manner (Fig. 2A). LPS greatly
stimulated NO production (5.846±0.220 nM) in RAW 264.7 cells,
whereas the G. sinensis extract significantly decreased NO
production [1.872±0.513 µM (P<0.01) at a dose of 25
µg/ml, 0.974±0.128 µM (P<0.01) at a dose of
50 µg/ml and 0.205±0.020 µM (P<0.01) at a dose of
100 µg/ml] compared with that observed in LPS-stimulated RAW
264.7 cells. Furthermore, LPS-stimulated RAW 264.7 cells exhibited
increased PGE2 production compared with the controls,
whereas the G. sinensis extract decreased the production of
PGE2 relative to the production observed in the
LPS-stimulated RAW 264.7 cells (Fig.
2B). The effects of the G. sinensis extract on TARC
production in TI-stimulated HaCaT cells were assessed by treating
the cells with different concentrations of the G. sinensis
extract (50, 100 and 200 µg/ml) and then initiating TI
stimulation for 24 h. The G. sinensis extract suppressed
TI-stimulated TARC production in a dose-dependent manner (Fig. 2C). TI-treated cells showed
significantly increased production of TARC (28.27±0.900 ng/ml)
relative to that observed in the control cells (P<0.01). This
increase was inhibited to 22.44±0.030 ng/ml (P<0.01) and
10.23±0.480 ng/ml (P<0.01) by the administration of the G.
sinensis extract at 100 and 200 µg/ml, respectively.
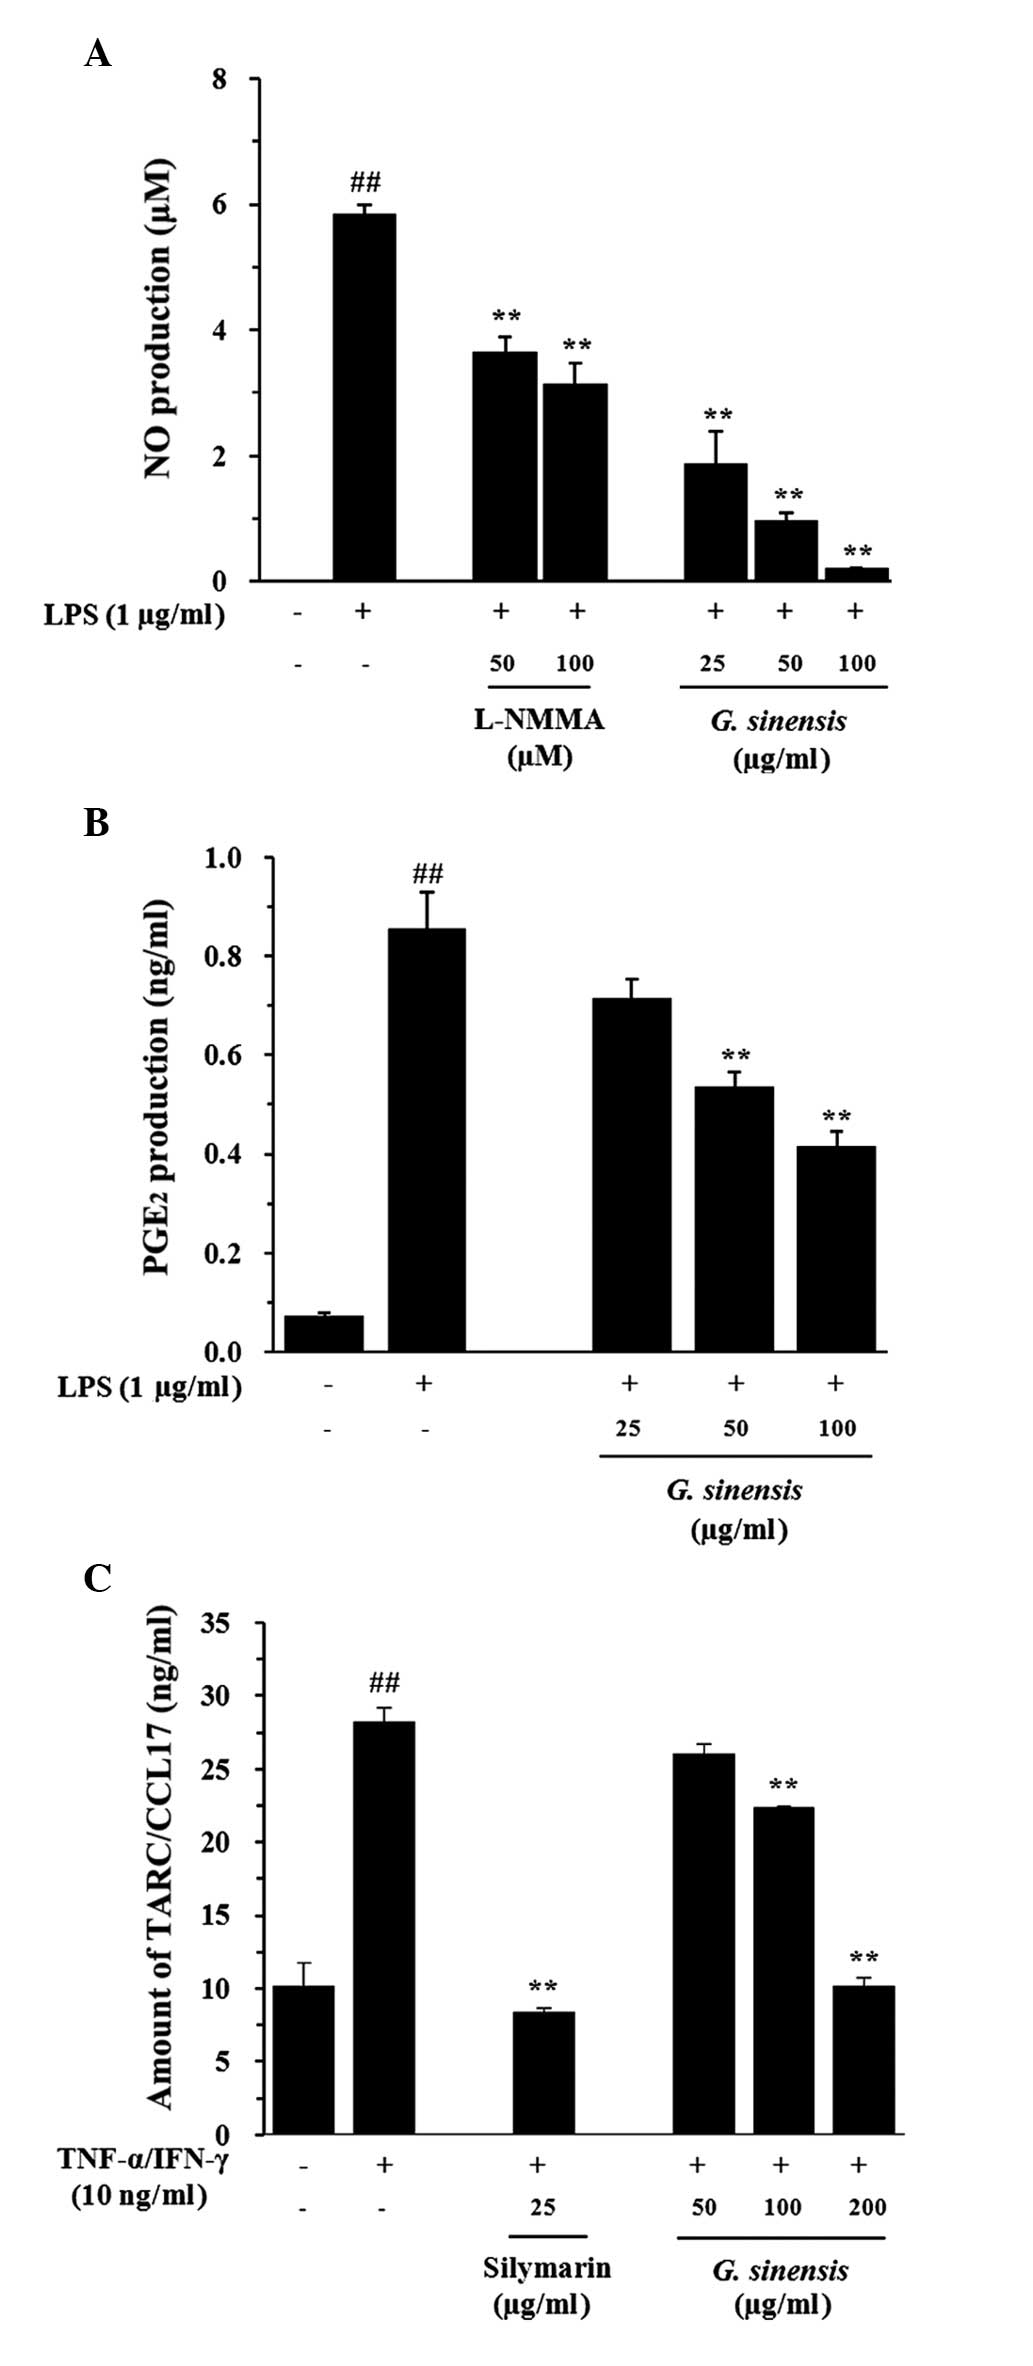 | Figure 2Effects of the extract of
Gleditsia sinensis on the LPS-stimulated production of NO
and PGE2 in RAW 264.7 cells and the TI-stimulated
production of TARC in HaCaT cells. The production of (A) NO and (B)
PGE2 was assayed in the culture medium of cells treated
with extracts of G. sinensis (25, 50, and 100 µg/ml)
and then with LPS (1 µg/ml) for 24 h. L-NMMA (25 µM)
was used as a positive control drug. (C) The production of TARC was
assayed in the culture medium of cells treated with extracts of
G. sinensis (50, 100 and 200 µg/ml), followed by TI
(TNF-α, 10 ng/ml; IFN-γ, 10 ng/ml) for 24 h. Silymarin (25
µg/ml) was used as a positive control drug. Each bar
represents the mean values obtained from three independent
experiments. ##P<0.01 vs. the vehicle control group;
**P<0.01 vs. LPS/TI-treated cells. LPS,
lipopolysaccharide; NO, nitric oxide; PGE2,
prostaglandin E2, TARC, thymus- and activation-regulated
chemokine; TNF-α, tumor necrosis factor-α; IFN-γ, interferon-γ; TI,
TNF-α and IFN-γ; L-NMMA, N(G)-monomethyl-L-arginine. |
Fractions of the G. sinensis extract
inhibit NO and PGE2 production in RAW 264.7 cells and
TARC production in HaCaT cells
Fractions of the G. sinensis extract were
tested to determine whether each fraction inhibited the production
of NO and PGE2 in LPS-treated RAW 264.7 cells and the
production of TARC in HaCaT cells treated with TI. NO production is
the hallmark of the activation of macrophages. In the present
experiment, NO production (4308±0.225 µM) was observed after
24 h of LPS incubation (1 µg/ml). As shown in Fig. 3A, treatment with the
n-hexane, ethyl acetate and n-butanol fractions
suppressed the NO production. In addition, the n-hexane and
ethyl acetate fractions decreased PGE2 production
compared with that observed in LPS-stimulated R AW 264.7 cells
(P<0.01, Fig. 3B). TARC
production was increased 2.7-fold in the TI-treated cells
(28.30±0.820 ng/ml) compared with that in the control cells
(10.16±1.540 ng/ml) (P<0.01), whereas cells treated with the
ethyl acetate fraction showed the most significant reductions in
TARC production compared with the TI-treated cells (P<0.01,
Fig. 3C). These results showed
that the biological effects of G. sinensis were maximized by
the ethyl acetate fraction.
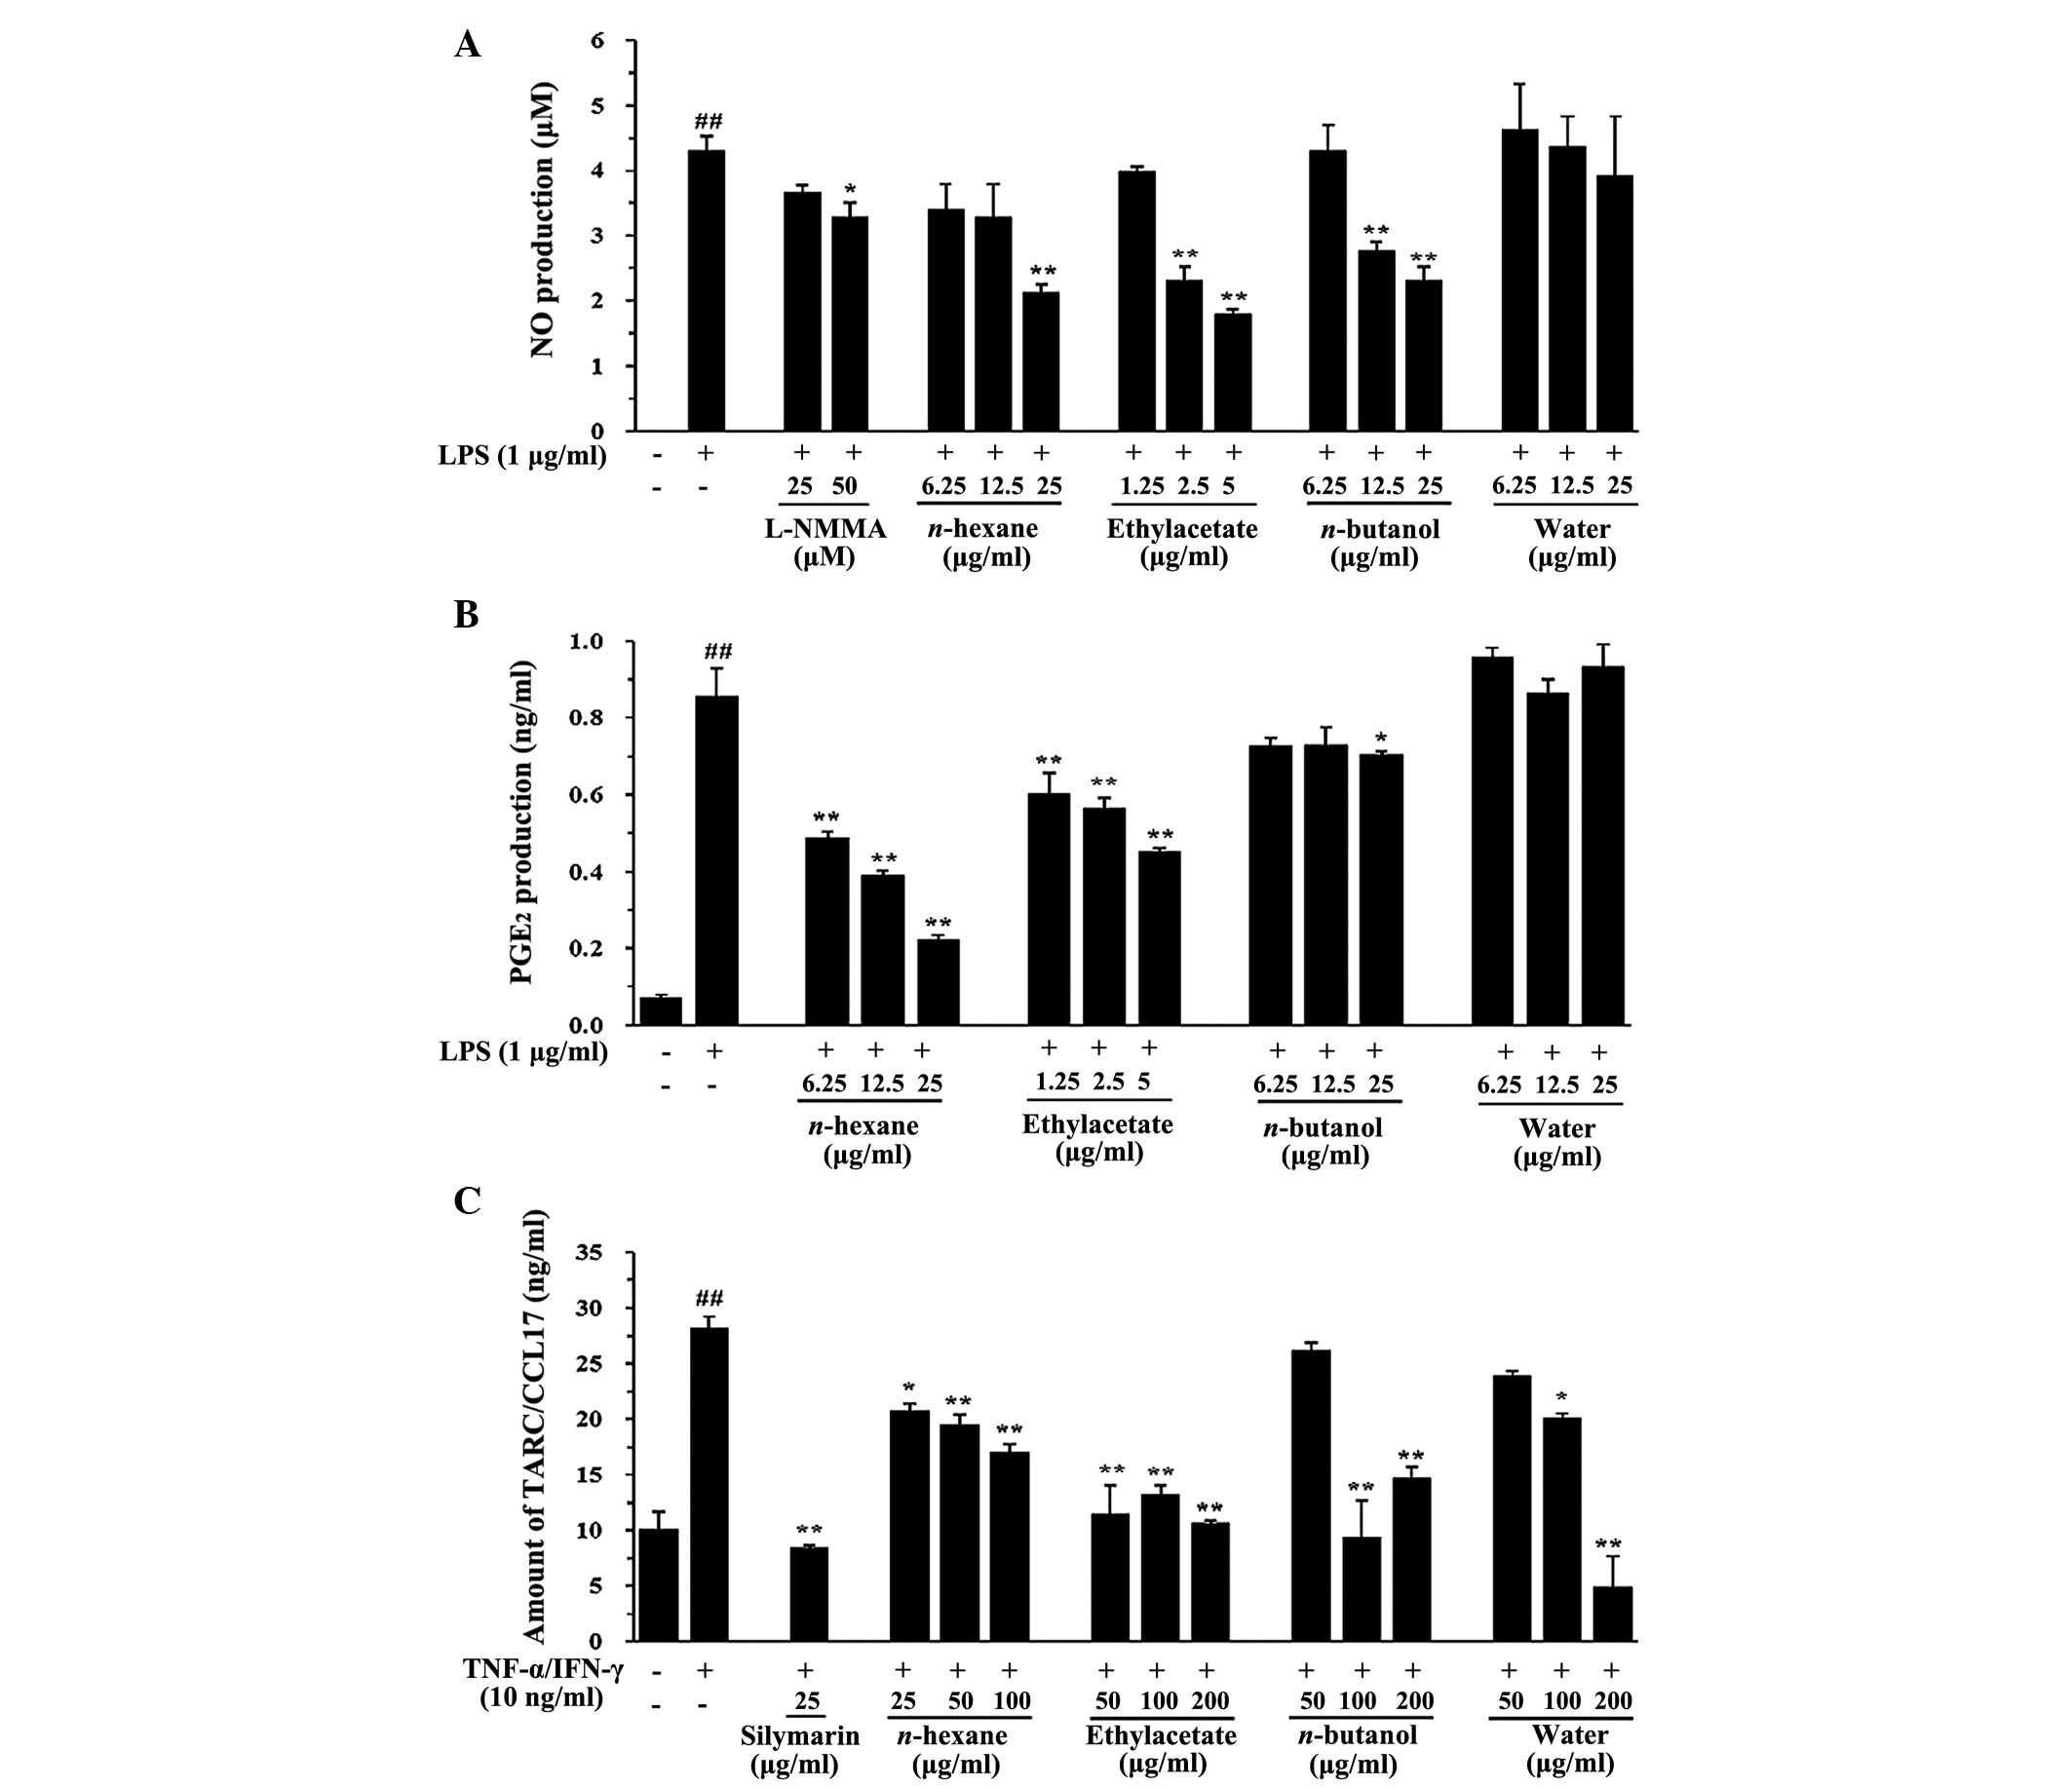 | Figure 3Effects of the fractions of
Gleditsia sinensis extract on the LPS-stimulated production
of NO and PGE2 in RAW 264.7 cells and the TI-stimulated
production of TARC in HaCaT cells. The production of (A) NO and (B)
PGE2 was assayed in the culture medium of cells treated
with solvent fractions and then stimulated with LPS (1
µg/ml) for 24 h. L-NMMA (25 µM) was used as a
positive control drug. (C) The production of TARC was assayed in
the culture medium of cells treated with solvent fractions and then
stimulated with TI (TNF-α, 10 ng/ml; IFN-γ, 10 ng/ml) for 24 h.
Silymarin (25 µg/ml) was used as a positive control drug.
Each bar represents the mean values obtained from three independent
experiments. ##P<0.01 vs. the vehicle control group; *P<0.05
and **P<0.01 vs. the LPS/TI-treated cells. LPS,
lipopolysaccharide; NO, nitric oxide; PGE2,
prostaglandin E2, TARC, thymus- and activation-regulated
chemokine; TNF-α, tumor necrosis factor-α; IFN-γ, interferon-γ; TI,
TNF-α and IFN-γ; L-NMMA, N(G)-monomethyl-L-arginine. |
Major constituents of the G. sinensis
extract inhibit NO and PGE2 production in RAW 264.7
cells and chemokine production in HaCaT cells
To assess the effects of the major constituents of
the G. sinensis extract on LPS-stimulated NO and
PGE2 production in RAW 264.7 macrophages, cells were
treated with various concentrations of these major constituents and
1 µg/ml LPS for 24 h. LPS stimulation caused a marked
accumulation of proinflammatory mediators (NO and PGE2)
in the culture medium. Of note, all major constituents of the G.
sinensis extract significantly reduced the LPS-stimulated
production of NO (Fig. 4A) and
PGE2 (Fig. 4B) in a
dose-dependent manner. Treatment of HaCaT cells with TI for 24 h
led to a 1.9-fold increase in TARC levels (6.85±0.51 ng/ml)
compared with that observed in the vehicle-treated control group
(3.52±0.29 ng/ml) (P<0.01); however, TARC production was
significantly inhibited in a dose-dependent manner in the ethyl
gallate-, eriodictyol- and quercetin-treated cells (P<0.01)
(Fig. 4C). In addition, MDC
production was increased in the TI-treated cells (264.80±12.76
ng/ml) compared with that in the vehicle-treated control group
(P<0.01), and its levels were significantly reduced following
ethyl gallate and quercetin treatment (P<0.01) (Fig. 4D). TI-treated cells exhibited a
significantly increased production of RANTES (4,652.93±66.95
ng/ml), relative to that observed in the control cells (P<0.01).
This increase was inhibited dose-dependently by ethyl gallate
(2,530.11±8.67 ng/ml at 50 µg/ml, P<0.01; 1,068.30±95.01
ng/ml at 100 µg/ml, P<0.01), eriodictyol (3,987.98±127.92
ng/ml at 50 µg/ml, P<0.05; 2,433.12±184.17 ng/ml at 100
µg/ml, P<0.01) and quercetin (2,728.46±119.93 ng/ml at 50
µg/ml, P<0.01; 41434±2759 ng/ml at 100 µg/ml,
P<0.01) (Fig. 4E). Among these
compounds, ethyl gallate and quercetin, which were most abundant
both in the G. sinensis extract and in each solvent fraction
(particularly in the ethyl acetate fraction) significantly
inhibited the RANTES, MDC and TARC expression in HaCaT cells in a
dose-dependent manner, whereas the same expression was not
significantly reduced by other constituents in TI-treated
cells.
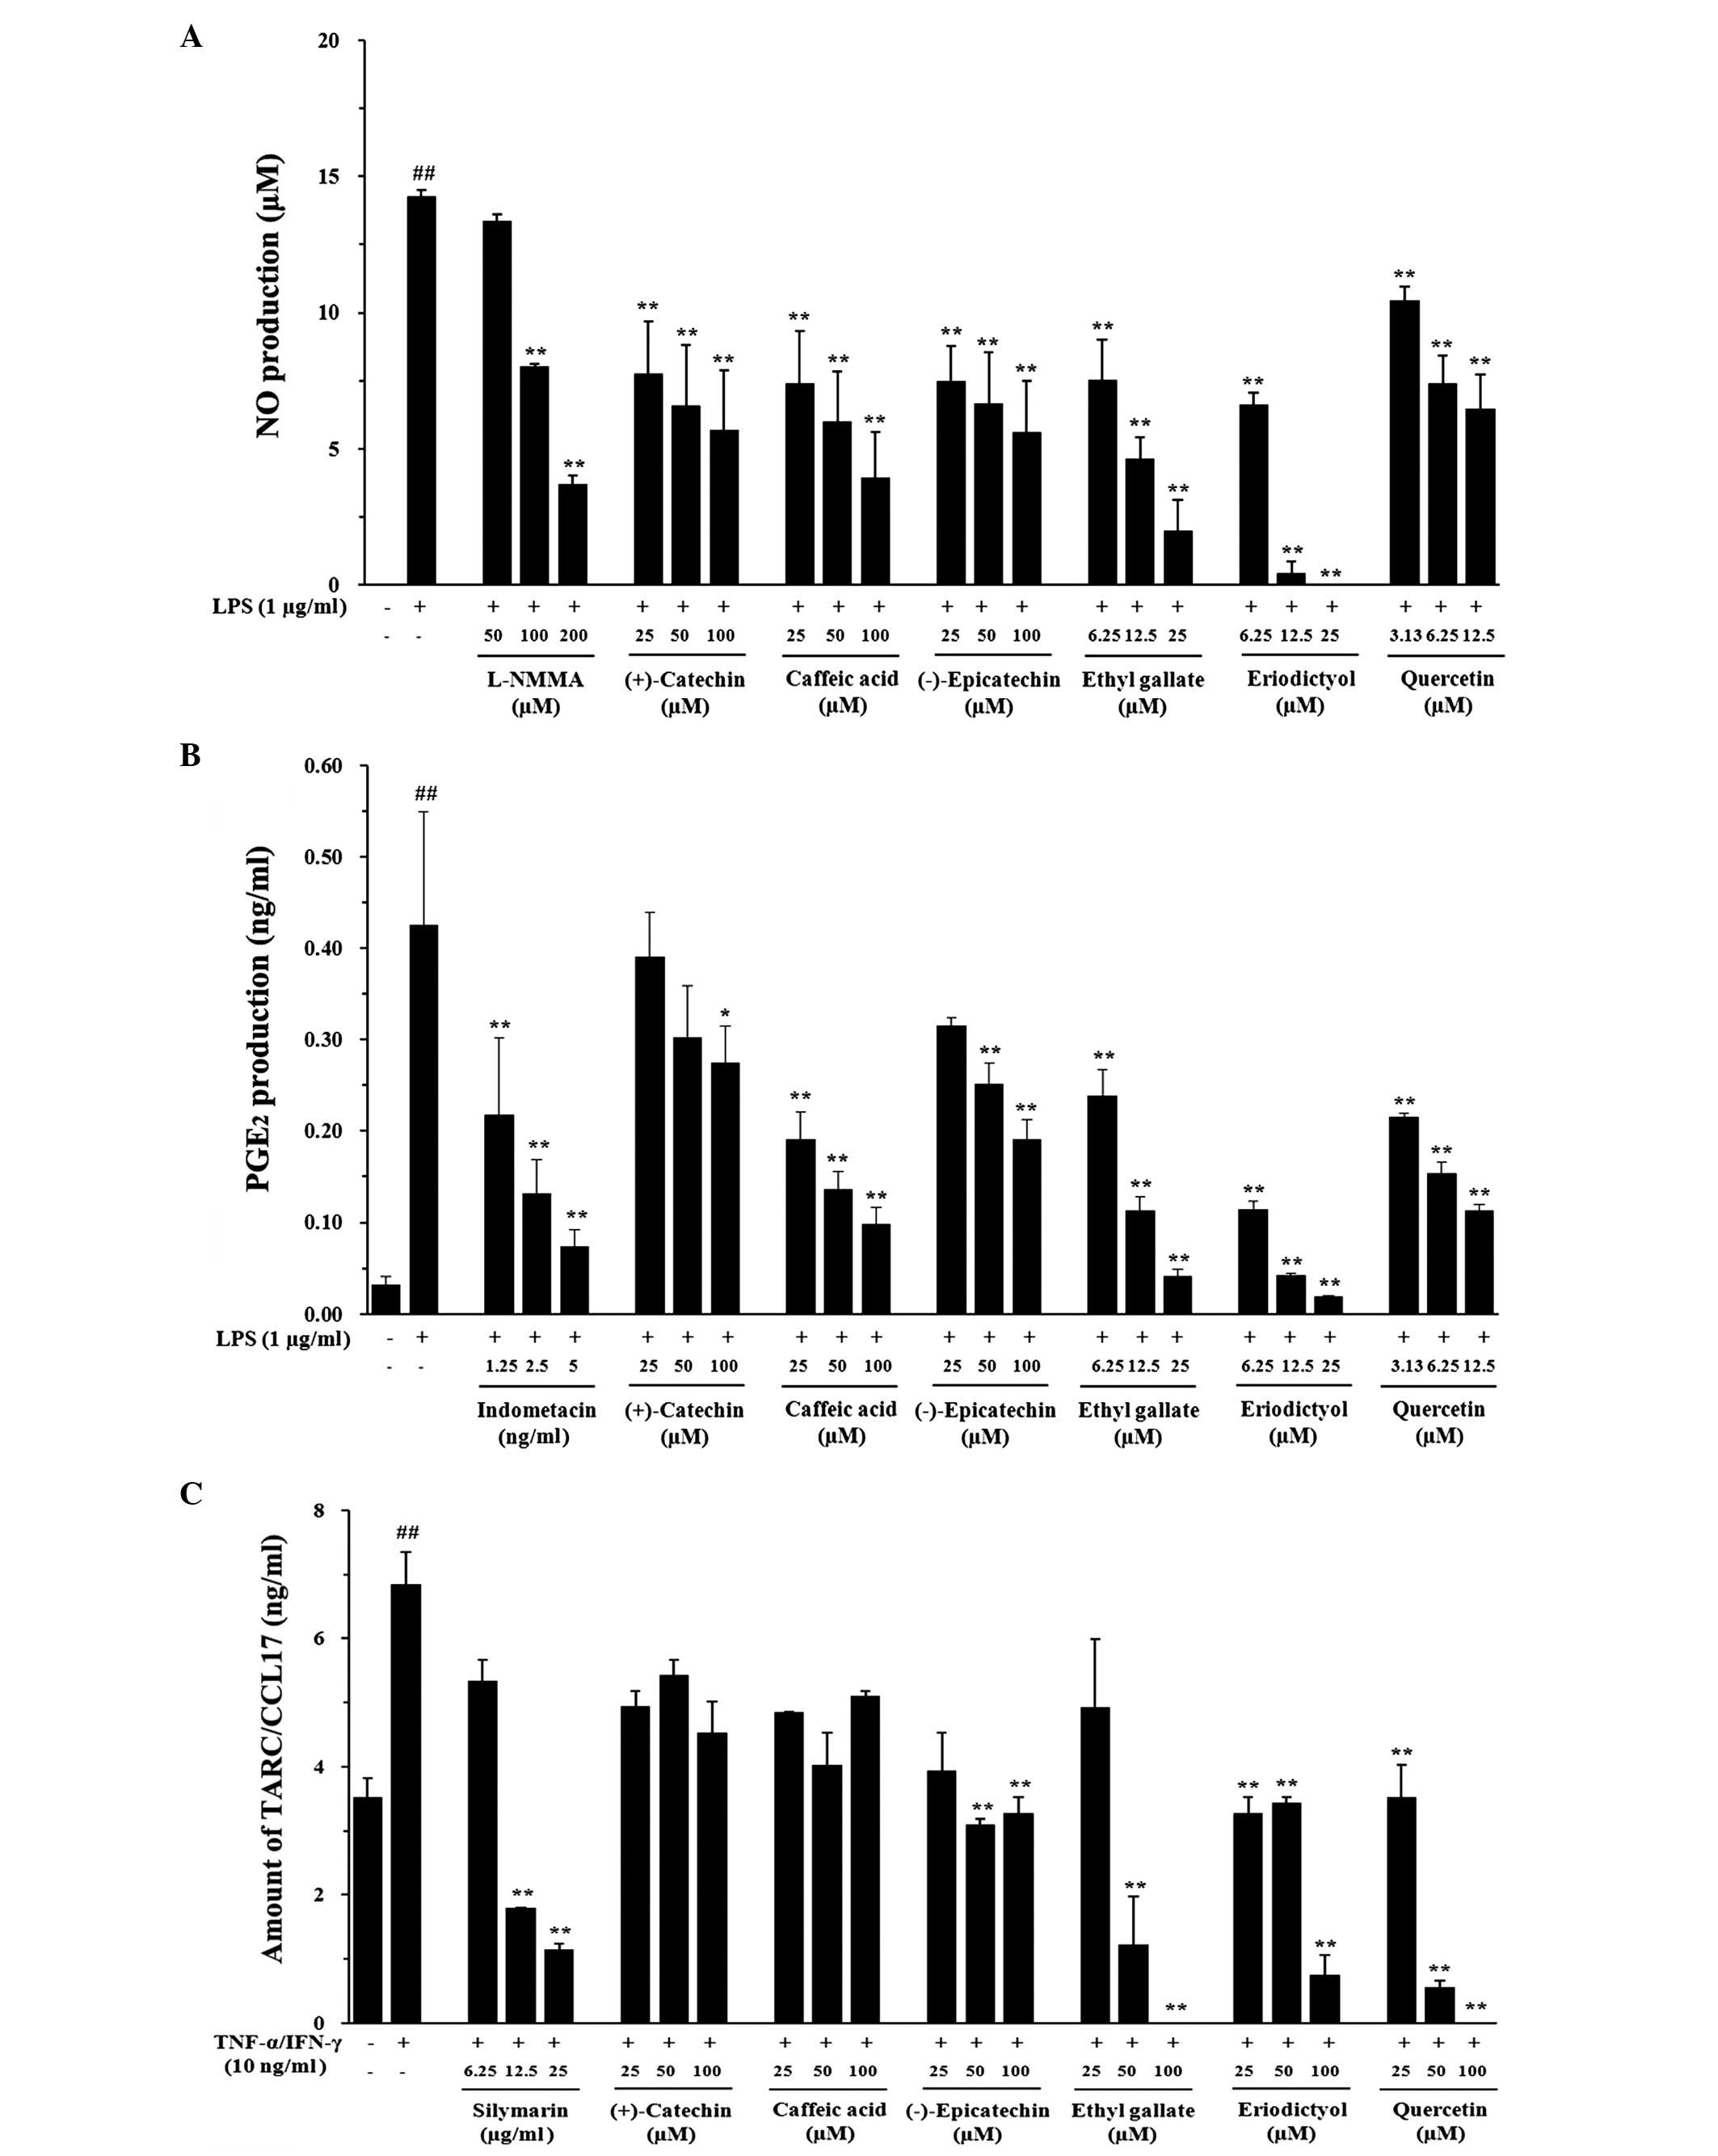 | Figure 4Effects of the major constituents of
the Gleditsia sinensis extract on the LPS-stimulated
production of NO and PGE2 in RAW 264.7 cells and the
TI-stimulated production of chemokines in HaCaT cells. The
production of (A) NO and (B) PGE2 was assayed in the
culture medium of cells treated with the major constituents of the
G. sinensis extract and then stimulated with LPS (1
µg/ml) for 24 h. L-NMMA (25 µM) was used as a
positive control drug. (C) The production of TARC was assayed in
the culture medium of cells treated with the major constituents of
the G. sinensis extract and then stimulated with TI (TNF-α,
10 ng/ml; IFN-γ, 10 ng/ml) for 24 h. Silymarin (25 µg/ml)
was used as positive control drug. Each bar represents the mean of
three independent experiments. ##P<0.01 vs. the vehicle control
group; *P<0.05 and **P<0.01 vs. the LPS/TI-treated cells.
LPS, lipopolysaccharide; NO, nitric oxide; PGE2,
prostaglandin E2, TARC, thymus- and activation-regulated
chemokine; TNF-α, tumor necrosis factor-α; IFN-γ, interferon-γ; TI,
TNF-α and IFN-γ; L-NMMA, N(G)-monomethyl-L-arginine. Effects of the
major constituents of the Gleditsia sinensis extract on
LPS-stimulated production of NO and PGE2 in RAW 264.7
cells and the TI-stimulated production of chemokines in HaCaT
cells. The production of (D) MDC and (E) RANTES was assayed in the
culture medium of cells treated with the major constituents of the
G. sinensis extract and then stimulated with TI (TNF-α, 10
ng/ml; IFN-γ, 10 ng/ml) for 24 h. Silymarin (25 µg/ml) was
used as positive control drug. Each bar represents the mean of
three independent experiments. ##P<0.01 vs. the vehicle control
group; *P<0.05 and **P<0.01 vs. the LPS and TI-treated cells,
respectively. LPS, lipopolysaccharide; NO, nitric oxide; PGE2,
prostaglandin E2, TARC, thymus- and activation-regulated
chemokine; TNF-α, tumor necrosis factor-α; IFN-γ, interferon-γ;
MDC, macrophage-derived chemokine; RANTES, regulated on activation
normal T-cell expressed and secreted; TI, TNF-α and IFN-γ. |
Discussion
The seeds and fruits of G. sinensis are
widely used in Chinese, Japanese and Korean herbal medicine for the
treatment of numerous diseases, such as apoplexy, headache, asthma
and scabies (14). Despite the
fact that the thorns of G. sinensis have been used for the
prevention, as well as the treatment, of carbuncles, scabies and
other inflammatory diseases (15),
the anti-inflammatory effect has not yet been fully elucidated. In
the present study, the concentrations of the chemical constituents
of G. sinensis and their anti-inflammatory effects in G.
sinensis extracts, based on different solvent fractions and
single compounds, were investigated.
Two phenolic compounds (caffeic acid and ethyl
gallate) and four favonoids [(+)-catechin, (-)-epicatechin,
eriodictyol and quercetin)] were analyzed in 70% ethanol extracts
and solvent fractions (n-hexane, ethyl acetate,
n-butanol and water) of G. sinensis; however, the
constituents responsible for peaks at the retention times of 19.8,
20.7 and 22.5 min in the 70% ethanol extract and ethyl acetate
fraction were not able to be identified. It is imperative that
these constituents are identified and quantitatively determined in
order for a correlation between the quantities of the major
constituents of G. sinensis and the biological effects of
this herbal medicine to be obtained.
The production of NO and PGE2, two major
mediators of inflammation, plays an important role in the immune
response to numerous inflammatory stimuli. The free radical NO is
produced by iNOS, and its overproduction has been associated with
the pathology of an array of inflammatory disorders, such as septic
shock (16). PGE2,
which is generated from arachidonic acid by COX-2, is produced in
response to inflammatory stimuli, and abundant COX-2 expression
promotes the proinflammatory signaling cascade (17). Thus, potential inhibitors of iNOS
and COX-2 have been considered as possible anti-inflammatory
agents. It was shown that the extraction solvent and the major
constituents in G. sinensis reduced the levels of NO and
PGE2 in LPS-stimulated RAW 264.7 cells in a
dose-dependent manner.
Exposure of keratinocytes to TI results in an
abnormal expression of chemokines and cytokines, which is believed
to increase the infiltration of monocytes/T cells into the site of
inflammation (18,19). Chemokines are a superfamily of
small cytokines that regulate the trafficking of various types of
leukocytes (20). TARC/CCL17 is a
member of the CC chemokine subfamily that is produced by various
cell types, including keratinocytes, and is constitutively
expressed in the thymus (21).
MDC/CCL22 is closely associated with TARC and is constitutively
produced by dendritic cells, B cells, keratinocytes, epithelial
cells and macrophages (22).
RANTES/CCL5 belongs to the CC chemokine family, the members of
which recruit and activate different subtypes of leukocytes, such
as T cells, eosinophils, basophils, monocytes or mast cells
(23). The effect of the extract
and solvent fractions of G. sinensis on TARC production in
TI-stimulated HaCaT cells was examined and it was shown that the
major constituents of G. sinensis reduced the production of
TARC, MDC and RANTES in TI-stimulated HaCaT cells; in particular,
ethyl gallate and quercetin yielded a significant dose-dependent
inhibition.
In conclusion, the G. sinensis extract was
successively partitioned to identify the fraction that contained
the major constituent compounds. It was found that all the
reference compounds were present in the ethyl acetate fraction and
that larger amounts were present in this fraction than in any other
fraction. Furthermore, the ethyl acetate fraction decreased the
levels of NO and PGE2 in RAW 264.7 cells and the
expression of TARC, MDC and RANTES in HaCaT cells to a greater
extent than the other fractions. Further elucidation of the
signaling pathways involved in T-helper cell 2 chemokine inhibition
by G. sinensis is required for the facilitation of the
design of therapeutic agents for the inflammatory reaction.
Acknowledgments
This study was supported by grants from the Korea
Research Council of Fundamental Science & Technology (grant no.
G10101) and the Korea Institute of Oriental Medicine (grant no.
K13030).
References
|
1
|
Damte D, Reza MA, Lee SJ, Jo WS and Park
SC: Anti-inflammatory activity of dichloromethane extract of
Auricularia auricula-judae in RAW264.7 cells. Toxicol Res.
27:11–14. 2011. View Article : Google Scholar : PubMed/NCBI
|
|
2
|
Duffield JS: The inflammatory macrophage:
A story of Jekyll and Hyde. Clin Sci (Lond). 104:27–38. 2003.
View Article : Google Scholar
|
|
3
|
Gordon S: Alternative activation of
macrophages. Nat Rev Immunol. 3:23–35. 2003. View Article : Google Scholar : PubMed/NCBI
|
|
4
|
Mosser DM and Edwards JP: Exploring the
full spectrum of macrophage activation. Nat Rev Immunol. 8:958–969.
2008. View
Article : Google Scholar : PubMed/NCBI
|
|
5
|
Rossi D and Zlotnik A: The biology of
chemokines and their receptors. Annu Rev Immunol. 18:217–242. 2000.
View Article : Google Scholar : PubMed/NCBI
|
|
6
|
Vestergaard C, Yoneyama H, Murai M,
Nakamura K, Tamaki K, Terashima Y, Imai T, Yoshie O, Irimura T,
Mizutani H and Matsushima K: Overproduction of Th2-specific
chemokines in NC/Nga mice exhibiting atopic dermatitis-like
lesions. J Clin Invest. 104:1097–1105. 1999. View Article : Google Scholar : PubMed/NCBI
|
|
7
|
Hashimoto S, Nakamura K, Oyama N, Kaneko
F, Tsunemi Y, Saeki H and Tamaki K: Macrophage-derived chemokine
(MDC)/CCL22 produced by monocyte derived dendritic cells reflects
the disease activity in patients with atopic dermatitis. J Dermatol
Sci. 44:93–99. 2006. View Article : Google Scholar : PubMed/NCBI
|
|
8
|
Kozma GT, Falus A, Bojszkó A, Krikovszky
D, Szabó T, Nagy A and Szalai C: Lack of association between atopic
eczema/dermatitis syndrome and polymorphisms in the promoter region
of RANTES and regulatory region of MCP-1. Allergy. 57:160–163.
2002. View Article : Google Scholar : PubMed/NCBI
|
|
9
|
Lai P, Du JR, Zhang MX, Kuang X, Li YJ,
Chen YS and He Y: Aqueous extract of Gleditsia sinensis Lam. fruits
improves serum and liver lipid profiles and attenuates
atherosclerosis in rabbits fed a high-fat diet. J Ethnopharmacol.
137:1061–1066. 2011. View Article : Google Scholar : PubMed/NCBI
|
|
10
|
Lim JC, Park JH, Budesinsky M, Kasal A,
Han YH, Koo BS, Lee SI and Lee DU: Antimutagenic constituents from
the thorns of Gleditsia sinensis. Chem Pharm Bull (Tokyo).
53:561–564. 2005. View Article : Google Scholar
|
|
11
|
Zhou L, Li D, Jiang W, Qin Z, Zhao S, Qiu
M and Wu J: Two ellagic acid glycosides from Gleditsia sinensis
Lam. with antifungal activity on Magnaporthe grisea. Nat Prod Res.
21:303–309. 2007. View Article : Google Scholar : PubMed/NCBI
|
|
12
|
Zhou L, Li D, Wang J, Liu Y and Wu J:
Antibacterial phenolic compounds from the spines of Gleditsia
sinensis Lam. Nat Prod Res. 21:283–291. 2007. View Article : Google Scholar : PubMed/NCBI
|
|
13
|
Li WH, Zhang XM, Tian RR, Zheng YT, Zhao
WM and Qiu MH: A new anti-HIV lupane acid from Gleditsia sinensis
Lam. J Asian Nat Prod Res. 9:551–555. 2007. View Article : Google Scholar : PubMed/NCBI
|
|
14
|
Wu J, Li J, Zhu Z, Li J, Huang G, Tang Y
and Gao X: Protective effects of echinocystic acid isolated from
Gleditsia sinensis Lam. against acute myocardial ischemia.
Fitoterapia. 81:8–10. 2010. View Article : Google Scholar
|
|
15
|
Ha HH, Park SY, Ko WS and Kim Y: Gleditsia
sinensis thorns inhibit the production of NO through NF-kappaB
suppression in LPS-stimulated macrophages. J Ethnopharmacol.
118:429–434. 2008. View Article : Google Scholar : PubMed/NCBI
|
|
16
|
Cheng PY, Lee YM, Wu YS, Chang TW, Jin JS
and Yen MH: Protective effect of baicalein against endotoxic shock
in rats in vivo and in vitro. Biochem Pharmacol. 73:793–804. 2007.
View Article : Google Scholar
|
|
17
|
Kundu JK and Surh YJ: Inflammation:
Gearing the journey to cancer. Mutat Res. 659:15–30. 2008.
View Article : Google Scholar : PubMed/NCBI
|
|
18
|
Gröne A: Keratinocytes and cytokines. Vet
Immunol Immunopathol. 88:1–12. 2002. View Article : Google Scholar : PubMed/NCBI
|
|
19
|
Sebastiani S, Albanesi C, De PO, Puddu P,
Cavani A and Girolomoni G: The role of chemokines in allergic
contact dermatitis. Arch Dermatol Res. 293:552–559. 2002.
View Article : Google Scholar : PubMed/NCBI
|
|
20
|
Qi XF, Kim DH, Yoon YS, Li JH, Song SB,
Jin D, Huang XZ, Teng YC and Lee KJ: The adenylyl cyclase-cAMP
system suppresses TARC/CCL17 and MDC/CCL22 production through p38
MAPK and NF-kappaB in HaCaT keratinocytes. Mol Immunol.
46:1925–1934. 2009. View Article : Google Scholar : PubMed/NCBI
|
|
21
|
Saeki H and Tamaki K: Thymus and
activation regulated chemokine (TARC)/CCL17 and skin diseases. J
Dermatol Sci. 43:75–84. 2006. View Article : Google Scholar : PubMed/NCBI
|
|
22
|
Hino R, Kobayashi M, Mori T, Orimo H,
Shimauchi T, Kabashima K and Tokura Y: Inhibition of T helper 2
chemokine production by narrowband ultraviolet B in cultured
keratinocytes. Br J Dermatol. 156:830–837. 2007. View Article : Google Scholar : PubMed/NCBI
|
|
23
|
Appay V and Rowland-Jones SL: RANTES: A
versatile and controversial chemokine. Trends Immunol. 22:83–87.
2001. View Article : Google Scholar : PubMed/NCBI
|


