Introduction
Glucocorticoid is widely used in the treatment of
connective tissue diseases, although large doses may induce
osteonecrosis of the femoral head (ONFH) (1). Furthermore, steroid-induced ONFH can
be elevated to the first round of non-traumatic ONFH (2). If the patient fails to obtain
effective treatment, the femoral head will collapse and
osteoarthritis will become so severe that artificial joint
replacement is required (2).
Therefore, early diagnosis and treatment of ONFH is required.
However, the etiology of the disorder and an effective treatment
for ONFH remain to be elucidated. In addition to micro-thrombi
caused by micro-circulation disorders leading to local intraosseous
hypertension and ischemia (3–6), a
disrupted balance between bone necrosis and repair caused by
changes in differentiation capacity of bone marrow-derived
mesenchymal stem cells (BMSCs) due to glucocorticoids can result in
femoral head collapse (7).
MicroRNA (miRNA) is a small, ~18–25 nt long
single-stranded RNA,. miRNAs are highly conserved in terms sequence
and tissue specificity, and they are vital in regulating the
function of cells and tissues, and general biological functions
(8). Previous studies have
revealed that miRNA are vital in regulating the osteogenic
differentiation of BMSCs (9). To
date, changes in BMSC miRNAs induced by glucocorticoid remain to be
fully elucidated. The present study established a mouse model of
femoral head necrosis, isolated and cultured mesenchymal stem
cells, screened for differences in BMSC miRNAs, and predicted their
gene targets using bioinformatics analysis. Additionally, the
underlying mechanisms of miRNA regulation in steroid-induced
necrosis of the femoral head were investigated to provide powerful
evidence for potential clinical treatments.
Materials and methods
Animals
All experiments were performed following the
Guidelines of the Intramural Animal Use and Care Committee of the
Peking Union Medical College Hospital (Beijing, China). A total of
24 eight-week-old wild-type C57BL/6J mice (Laboratory Animal Center
of the Academy of Military Medical Sciences; Beijing, China) were
used in the present study. All mice were female, with an average
body weight of 18.82±1.54 g. The animals were housed with a 12 h
light/dark cycle, a constant indoor temperature at 20°C, 48%
humidity and were fed a standard rodent diet. Procedures involving
animals and their care were conducted in conformity with NIH
guidelines (NIH publication no. 85-23, revised 1996) and was
approved by the Animal Care and Use Committee of Peking Union
Medical College Hospital.
Animal model of femoral head
osteonecrosis
The experimental group of C57BL/6J mice was
subcutaneously injected with 21 mg/kg methylprednisolone (Pfizer,
Inc., Ascoli Piceno, Italy) for 4 weeks consecutively, while the
control group received an equivalent dose of normal saline. After 4
weeks, the mice were sacrificed (via cervical dislocation following
anesthetization with chloral hydrate) and the femurs were removed.
The femoral specimens were fixed for 24 h with 10% neutral formalin
(Guduo Biotechnology Corporation, Shanghai, China; 0.1 mmol/l; pH
7.4) at room temperature, and subsequently placed in a 10%
EDTA-Tris solution (Thermo Fisher Scientific, Inc., Rockford, IL,
USA) at room temperature to decalcify them for 4 weeks
(decalcification fluid was changed every 3 days). The femoral heads
were considered completely demineralized when the bone was easily
pierced with a pin. The samples were dehydrated by a series of
graded ethanol washes, placed in xylene (Rongbai Biotechnology,
Co., Ltd., Shanghai, China) for 2 h at room temperature, embedded
in paraffin (ToYongBio, Shanghai, China) and sliced into
4-µm coronal tissue sections. The tissue sections were
processed for hematoxylin and eosin (HE) staining and terminal
deoxynucleotidyl transferase dUTP nick end labeling (TUNEL), sealed
with neutral resin, and imaged with an inverted phase contrast
microscope and camera system (CKX41; Olympus Corporation, Tokyo,
Japan).
Isolation, culture, and identification of
BMSCs
The mice were sacrificed by cervical dislocation and
immersed in 75% ethanol for ~10 min at room temperature. The
surrounding tissue was peeled away and the long bone was removed
from the muscles and connective tissue, and the bone was
subsequently washed three times with sterile phosphate-buffered
saline (PBS). The metaphysis was removed and the marrow cavity was
washed repeatedly using a 1-ml syringe filled with serum-free
L-Dulbecco's modified Eagle's medium (DMEM; Gibco Life
Technologies, Gaithersburg, MD, USA) to isolate the cells. The
samples were uniformly mixed and the cells were seeded into 100-mm
culture dishes at a density of 1×10⁶ cells/ml. The
isolated BMSCs were cultured for 2 days with L-DMEM, supplemented
with 20% fetal bovine serum (FBS; Gibco Life Technologies), 100
U/ml penicillin and 100 µg/ml streptomycin (Invitrogen Life
Technologies, Carlsbad, CA, USA). The cells were subsequently
cultured in L-minimum essential medium, supplemented with 10% FBS.
The mouse mesen-chymal stem cell formed adherent colonies after
9–12 days of culture, reaching between 80 and 90% confluency. The
culture media was discarded and the cells were washed three times
with PBS, prior to digestion with 0.25% trypsin and dilution into
single cell suspension at a density of 5×10⁶/ml.
Aliquots of the cell suspension were added to microcentrifuge tubes
(1×10⁶ cells in 200 µl/tube) and were
subsequently incubated with APC monoclonal rat anti-mouse CD31
(cat. no. 561814; BD Pharmingen, San Diego, CA, USA; 1:250
dilution), FITC monoclonal rat anti-mouse CD34 (cat. no. 560238; BD
Pharmingen; 1:250 dilution), monoclonal CD105 FITC (cat. no.
ab184667; Abcam, Cambridge, MA, USA; 1:250 dilution), PE monoclonal
anti-mouse CD166 (cat. no. 12-1661-81; eBioscience, Inc., San
Diego, CA, USA; 1:200 dilution) or control antibodies (2 µl
each). The cells were incubated with the antibody at 4°C for 30
min, washed three times with PBS with a centrifugation step in
between each wash (4°C; 380×g; 5 min). The labeled cells were
detected by flow cytometry (FACSCalibur; BD Biosciences, San Jose,
CA, USA).
Microarray and data processing
Each experimental and control group consisted of
nine mice. The cells from sets of three mice were pooled and
cultured together. A micro (mi) RNA microarray was performed in
triplicate with the pooled specimens. Primary BMSCs were digested
with trypsin and the total RNA was extracted using TRIzol reagent
(Invitrogen Life Technologies), according to the manufacturer's
instructions. The miRNA and the gene microarrays were performed
using a microarray platform (LC Sciences, Houston, TX, USA). The
mRNA expression levels were detected using the Affymetrix
GeneChip® mouse Genome Array (Affymetrix, Santa Clara,
CA, USA). Raw microarray data (CEL files) were normalized using the
quantile method (10), and
differentially expressed genes were screened using the bioconductor
(http://www.bioiconductor.org) Limma
package in R software version 3.0 (Free Software Foundation Inc.,
Boston, MA, USA). Gene sets with nominal P<0.05 and false
discovery rates <0.25 were considered to be significant and were
included for further investigation.
miRNA-gene network
TargetScan 5.1 (www.targetscan.org) was used in conjunction with
miRanda version 2005 (http://www.microrna.org/), PicTar, MirTarget2 and
RNAhybrid (http://pictar.mdc-berlin.de/; http://mirdb.org; http://alk.ibms.sinica.edu.tw/cgi-bin/RNAhybrid/RNAhybrid.cgi)
to predict the targets of the miRNAs. Genes predicted by any one of
the algorithms were considered to be potential targets. To build a
miRNA-gene network, the association between miRNAs and genes was
assessed based on their differential expression values and
according to their interactions in the Sanger miRNA database
(http://www.mirbase.org/). An miRNA/gene adjacency
matrix (A=[ai,j]) was produced, according to the association
between the genes and miRNAs, where ai,j represents the weight of
the association between gene i and miRNA j. In the miRNA-gene
network, circles represent genes, squares represent miRNAs and
their association is represented by a line. The center of the
network is represented by degree, which is the contribution of an
miRNA to the surrounding genes or the contribution of a gene to the
surrounding miRNAs. The key miRNA and gene in the network always
exhibit the highest degree. The network of miRNA-mRNA interactions,
representing the critical miRNAs and their targets, was established
according to the miRNA degree.
Reverse transcription-quantitative
polymerase chain reaction (RT-qPCR) of miRNA
Differentially expressed miRNAs were selected for
validation, including miR-21-3p, miR-652-5p, miR-206-3p,
miR-196a-5p, miR-34b-3p, miR-34c-5p and miR-148a-3p. The expression
of these mature miRNAs was determined using stem-loop RT, followed
by PCR analysis, as previously described (11). The PCR was performed in triplicate
for each sample and U6 served as a positive control for miRNA PCR.
The miRNAs levels were quantified using mouse TaqMan MicroRNA
assays (Applied Biosystems Life Technologies, Beijing, China). PCR
was conducted using a thermocycler (ABI 7900HT; Applied Biosystems
Life Technologies) for 35 cycles and all reagents were obtained
from Applied Biosystems Life Technologies. The stem-loop primers
used are presented in Table I. The
relative quantity of miRNA was normalized against U6 snRNA and the
fold-change for each miRNA was calculated using the
2–∆∆Ct method. The relative expression values of each
miRNA were calculated using the 2–∆∆Ct method, as
follows: ∆Ct = Ct (each miRNA) – Ct (U6). The fold changes of the
miRNA expression values in the experimental group samples versus
normal controls were determined by the 2–∆∆Ct method, as
follows: ∆∆Ct = median ∆Ctexperimental group - median ∆Ctcontrol
group.
 | Table IStem-loop primer sequences used in the
present study. |
Table I
Stem-loop primer sequences used in the
present study.
| MicroRNA | Primer sequence |
|---|
| mmu-miR-21-3p |
UGUACCACCUUGUCGGAUAGCUUAUCAGACUGAUGUUGACUGUUGAAUCUCAUGGCAACAGCAGUCGAUGGGCUGUCUGACAUUUUGGUAUC |
| mmu-miR-652-5p |
AGGAACAGCUAUGUACUGCACAACCCUAGGAGGGGGUGCCAUUCACAUAGAGUAUAAUUGAAUGGCGCCACUAGGGUUGUGCAGUGUACAGCCUACAC |
| mmu-miR-206-3p |
CCAGGCCACAUGCUUCUUUAUAUCCUCAUAGAUAUCUCAGCACUAUGGAAUGUAAGGAAGUGUGUGGUUUUGG |
| mmu-miR-34b-3p |
GUGCUCGGUUUGUAGGCAGUGUAAUUAGCUGAUUGUAGUGCGGUGCUGACAAUCACUAACUCCACUGCCAUCAAAACAAGGCAC |
|
mmu-miR-196a-5p |
AGCUGAUCUGUGGCUUAGGUAGUUUCAUGUUGUUGGGAUUGAGUUUUGAACUCGGCAACAAGAAACUGCCUGAGUUACAUCAGUC |
| mmu-miR-34c-5p |
AGUCUAGUUACUAGGCAGUGUAGUUAGCUGAUUGCUAAUAGUACCAAUCACUAACCACACAGCCAGGUAAAAAGACU |
|
mmu-miR-148a-3p |
AGCCAGUUUGGUCUUUUGAGACAAAGUUCUGAGACACUCCGACUCUGAGUAUGAUAGAAGUCAGUGCACUACAGAACUUUGUCUCUAGAGGCUGUGGUC |
Results
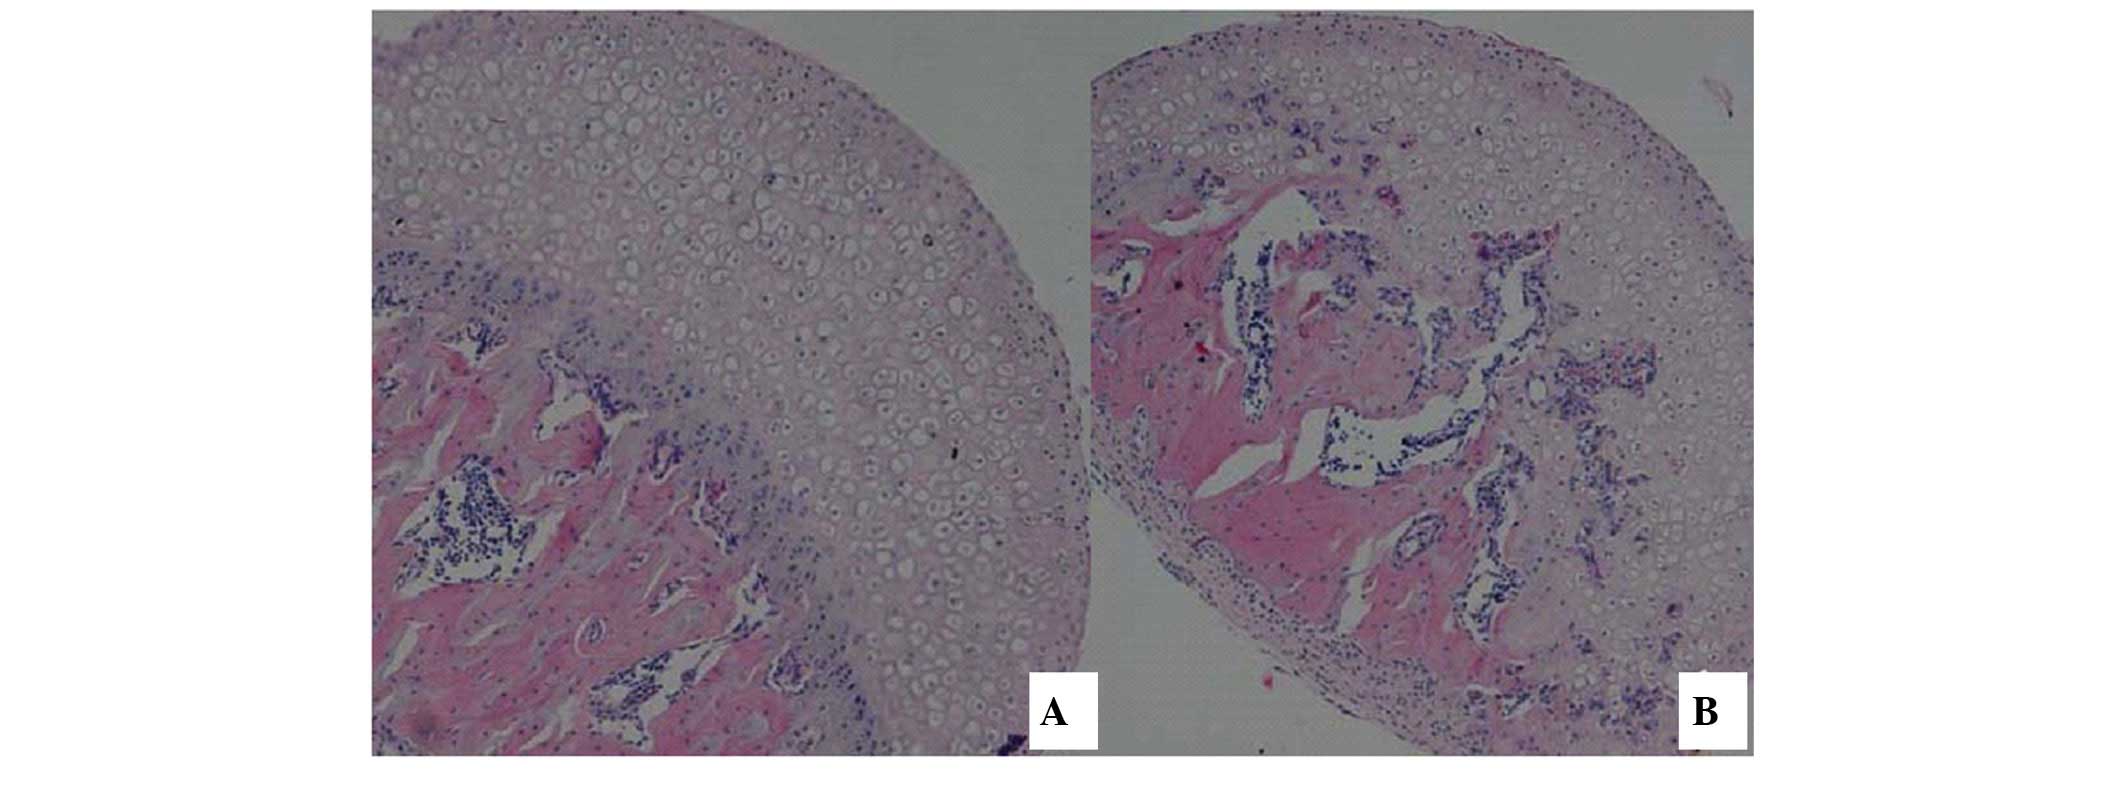
HE staining and TUNEL
Using HE staining, it was demonstrated that,
compared with the control group samples (Fig. 1A), the experimental group samples
(Fig. 1B) exhibited a thinner
epiphyseal cartilage zone in the femoral head. However, while the
proliferative zone and cartilage zone were easily distinguished,
the epiphysis exceeded normal parameters and early trabecular
fractures were observed. In the region containing epiphyseal
cartilage, vascular proliferation and fibrous tissue growth was
observed, multiple small necrotic foci were observed near the
femoral epiphyseal line and the femoral articular surface was not
smooth, indicating significant wear to the tissue.
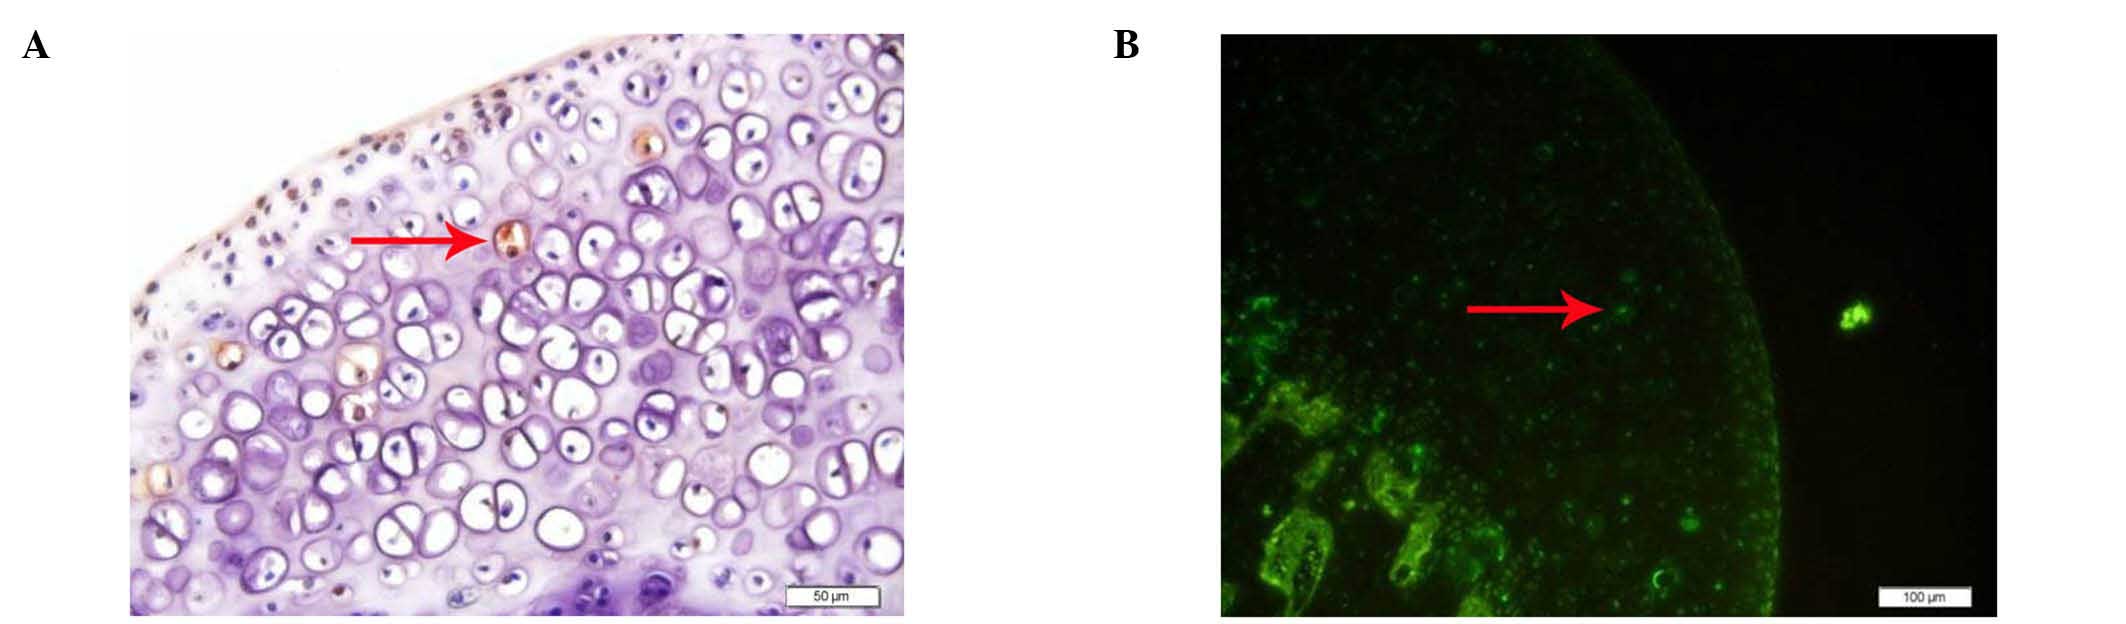
TUNEL revealed that there were no apoptotic cells in
the control group, while various examples of apoptotic osteocytes
and osteoblasts were observed in the experimental group (Fig. 2).
Culture of BMSCs in vitro
Following the initial exchange of the culture medium
after 48 h, a small number of adherent cells, which were small and
round, with a quiescent phenotype were observed (Fig. 3). As the incubation duration
increased, these cells rapidly proliferated and reached 80–90%
confluency by 9 days. The cells exhibited a long, spindle-like
morphology, with a small quantity of protrusion formation, which
indicated fibroblast-like growth at 9 days (Fig. 3).
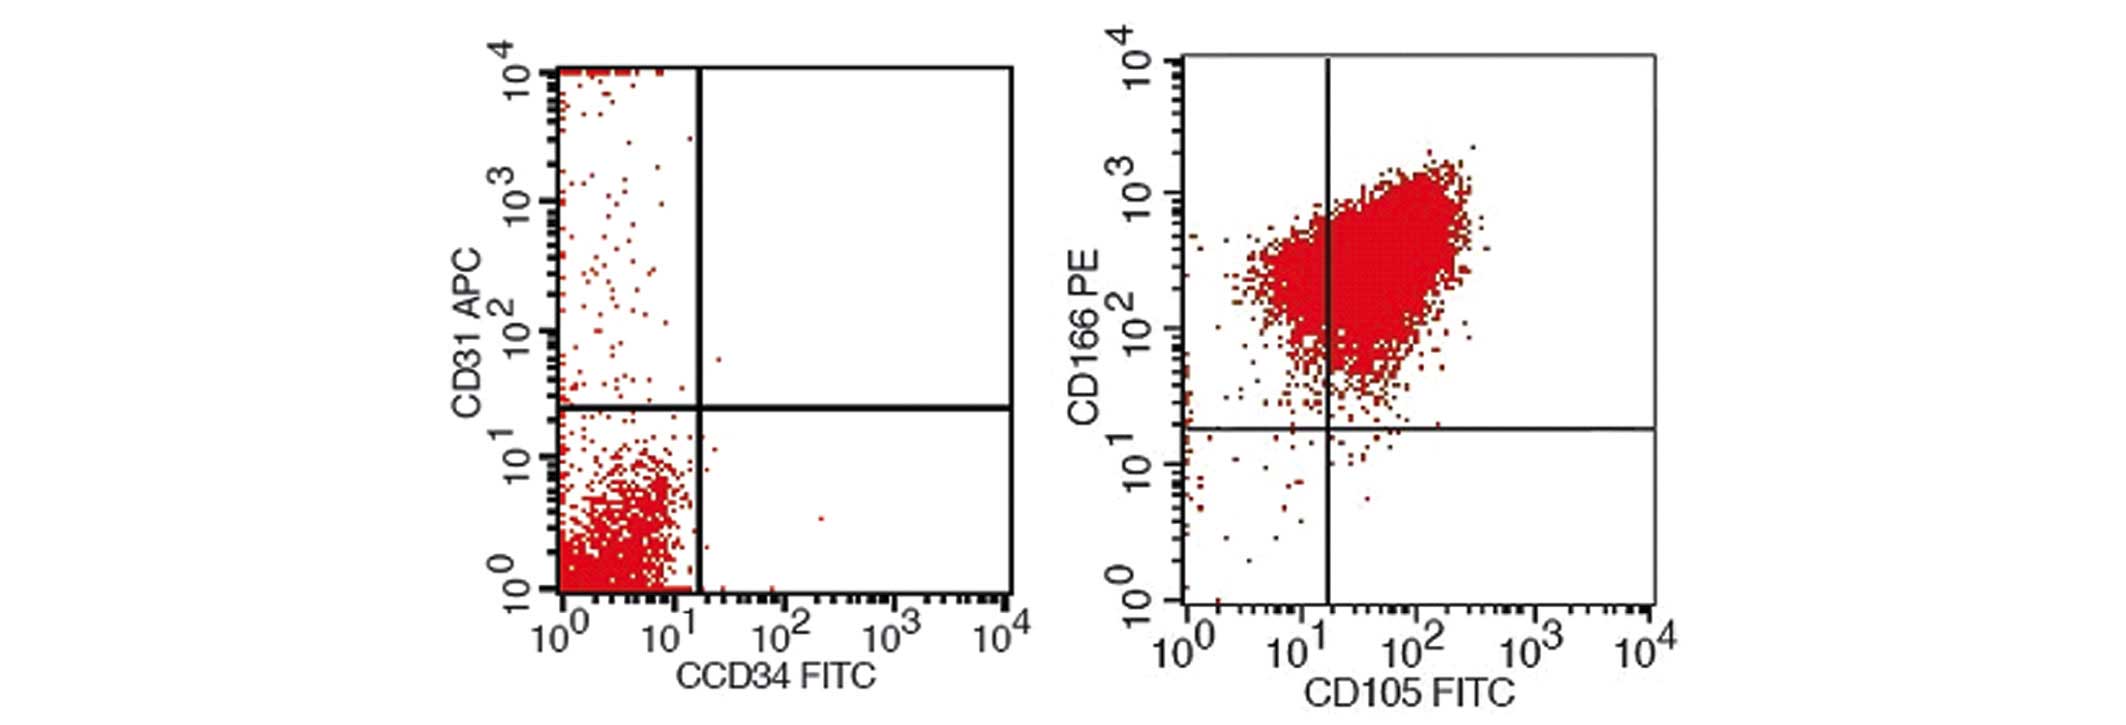
BMSC surface antigen tests
BMSCs were identified by flow cytometry, the results
of which are shown in Fig. 4.
Isolated and cultured BMSCs expressed surface antigens that were
comparable to those that were expressed by stem cells, including
high expression levels of CD105 and CD166, and negative expression
of CD31 and CD34. Therefore, based on the present study, it was
identified that these cells were BMSCs.
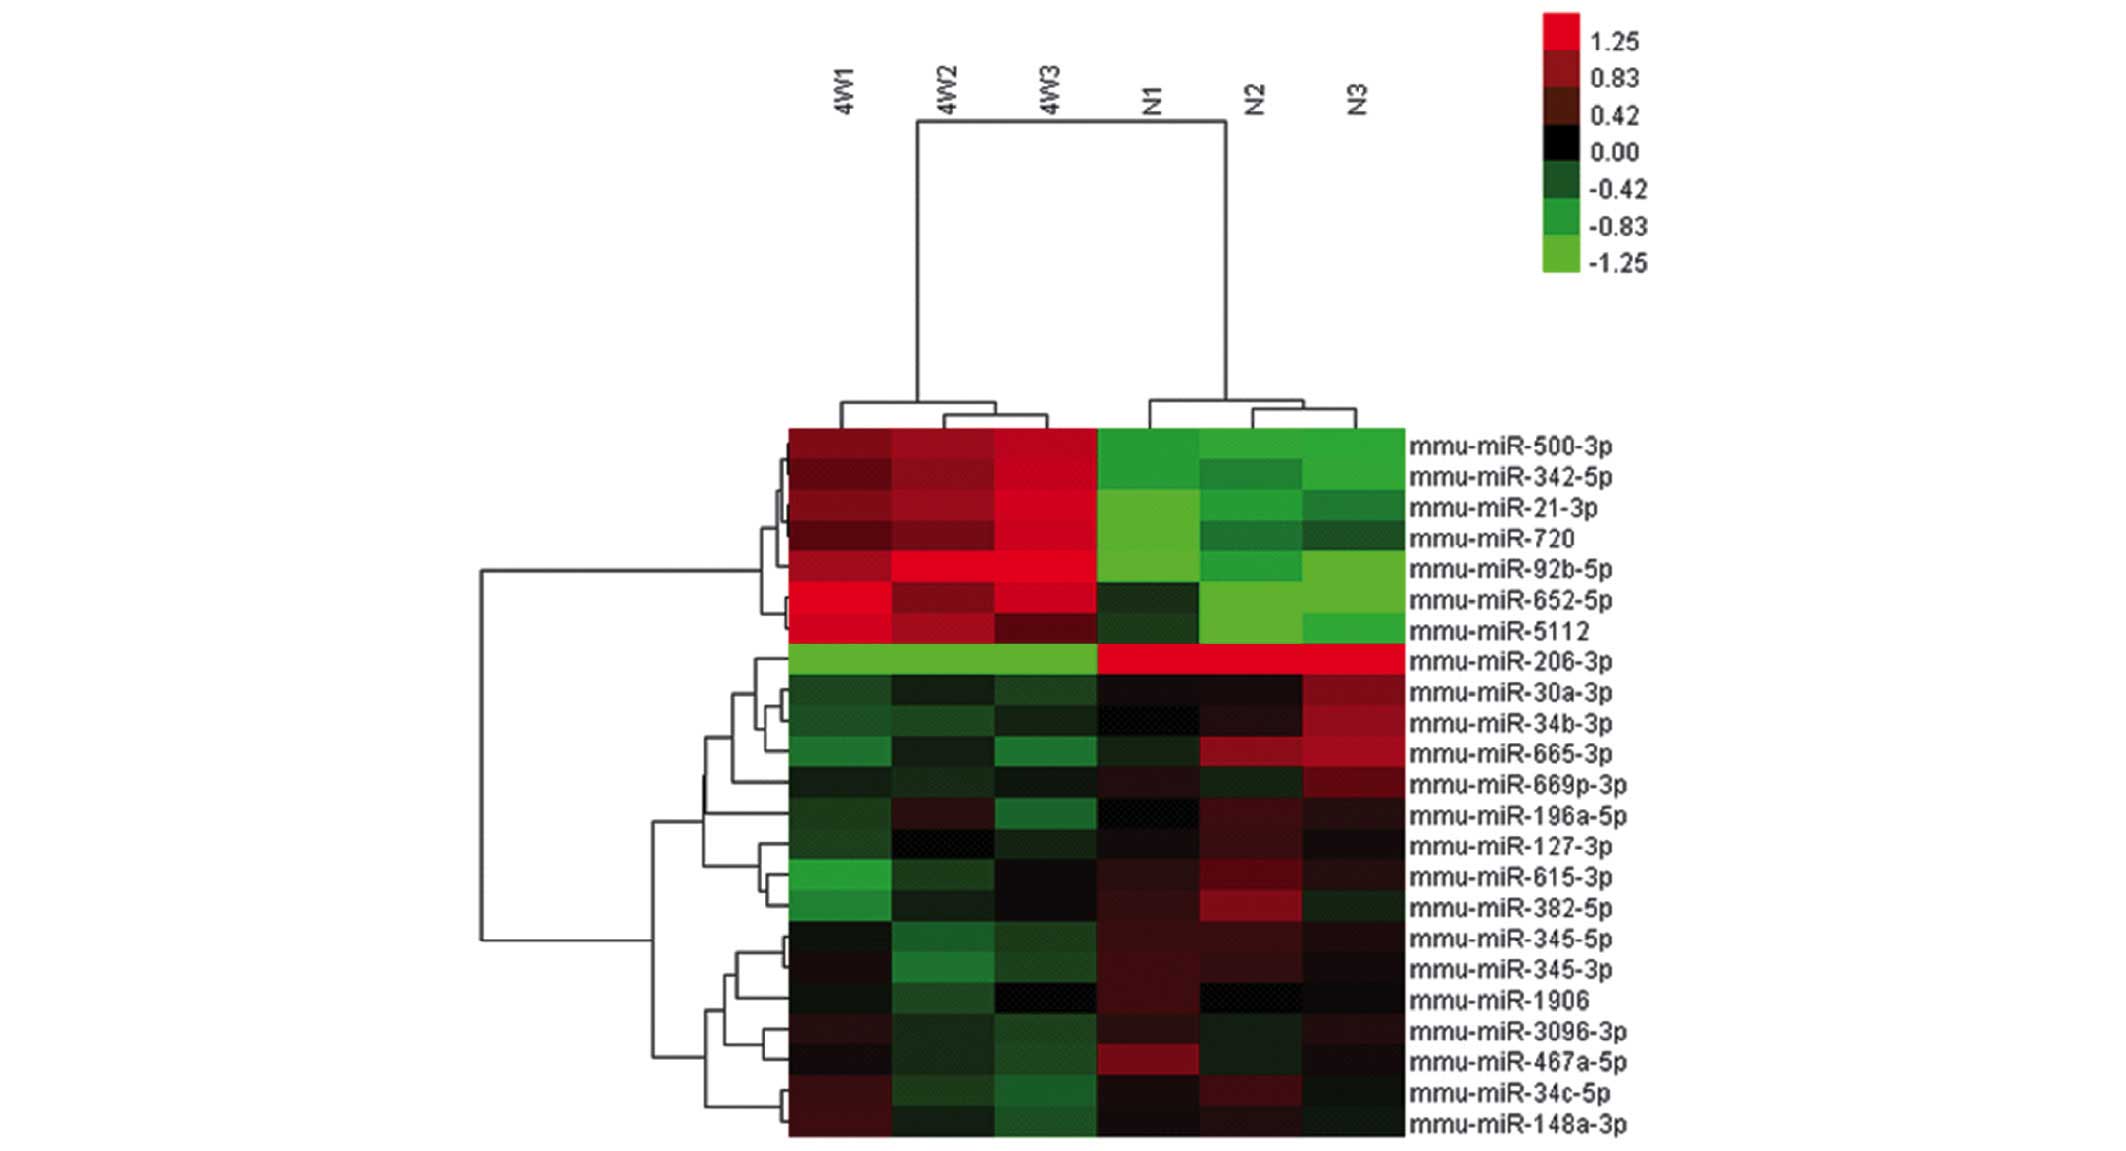
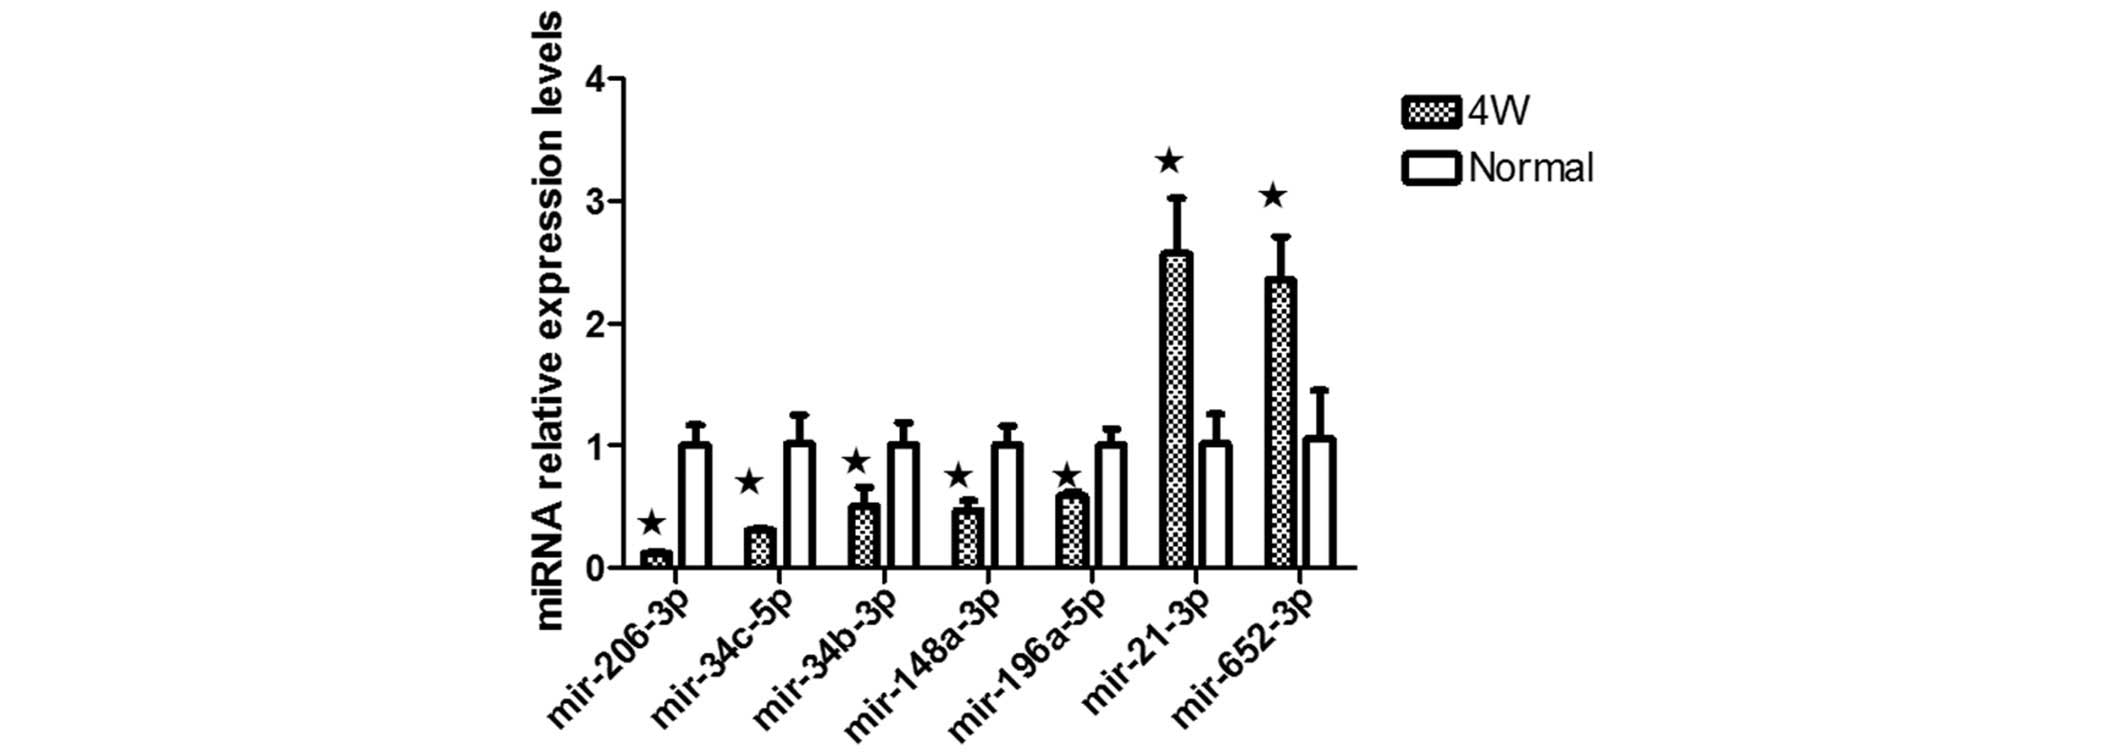
miRNA expression profiles of the
BMSCs
Using the Affymetrix GeneChip® mouse Genome Array,
the miRNA expression profiles of the BMSCs in the control and
experimental groups were determined. A total of seven BMSC miRNAs
were upregulated >1.5-fold in the experimental group compared
with the controls, while 16 miRNAs were expressed below the
threshold level (0.67-fold; Table
II; Fig. 5). RT-qPCR confirmed
the upregulated expression of the seven miRNAs, confirming the
results from the microarray assay (Fig. 6).
| Table IIDifferentially expressed miRs
identified in bone marrow stromal cells. |
Table II
Differentially expressed miRs
identified in bone marrow stromal cells.
| miR | ONFH mean | Control mean | Fold-change | P-value |
|---|
| Upregulated
microRNAs | | | | |
|
mmu-miR-500-3p | 202.62 | 99.04 | 2.05 |
4.1×10⁻⁴ |
| mmu-miR-21-3p | 13.40 | 6.31 | 2.13 |
1.9×10⁻³ |
|
mmu-miR-342-5p | 171.47 | 91.76 | 1.87 |
4.7×10⁻³ |
|
mmu-miR-92b-5p | 12.49 | 3.04 | 4.11 |
9.9×10⁻³ |
| mmu-miR-720 | 34.55 | 19.34 | 1.79 |
2.1×10⁻² |
|
mmu-miR-652-5p | 11.62 | 4.29 | 2.71 |
4.0×10⁻² |
| mmu-miR-5112 | 26.21 | 212.02 | 2.01 |
4.3×10⁻² |
| Downregulated
microRNAs | | | | |
|
mmu-miR-206-3p | 2.11 | 162.65 | 0.013 |
1.0×10⁻⁷ |
|
mmu-miR-30a-3p | 7.41 | 18.36 | 0.40 |
1.3×10⁻³ |
|
mmu-miR-127-3p | 12.32 | 26.12 | 0.47 |
1.7×10⁻³ |
|
mmu-miR-34b-3p | 21.38 | 55.84 | 0.38 |
2.3×10⁻³ |
|
mmu-miR-345-5p | 3.37 | 8.30 | 0.41 |
2.4×10⁻³ |
|
mmu-miR-615-3p | 7.62 | 20.25 | 0.38 |
6.6×10⁻³ |
|
mmu-miR-345-3p | 2.38 | 5.50 | 0.43 |
8.3×10⁻³ |
| mmu-miR-1906 | 6.15 | 12.06 | 0.51 |
1.3×10⁻² |
|
mmu-miR-196a-5p | 30.17 | 64.42 | 0.47 |
1.4×10⁻² |
|
mmu-miR-665-3p | 2.00 | 4.66 | 0.43 |
1.7×10⁻² |
|
mmu-miR-669p-3p | 2.00 | 3.52 | 0.57 |
1.7×10⁻² |
|
mmu-miR-3096-3p | 9.57 | 18.18 | 0.53 |
2.6×10⁻² |
|
mmu-miR-382-5p | 2.13 | 4.52 | 0.47 |
2.8×10⁻² |
|
mmu-miR-467a-5p | 3.27 | 6.87 | 0.48 |
3.0×10⁻² |
|
mmu-miR-34c-5p | 11.35 | 22.74 | 0.50 |
4.2×10⁻² |
|
mmu-miR-148a-3p | 2.30 | 3.72 | 0.62 |
4.9×10⁻² |
Microarray-based analysis
The global expression of miRNAs and mRNAs in ONFH
BMSCs was investigated using microarray technologies. Following
miRNA microarray data pre-processing, differential expression of 23
miRNAs was identified, of which, seven were upregulated and 16 were
downregulated. The microarray results were further analyzed using
the Targetscan database and bioinformatics, and determined that
miR-21-3p, miR-652-5p, miR-206-3p, miR-196a-5p, miR-34b-3p,
miR-34c-5p and miR-148a-3p may be involved in osteogenic
differentiation (Table III). To
confirm the microarray results, seven miRNAs, miR-21-3p,
miR-652-5p, miR-206-3p, miR-196a-5p, miR-34b-3p, miR-34c-5p and
miR-148a-3p, were analyzed by RT-qPCR (Fig. 6).
| Table IIImiRNAs associated with osteogenic
differentiation. |
Table III
miRNAs associated with osteogenic
differentiation.
| miR | ONFH mean | Control mean | Fold-change | P-value |
|---|
| Upregulated
miRNAs | | | | |
| mmu-miR-21-3p | 13.40 | 6.31 | 2.13 |
1.9×10⁻³ |
|
mmu-miR-652-5p | 11.62 | 4.29 | 2.71 |
4.0×10⁻² |
| Downregulated
miRNAs | | | | |
|
mmu-miR-206-3p | 2.11 | 162.65 | 0.01 |
1.0×10⁻⁷ |
|
mmu-miR-34b-3p | 21.38 | 55.84 | 0.38 |
2.3×10⁻³ |
|
mmu-miR-196a-5p | 30.17 | 64.42 | 0.47 |
1.4×10⁻² |
|
mmu-miR-34c-5p | 11.35 | 22.74 | 0.50 |
4.2×10⁻² |
|
mmu-miR-148a-3p | 2.30 | 3.72 | 0.62 |
4.9×10⁻² |
Discussion
The pathological process underlying the development
of femoral head avascular necrosis is highly complicated. A variety
of factors can cause the death of bone cells and marrow, and this
death and subsequent repair may lead to structural changes in the
femoral head, femoral head collapse, and/or joint dysfunction.
These symptoms are hallmarks of ONFH. Hormones are the leading
cause of avascular necrosis of the femoral head (1). In the United States, 12 million
patients suffer from steroid-induced femoral head necrosis annually
(2). The mechanisms underlying
glucocorticoid-induced femoral head necrosis are multifaceted. For
example, long-term usage of large doses of glucocorticoid can lead
to adipogenesis/fat hypertrophy (3), endothelial cell dysfunction or damage
(4), microthrombus formation
(5) and high intraosseous pressure
(6). These, in turn, can
eventually cause damage to the vascular endothelium,
microcirculation dysfunction and decreased arterial blood flow.
Eventually, bone ischemia, hypoxia, necrosis, damage to bone
structure and function, and avascular necrosis of the femoral head
may occur (12). A previous study
focused on the effects of steroids on local hemodynamic aspects of
the femoral head, which lead to ONFH (13), and another previous report revealed
that BMSCs exert an important role in femoral head necrosis. Wang
et al (14) and others
cultured BMSCs isolated from patients with steroid-induced
osteonecrosis and revealed that the efficiency of colony formation
was significantly lower compared with that observed in the healthy
controls, a result, which demonstrated reduced activity of BMSCs in
patients with femoral head necrosis. Previous studies have
demonstrated that large doses of corticosteroids can lead to
decreased expression of Runx2/Cbfa1 in BMSCs, while under identical
conditions the expression of PPAR-γ and Dickkopf-1 increased. These
changes in the expression levels affected the differentiation of
BMSCs and led to imbalances in bone resorption and calcaneus
destruction (15,16). Based on these previous studies,
there appears to be a close association was observed between BMSCs
and femoral head necrosis, therefore, making the use of BMSCs in
the treatment of osteonecrosis a topic of significant interest.
There have been no direct reports demonstrating that
changes in miRNA expression can result in femoral head necrosis;
however, a large number of studies have demonstrated that miRNA is
important in regulating the osteogenic differentiation of BMSCs. A
previous study knocked out Dicer and Drosha, critical proteins in
the miRNA pathway, and revealed that mesenchymal stem cells were
unable to develop into osteoblasts and adipocytes (17). During this investigation of the BMP
pathway, it was revealed that miRNA-208 (18), miRNA-125b (19), miRNA-141 (20) and miRNA-200a (20) promoted osteoblast differentiation.
Additionally, investigations on the Wnt pathway revealed that
miRNA-27 (21), miRNA-29a
(22), and miRNA-29b (23) promoted osteoblast differentiation.
Therefore, it was speculated that large doses of hormones affect
the osteogenic and adipogenic differentiation of BMSCs by altering
the miRNA expression levels, destroying the balance between
osteogenesis and osteoclast activity, and ultimately leading to
necrosis of the femoral head.
The present study investigated murine BMSCs in an
attempt to elucidate the pathogenesis of steroid-induced
osteonecrosis through the comparison of miRNA expression levels
between these cells isolated from ONFH mice and controls. Following
analysis of the microarray results, 23 significant differences were
identified in the miRNA expression between the ONFH group and the
control group, with seven upregulated and 16 downregulated miRNAs.
Furthermore, through bioinformatics analysis, it was determined
that seven miRNAs (miR-21-3p, miR-652-5p, miR-206-3p, miR-196a-5p,
miR-34b-3p, miR-34c-5p and miR-148a-3p) may be involved in
osteogenic differentiation. Of these, two were upregulated
(miR-21-3p and miR-652-5p), and five were downregulated
(miR-206-3p, miR-196a-5p, miR-34b-3p, miR-34c-5p and miR-148a-3p).
The expression of miR-206-3p decreased markedly compared with the
control group. Previous studies have suggested that miRNA-206-3p
can inhibit IdI-3/MyoR, thereby activating MyoD and promoting
muscle differentiation (24,25).
During the process of osteoblast differentiation, miRNA-206-3p
expression levels are known to decrease (26). The target of miR-196a-5p is the Hox
gene family, which is important in animal limb development
(27,28) and BMSC differentiation.
Additionally, miRNA-196a-5p promotes the osteogenic differentiation
via the BMP pathway. miRNA-34b-3p and miR-34c-5p are involved in
the Notch (29), Runx2 (30) and SATB2 pathways (31), and are important in osteoblast
differentiation by inhibiting osteogenic differentiation. Following
an investigation of osteoporosis, Yang et al (32) revealed that miRNA-21-3p inhibits
Spry-1 and therefore, promotes osteoblast differentiation (32,33),
whereas another previous study revealed that increased levels of
miRNA-21-3p and miRNA-148a-3p are important in osteoclast
differentiation (34,35). Additionally, it has been
demonstrated that miRNA-652-5p expression increases in osteosarcoma
(36). From these previous
results, it was concluded that osteogenic and adipogenic
differentiation of BMSCs is regulated by multiple miRNAs, and
requires an integrated signaling network. Large doses of hormones
can affect the differentiation of BMSCs by altering the expression
of miRNAs, causing imbalances between osteogenesis and osteoclast
activity, leading to the occurrence of osteonecrosis.
According to previous studies, the downregulation of
miR-206-3p, miR-34b-3p and miR-34c-5p, as well as the upregulation
of miR-21-3p, has a role in promoting osteogenic differentiation.
By contrast, the downregulation of miR-196a-5p inhibits osteogenic
differentiation. Furthermore, based on these previous studies,
there is a close association exists between osteogenic
differentiation of BMSCs and femoral head necrosis in mice. The
present study therefore hypothesized that miR-196a-5p may be
important in the process of steroid-induced femoral head necrosis.
The underlying mechanisms remain to be elucidated in further
studies.
References
|
1
|
Fukushima W, Fujioka M, Kubo T, Tamakoshi
A, Nagai M and Hirota Y: Nationwide epidemiologic survey of
idiopathic osteonecrosis of the femoral head. Clin Orthop Relat
Res. 468:2715–2724. 2010. View Article : Google Scholar : PubMed/NCBI
|
|
2
|
Koo KH, Kim R, Kim YS, Ahn IO, Cho SH,
Song HR, Park YS, Kim H and Wang GJ: Risk period for developing
osteonecrosis of the femoral head in patients on steroid treatment.
Clin Rheumatol. 21:299–303. 2002. View Article : Google Scholar : PubMed/NCBI
|
|
3
|
Motomura G, Yamamoto T, Miyanishi K,
Yamashita A, Sueishi K and Iwamoto Y: Bone marrow fat-cell
enlargement in early steroid-induced osteonecrosis-a
histomorphometric study of autopsy cases. Pathol Res Pract.
200:807–811. 2005. View Article : Google Scholar
|
|
4
|
Wei J, Shi Y, Zheng L, Zhou B, Inose H,
Wang J, Guo XE, Grosschedl R and Karsenty G: miR-34 s inhibit
osteoblast proliferation and differentiation in the mouse by
targeting SATB2. J Cell Biol. 197:509–521. 2012. View Article : Google Scholar : PubMed/NCBI
|
|
5
|
Li M, Yu M, Liu C, Zhu H, He X, Peng S and
Hua J: miR-34c works downstream of p53 leading to dairy goat male
germline stem-cell (mGSCs) apoptosis. Cell Prolif. 46:223–231.
2013. View Article : Google Scholar : PubMed/NCBI
|
|
6
|
Yang N, Wang G, Hu C, Shi Y, Liao L, Shi
S, Cai Y, Cheng S, Wang X, Liu Y, et al: Tumor necrosis factor α
suppresses the mesenchymal stem cell osteogenesis promoter miR-21
in estrogen deficiency-induced osteoporosis. J Bone Miner Res.
28:559–573. 2013. View Article : Google Scholar
|
|
7
|
Tan G, Kang PD and Pei FX: Glucocorticoids
affect the metabolism of bone marrow stromal cells and lead to
osteonecrosis of the femoral head: a review. Chin Med J (Engl).
125:134–139. 2012. View Article : Google Scholar
|
|
8
|
He X, Yan YL, Eberhart JK, Herpin A,
Wagner TU, Schartl M and Postlethwait JH: miR-196 regulates axial
patterning and pectoral appendage initiation. Dev Biol.
357:463–477. 2011. View Article : Google Scholar : PubMed/NCBI
|
|
9
|
Oskowitz AZ, Lu J, Penfornis P, Ylostalo
J, McBride J, Flemington EK, Prockop DJ and Pochampally R: Human
multipotent stromal cells from bone marrow and microRNA: regulation
of differentiation and leukemia inhibitory factor expression. Proc
Natl Acad Sci USA. 105:18372–18377. 2008. View Article : Google Scholar : PubMed/NCBI
|
|
10
|
Bolstad BM, Irizarry RA, Astrand M and
Speed TP: A comparison of normalization methods for high density
oligonucleotide array data based on variance and bias.
Bioinformatics. 19:185–193. 2003. View Article : Google Scholar : PubMed/NCBI
|
|
11
|
Chen C, Ridzon DA, Broomer AJ, Zhou Z, Lee
DH, Nguyen JT, Barbisin M, Xu NL, Mahuvakar VR, Andersen MR, et al:
Real-time quantification of microRNAs by stem-loop RT-PCR. Nucleic
Acids Res. 33:e1792005. View Article : Google Scholar : PubMed/NCBI
|
|
12
|
Lian JB, Stein GS, van Wijnen AJ, Stein
JL, Hassan MQ, Gaur T and Zhang Y: MicroRNA control of bone
formation and homeostasis. Nat Rev Endocrinol. 8:212–227. 2012.
View Article : Google Scholar : PubMed/NCBI
|
|
13
|
Kerachian MA, Séguin C and Harvey EJ:
Glucocorticoids in osteonecrosis of the femoral head: A new
understanding of the mechanisms of action. J Steroid Biochem Mol
Biol. 114:121–128. 2009. View Article : Google Scholar : PubMed/NCBI
|
|
14
|
Wang BL, Sun W, Shi ZC, Lou JN, Zhang NF,
Shi SH, Guo WS, Cheng LM, Ye LY, Zhang WJ and Li ZR: Decreased
proliferation of mesenchymal stem cells in corticosteroid-induced
osteonecrosis of femoral head. Orthopedics. 31:4442008.
|
|
15
|
Hornstein E, Mansfield JH, Yekta S, Hu JK,
Harfe BD, McManus MT, Baskerville S, Bartel DP and Tabin CJ: The
microRNA miR-196 acts upstream of Hoxb8 and Shh in limb
development. Nature. 438:671–674. 2005. View Article : Google Scholar : PubMed/NCBI
|
|
16
|
Choo SW and Russell S: Genomic approaches
to understanding Hox gene function. Adv Genet. 76:55–91. 2011.
View Article : Google Scholar : PubMed/NCBI
|
|
17
|
Oskowitz AZ, Lu J, Penfornis P, Ylostalo
J, McBride J, Flemington EK, Prockop DJ and Pochampally R: Human
multipotent stromal cells from bone marrow and microRNA: Regulation
of differentiation and leukemia inhibitory factor expression. Proc
Natl Acad Sci USA. 105:18372–18377. 2008. View Article : Google Scholar : PubMed/NCBI
|
|
18
|
Itoh T, Takeda S and Akao Y: MicroRNA-208
modulates BMP-2-stimulated mouse preosteoblast differentiation by
directly targeting V-ets erythroblastosis virus E26 oncogene
homolog 1. J Biol Chem. 285:27745–27752. 2010. View Article : Google Scholar : PubMed/NCBI
|
|
19
|
Mizuno Y, Yagi K, Tokuzawa Y,
Kanesaki-Yatsuka Y, Suda T, Katagiri T, Fukuda T, Maruyama M, Okuda
A, Amemiya T, et al: miR-125b inhibits osteoblastic differentiation
by down-regulation of cell proliferation. Biochem Biophys Res
Commun. 368:267–272. 2008. View Article : Google Scholar : PubMed/NCBI
|
|
20
|
Itoh T, Nozawa Y and Akao Y: MicroRNA-141
and -200a are involved in bone morphogenetic protein-2-induced
mouse pre-osteoblast differentiation by targeting distal-less
homeobox 5. J Biol Chem. 284:19272–19279. 2009. View Article : Google Scholar : PubMed/NCBI
|
|
21
|
Wang T and Xu Z: miR-27 promotes
osteoblast differentiation by modulating Wnt signaling. Biochem
Biophys Res Commun. 402:186–189. 2010. View Article : Google Scholar : PubMed/NCBI
|
|
22
|
Kapinas K, Kessler C, Ricks T, Gronowicz G
and Delany AM: miR-29 modulates Wnt signaling in human osteoblasts
through a positive feedback loop. J Biol Chem. 285:25221–25231.
2010. View Article : Google Scholar : PubMed/NCBI
|
|
23
|
Li Z, Hassan MQ, Jafferji M, Aqeilan RI,
Garzon R, Croce CM, van Wijnen AJ, Stein JL, Stein GS and Lian JB:
Biological functions of miR-29b contribute to positive regulation
of osteoblast differentiation. J Biol Chem. 284:15676–15684. 2009.
View Article : Google Scholar : PubMed/NCBI
|
|
24
|
Kim HK, Lee YS, Sivaprasad U, Malhotra A
and Dutta A: Muscle-specific microRNA miR-206 promotes muscle
differentiation. J Cell Biol. 174:677–687. 2006. View Article : Google Scholar : PubMed/NCBI
|
|
25
|
Luo W, Nie Q and Zhang X: MicroRNAs
involved in skeletal muscle differentiation. J Genet Genomics.
40:107–116. 2013. View Article : Google Scholar : PubMed/NCBI
|
|
26
|
Inose H, Ochi H, Kimura A, Fujita K, Xu R,
Sato S, Iwasaki M, Sunamura S, Takeuchi Y, Fukumoto S, et al: A
microRNA regulatory mechanism of osteoblast differentiation. Proc
Natl Acad Sci USA. 106:20794–20799. 2009. View Article : Google Scholar : PubMed/NCBI
|
|
27
|
He X, Yan YL, Eberhart JK, Herpin A,
Wagner TU, Schartl M and Postlethwait JH: miR-196 regulates axial
patterning and pectoral appendage initiation. Dev Biol.
357:463–477. 2011. View Article : Google Scholar : PubMed/NCBI
|
|
28
|
Sehm T, Sachse C, Frenzel C and Echeverri
K: miR-196 is an essential early-stage regulator of tail
regeneration, upstream of key spinal cord patterning events. Dev
Biol. 334:468–480. 2009. View Article : Google Scholar : PubMed/NCBI
|
|
29
|
Bae Y, Yang T, Zeng HC, Campeau PM, Chen
Y, Bertin T, Dawson BC, Munivez E, Tao J and Lee BH: miRNA-34c
regulates Notch signaling during bone development. Hum Mol Genet.
21:2991–3000. 2012. View Article : Google Scholar : PubMed/NCBI
|
|
30
|
Zhang Y, Xie RL, Croce CM, Stein JL, Lian
JB, van Wijnen AJ and Stein GS: A program of microRNAs controls
osteogenic lineage progression by targeting transcription factor
Runx2. Proc Natl Acad Sci USA. 108:9863–9868. 2011. View Article : Google Scholar : PubMed/NCBI
|
|
31
|
Wei J, Shi Y, Zheng L, Zhou B, Inose H,
Wang J, Guo XE, Grosschedl R and Karsenty G: miR-34s inhibit
osteoblast proliferation and differentiation in the mouse by
targeting SATB2. J Cell Biol. 197:509–521. 2012. View Article : Google Scholar : PubMed/NCBI
|
|
32
|
Yang N, Wang G, Hu C, Shi Y, Liao L, Shi
S, Cai Y, Cheng S, Wang X, Liu Y, et al: Tumor necrosis factor α
suppresses the mesenchymal stem cell osteogenesis promoter miR-21
in estrogen deficiency-induced osteoporosis. J Bone Miner Res.
28:559–573. 2013. View Article : Google Scholar
|
|
33
|
Lian JB, Stein GS, van Wijnen AJ, Stein
JL, Hassan MQ, Gaur T and Zhang Y: MicroRNA control of bone
formation and homeostasis. Nat Rev Endocrinol. 8:212–227. 2012.
View Article : Google Scholar : PubMed/NCBI
|
|
34
|
Cheng P, Chen C, He HB, Hu R, Zhou HD, Xie
H, Zhu W, Dai RC, Wu XP, Liao EY and Luo XH: miR-148a regulates
osteoclastogenesis by targeting V-maf musculoaponeurotic
fibrosarcoma oncogene homolog B. J Bone Miner Res. 28:1180–1190.
2013. View Article : Google Scholar
|
|
35
|
Sugatani T, Vacher J and Hruska KA: A
microRNA expression signature of osteoclastogenesis. Blood.
117:3648–3657. 2011. View Article : Google Scholar : PubMed/NCBI
|
|
36
|
Lulla RR, Costa FF, Bischof JM and Chou
PM: Identification of differentially expressed MicroRNAs in
Osteosarcoma. Sarcoma. 2011(732690)2011. View Article : Google Scholar : PubMed/NCBI
|