Introduction
Ovarian cancer is the fifth most common cause of
mortality among women, following breast, lung, colon and pancreatic
cancer (1). Due to the usually
late recognition and low therapeutic efficiency, ovarian cancer is
a huge challenge for treatment. The risk of occurrence of ovarian
cancer during a lifetime is 2% (2). Prognosis at any stage of ovarian
cancer is grave and the results of treatment are not satisfactory
(2). According to the accepted
procedure, the basic treatment at stage I and II of ovarian cancer
is laparotomy. Women with cancer at stages III and IV are treated
with chemotherapy, using platinum-based drugs (3). The 5 year survival rate following
diagnosis of ovarian cancer is 30% (2). However, dynamic development of
immunology, molecular biology and genetics creates novel
opportunities for cancer treatment and leads to the development of
novel therapies. One of the promising novel developments is
anticancer immunotherapy, a therapy based on the use of monoclonal
antibodies and utilizing the physiological mechanisms of immune
response regulation, including the complement dependent
cytotoxicity (4). Although
anticancer immunotherapy is becoming more and more popular and
several novel applications have been described, no reports exist
about effective immunotherapy for ovarian cancer.
The complement system consists of >30 proteins
and is a major component of the innate immune response. It also
acts as a bridge between the innate and adaptive immune responses
and promotes inflammatory processes. Activation of the complement
system initiates a protein cascade enzymatic reaction. The result
of this reaction is sequential formation of convertase C3,
convertase C5 and finally attack of the membrane complex, also
termed the C5b-9 complex. Three known pathways of complement system
activation exist: Classical, alternative and initiated by the
lectin association with the cell surface (4,5). A
group of proteins responsible for the stability of the complement
system reactions is known as regulators of complement activation.
The group of complement regulators contains factors present in the
serum or associated with the cell membrane. The most important
fluid phase factors are inhibitor of the C1 complex formation,
C4-binding protein, factor H (FH) and FH-like protein 1 (FHL-1).
The key complement regulators associated with the cell membrane
are: Complement receptor (CR) type-1 [cluster of differentiation
(CD)35], CR2, membrane cofactor protein (CD46), decay-accelerating
factor (CD55) and homologous restriction factor (CD59) (6). These proteins, associated with the
cell membrane, protect normal cells from complement mediated cell
lysis. Cancer cells can protect themselves by the production of
immunosuppressive agents (7).
Secretion of soluble forms of complement system inhibitors, FH and
FHL-1, by ovarian cancer cells protect them from humoral immune
responses (8). FH is a single
polypeptide chain plasma glycoprotein, which is present in the
plasma at a concentration of 110–615 µg/ml (9). Expression of inhibitors of the
complement system may be stimulated by cytokines.
A higher concentration of cytokines is observed in
the tumor microenvironment. In ovarian cancer, the key role is
played by interleukin (IL)6. Its concentration in ovarian cancer
can be 1,000-fold higher compared with that in cysts and 10-fold
higher than in cancer of the digestive system (10,11).
It is assumed that IL-6 present in serum and ascitic fluid is very
important in the development of ovarian cancer. An elevated
concentration of IL-6 has been documented to correlate with a poor
prognosis, enhanced survival of ovarian cancer cells and multidrug
resistance (12-14). A previous study addressed the role of IL-6 in
promoting the chemoresistance of cancer cells (15). Results from in vitro
research on liver cancer cell lines, Hep3B and HepG2, have shown
that IL-6 increased the expression of complement system inhibitors,
CD55 and CD59, associated with the cell membrane (16). Tumor cells may also protect
themselves by binding soluble complement inhibitors from serum,
including complement factors, FH and FHL-1. However, to the best of
our knowledge, the role of IL-6 and IL-8 on the expression levels
of FH and FHL-1 in ovarian cancer cells remains to be characterized
and investigated.
The aim of present study was to assess of the role
of IL-6 and IL-8 on the expression levels of fluid-phase complement
inhibitors, FH and FHL-1, in the A2780 established ovarian
carcinoma cell line, known to not produce IL-6, however, is IL-6
responsive due to the presence of the IL-6 receptor.
Materials and methods
Interleukin and antibodies
Human IL-6 and human IL-8 were purchased from
Sigma-Aldrich (St. Louis, MO, USA). The following antibodies were
purchased from Santa Cruz Biotechnology, Inc., (Santa Cruz, CA,
USA): Monoclonal mouse anti-FH (sc-166613), polyclonal goat
anti-FHL-1 (sc-17953), monoclonal mouse anti-β-actin (sc-47778),
horseradish peroxidase-conjugated donkey anti-goat secondary
antibody (sc-2020) and horseradish peroxidase-conjugated goat
anti-mouse secondary antibody (sc-2005).
Cell culture
The human A2780 ovarian cancer cell line was
obtained from the European Collection of Cell Culture (Salisbury,
UK). A2780 cells were cultured in RPMI-1640 medium (Sigma-Aldrich),
supplemented with L-glutamine (Sigma-Aldrich),
penicillin-streptomycin (10 U/ml-100 µg/ml; Sigma-Aldrich)
and 10% fetal bovine serum (FBS; Sigma-Aldrich), in a humidified
atmosphere of 95% air and 5% CO2 at 37°C.
Stimulation of cells
A2780 cells were seeded into Petri dishes
(3×10⁵ cells/ml in 5 ml). Following washing, the cells
were incubated in medium containing increasing concentrations of
IL-6 or a combination of IL-6 and IL-8. After 24 h of incubation,
the supernatant was collected in new Eppendorf tubes and frozen at
−80°C for subsequent enzyme-linked immunosorbent assay (ELISA). The
cells were incubated with 5 mM ethylenediaminetetraacetic acid
(EDTA) in phosphate-buffered saline (PBS) for 10 min. The cells
were subsequently placed into new tubes and centrifuged at 12,000 ×
g for 10 min at 4°C. The supernatant was removed and the
precipitated cells were stored at −80°C for western blotting.
Western blotting
The cells were lysed in radioimmunoprecipitation
lysis buffer comprising 1% Tergitol, 0.5% sodium deoxycholate, 0.1%
sodium dodecyl sulphate (SDS), 1 mM EDTA, 1 mM
ethyleneglycoltetraacetic acid, 1 mM NaVO4, 20 mM NaF,
0.5 dithiothreitol, 1 mM phenylmethanesulfonyl fluoride and
protease inhibitor cocktail in PBS. The lysates were centrifuged at
12,000 × g for 10 min at 4°C. The protein concentration in the
supernatant was measured using a bicinchoninic acid assay kit
(Thermo Fisher Scientific, Inc., Waltham, MA, USA). A total of 20
mg protein from each sample was electrophoresed on a 10%
SDS-polyacrylamide gel electrophoresis gel under reducing
conditions, and were subsequently transferred onto polyvinylidene
difluoride membranes. Non-specific binding sites on the membranes
were blocked with 5% non-fat milk in Tris-buffered saline
containing 0.05% Tween-20 for 1 h at room temperature. The membrane
was probed with mouse monoclonal anti-FH (1:1,000), goat polyclonal
anti-FHL-1 (1:1,000) and mouse monoclonal anti-β-actin antibodies
overnight at 4°C. The membrane was subsequently incubated at room
temperature for 1 h with horseradish peroxidase-conjugated donkey
anti-goat or goat anti-mouse secondary antibody (1:2,000).
Visualization of the protein bands was performed using Pierce
enhanced chemiluminescence western blotting substrate (Pierce,
Thermo Scientific, Inc.). The protein bands were quantified using
Image J software (version 1.48; Media Cybernetics, Inc., Rockville,
MD, USA) and normalized against β-actin values.
Densitometric analysis
In order to measure the protein expression level,
the intensity of specific bands corresponding to the proteins of
interest were determined using the commercially available Image J
software. Firstly, the photographic film with bands was scanned.
The scanned blot images were imported into the software and were
contrast adjusted to ensure the bands were clearly visible on the
blot image. Background intensity was subtracted from the blot
image. The bands were subsequently selected by drawing a tight
boundary around them. The intensities of the selected bands were
displayed in an excel format, which can be exported for performing
further statistical analyses.
ELISA
To determine the quantity of FH or FHL-1 in the
medium samples, a Human Complement FH ELISA kit (EIAab Science Co.,
Ltd., Wuhan, China) and ELISA kit for complement FH-related protein
(CFHR1) (USCN Life Science Inc., Wuhan, China) were used,
respectively. Each test was performed, according to manufacture's
protocol. The FH assay detection range was 0.15–10.00 ng/ml and the
FHL-1 assay detection range was 0.625–40 ng/ml.
Reverse transcription-quantitative
polymerase chain reaction (RT-qPCR)
The total RNA was extracted from cultured cells
after 24 h incubation with various concentrations of IL-6 or
IL-6/IL-8 using a High Pure RNA Isolation kit (Roche, Basel,
Switzerland), according to manufacture's protocol. The extracted
RNA was purified and diluted in DNase and RNase-free water. The
quality and quantity of isolated RNA was measured using a
spectrophotometer NanoDrop® (Thermo Fisher Scientific,
Inc.). Reverse-transcriptase PCR was performed using High-Capacity
cDNA Reverse Transcriptase (Thermo Fisher Scientific, Inc.). The
quantitys of used RNA was 2,000 ng in a final volume of 20
µl. Subsequently, 1 µl of the resulting cDNA solution
(100 ng) was used in qPCR, using primers and probes specific for
complement factor H (CFH) and CFHR1. TagMan® Gene
Expression assays (Thermo Fisher Scientific, Inc.) including
specific primers and probes were purchased from Thermo Fisher
Scientific, Inc. (Assay ID, CFH-Hs00962373_m1 and
CFHR1-Hs00275663_m1). The relative expression was calculated using
the 2−ΔΔCq method (17). β-actin mRNA was used as an
endogenous control to normalize CFH and CFHR1
input.
Immunofluorescence
The cells were grown on Lab-Tek Chamber Slides
(Nunc, Roskilde, Denmark) in RPMI-1640 medium, containing 10% FBS.
After 24 h, the cells were incubated in medium containing various
concentrations of IL-6/IL-8 (1, 10 or 100 ng/ml) for a further 24
h. Following incubation, the slides were fixed in 3.7% formaldehyde
for 15 min and were next permeabilized in 0.1% Triton X-100 for 10
min. Following permeabilization, the slides were blocked in 3%
bovine serum albumen solution for 15 min at room temperature, and
following washing were incubated overnight at 4°C with mouse
monoclonal anti-FH (ab118820) and anti-FHL-1 (ab76912) primary
antibodies (both dilutions, 1:200; both purchased from Abcam,
Cambridge, UK) at a concentration of 5 µg/ml. Subsequently,
the secondary antibody, donkey anti-mouse immunoglobulin G Alexa
Fluor® 488 conjugated (green) (ab150105; Abcam) was used
at a 1:1,000 dilution for 1.5 h at room temperature. Fluorescence
labeling was analyzed under a fluorescent microscope (BX51,
Olympus, Tokyo, Japan).
Statistical analysis
Statistical analysis was performed using GraphPad
Prism software (version 5.0; GraphPad Software, Inc., La Jolla, CA,
USA). Multiple comparisons were performed using one-way analysis of
variance followed by Tukey's post hoc test. The data are presented
as the mean ± standard deviation. All statistical tests were
two-sided and P<0.05 was considered to indicate a statistically
significant difference.
Results
FH, compared with FHL-1, is produced and
secreted by ovarian cancer cells, independent of different doses of
IL stimulation
The quantity of FH and FHL1 in the culture medium
from A2780 cells stimulated by various concentrations (1, 10 or 100
ng/ml) of IL-6 alone or IL-6/IL-8 combination was determined after
24 h by an ELISA. The results revealed that ovarian cancer cells
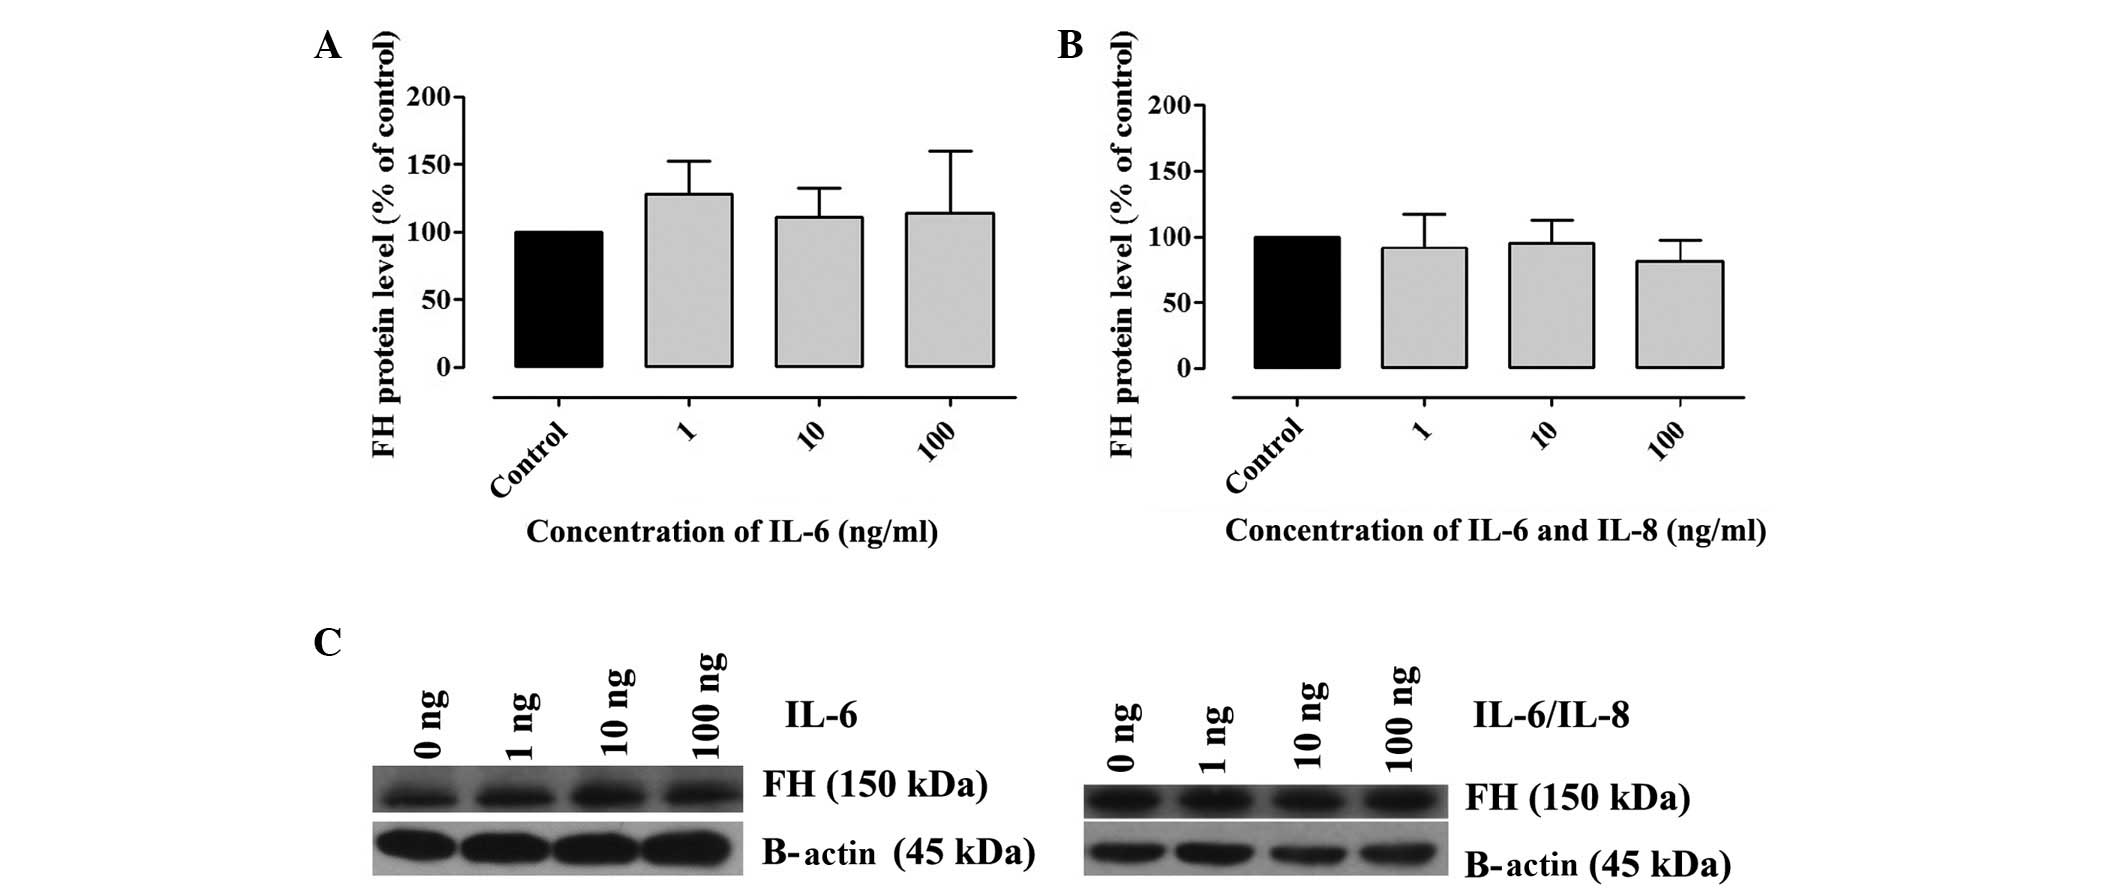
produced and secreted FH into the medium (Table I). However, the production of FH by
A2780 cancer cells was unaffected by the addition of IL-6. No
significant difference in the concentration of FH was observed in
the control cells when compared with the samples incubated with
IL-6 alone (Fig. 1A) and IL-6/IL-8
(Fig. 1B). The quantity of FHL-1
in the culture medium was either below the detection limit of the
ELISA used, or these cancer cells did not secrete FHL-1. A totla of
two independent tests were performed under the same conditions. In
this study, we present the results from only one analysis. Each
test had control samples from medium and fetal bovine serum used
for research. FH and FHL-1 in the control sample were absent.
 | Table IFH secretion in response to
stimulation with various concentrations of IL-6 or IL6/IL-8
mixture. |
Table I
FH secretion in response to
stimulation with various concentrations of IL-6 or IL6/IL-8
mixture.
A, Secretion of FH in
culture medium from A2780 cells stimulated with various
concentrations of IL-6
|
|---|
| IL-6 concentration
(ng/ml) | Concentration of FH
(ng/ml) |
|---|
| 0 (control) | 10.20±0.33 |
| 1 | 9.72±0.21 |
| 10 | 10.10±0.33 |
| 100 | 9.76±0.18 |
B, Secretion of FH in
culture medium from A2780 cells stimulated with a mixture of
various concentrations of IL-6and IL-8
|
|---|
| IL-6/IL-8
concentration (ng/ml) | Concentration of FH
(ng/ml) |
|---|
| 0 (control) | 10.23±0.43 |
| 1 | 10.88±0.30 |
| 10 | 10.79±0.26 |
| 100 | 11.07±0.17 |
Intracellular protein expression levels
of FH and FHL-1 protein is not regulated by the IL-6/IL-8 in a
dose-dependent manner
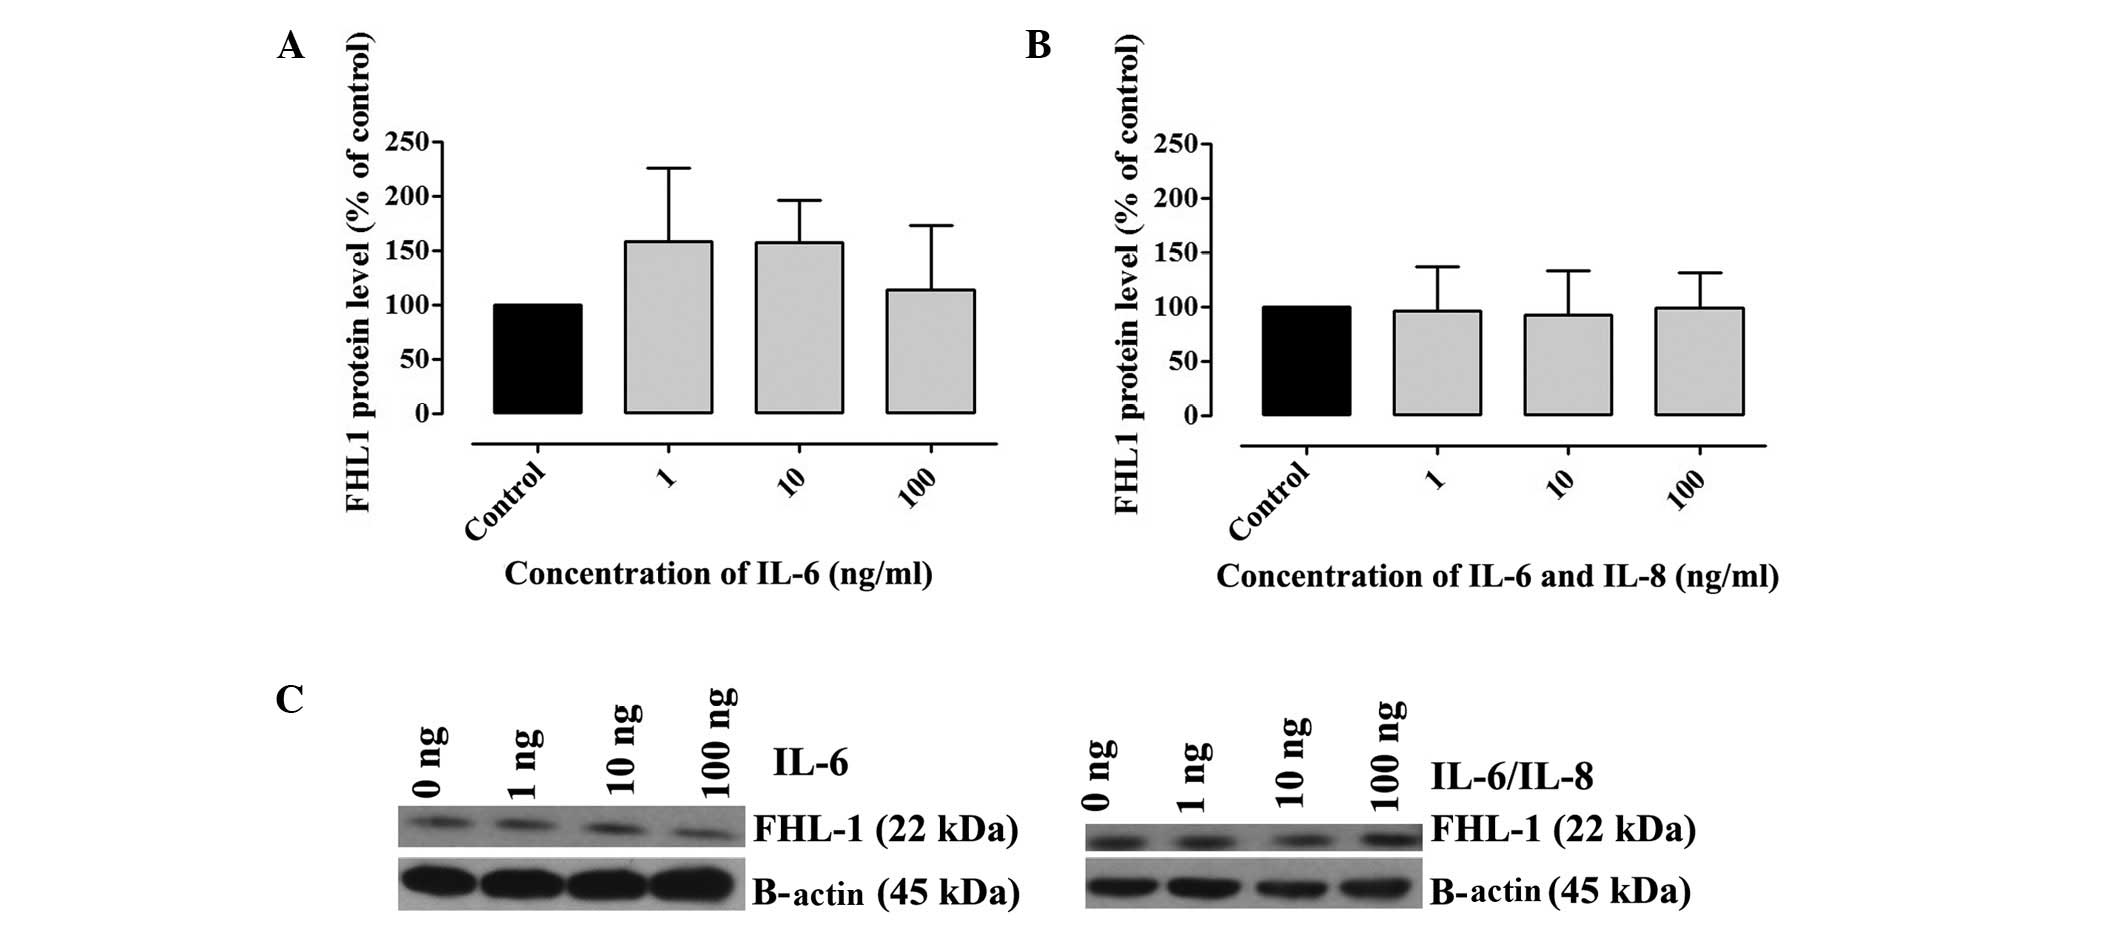
The presence of FH and FHL-1 in cell lysates was
confirmed by western blotting. A2780 cells were incubated with
various concentrations of IL-6 alone or IL-6/IL-8. The results
revealed that A2780 cells produced FH and FHL-1 proteins. No
significant differences in the concentration of FH (Fig. 2) and FHL-1 (Fig. 3) were observed in the samples
incubated with IL-6 alone or IL-6/IL-8 combination, when compared
with the control (Fig. 2).
However, an upward trend was observed in the concentration of FH
and FHL-1 in cell lysates following incubation with IL-6 (Figs. 2A and 3A). A total of three independent tests
were performed under the same conditions. In the present study,
densitometric analysis results were normalized against β-actin.
mRNA expression levels of FH and
FHL-1
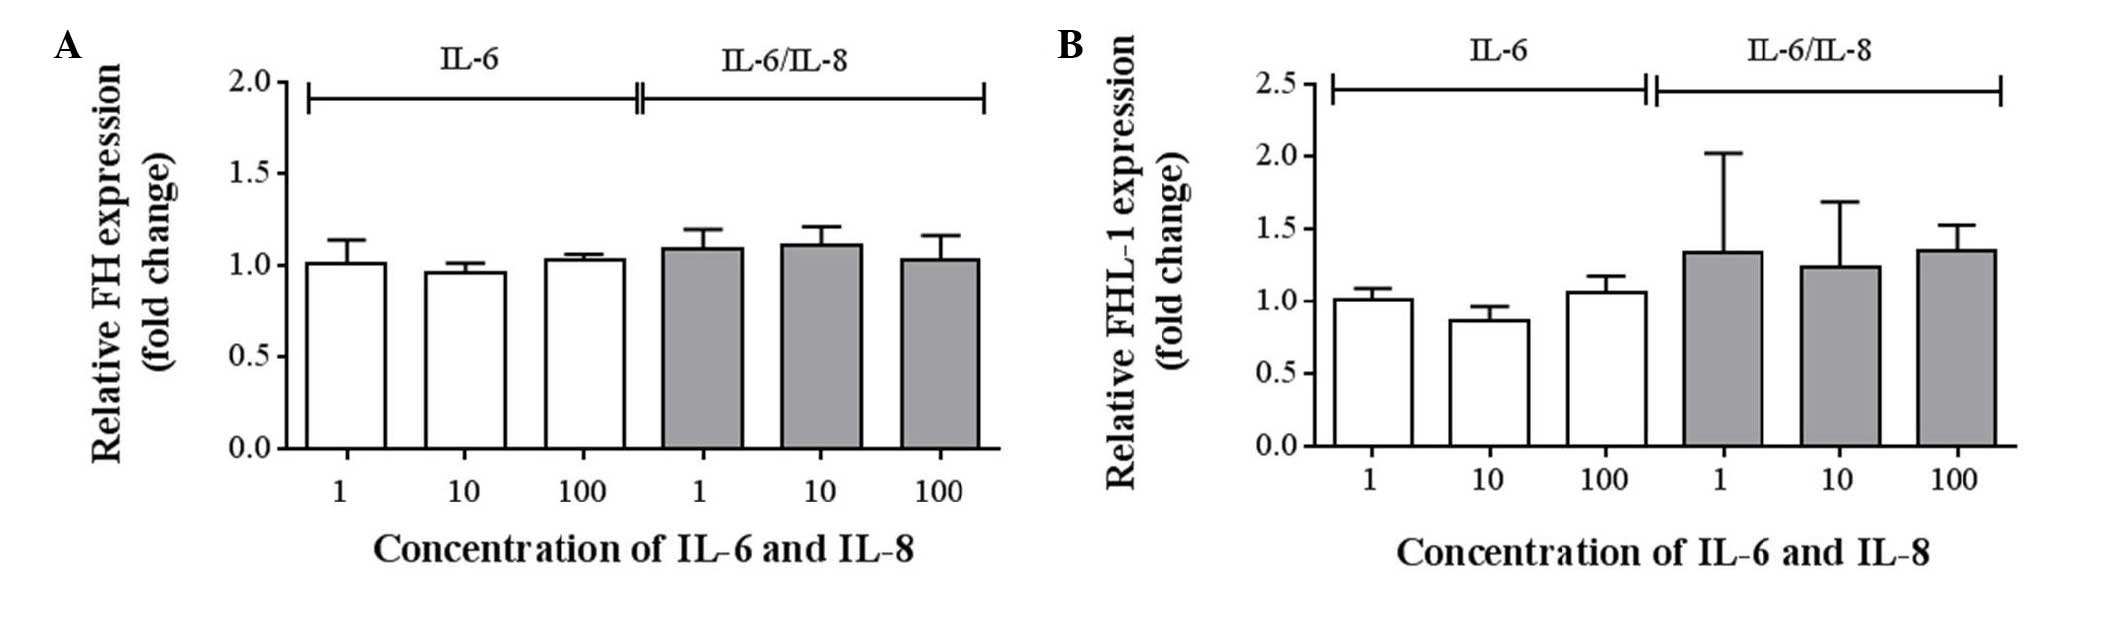
To assess the mRNA expression levels of FH and
FHL-1, TagMan® Gene Expression assays were preformed for
CFH and CFHR1. No statistically significant differences were
detected between the expression levels of FH (Fig. 4A) and FHL-1 (Fig. 4B), compared with the control
(Table II). However, a minimal
upward trend was observed in the expression of FHL-1 following
incubation with IL-6/IL-8 combined (Fig. 4B; Table II).
| Table IIGene expression levels in response to
stimulation with various concentrations of IL-6 or IL-6/IL-8 as
quantified by quantitative polymerase chain reaction. |
Table II
Gene expression levels in response to
stimulation with various concentrations of IL-6 or IL-6/IL-8 as
quantified by quantitative polymerase chain reaction.
A, Gene expression of
complement factor H
|
|---|
| Concentration of IL-6
(ng/ml) | Fold change | Concentration of
IL-6/8 (ng/ml) | Fold change |
|---|
| 1 | 1.02±0.13 | 1 | 1.09±0.11 |
| 10 | 0.96±0.06 | 10 | 1.11±0.11 |
| 100 | 1.04±0.03 | 100 | 1.04±0.13 |
B, Gene expression of
complement factor H-like protein 1
|
|---|
| Concentration of IL-6
(ng/ml) | Fold change | Concentration of
IL-6/8 (ng/ml) | Fold change |
|---|
| 1 | 1.01±0.09 | 1 | 1.34±0.69 |
| 10 | 0.87±0.10 | 10 | 1.25±0.45 |
| 100 | 1.07±0.11 | 100 | 1.36±0.18 |
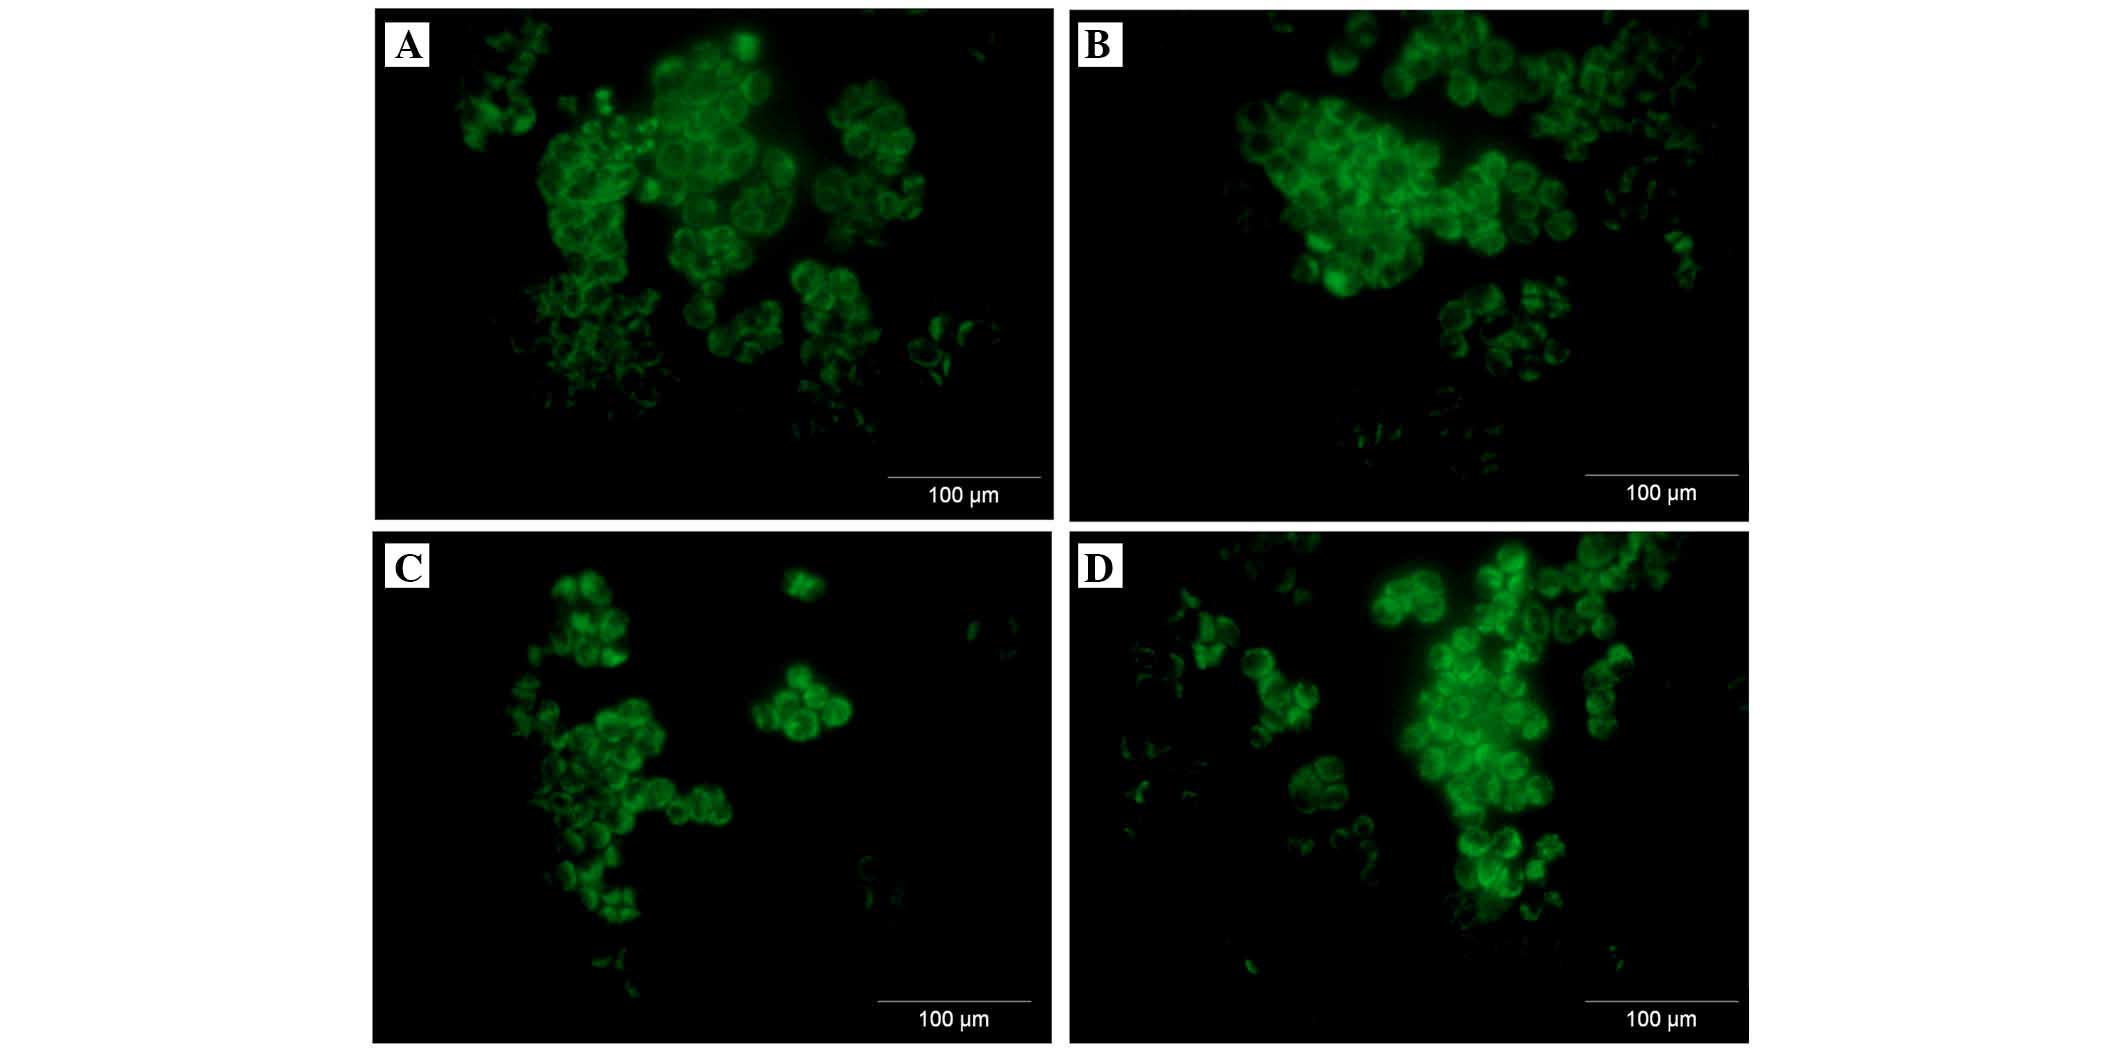
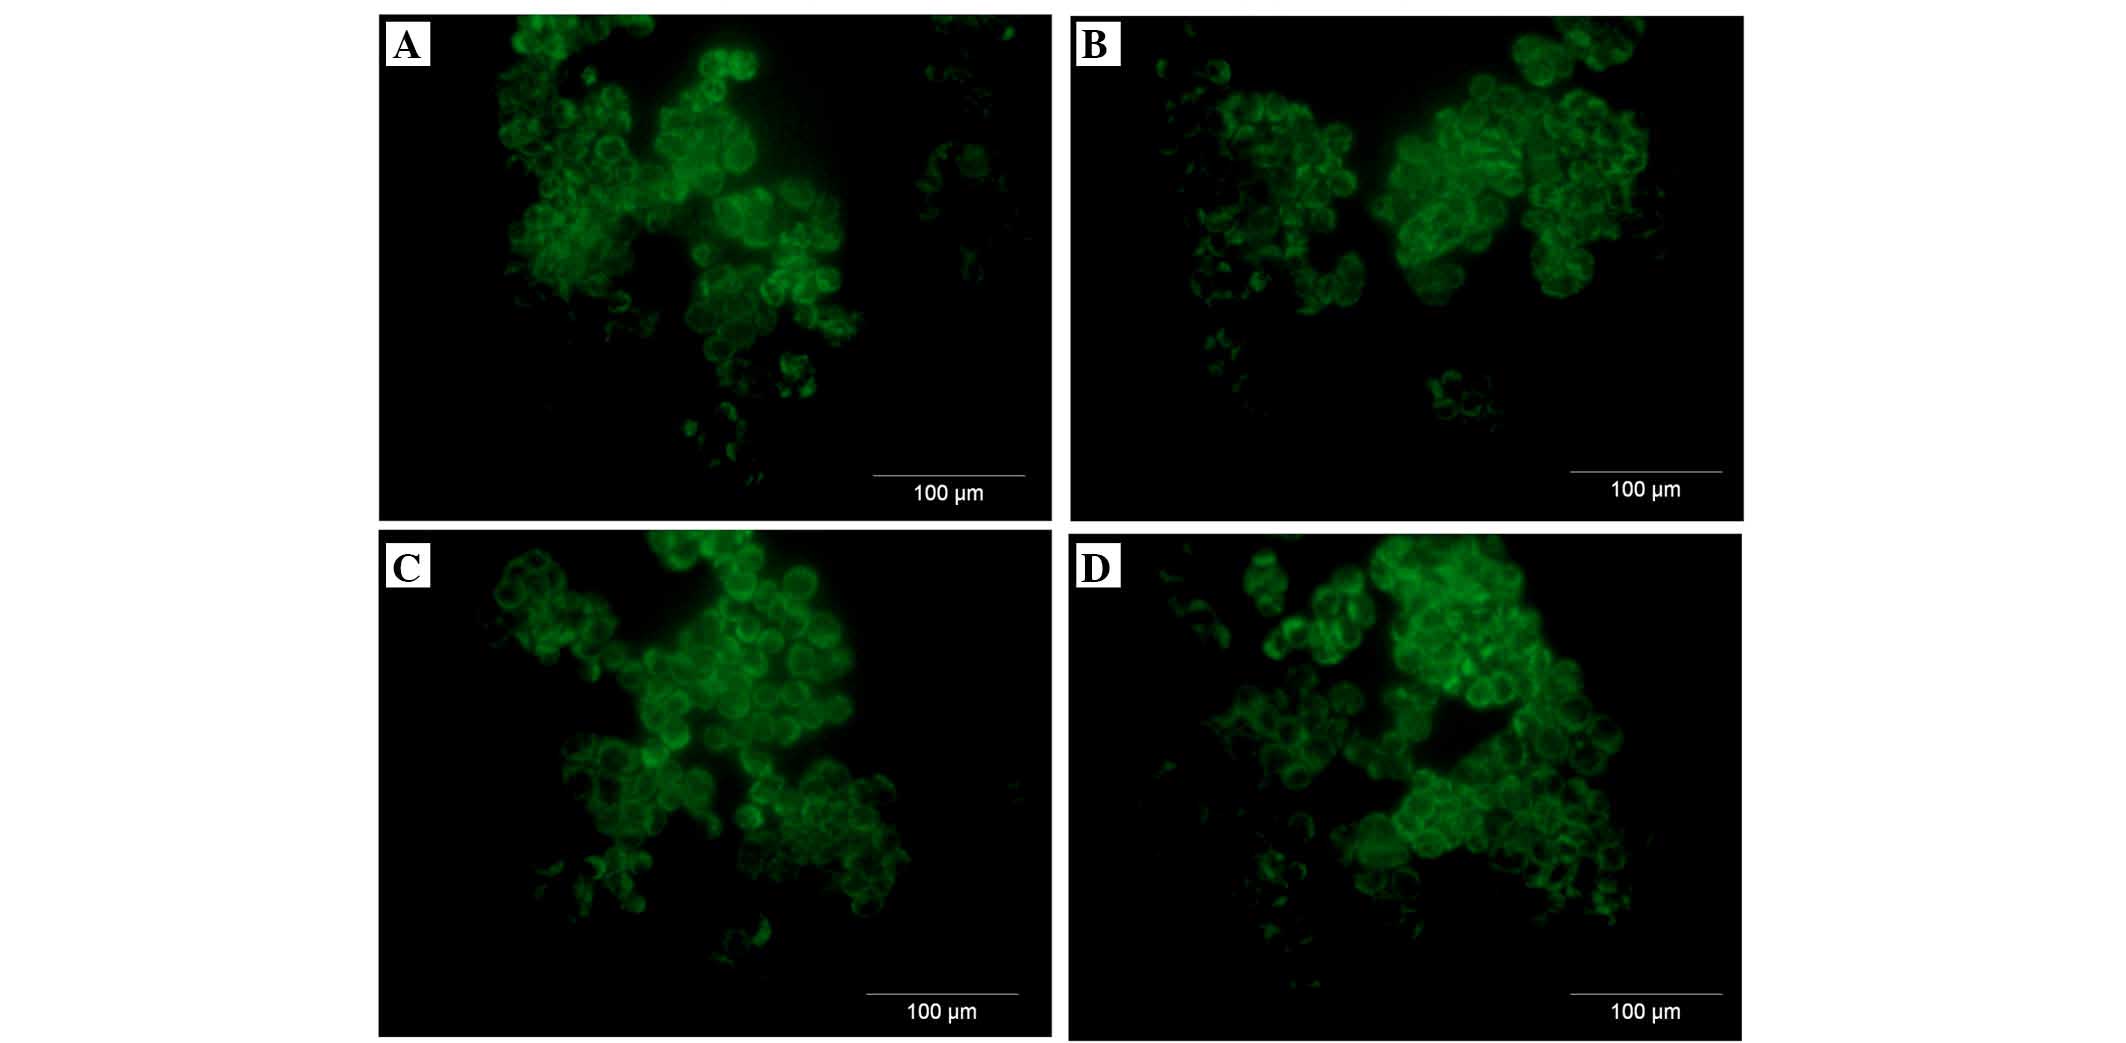
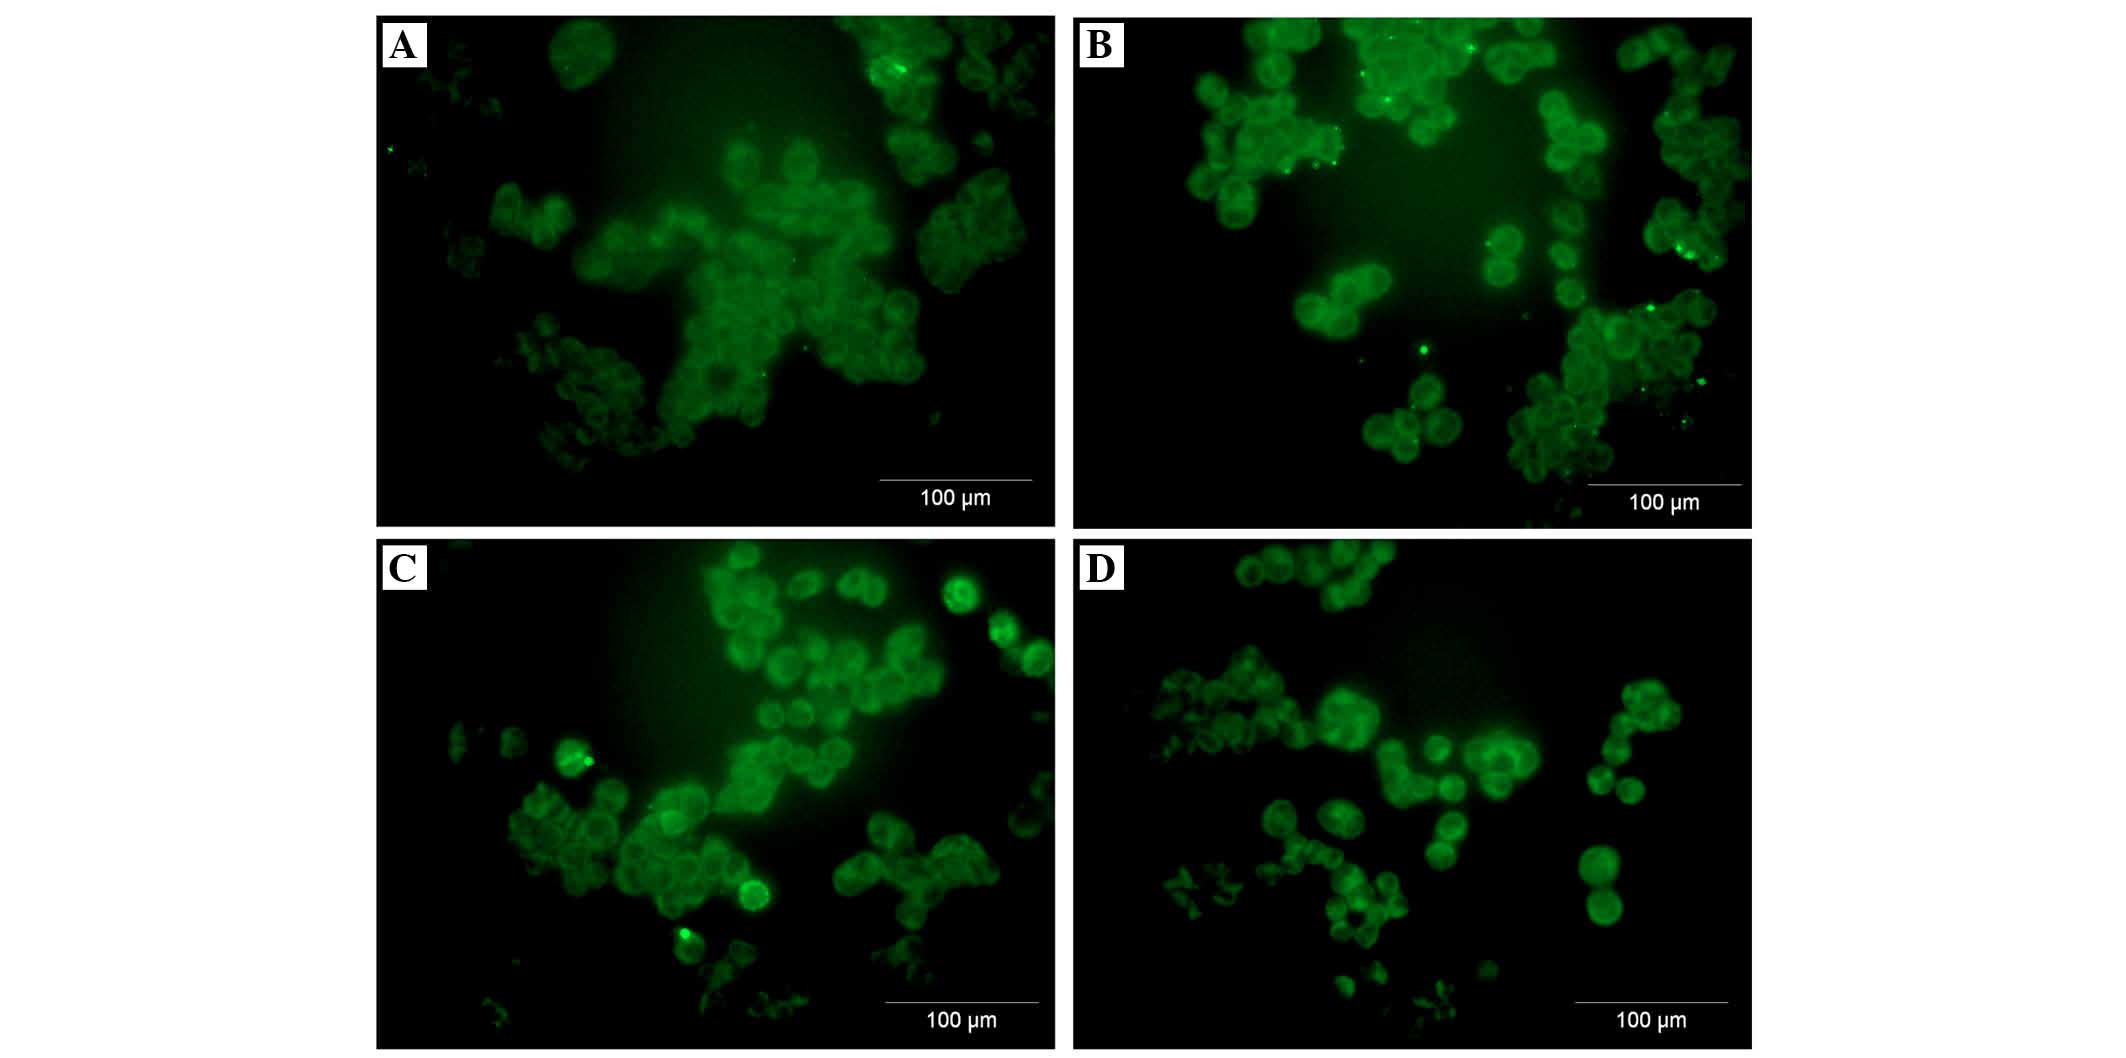
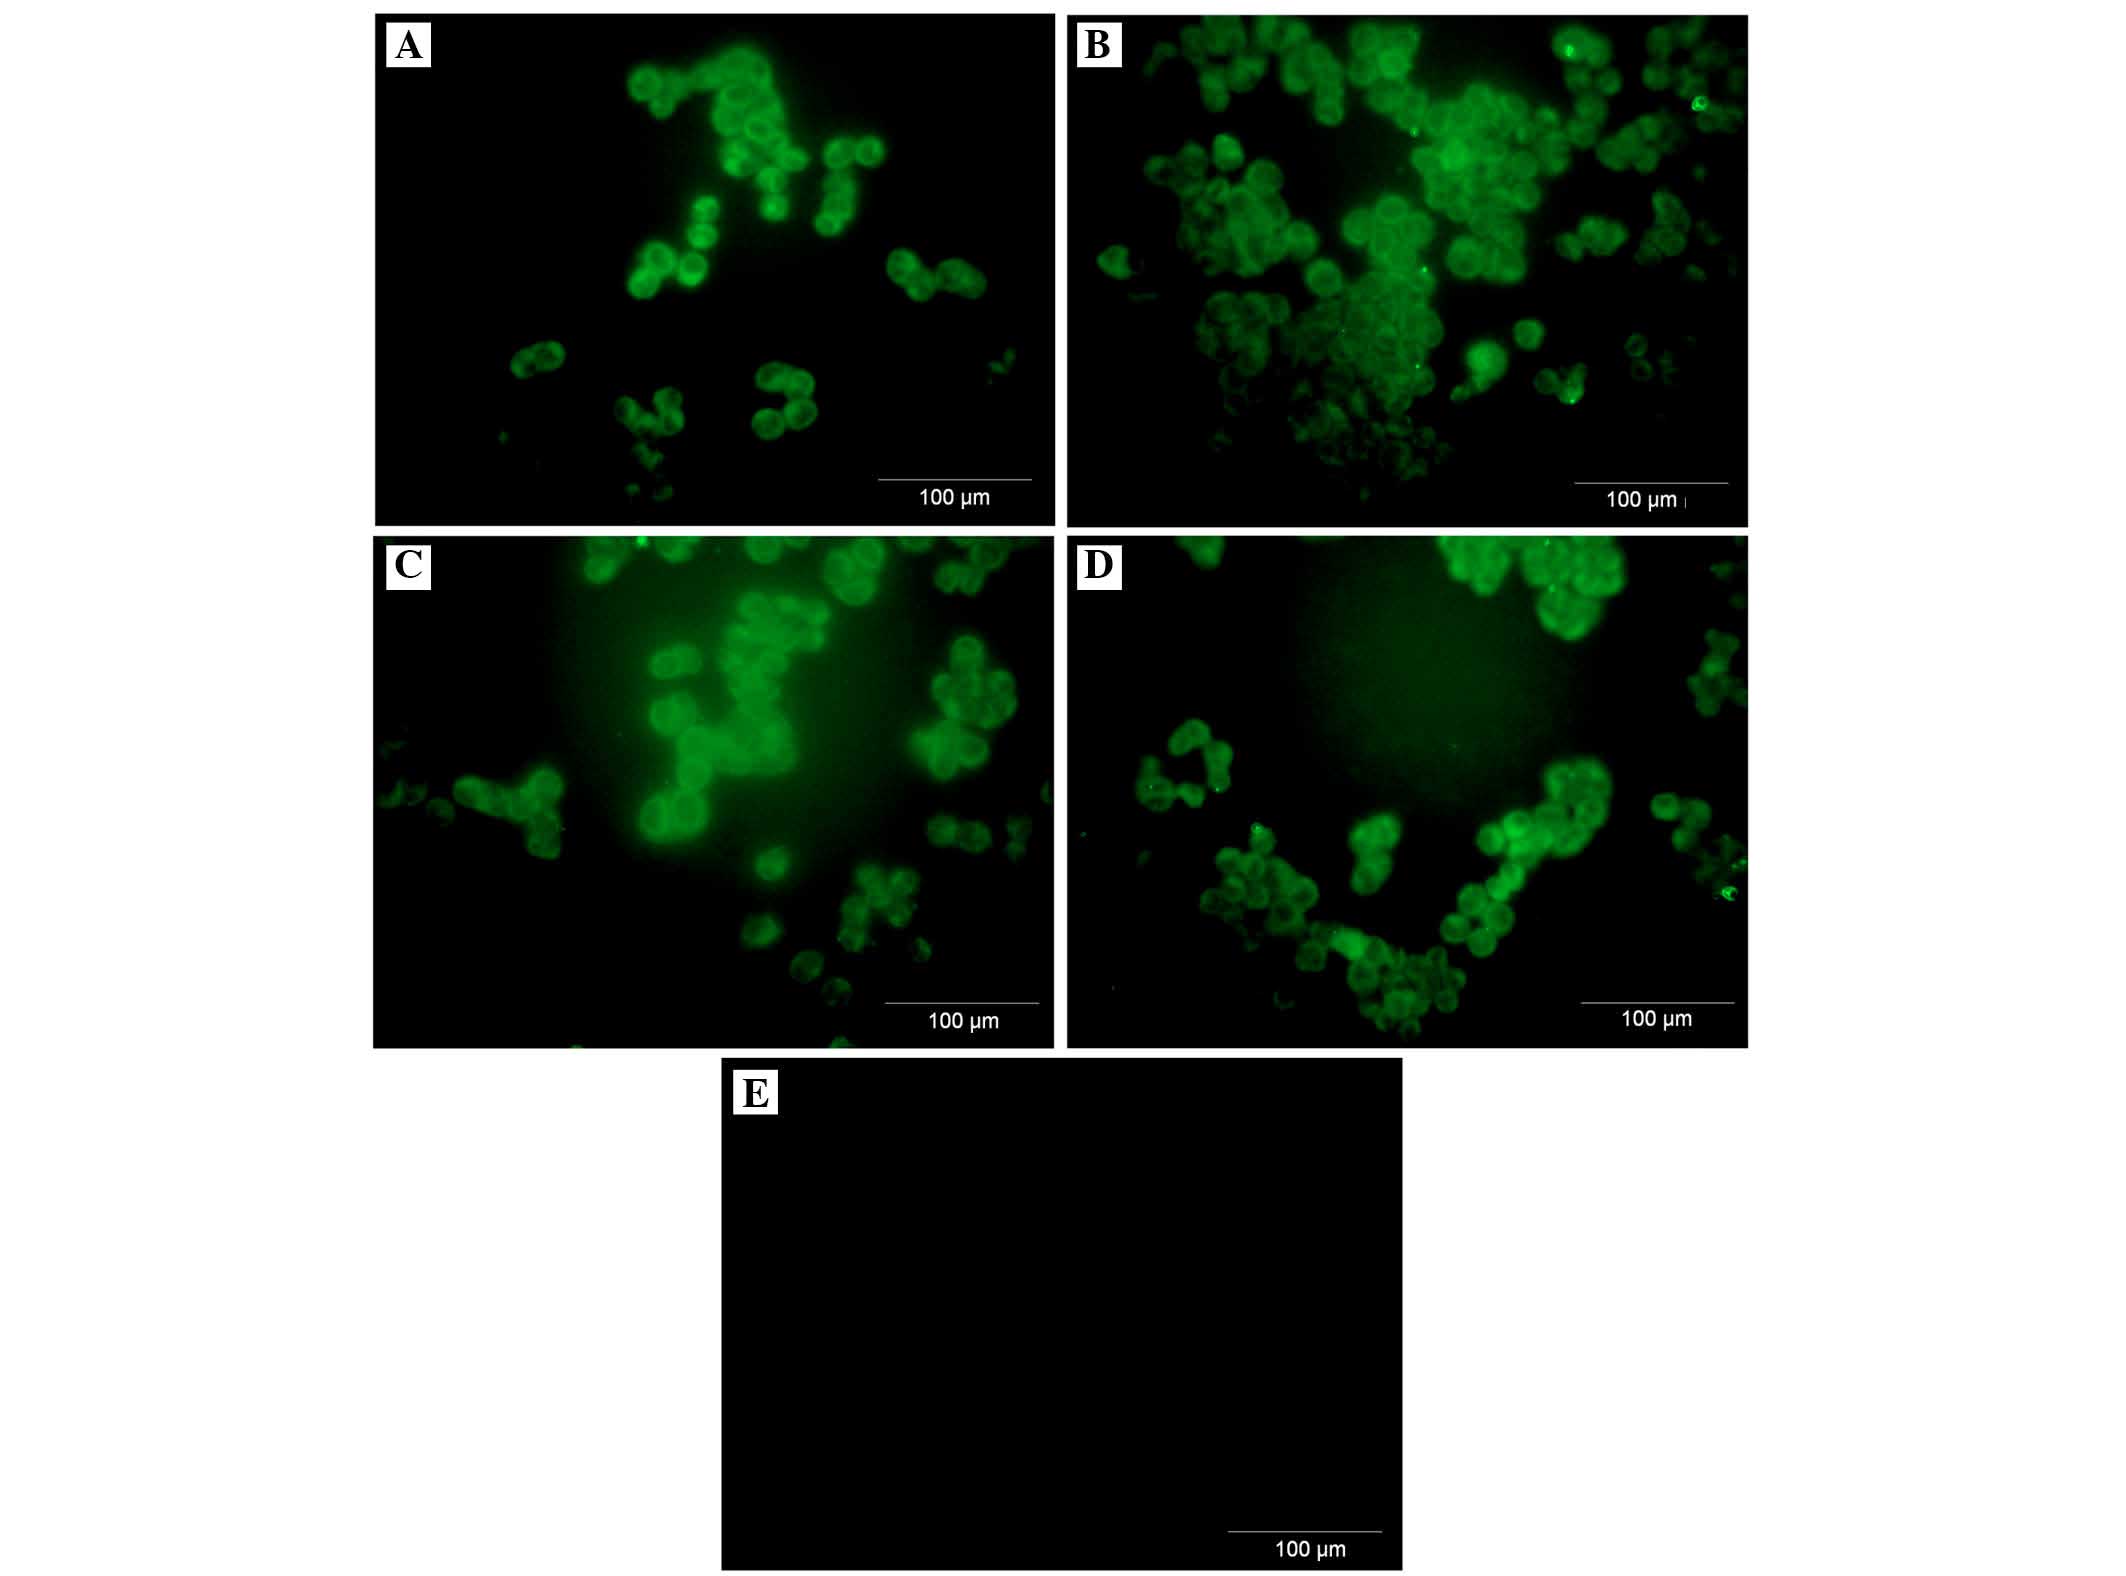
A2780 ovarian cancer cell line expresses
both membranous and intracellular forms of FH and FHL-1
protein
To assess the cellular localization of the FH and
FHL-1 proteins in ovarian cancer cells, immunofluorescence analysis
was performed in the A2780 ovarian cancer cell line. Cancer cells
were incubated for 24 h with various concentrations of IL-6 alone
or IL-6/IL-8 combined. As expected, the protein expression of FH
(Figs. 5 and 6) and FHL-1 (Figs. 7 and 8) were detected on the cancer cells
membrane.
Discussion
Cancer cells can escape immune surveillance by
developing inhibitory mechanisms that provide resistance to
immunological recognition and subsequent complement attack
(18). Ovarian carcinoma is the
most common primary tumor, which leads to the production of free
abdominal fluid or ascites (19).
It has been widely reported that IL-6 is overexpressed in the serum
and ascites in patients with ovarian malignancy. Furthermore, the
elevated level of IL-6 in these fluids correlates with poor
prognosis and survival (14). Wang
et al (20) demonstrated
that IL-6 and IL-8 may promote the cell proliferation of CAOV-3 and
OVCAR-3 cells in a time- and dose-dependent manner. Additionally,
this cell proliferation induced by IL-6 and IL-8 was suppressed by
the use of specific antibodies. However, in the previous study,
IL-6 and IL-8 had a synergistic effect on the proliferation of
CAOV-3 cells, however, not on OVCAR-3 cells. This mechanism was not
associated with the complement system (20). Unfortunately, the exact role that
IL-6 and IL-8 serve in ovarian malignancies remains to be
established. The present study attempted to determine the influence
of IL-6 and IL-8 on the expression levels of FH and FHL-1.
Certain tumor cells have also been identified to
secrete the soluble complement regulators, FH and FHL-1 (19). FH is one of the central complement
regulators, which belongs to a protein family that includes FHL-1
and five CFHR proteins (21).
Junnikkala et al (8)
demonstrated that ovarian tumor cells produce FH and FHL-1, and
additionally that these factors were present in the apical part of
the tumor cell layers in tissue sections. The authors revealed that
FH and FHL-1 were abundantly present in the ascetic fluids of
patients with ovarian cancer, and that a relative proportion of
FHL-1 was clearly increased in the malignant ascites specimens
(8). Ajona et al (18) demonstrated that the majority of
non-small cell lung cancer cell lines constitutively produce both
CFH and FHL-1 (18).
To the best of the our knowledge, the role of IL-6
and IL-8 on FH and FHL-1 expression in ovarian cancer cells has not
been characterized and investigated. In the present results, it was
observed that A2780 ovarian cancer cells can secrete inhibitors of
the complement system, FH and FHL-1. No differences were observed
between the cells incubated with various concentrations of IL-6 and
IL-8, and without these cytokines by western blotting and ELISA.
The results of western blotting revealed that the protein level of
both FH and FHL-1 was not regulated by IL-6 and IL-8. However, in
the ELISA, FH, however, not FHL-1, was produced and secreted by
ovarian cancer cells, but this process was independent of different
doses of IL stimulation. No significant difference in the
concentration of FH was detected in the control cells when compared
with the samples incubated with IL-6/IL-8. No differences in the
mRNA expression levels of FH and FHL-1 were confirmed by qPCR
(Table II). Only a minimal upward
trend in the expression of FHL-1 was observed following incubation
with IL-6 and IL-8 combined (Fig.
4B). Kapka-Skrzypczak et al (22) previously demonstrated the results
of qPCR analysis of FH and FHL-1 expression in four groups of
tissue: Ovarian cancer, normal ovary, endometrial cancer and normal
endometrium (22). The authors
detected no differences between the expression of FH and FHL-1 in
all experimental groups, particularly between normal and cancer
tissues (22).
In vitro conditions differ from in
vivo conditions. In the in vivo tumor microenvironment,
the affect of IL-6 and IL-8 is rather constant. IL-6 is secreted by
mesothelial cells, fibroblasts, macrophages, ovarian tumor cells,
and IL-8 is secreted by endothelial cells, mesothelial cells,
monocytes and ovarian tumor cells (23). Tumor microenvironment is involved
in all processes of ovarian cancer progression (23). Based on the present results, it was
concluded that A2780 cells express FH and secrete this protein into
the environment, however, it is independent of IL-6 and IL-8.
Additionally, these cancer cells are able to bind FH and FHL-1 to
their cell membrane. The present study demonstrated the binding of
the soluble complement regulators, FH and FHL-1, to the surface of
ovarian cancer cells. Binding of FH to cell surfaces is a composite
and complicated occurrence (24).
FH protein is composed of 20 short consensus repeat (SCR) domains.
Two functional regions are located at the N- and C-terminal of the
FH. SCRs 1-4 N-terminal domains mediate the complementary
regulatory activities of FH, and the C-terminal domains SCRs 19–20
are responsible for target recognition. The SCRs 19–20 allow the
attachment of FH to cancer cells, and also inhibit the complement
activation directly at the cell surface (25). Binding of FH to cell surfaces is
relevant for the protection of cancer cell membranes and surfaces
from unwanted complement activation (24). Based on the results form the
present study, it was determined that IL-6 and IL-8 enhance the
binding of FH to the membranes of cancer cells. It is likely that
this process may be important with regards to the enhancement of
the efficacy of complement-mediated immunotherapy.
Acknowledgments
The present study was funded by the National Science
Centre (no. DEC-2011/01/D/NZ7/04688).
References
|
1
|
Ferlay J, Steliarova-Foucher E,
Lortet-Tieulent J, Rosso S, Coebergh JW, Comber H, Forman D and
Bray F: Cancer incidence and mortality patterns in Europe:
Estimates for 40 countries in 2012. Eur J Cancer. 49:1374–1403.
2013. View Article : Google Scholar : PubMed/NCBI
|
|
2
|
Wcislo G and Szczylik C: Foreword. Ovarian
cancer-pathobiology, diagnosis and overview of contemporary methods
of treatment. Termedia; Poznan: pp. 9–10. 2010
|
|
3
|
Urban A and Miszczyk L: Ovarian
cancer-diagnostical and therapeutical dilema in oncological
gynecology. Wspolczesna Onkol. 7:294–300. 2003.In Polish.
|
|
4
|
Gancz D and Fishelson Z: Cancer resistance
to complement-dependent cytotoxicity (CDC): Problem-oriented
research and development. Mol Immunol. 46:2794–2800. 2009.
View Article : Google Scholar : PubMed/NCBI
|
|
5
|
Sarma JV and Ward PA: The complement
system. Cell Tissue Res. 343:227–235. 2011. View Article : Google Scholar :
|
|
6
|
Fishelson Z, Donin N, Zell S, Schultz S
and Kirschfink M: Obstacles to cancer immunotherapy: Expression of
membrane complement regulatory proteins (mCRPs) in tumors. Mol
Immunol. 40:109–123. 2003. View Article : Google Scholar : PubMed/NCBI
|
|
7
|
Liu B, Nash J, Runowicz C, Swede H,
Stevens R and Li Z: Ovarian cancer immunotherapy: Opportunities,
progresses and challenges. J Hemato Oncol. 3(7)2010. View Article : Google Scholar
|
|
8
|
Junnikkala S, Hakulinen J, Jarva H,
Manuelian T, Bjørge L, Bützow R, Zipfel PF and Meri S: Secretion of
soluble complement inhibitors factor H and factor H-like protein 1
(FHL-1) by ovarian tumor cells. Br J Cancer. 87:1119–1127. 2002.
View Article : Google Scholar : PubMed/NCBI
|
|
9
|
Rodriguez de Cordoba S, Esparza-Gordillo
J, Goicoechea de Jorge E, Lopez-Trascasa M and Sánchez-Corral P:
The human complement factor H: Functional roles, genetic variations
and disease associations. Mol Immunol. 41:355–367. 2004. View Article : Google Scholar : PubMed/NCBI
|
|
10
|
Kryczek I, Gryboś M and Lange A:
Biological and clinical impact of IL-6 production by ovarian
carcinoma cells. Wspolczesna Onkol. 3:195–198. 1999.In Polish.
|
|
11
|
Nowak M, Głowacka E, Szpakowski M, Szyllo
K, Malinowski A, Kulig A, Tchórzewski H and Wilczyński J:
Proinflamatory and immunosupresive serum, ascites and cyst fluid
cytokines in patients with early and advenced ovarian cancer and
benign ovarian tumors. Neuro Endocrinol Lett. 31:375–383. 2010.
|
|
12
|
Chou CH, Wei LH, Kuo ML, Huang YJ, Lai KP,
Chen CA and Hsieh CY: Up-regulation of interleukin-6 in human
ovarian cancer cell via a Gi/PI3K-Akt/NF-kappaB pathway by
lysophosphatidic acid, an ovarian cancer-activating factor.
Cancerogenesis. 26:45–52. 2005. View Article : Google Scholar
|
|
13
|
Dijkgraaf EM, Welters MJ, Nortier JW, van
der Burg SH and Kroep JR: Interleukin-6/interleukin-6 receptor
pathway as a new therapy target in epithelial ovarian cancer. Curr
Pharm Des. 18:3816–3827. 2012. View Article : Google Scholar : PubMed/NCBI
|
|
14
|
Dobrzycka B, Mackowiak-Matejczyk B,
Terlikowska KM, Kulesza-Bronczyk B, Kinalski M and Terlikowski SJ:
Serum levels of IL-6, IL-8 and CRP as prognostic factors in
epithelial ovarian cancer. Eur Cytokine Netw. 24:106–113.
2013.PubMed/NCBI
|
|
15
|
Wang Y, Niu XL, Qu Y, Wu J, Zhu YQ, Sun WJ
and Li LZ: Autocrine production of interleukin-6 confers cisplatin
and paclitaxel resistance in ovarian cancer cells. Cancer Lett.
295:110–123. 2010. View Article : Google Scholar : PubMed/NCBI
|
|
16
|
Spiller OB, Criado-García O, Rodríguez De
Córdoba S and Morgan BP: Cytokine-mediated up-regulation of CD55
and CD59 protects human hepatoma cells from cells from complement
attack. Clin Exp Immunol. 121:234–241. 2000. View Article : Google Scholar : PubMed/NCBI
|
|
17
|
Livak KJ and Schmittgen TD: Analysis of
relative gene expression data using real-time quantitative PCR and
2(−Delta Delta C(T)) method. Methods. 25:402–408. 2001. View Article : Google Scholar
|
|
18
|
Ajona D, Castaño Z, Garayoa M, Zudaire E,
Pajares MJ, Martinez A, Cuttitta F, Montuenga LM and Pio R:
Expression of complement factor H by lung cancer cells: Effects on
the activation of the alternative pathway of complement. Cancer
Res. 64:6310–6318. 2004. View Article : Google Scholar : PubMed/NCBI
|
|
19
|
Bjørge L, Hakulinen J, Vintermy OK, Jarva
H, Jensen TS, Iversen OE and Meri S: Ascitic complement system in
ovarian cancer. Br J Cancer. 92:895–905. 2005. View Article : Google Scholar : PubMed/NCBI
|
|
20
|
Wang Y, Yang J, Gao Y, Du Y, Bao L, Niu W
and Yao Z: Regulatory effect of E2, IL-6 and IL-8 on the Growth of
epithelial ovarian cancer cells. Cell Mol Immunol. 2:365–372.
2005.PubMed/NCBI
|
|
21
|
Józsi M and Zipfel PF: Factor H family
proteins and human diseases. Trends Immunol. 29:380–387. 2008.
View Article : Google Scholar : PubMed/NCBI
|
|
22
|
Kapka-Skrzypczak L, Wolinska E, Szparecki
G, Wilczynski GM, Czajka M and Skrzypczak M: CD55, CD59, factor H
and factor H-like 1 gene expression analysis in tumors of the ovary
and corpus uteri origin. Immunol Lett. 167:67–71. 2015. View Article : Google Scholar : PubMed/NCBI
|
|
23
|
Thibault B, Castells M, Delord JP and
Couderc B: Ovarian cancer microenvironment: Implications for cancer
dissemination and chemoresistance acquisition. Cancer Metastasis
Rev. 33:17–39. 2014. View Article : Google Scholar
|
|
24
|
Józsi M, Manuelian T, Heinen S, Oppermann
M and Zipfel PF: Attachment of the soluble complement regulator
factor H to cell and tissue surfaces: Relevance for pathology.
Histol Histopathol. 19:251–258. 2004.PubMed/NCBI
|
|
25
|
Kopp A, Hebecker M, Svobodová E, Józsi M
and Factor H: A complement regulator in health and disease, and a
mediator of cellular interactions. Biomolecules. 2:46–75. 2012.
View Article : Google Scholar : PubMed/NCBI
|