Introduction
Type 2 diabetes (T2D) is a complex, multifactorial
disorder characterized by chronic hyperglycemia due to the
interplay of multiple genetic variants and several environmental
factors. As a result of aging populations, and the increasing
prevalence of obesity and physical inactivity, the number of
patients with T2D has markedly increased worldwide (1). The disease is considered a polygenic
disorder, in which each genetic variant confers a partial and
additive effect. Only 5–10% of T2D cases are due to single gene
defects; these include maturity-onset diabetes of the young,
insulin resistance syndromes, mitochondrial diabetes and neonatal
diabetes (2). Examining T2D
susceptibility genes may be useful for the prediction, prevention
and early treatment of the disease.
Following previous genome-wide association studies
(GWAS), the number of replicated common genetic variants associated
with T2D has rapidly increased (3–9). In
addition, >40 T2D-associated genetic loci have been identified,
however, these loci have been revealed primarily on the basis of
investigations of European individuals (10). The identified genomes only explain
a small proportion of the estimated heritability of T2D, suggesting
that additional genetic factors remain to be identified. One
limitation of GWAS is the large number of hypotheses and the high
economic cost of these investigations (11). Several studies have addressed the
feasibility and effectiveness of pooling-based GWAS, with
considerable savings in time and cost (11–13).
Additionally, whole-genome sequencing across multiple samples in a
population provides an unprecedented opportunity for
comprehensively characterizing the polymorphic variants in the
population (14).
Although the genetic contribution to T2D is well
recognized, there are now at least 19 loci containing genes, which
are known to increase the risk of T2D, including PPARG, KCNJ11,
KCNQ1, CDKAL1, CDKN2A-2B, CDC123-CAMK1D, MTNR1B, TCF7L2, TCF2
(HNF1B), HHEX-KIF11-IDE, JAZF1, IGF2BP2, SLC30A8, THADA, ADAMTS9,
WFS1, FTO, NOTCH2 and TSPAN8 (2).
To date, the current set of 66 established susceptibility loci,
identified primarily through large-scale GWAS (2,8,15–22),
encompasses, at most, 10% of the familial aggregation of the
disease. Of the currently established susceptibility loci, nine of
the loci are contained in the 19 loci-containing genes. In the
present study, the genomes of 100 Chinese patients with T2D and 100
non-diabetic Chinese individuals were examined using high
throughput genome-wide re-sequencing and DNA pooling with Illumina
HiSeq 2000 (Illumina, San Diego, CA, USA). The aim of the present
study was to determine the rates of susceptibility genes in T2D in
the Chinese population.
Materials and methods
Study populations
The present study was performed between August 2012
and the end of June 2013 at the 181st Hospital of People's
Liberation Army, (Guilin, China). A total of 200 Chinese
individuals were recruited, of which half were diagnosed with T2D.
All participants with T2D were unrelated, and their disease was
defined by World Health Organization criteria (23). The healthy individuals had a
fasting plasma glucose <5.6 mmol/l, a 2-h oral glucose tolerance
test-based plasma glucose <7.8 mmol/l, a body mass index
<27.5 kg/m2 and blood pressure <140/90 mmHg, with
no antihypertensive treatment. The clinical and biochemical
characteristics of the 200 individuals are presented in Table I.
 | Table IClinical and biochemical
characteristics of the 200 individuals recruited for
re-sequencing. |
Table I
Clinical and biochemical
characteristics of the 200 individuals recruited for
re-sequencing.
| Characteristic | ND (n=100) | T2D (n=100) |
|---|
| Gender
(males/females) | 63/37 | 55/45 |
| Age (years) | 60.1±11.8 | 5.4±0.6 |
| HbA1c (%) | 5.4±0.6 | 9.6±2.3 |
| Fasting plasma
glucose (mmol/l) | 4.9±0.6 | 11.4±3.9 |
| 2-h OGTT-based
plasma glucose (mmol/l) | 6.0±0.4 | 13.5±2.1 |
| Body mass index
(kg/m2) | 24.0±1.5 | 31.7±5.0 |
| Waist circumference
(cm) | 82.3±6.7 | 105.0±9.8 |
| Systolic blood
pressure (mmHg) | 125.0±7.0 | 152.0±9.0 |
| Diastolic blood
pressure (mmHg) | 84.0±5.0 | 92.0±6.0 |
Ethics
The present study was approved by the Medical and
Health Research Ethics Committee of the 181st Hospital of the
People's Liberation Army (Guilin, China). All participants provided
informed consent for the use of their biological samples for
genetic investigation.
Experimental procedure
Peripheral blood samples from the 200 volunteers
were collected for genomic DNA extraction. DNA preparation followed
the manufacturer's protocol (Illumina). Genomic DNA was extracted
and then randomly fragmented. Following electrophoresis, DNA
fragments of desired length (90 bp) were gel purified using
QIAquick PCR Purification kit (Qiagen GmbH, Hilden, Germany).
Adapter ligation and DNA cluster preparation were performed as part
of Solexa sequencing by Beijing Genomics Institute (Shenzhen,
China) (24–26).
Bioinformatics analysis
The bioinformatics analysis used the sequencing data
(raw data) generated from the Illumina HiSeq 2000. First, the
adapter sequence in the raw data was removed, and low quality
reads, which contained too many unknown bases (N) or low quality
bases were discarded. This step produced 'clean data'. Secondly,
Burrows-Wheeler Aligner (BWA) (27) was used to align the reads to the
reference sequence. The alignment information was stored in BAM
format files, which were further processed during subsequent steps,
including fixing mate-pair information, adding read group
information and marking duplicate reads caused by polymerase chain
reaction (PCR). Following these processes, the final BAM files were
ready for variant calling. Single nucleotide polymorphisms (SNPs)
were detected using SOAPsnp (28),
small insertion/deletions (InDels) were detected using SAMtools
(29)/GATK (30,31),
copy number variants (CNVs) were detected using CNVnator (32,33),
single nucleotide variants (SNVs) were detected using Varscan
(34) and somatic InDels were
detected using GATK. Structure variants (SVs) and somatic CNVs were
identified using BreakDancer (35)/CREST/SeekSV (self-method) and a
self-method based on the SegSeq (36) algorithm, respectively. Virus
integration sites were identified using a self-method based on
unmapped reads. The procedure also included purity estimation.
Subsequently, filters were applied to obtain variant results of
higher confidence and, based on which subsequent advanced analysis
could be performed, ANNOVAR (37)
was used to annotate the variant results. Quality control was
required at each stage of analysis to ensure clean data, alignment
and variants. SIFT (38) was used
to assess the likely phenotypic effect of identified missense
mutations. PolyPhen-2 (39)
analysis was performed to calculate the probability of an
identified mutation as deleterious for disease pathogenesis.
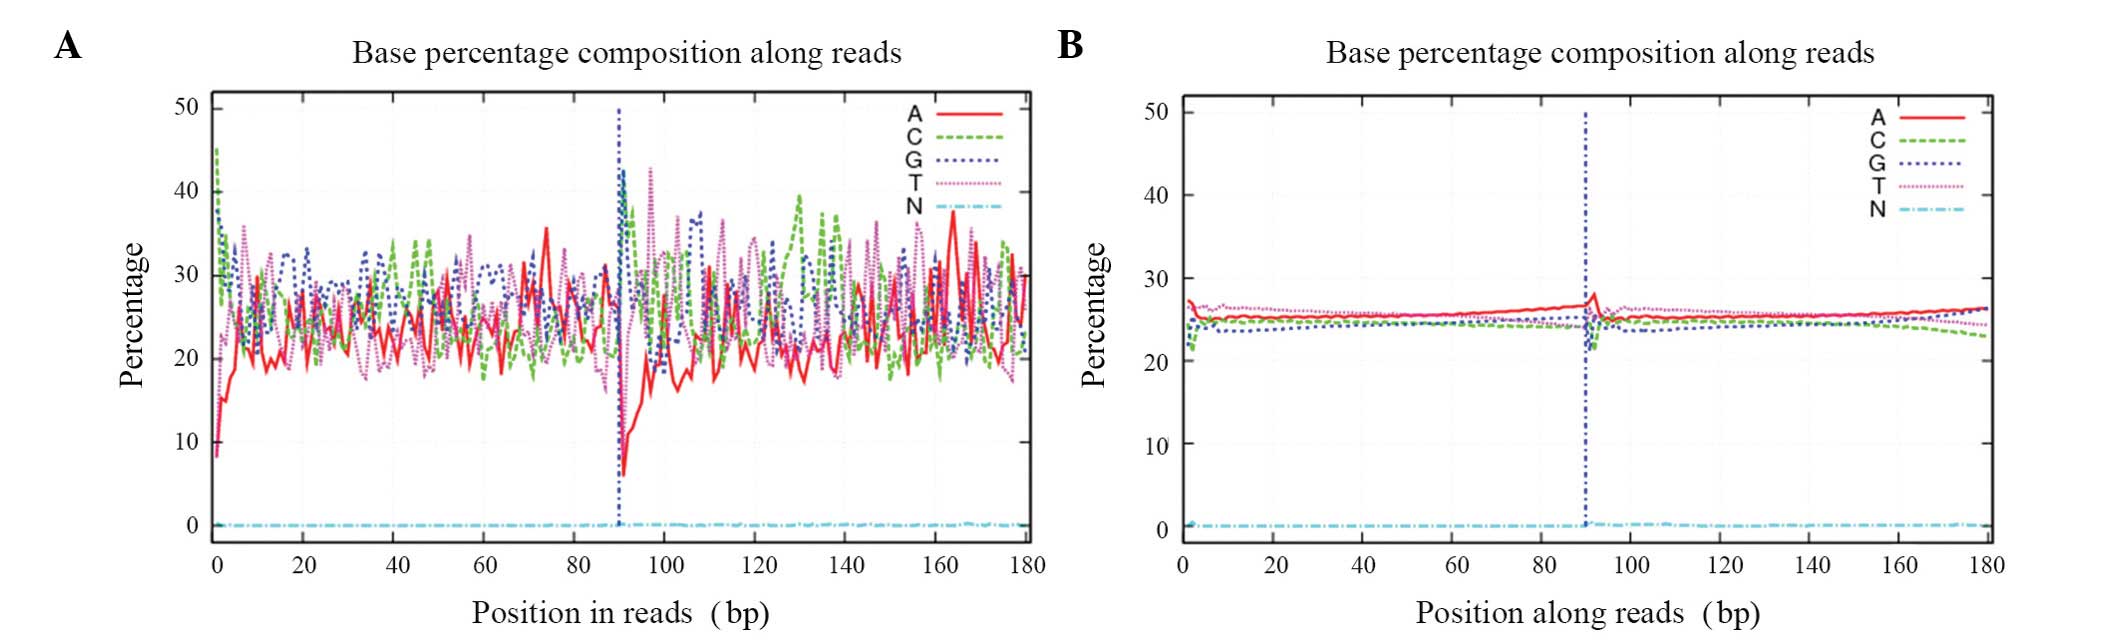
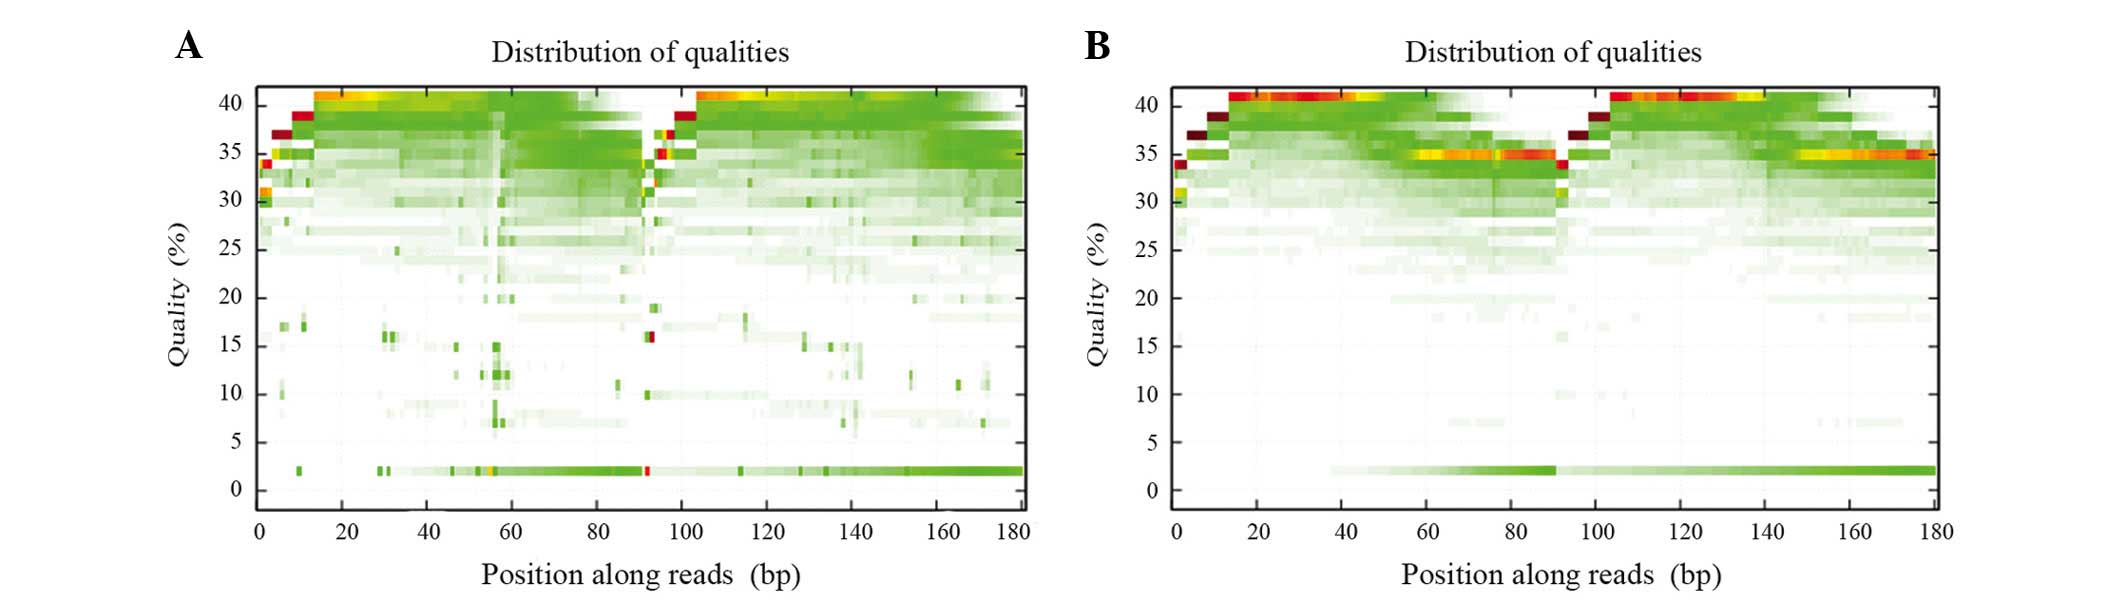
Sequencing quality control
The raw reads, which contained the adapter sequence,
a high content of unknown bases and low quality reads were removed
prior to data analysis. The filtering steps were as follows: i)
Removal of adapter reads. An adapter read was defined as a read
that included the adapter bases, which were removed from the raw
FASTQ data; ii) removal of low-quality reads. If more than half of
the bases in a read were low-quality, defined as a base quality ≤5,
the read was treated as a low-quality read and removed from the raw
FASTQ data; iii) removal of reads in which unknown bases were
>10%. The 'clean reads' were then used for downstream
bioinformatics analysis. Finally statistical analysis was performed
for data interpretation. The quality of the clean data is shown in
Figs. 1 and 2.
Alignment quality control
The human genome build37 (hg19) was used as the
reference genome in the present study. The whole-genome size of
hg19 is 3,137,161,264 bp, whereas the effective size is
2,861,327,131 bp, following exclusion of the N bases, random
regions, hap regions, and chromosome Un and chromosome M in the
reference sequence. BWA was used to align the reference genome
sequence for sequencing reads. Picard (broadinstitute.github.io/picard) was used to mark
duplicated reads, which were redundant information produced by
PCR.
Results
Quality control of sequencing data
To minimize the likelihood of systematic bias during
sampling, two paired-end libraries with insert sizes of 500 bp were
prepared for all samples and were subjected to whole-genome
sequencing. Each library comprised four lanes, resulting in at
least 30-fold haploid coverage for each sample. The raw image files
were processed using the Illumina pipeline for base calling;
default parameters and the sequences of each individual were
generated as 90-bp-paired-end reads. A total of 144.3 GB raw
sequence data were generated in a sequencing depth of ~30-fold. As
shown in Table II, comparison was
performed between the raw and clean data, which were detected using
whole-genome re-sequencing.
| Table IIQuality control of sequencing
data. |
Table II
Quality control of sequencing
data.
| Category | Data
| Discarded reads
(n) |
|---|
| Raw | | Clean |
|---|
| Reads (n) | 1,442,754,024 | | 1,367,776,414 | |
| Data size (bp) |
129,847,862,160 | |
123,099,877,260 | |
| N of fq1 (n) | 41,142,158 | | 1,257,883 | |
| N of fq2 (n) | 130,903,222 | | 3,072,470 | |
| GC of fq1 (%) | 39.62–39.82 | | 39.47–39.7 | |
| GC of fq2 (%) | 39.69–39.97 | | 39.56–39.78 | |
| Q20 of fq1 (%) | 96.16–97.06 | | 97.12–97.76 | |
| Q20 of fq2 (%) | 90.02–93.33 | | 93.88–95.97 | |
| Q30 of fq1 (%) | 90.13–92.30 | | 91.28–93.20 | |
| Q30 of fq2 (%) | 82.31–87.61 | | 86.04–90.21 | |
| Discarded reads
associated with N | | | | 4,639,892 |
| Discarded reads due
to low quality bases | | | | 69,293,920 |
| Discarded reads
associated with the adapter | | | | 1,043,798 |
| Clean data/raw data
(%) | | 94.80 | | |
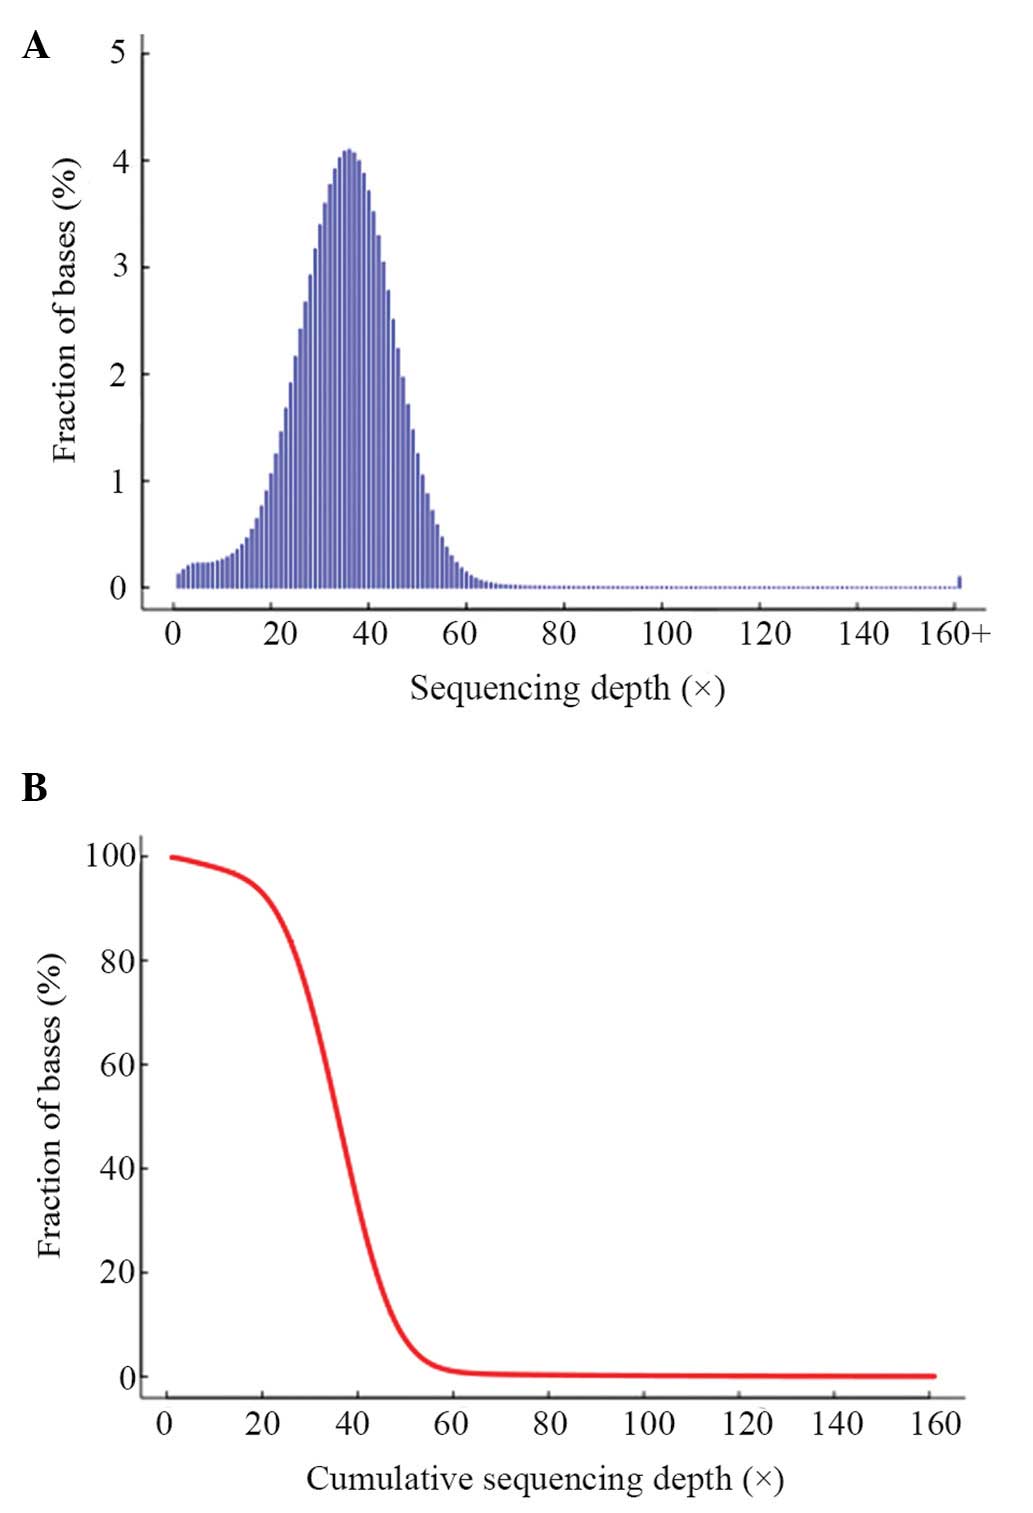
Alignment of quality control data
The resulting calculated T2D genome consensus
sequence covered 99.88% of the hg19 sequence. At a depth of
10-fold, the assembled consensus covered 97.98% of the reference
genome using two paired-end reads. Thus, increased sequencing depth
provided only a marginal increase in genome coverage. The alignment
quality control results are shown in Table III. The distribution of per-base
sequencing depth and cumulative depth distribution in the target
regions are presented in Fig. 3.
The data approximately followed a Poisson distribution, which
showed that the exome-capturing target region was evenly
sampled.
| Table IIIAlignment of quality control
data. |
Table III
Alignment of quality control
data.
| Whole-genome
statistic | Value |
|---|
| Clean reads
(n) | 1,367,776,414 |
| Clean bases
(bp) |
123,099,877,260 |
| Mapped reads | 1,325,654,972 |
| Mapped bases
(bp) |
117,572,810,280 |
| Mapping rate
(%) | 96.92 |
| Unique reads
(n) | 1,271,136,561 |
| Unique bases
(bp) |
112,742,935,221 |
| Unique rate
(%) | 95.89 |
| Duplicate reads
(n) | 157,244,383 |
| Duplicate rate
(%) | 11.86 |
| Mismatch bases
(bp) | 481,007,764 |
| Mismatch rate
(%) | 0.41 |
| Average sequencing
depth | 35.70 |
| Coverage (%) | 99.88 |
| Coverage of at
least 4X (%) | 99.38 |
| Coverage of at
least 10X (%) | 97.98 |
| Coverage of at
least 20X (%) | 93.02 |
SNP analysis
The genotype with the highest probability at a given
locus was identified for each individual sequencing sample, and the
consensus sequence of the sample was assembled and saved in CNS
format. Using the consensus sequence, the polymorphic loci between
the identified genotype and the reference were filtered and
highlighted; this constitutes the high confident SNP dataset.
Following the identification of the SNPs, ANNOVAR was used to
perform annotation and classification.
The results revealed that 99.88% of the T2D SNPs
were present in dbSNP, and there were 3,010 novel SNPs (Table IV). A total of 485 SNPs were
screened, for which the SIFT score was <0.05, and the PolyPhen
score was >0.85. These features suggested the pathological
nature of the identified genetic variation. Of these 485 SNPs, 480
SNPs were found at exonic regions. The remaining SNPs were at
exonic and splicing regions. All the SNPs were nonsynonymous genes.
Compared with the 76 loci-containing genes causing an increased
risk of T2D, 77 SNP loci were identified in 37 genes (Table V).
| Table IVSingle nucleotide polymorphism
data. |
Table IV
Single nucleotide polymorphism
data.
| Category | Value |
|---|
| Total (n) | 3,974,307 |
| 1000 genome and
dbSNP135 (n) | 3,911,119 |
| 1000
genome-specific (n) | 1,712 |
| dbSNP135-specific
(n) | 58,466 |
| dbSNP rate (%) | 99.88 |
| Novel (n) | 3,010 |
| Homozygous (n) | 475,874 |
| Heterozygous
(n) | 3,498,433 |
| Synonymous (n) | 11,723 |
| Missense (n) | 9,897 |
| Stopgain (n) | 76 |
| Stoploss (n) | 31 |
| Exonic (n) | 21,422 |
| Exonic and splicing
(n) | 305 |
| Splicing (n) | 155 |
| ncRNA (n) | 97,213 |
| UTR5 (n) | 4,043 |
| UTR5 and UTR3
(n) | 14 |
| UTR3 (n) | 25,860 |
| Intronic (n) | 1,382,366 |
| Upstream (n) | 18,977 |
| Upstream and
downstream (n) | 582 |
| Downstream (n) | 22,165 |
| Intergenic (n) | 2,401,205 |
| Sorting intolerant
from tolerant (n) | 1,201 |
| Ti/Tv (n) | 2.1030 |
| dbSNP Ti/Tv
(n) | 2.1043 |
| Novel Ti/Tv
(n) | 1.1923 |
| Table VList of 77 single nucleotide
polymorphism loci in 37 genes identified in the present study. |
Table V
List of 77 single nucleotide
polymorphism loci in 37 genes identified in the present study.
| Gene | Function | Exonic
function | dbSNP135 | SIFT | PolyPhen2 | Chr | Ref | Obs | Het/hom |
|---|
| ANK1 | Exonic | Synonymous SNV | rs2304880 | | | 8 | G | A | Het |
| Exonic | Synonymous SNV | rs2304873 | | | | C | T | Het |
| Exonic | Synonymous SNV | rs2304871 | | | | G | A | Het |
| ANKRD55 | Exonic | Synonymous SNV | rs321775 | | | 5 | T | C | Het |
| Exonic | Nonsynonymous
SNV | rs321776 | 1 | 0 | | C | T | Het |
| BCAR1 | Exonic | Synonymous SNV | rs3169330 | | | 16 | A | G | Hom |
| exonic | Synonymous SNV | rs3743613 | | | | C | T | Het |
| GRB14 | Exonic | Nonsynonymous
SNV | rs61748245 | 0.27 | 0.009 | 2 | A | T | Het |
| CAMK1D | Exonic | Synonymous SNV | rs1757051 | | | 10 | C | G | Het |
| TSPAN8 | Exonic | Nonsynonymous
SNV | rs1051334 | 1 | 0 | 12 | A | C | Het |
| Exonic | Synonymous SNV | rs2270587 | | | | G | A | Het |
| Exonic | Nonsynonymous
SNV | rs3763978 | 0.08 | 0.981 | | C | G | Het |
| Exonic | Nonsynonymous
SNV | rs79443892 | 0.73 | 0 | | C | T | Het |
| THADA | Exonic | Nonsynonymous
SNV | rs17031056 | 0.34 | | 2 | C | T | Het |
| Exonic | Synonymous SNV | rs11899823 | | | | A | G | Het |
| Exonic | Synonymous SNV | rs13021894 | | | | T | C | Het |
| ADAMTS9 | Exonic | Nonsynonymous
SNV | rs17070905 | | 0.057 | 3 | C | T | Het |
| Exonic | Nonsynonymous
SNV | rs6787633 | | 0 | | G | C | Het |
| BCL11A | Exonic | Synonymous SNV | rs7569946 | | | 2 | A | G | Hom |
| KCNQ1 | Exonic | Synonymous SNV | rs1057128 | | | 11 | G | A | Het |
| HNF1A | Exonic | Synonymous SNV | rs1169289 | | | 12 | C | G | Het |
| Exonic | Nonsynonymous
SNV | rs1169288 | 0.09 | 0.052 | | A | C | Het |
| Exonic | Synonymous SNV | rs2259820 | | | | C | T | Het |
| Exonic | Nonsynonymous
SNV | rs2464196 | 0.06 | 0.053 | | G | A | Het |
| Exonic | Nonsynonymous
SNV | rs1169305 | 0.4 | 0.423999 | | A | G | Hom |
| PRC1 | Exonic | Nonsynonymous
SNV | rs7172758 | 1 | 0 | 15 | G | T | Hom |
| Exonic | Synonymous SNV | rs2301826 | | | | C | T | Het |
| MADD | Exonic | Synonymous SNV | rs326214 | | | 11 | G | A | Het |
| Exonic | Synonymous SNV | rs326217 | | | | T | C | Het |
| Exonic | Nonsynonymous
SNV | rs1051006 | 0.19 | 0 | | G | A | Het |
| Exonic | Synonymous SNV | rs1017594 | | | | T | C | Hom |
| ADRA2A | Exonic | Synonymous SNV | rs1800038 | | | 10 | C | A | Het |
| GLIS3 | Exonic | Nonsynonymous
SNV | rs806052 | 0.38 | 0 | 9 | A | G | Hom |
| SLC2A2 | Exonic | Synonymous SNV | rs5398 | | | 3 | G | A | Het |
| C2CD4B | Exonic | Nonsynonymous
SNV | rs8040712 | 0.34 | 0 | 15 | A | C | Het |
| PTPRD | Exonic | Synonymous SNV | rs2279776 | | | 9 | C | G | Het |
| Exonic | Synonymous SNV | rs2281747 | | | | A | G | Het |
| Exonic | Nonsynonymous
SNV | rs35929428 | 0.09 | 0.016 | | G | A | Het |
| Exonic | Synonymous SNV | rs7026388 | | | | T | C | Het |
| Exonic | Synonymous SNV | rs3763653 | | | | G | A | Het |
| C2CD4B | Exonic | Nonsynonymous
SNV | rs8040712 | 0.34 | 0 | 15 | A | C | Het |
| GRB14 | Exonic | Nonsynonymous
SNV | rs61748245 | 0.27 | 0.009 | 2 | A | T | Het |
| GLIS3 | Exonic | Nonsynonymous
SNV | rs806052 | 0.38 | 0 | 9 | A | G | Hom |
| PEPD | Exonic | Synonymous SNV | rs17569 | | | 19 | G | A | Het |
| FITM2 | Exonic | Synonymous SNV | rs6073401 | | | 20 | T | C | Hom |
| KCNK16 | Exonic | Nonsynonymous
SNV | rs11756091 | 0.03 | 0 | 6 | G | T | Het |
| Exonic | Synonymous SNV | rs11753141 | | | | G | A | Het |
| Exonic | Nonsynonymous
SNV | rs1535500 | 0.12 | | | G | T | Het |
| Exonic | Synonymous SNV | rs3734618 | | | | A | G | Het |
| Exonic | Synonymous SNV | rs3734619 | | | | C | T | Het |
| MAEA | Exonic | Synonymous SNV | rs1128427 | 0.13 | | 4 | T | C | Het |
| PAX4 | Exonic | Nonsynonymous
SNV | rs712701 | 1 | 0 | 7 | T | G | Het |
| GCC1 | Exonic | Synonymous SNV | rs3735644 | | | 7 | G | A | Het |
| Exonic | Synonymous SNV | rs3735642 | | | | A | G | Het |
| KCNJ11 | Exonic | Nonsynonymous
SNV | rs5215 | 0.31 | 0.002 | 11 | C | T | Het |
| Exonic | Synonymous SNV | rs5218 | | | | G | A | Het |
| Exonic | Nonsynonymous
SNV | rs5219 | 0.36 | 0 | | T | C | Het |
| KCNQ1 | Exonic | Synonymous SNV | rs1057128 | | | 11 | G | A | Het |
| CDKAL1 | Exonic | Synonymous SNV | rs9350269 | | | 6 | C | T | Het |
| Exonic | Synonymous SNV | rs9465994 | | | | G | A | Het |
| HHEX | Exonic | Synonymous SNV | rs113121942 | | | 10 | G | A | Het |
| SLC30A8 | Exonic | Nonsynonymous
SNV | rs13266634 | 0.04 | 0 | 8 | C | T | Het |
| WFS1 | Exonic | Nonsynonymous
SNV | rs1801212 | 1 | 0 | 4 | G | A | Hom |
| Exonic | Synonymous SNV | rs1801206 | | | | C | T | Hom |
| Exonic | Synonymous SNV | rs1801214 | | | | C | T | Hom |
| Exonic | Nonsynonymous
SNV | rs734312 | 0.02 | 0.99 | | G | A | Het |
| Exonic | Synonymous SNV | rs1046314 | | | | G | A | Hom |
| TCF7L2 | Exonic | Nonsynonymous
SNV | rs77961654 | 0.15 | 0.996 | 10 | C | A | Het |
| THADA | Exonic | Nonsynonymous
SNV | rs17031056 | 0.34 | | 2 | C | T | Het |
| Exonic | Synonymous SNV | rs11899823 | | | | A | G | Het |
| Exonic | Synonymous SNV | rs13021894 | | | | T | C | Het |
| ADAMTS9 | Exonic | Nonsynonymous
SNV | rs17070905 | | 0.057 | 3 | C | T | Het |
| Exonic | Nonsynonymous
SNV | rs6787633 | | 0 | | G | C | Het |
| TSPAN8 | Exonic | Nonsynonymous
SNV | rs1051334 | 1 | 0 | 12 | A | C | Het |
| Exonic | Synonymous SNV | rs2270587 | | | | G | A | Het |
| Exonic | Nonsynonymous
SNV | rs3763978 | 0.08 | 0.981 | | C | G | Het |
| Exonic | Nonsynonymous
SNV | rs79443892 | 0.73 | 0 | | C | T | Het |
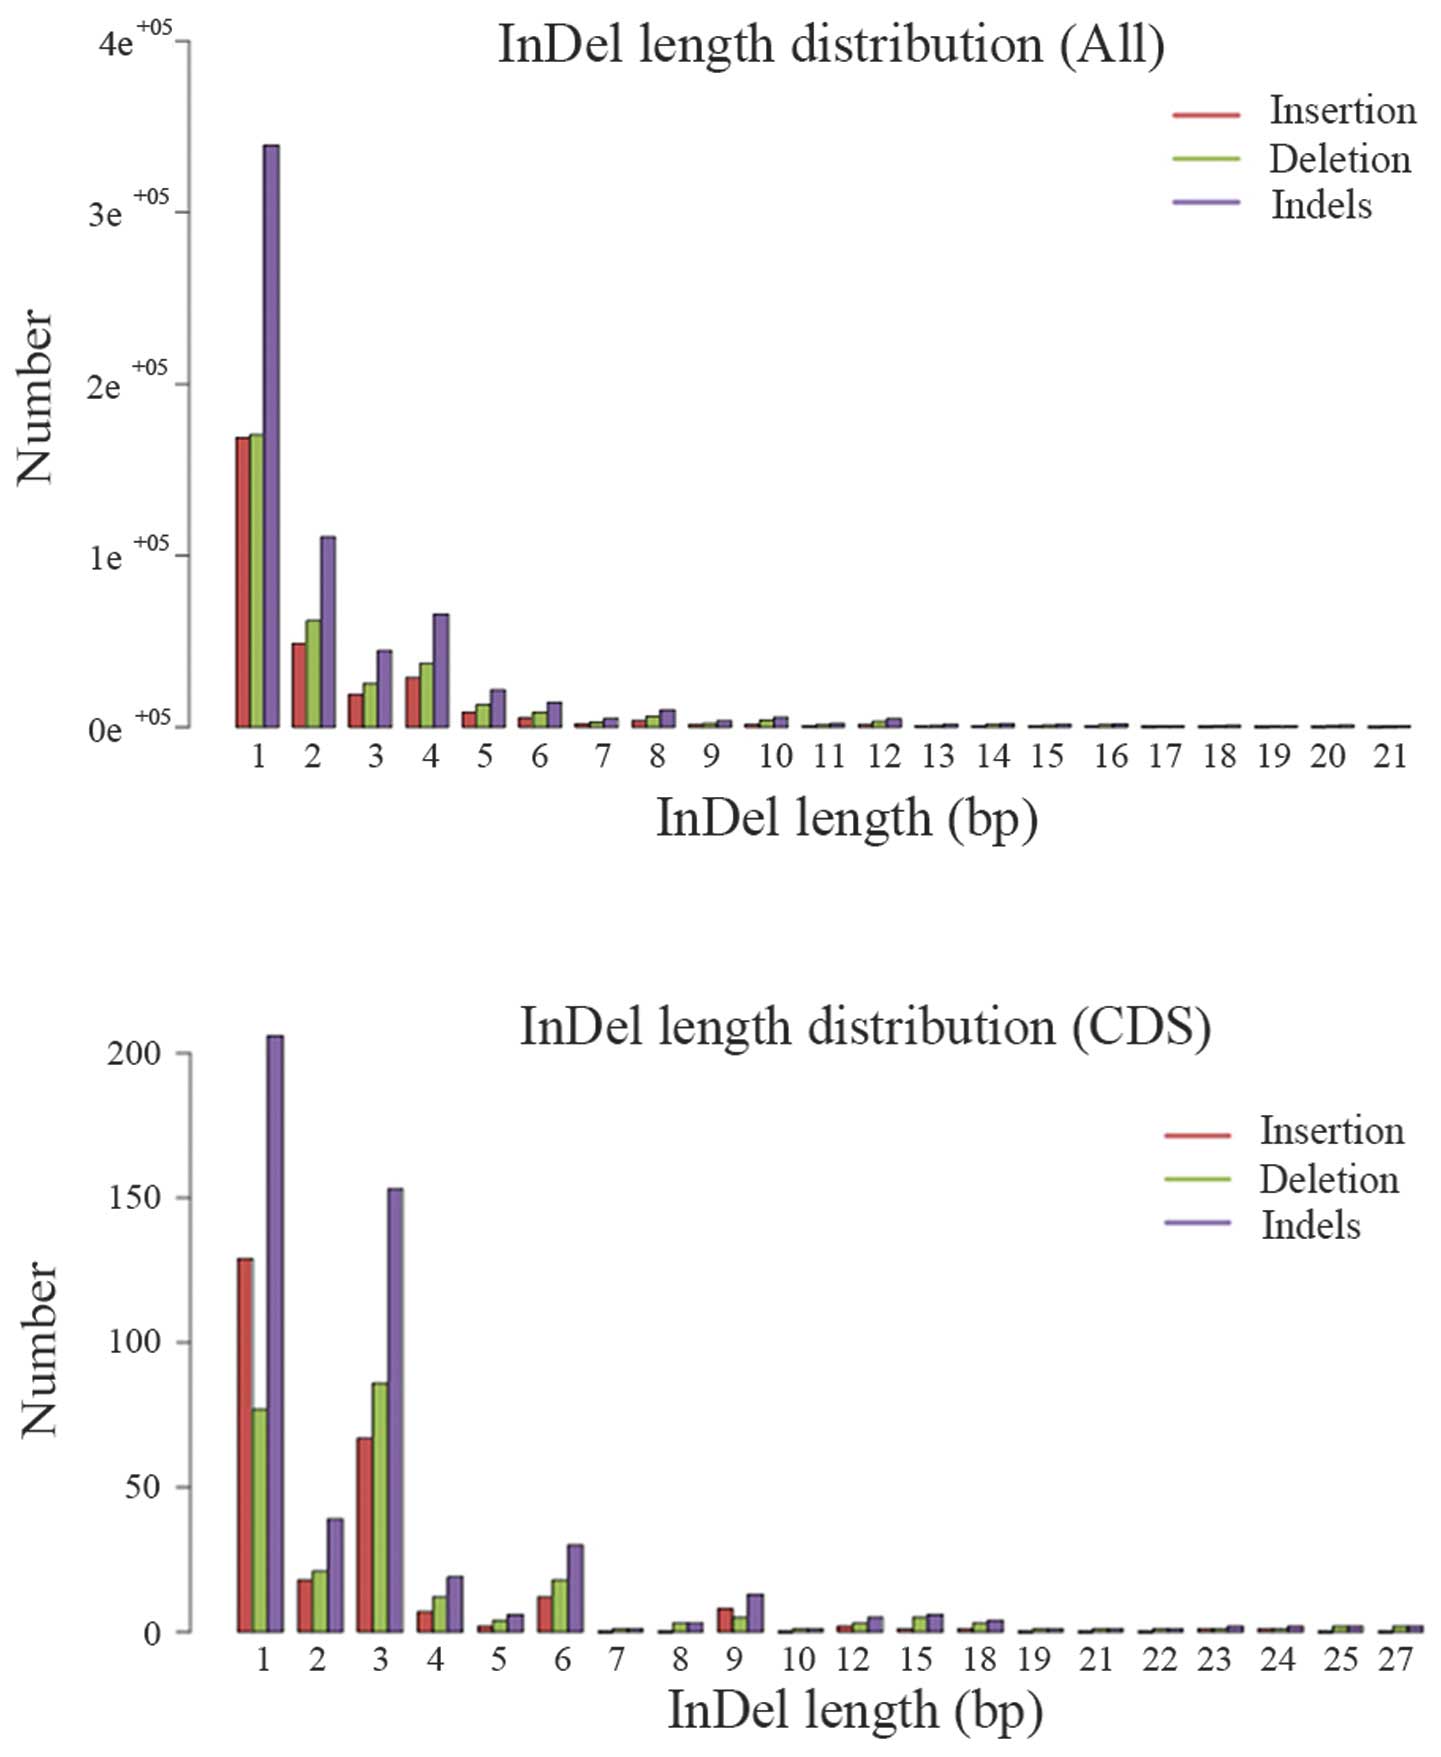
InDel analysis
To detect the InDels, the present study used
pair-end reads for gap alignment using the mpileup program in SAM
tools. Following identification of the InDels, ANNOVAR was used for
annotation and classification. Of the 642,189 identified InDels,
the percentage that overlapped the dbSNP InDels was 68.52%
(Table VI). The length
distribution of the InDels in the whole target region and CDS
region were also plotted (Fig. 4).
The length distribution of InDel in CDS region indicated that peaks
are present at 3, 6 and 9 bp length, the InDels with this
periodicity are non-framenshift InDels, they have relatively small
effect on the genome comparing with frameshift InDels.
| Table VIInsertion/deletion data. |
Table VI
Insertion/deletion data.
| Category | Value |
|---|
| Total | 642,189 |
| 1000 genome and
dbSNP135 | 314,143 |
| 1000 genome
specific | 81,476 |
| dbSNP135
specific | 125,867 |
| dbSNP rate (%) | 68.52 |
| Novel | 120,703 |
| Homozygous | 103,137 |
| Heterozygous | 539,052 |
| Frameshift
insertion | 120 |
| Non-frameshift
insertion | 88 |
| Frameshift
deletion | 99 |
| Non-frameshift
deletion | 110 |
| Frameshift block
substitution | 0 |
| Non-frameshift
block substitution | 0 |
| Stopgain | 2 |
| Stoploss | 1 |
| Exonic | 415 |
| Exonic and
splicing | 5 |
| Splicing | 77 |
| ncRNA | 16,036 |
| UTR5 | 457 |
| UTR5 and UTR3 | 3 |
| UTR3 | 5,172 |
| Intronic | 225,732 |
| Upstream | 3,326 |
| Upstream and
downstream | 102 |
| Downstream | 4,324 |
| Intergenic | 386,540 |
SV, CNV and SNV analyses
When aligning the paired-end reads, if a structure
variation existed between the sequencing and the reference
sequences, the requirements for pair-end alignment, also termed the
PE map, may not be met; thus, these anomalous read pairs and soft
clip reads were used in the present study to detect SVs. The
resulting list of the SVs, that were detected at the whole-genome
level are listed in Table
VII.
| Table VIIStructure variant data. |
Table VII
Structure variant data.
| Category | Value |
|---|
| Total | 5,590 |
| Insertion | 348 |
| Deletion | 5,002 |
| Inversion | 14 |
| ITX | 122 |
| CTX | 104 |
| Exonic | 3 |
| Exonic and
splicing | 3 |
| Splicing | 7 |
| ncRNA | 133 |
| UTR5 | 3 |
| UTR5 and UTR3 | 0 |
| UTR3 | 9 |
| Intronic | 1,875 |
| Upstream | 15 |
| Upstream and
downstream | 0 |
| Downstream | 31 |
| Intergenic | 3,511 |
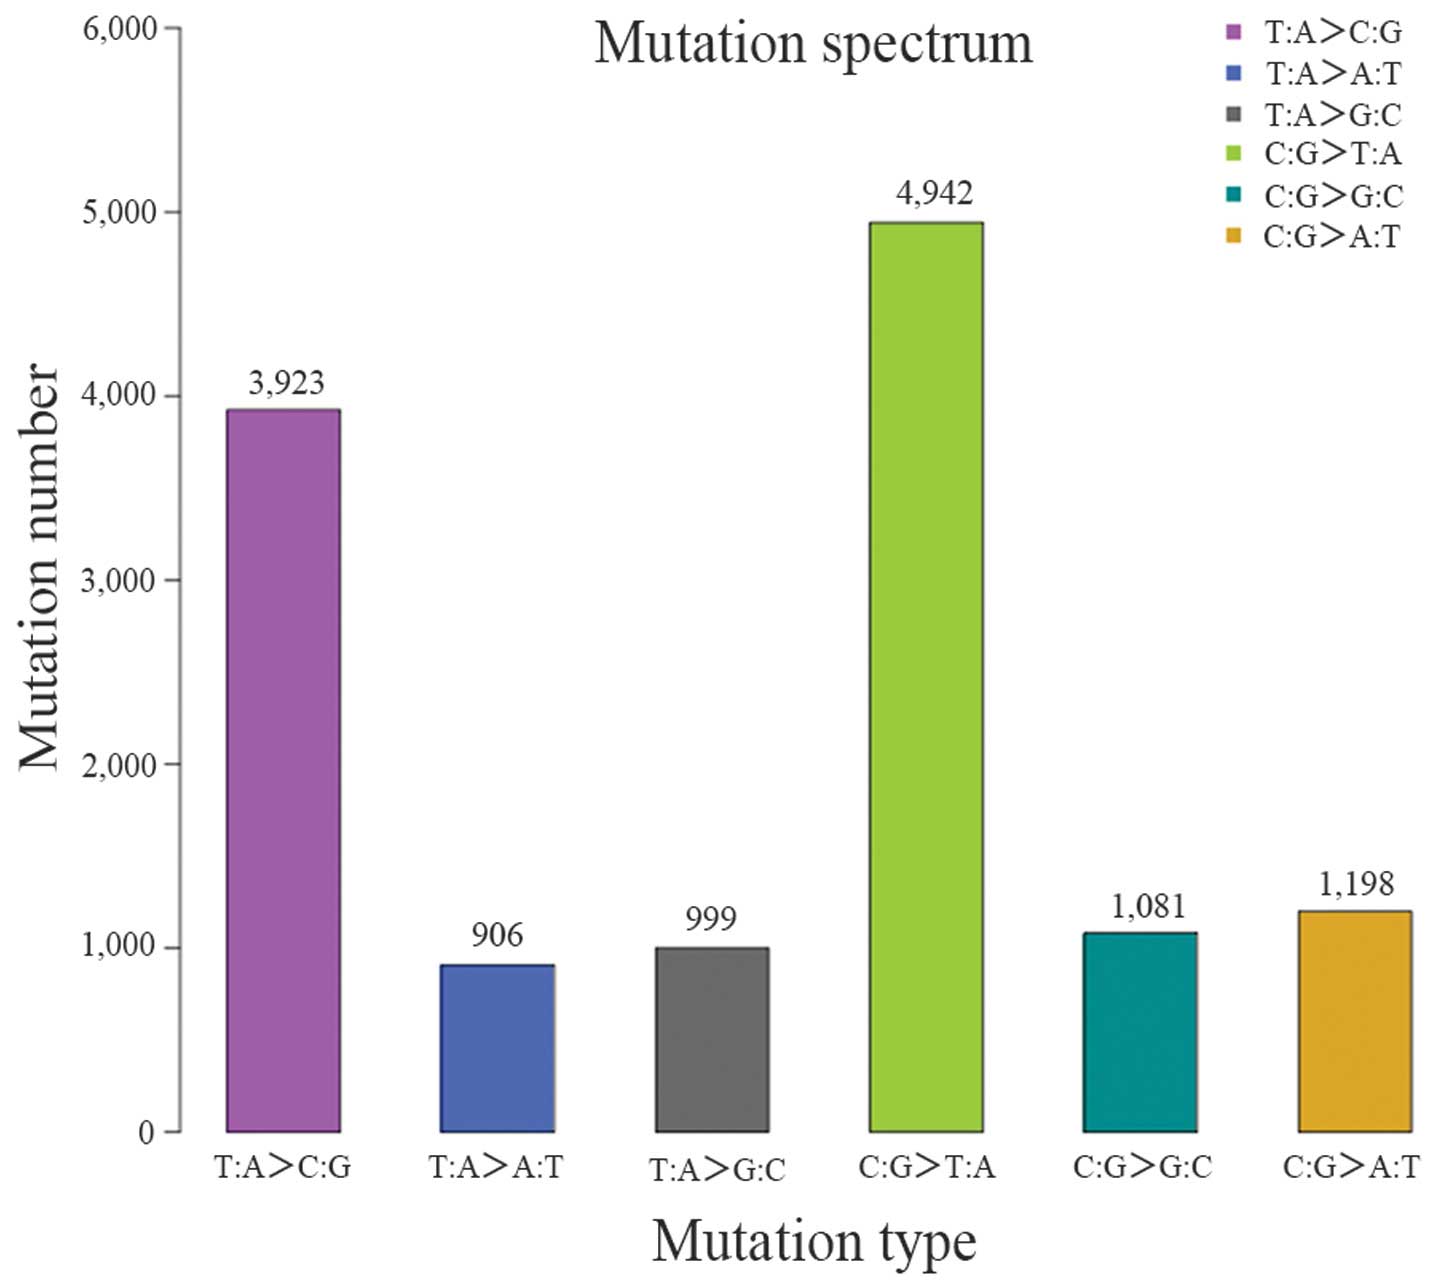
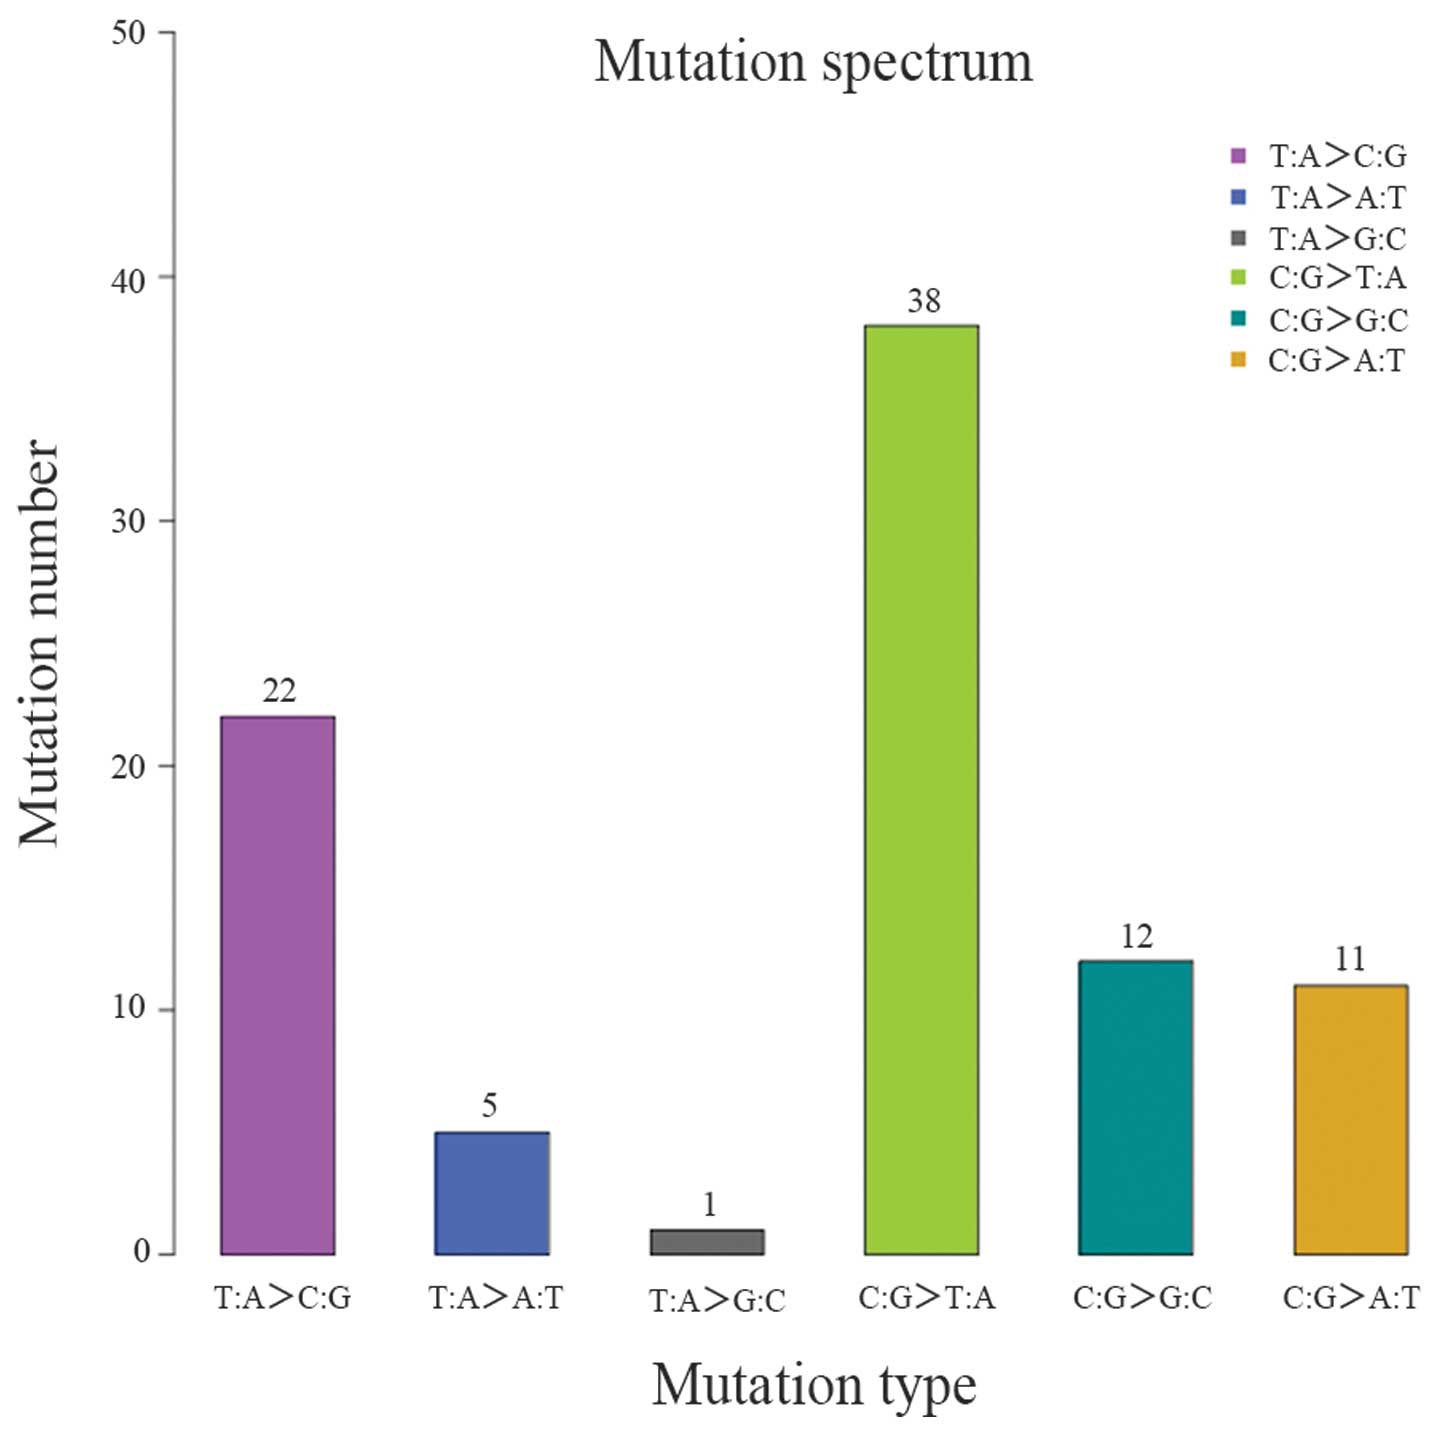
The CNVs of each sample were detected using
CNVnator. Following identification of the CNVs, ANNOVAR was used
for annotation and classification (Table VIII). Varscan was used to
identify specific SNVs by simultaneously comparing read counts,
base quality and allele frequency between the healthy individuals
and patients with type 2 diabetes. Following identification of the
SNVs, ANNOVAR was again used for annotation and classification
(Table IX and Figs. 5 and 6).
| Table VIIICopy number variant data. |
Table VIII
Copy number variant data.
| Category | Value |
|---|
| Total | 4,713 |
| Exonic | 930 |
| Exonic and
splicing | 0 |
| Splicing | 242 |
| ncRNA | 165 |
| UTR5 | 1 |
| UTR5 and UTR3 | 0 |
| UTR3 | 9 |
| Intronic | 1,026 |
| Upstream | 56 |
| Upstream and
downstream | 6 |
| Downstream | 36 |
| Intergenic | 2,242 |
| Amplification
size | 13,445,200 |
| Deletion size | 84,646,400 |
| Table IXSingle nucleotide variant statistics
(healthy control, vs. T2D). |
Table IX
Single nucleotide variant statistics
(healthy control, vs. T2D).
| Category | Value |
|---|
| Total | 13,049 |
| 1000 genome and
dbSNP135 | 12,655 |
| 1000 genome
specific | 11 |
| dbSNP135
specific | 282 |
| dbSNP rate (%) | 99.14 |
| Novel | 101 |
| Hom | 0 |
| Het | 13,049 |
| Synonymous | 52 |
| Missense | 36 |
| Stopgain | 0 |
| Stoploss | 0 |
| Exonic | 88 |
| Exonic and
splicing | 0 |
| Splicing | 1 |
| ncRNA | 305 |
| UTR5 | 15 |
| UTR5 and UTR3 | 0 |
| UTR3 | 112 |
| Intronic | 4,638 |
| Upstream | 73 |
| Upstream and
downstream | 0 |
| Downstream | 74 |
| Intergenic | 7,743 |
| Sorting Intolerant
from Tolerant | 7 |
| Ti/Tv | 2.1188 |
| dbSNP Ti/Tv | 2.1324 |
| Novel Ti/Tv | 1.0612 |
Analyses of somatic InDels, somatic CNVs
and somatic SVs
In the sufficiently covered sites, the initial call
was produced in the type 2 diabetes sample and then compared with
the normal sample to detect evidence for the event. If there was no
evidence to support the InDel event in the normal sample, the site
was considered to be a putative somatic InDel. In total, there were
1,249 somatic InDels in 1,000 genome and dbSNP135, 688 in 1,000
genome specific, and 310 dbSNP135 specific. The results of the
statistical analyses are provided in Table X. The dbSNP rate was 42.19%, and
without heterozygous.
| Table XSomatic insertion and deletion
statistics (healthy control, vs. T2D). |
Table X
Somatic insertion and deletion
statistics (healthy control, vs. T2D).
| Category | Value |
|---|
| 1000 genome and
dbSNP135 | 1,249 |
| 1000 genome
specific | 688 |
| dbSNP135
specific | 310 |
| dbSNP rate (%) | 42.19 |
| Novel | 1,448 |
| Hom | 3,695 |
| Het | 0 |
| Frameshift
insertion | 0 |
| Non-frameshift
insertion | 0 |
| Frameshift
deletion | 1 |
| Non-frameshift
deletion | 3 |
| Frameshift block
substitution | 0 |
| Non-frameshift
block substitution | 0 |
| Stopgain | 0 |
| Stoploss | 0 |
| Exonic | 4 |
| Exonic and
splicing | 0 |
| Splicing | 1 |
| ncRNA | 93 |
| UTR5 | 4 |
| UTR5 and UTR3 | 0 |
| UTR3 | 32 |
| Intronic | 1,242 |
| Upstream | 16 |
| Upstream and
downstream | 0 |
| Downstream | 27 |
| Intergenic | 2,276 |
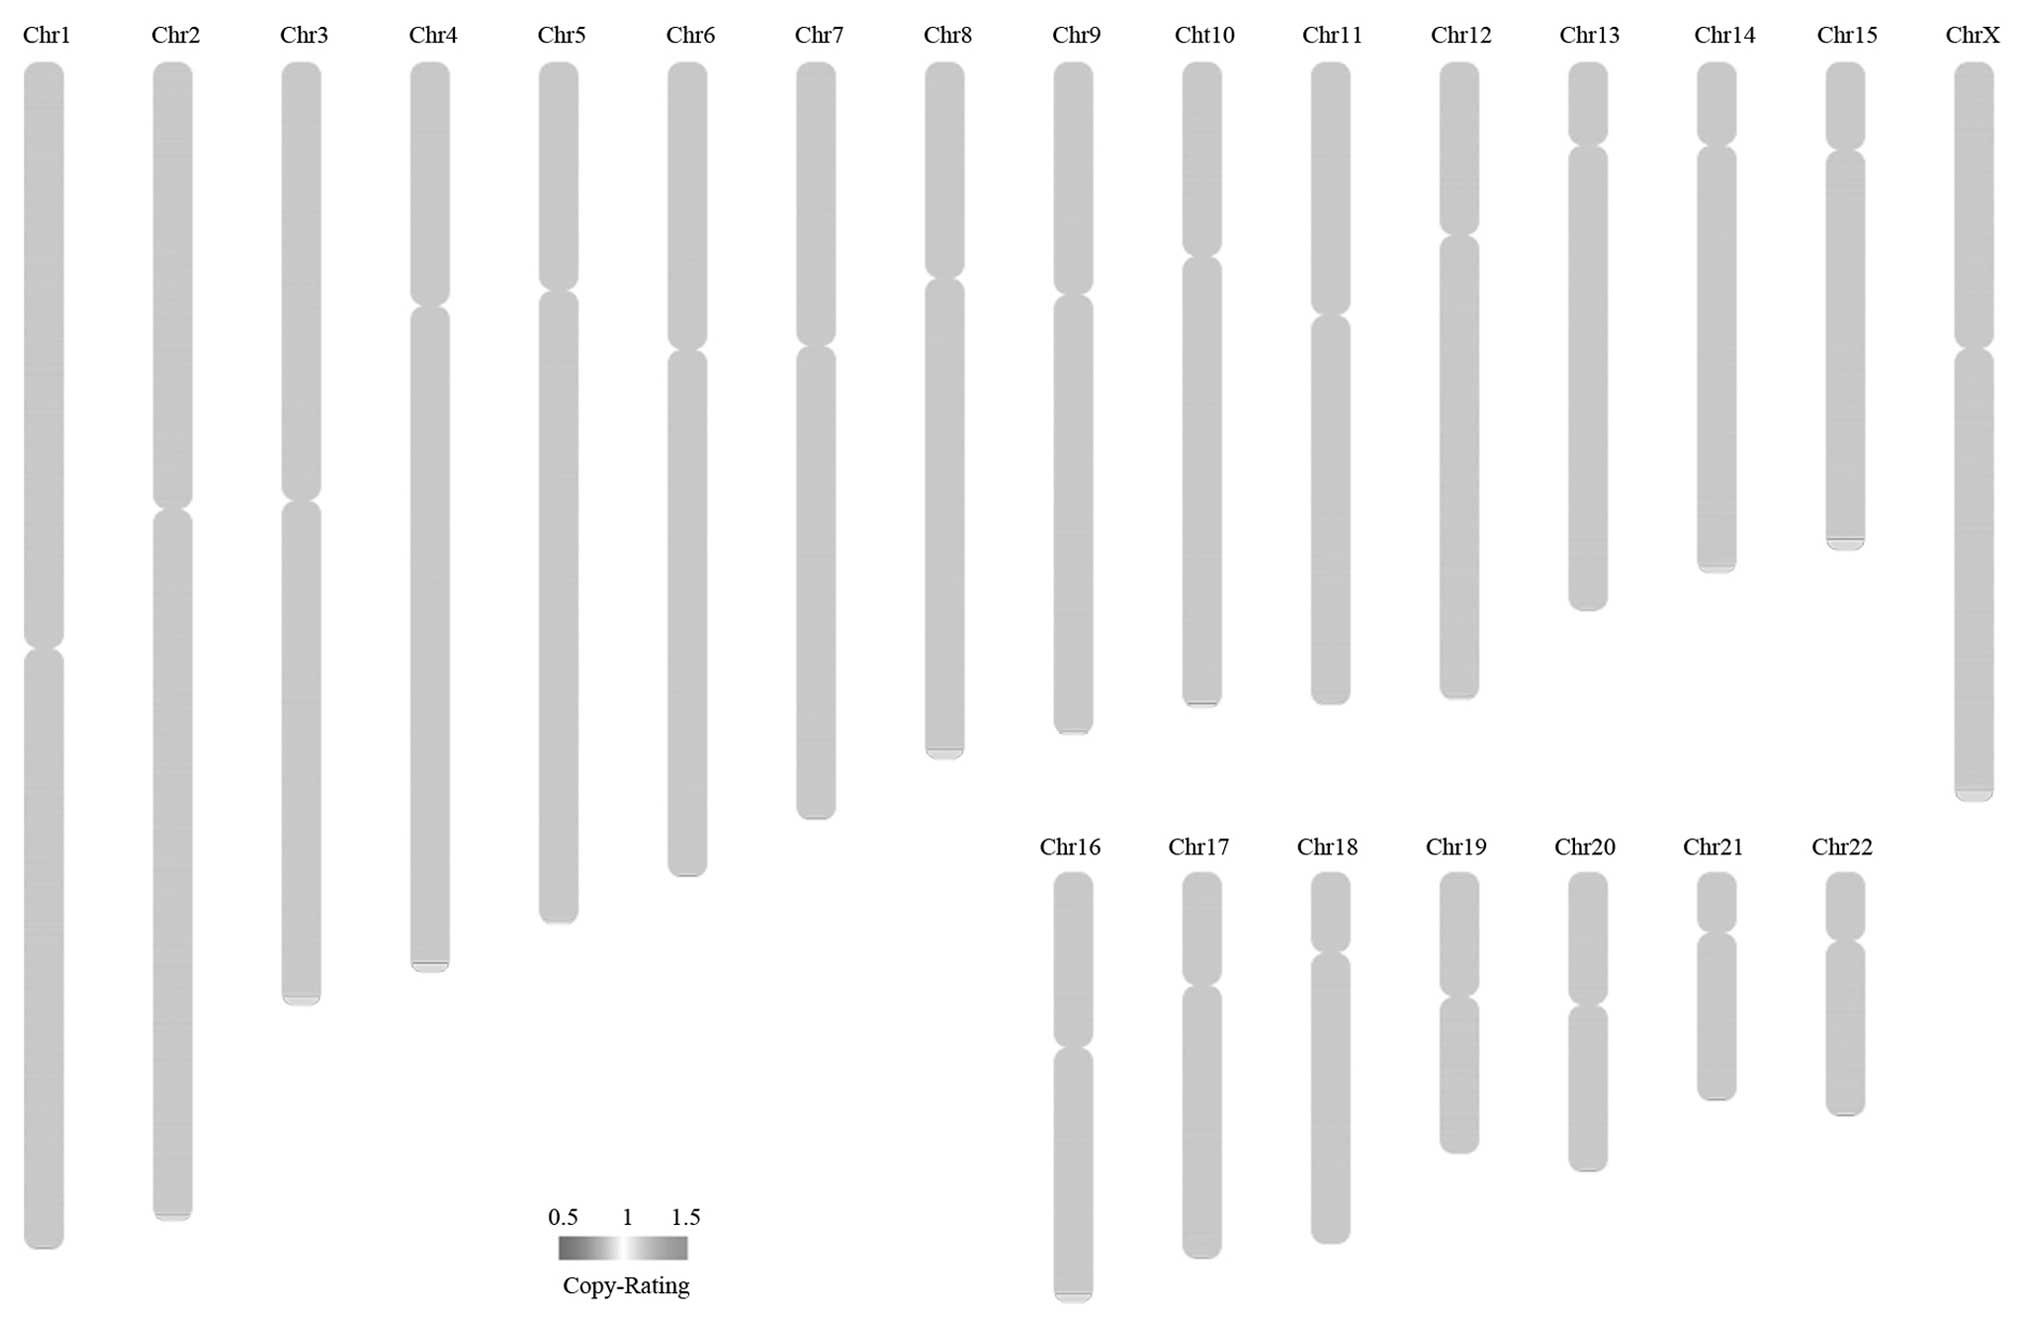
Somatic CNVs correspond to relatively large regions
of the genome, which are either deleted and fewer than the normal
number, or duplicated and more than the normal number, on certain
chromosomes. The results of the somatic CNVs analyses are shown in
Table XI, and the somatic CNV
overview is plotted in Fig. 7.
| Table XISomatic copy number variant analysis
(healthy control, vs, T2D). |
Table XI
Somatic copy number variant analysis
(healthy control, vs, T2D).
| Category | Value |
|---|
| Total | 1,884 |
| Exonic | 185 |
| Exonic and
splicing | 0 |
| Splicing | 21 |
| ncRNA | 41 |
| UTR5 | 0 |
| UTR5 and UTR3 | 0 |
| UTR3 | 6 |
| Intronic | 538 |
| Upstream | 14 |
| Upstream and
downstream | 0 |
| Downstream | 17 |
| Intergenic | 1,062 |
| Amplification
size | 1,372,716 |
| Deletion size | 1,879,767 |
In the sufficiently covered sites, the initial call
was produced in the type 2 diabetes sample and then compared with
the normal sample to detect evidence for the event. If there was no
evidence to support the SV event in the normal sample, this event
was considered to be a putative somatic SV. The results of the
somatic SV statistical analyses are presented in Table XII.
| Table XIISomatic structure variant statistics
(healthy control, vs. T2D). |
Table XII
Somatic structure variant statistics
(healthy control, vs. T2D).
| Category | Value |
|---|
| Total | 74 |
| Insertion | 6 |
| Deletion | 58 |
| Inversion | 0 |
| ITX | 2 |
| CTX | 8 |
| Exonic | 0 |
| Exonic and
splicing | 0 |
| Splicing | 0 |
| ncRNA | 0 |
| UTR5 | 0 |
| UTR5 and UTR3 | 0 |
| UTR3 | 0 |
| Intronic | 24 |
| Upstream | 0 |
| Upstream and
downstream | 0 |
| Downstream | 0 |
| Intergenic | 50 |
Discussion
In the present study, whole-genome re-sequencing was
performed with DNA pooling to investigate T2D in Chinese
individuals. In total, 1.44 GB of raw data were generated in a
short period of time. Among the data obtained, 3,010 novel SNPs and
120,703 novel InDels were found. In addition, 5,590 SVs, 4,713 CNVs
and 13,049 SNVs were identified. There was a significant difference
between cases and controls in 1,884 somatic CNVs and 74 somatic
SVs. These findings improve current understanding of the genetic
basis of T2D and offer insight for future investigations.
Among the identified genes, only rs734312 in WFS1
(with a SIFT score 0.02 and a PolyPhen score of 0.99) suggested a
pathologic nature. It was also found that, even in the same genes,
the associated loci were different in the present study. Although
>30 genetic susceptibility loci have been found in the
comparison of 76 genes, the most frequently reported variants have
small to moderate effects, and account for only a small proportion
of the heritability of T2D, suggesting that the majority of
inter-person genetic variation in this disease remains to be
elucidated (20).
KCNQ1 (40), UBE2E2
and C2CD4A-C2CD4B (19) have been
identified as T2D susceptibility genes in three GWA scans in
Japanese individuals. The combined analyses identified GLIS3, PEPD,
FITM2-R3HDML-HNF4A, KCNK16, MAEA, GCC1-PAX4, PSMD6 and ZFAND3 as
T2D loci reaching genome-wide significance in East Asia (22). PTPRD and SRR have been identified
as diabetes susceptibility loci in a study of a Han Chinese
population (2). In the present
study, the SNP loci in the UBE2E2, PSMD6, ZFAND3 and SRR genes were
not found. The results of the present study suggested that, in
different patient populations, different genes may confer risks for
diabetes, which may lead to more complex study designs for
investigating the molecular pathogenesis of T2D.
A simple, but important observation was that DNA
pooling provides a highly effective approach for examining the
genetic underpinnings of common familial diseases. DNA pooling has
been confirmed to be an effective and efficient method to select
candidate susceptibility loci for follow-up by individual
genotyping (12,13,41).
This indicates that the use of GWAS for a large number of cases and
controls are technically and financially feasible. Additional
findings of particular interest include the large-scale examination
of possible genetic variants. The present study demonstrated novel,
significant associations, including SNPs, CNVs, InDels and
SNVs.
The present study indicated general recommendations,
which are relevant to whole-genome re-sequencing using DNA pooling.
The first recommendation is associated with the importance of
careful quality control. In the present study, 144.3 GB of raw data
were generated from the Illumina pipeline, which contained too many
Ns or low quality bases. Small systematic differences can readily
produce effects capable of obscuring true associations from being
identified (42,43). The present study implemented
extensive quality control checks to minimize differences in the
clean data, alignment and called variants.
The sequencing method used in the present study also
resulted in sequence redundancy reaching an average of 35.70-fold.
Thus, the consensus sequence accuracy was higher and particularly
suitable for calling heterozygous alleles. Whole-genome
re-sequencing with DNA pooling technologies is high throughput
technique, as one hundred million DNA fragments can be sequenced in
parallel on one chip. The Illumina HiSeq 2000 platform from
Illumina used in the present study can provide up to 55 GB of
high-quality data per day. In this regard, it was possible to
undertake comprehensive assessments of the variants within the
regions of interest using this high-throughput and time efficient
method.
Thirty years ago, James V. Neel (44) labeled T2D as 'the geneticist's
nightmare', describing the identification of genetic factors in T2D
as challenging. Numerous investigations on candidate genes for T2D
have been published; however, the various approaches, including
high-throughput gene scanning and gene and pedigree analysis have
not been entirely successful in identifying robustly replicating
T2D-susceptibility loci. Ultimately, with large samples and
worldwide collaboration, novel risk factors for diabetes are likely
be identified using whole-genome re-sequencing technology.
Acknowledgments
The authors would like to thank Professor Yong Dai
(Department of Clinical Medical Research Center, The Second
Clinical Medical College of Jinan University, Shenzhen People's
Hospital, Shenzhen, Guangdong, China) and Professor Yueying Xiang
(Department of Health Management Center, 181st Hospital, Guilin,
Guangxi, China) for their helpful comments, and Dr Minglin Ou and
Mr Xianliang Hou from the Nephrology Department of 181st Hospital
and Guangxi Key Laboratory of Metabolic Diseases Research (Guilin,
China) for their technical assistance.
References
|
1
|
Chen L, Magliano DJ and Zimmet PZ: The
worldwide epidemiology of type 2 diabetes mellitus-present and
future perspectives. Nat Rev Endocrinol. 8:228–236. 2011.
View Article : Google Scholar : PubMed/NCBI
|
|
2
|
Tsai FJ, Yang CF, Chen CC, Chuang LM, Lu
CH, Chang CT, Wang TY, Chen RH, Shiu CF, Liu YM, et al: A
genome-wide association study identifies susceptibility variants
for type 2 diabetes in Han Chinese. PLoS Genet. 6:e10008472010.
View Article : Google Scholar : PubMed/NCBI
|
|
3
|
Scott LJ, Mohlke KL, Bonnycastle LL,
Willer CJ, Li Y, Duren WL, Erdos MR, Stringham HM, Chines PS,
Jackson AU, et al: A genome-wide association study of type 2
diabetes in Finns detects multiple susceptibility variants.
Science. 316:1341–1345. 2007. View Article : Google Scholar : PubMed/NCBI
|
|
4
|
Diabetes Genetics Initiative of Broad
Institute of Harvard and MIT; Lund University; Novartis Institutes
of BioMedical Research; Saxena R, Voight BF, Lyssenko V, Burtt NP,
de Bakker PI, Chen H, Roix JJ, Kathiresan S, Hirschhorn JN, et al:
Genome-wide association analysis identifies loci for type 2
diabetes and triglyceride levels. Science. 316:1331–1336. 2007.
View Article : Google Scholar : PubMed/NCBI
|
|
5
|
Sladek R, Rocheleau G, Rung J, Dina C,
Shen L, Serre D, Boutin P, Vincent D, Belisle A, Hadjadj S, et al:
A genome-wide association study identifies novel risk loci for type
2 diabetes. Nature. 445:881–885. 2007. View Article : Google Scholar : PubMed/NCBI
|
|
6
|
Zeggini E, Weedon MN, Lindgren CM,
Frayling TM, Elliott KS, Lango H, Timpson NJ, Perry JR, Rayner NW,
Freathy RM, et al: Replication of genome-wide association signals
in UK samples reveals risk loci for type 2 diabetes. Science.
316:1336–1341. 2007. View Article : Google Scholar : PubMed/NCBI
|
|
7
|
Wellcome Trust Case Control Consortium:
Genome-wide association study of 14,000 cases of seven common
diseases and 3,000 shared controls. Nature. 447:661–678. 2007.
View Article : Google Scholar : PubMed/NCBI
|
|
8
|
Zeggini E, Scott LJ, Saxena R, Voight BF,
Marchini JL, Hu T, de Bakker PI, Abecasis GR, Almgren P, Andersen
G, et al: Meta-analysis of genome-wide association data and
large-scale replication identifies additional susceptibility loci
for type 2 diabetes. Nat Genet. 40:638–645. 2008. View Article : Google Scholar : PubMed/NCBI
|
|
9
|
Gudmundsson J, Sulem P, Steinthorsdottir
V, Bergthorsson JT, Thorleifsson G, Manolescu A, Rafnar T,
Gudbjartsson D, Agnarsson BA, Baker A, et al: Two variants on
chromosome 17 confer prostate cancer risk and the one in TCF2
protects against type 2 diabetes. Nat Genet. 39:977–983. 2007.
View Article : Google Scholar : PubMed/NCBI
|
|
10
|
Saxena R, Elbers CC, Guo Y, Peter I, Gaunt
TR, Mega JL, Lanktree MB, Tare A, Castillo BA, Li YR, et al:
Large-scale gene-centric meta-analysis across 39 studies identifies
type 2 diabetes loci. Am J Hum Genet. 90:410–425. 2012. View Article : Google Scholar : PubMed/NCBI
|
|
11
|
Baum AE, Akula N, Cabanero M, Cardona I,
Corona W, Klemens B, Schulze TG, Cichon S, Rietschel M, Nöthen MM,
et al: A genome-wide association study implicates diacylglycerol
kinase eta (DGKH) and several other genes in the etiology of
bipolar disorder. Mol Psychiatry. 13:197–207. 2008. View Article : Google Scholar :
|
|
12
|
Galvan A, Falvella FS, Frullanti E,
Spinola M, Incarbone M, Nosotti M, Santambrogio L, Conti B,
Pastorino U, Gonzalez-Neira A and Dragani TA: Genome-wide
association study in discordant sibships identifies multiple
inherited susceptibility alleles linked to lung cancer.
Carcinogenesis. 31:462–465. 2010. View Article : Google Scholar
|
|
13
|
Forstbauer LM, Brockschmidt FF, Moskvina
V, Herold C, Redler S, Herzog A, Hillmer AM, Meesters C, Heilmann
S, Albert F, et al: Genome-wide pooling approach identifies SPATA5
as a new susceptibility locus for alopecia areata. Eur J Hum Genet.
20:326–332. 2012. View Article : Google Scholar :
|
|
14
|
Wong LP, Ong RT, Poh WT, Liu X, Chen P, Li
R, Lam KK, Pillai NE, Sim KS, Xu H, et al: Deep whole-genome
sequencing of 100 southeast asian malays. Am J Hum Genet. 92:52–66.
2013. View Article : Google Scholar : PubMed/NCBI
|
|
15
|
Kong A, Steinthorsdottir V, Masson G,
Thorleifsson G, Sulem P, Besenbacher S, Jonasdottir A, Sigurdsson
A, Kristinsson KT, Jonasdottir A, et al: Parental origin of
sequence variants associated with complex diseases. Nature.
462:868–874. 2009. View Article : Google Scholar : PubMed/NCBI
|
|
16
|
Voight BF, Scott LJ, Steinthorsdottir V,
Morris AP, Dina C, Welch RP, Zeggini E, Huth C, Aulchenko YS,
Thorleifsson G, et al: Twelve type 2 diabetes susceptibility loci
identified through large-scale association analysis. Nat Genet.
42:579–589. 2010. View
Article : Google Scholar : PubMed/NCBI
|
|
17
|
Dupuis J, Langenberg C, Prokopenko I,
Saxena R, Soranzo N, Jackson AU, Wheeler E, Glazer NL, Bouatia-Naji
N, Gloyn AL, et al: New genetic loci implicated in fasting glucose
homeostasis and their impact on type 2 diabetes risk. Nat Genet.
42:105–116. 2010. View
Article : Google Scholar : PubMed/NCBI
|
|
18
|
Qi L, Cornelis MC, Kraft P, Stanya KJ,
Linda Kao WH, Pankow JS, Dupuis J, Florez JC, Fox CS, Paré G, et
al: Genetic variants at 2q24 are associated with susceptibility to
type 2 diabetes. Hum Mol Genet. 19:2706–2715. 2010. View Article : Google Scholar : PubMed/NCBI
|
|
19
|
Yamauchi T, Hara K, Maeda S, Yasuda K,
Takahashi A, Horikoshi M, Nakamura M, Fujita H, Grarup N, Cauchi S,
et al: A genome-wide association study in the Japanese population
identifies susceptibility loci for type 2 diabetes at UBE2E2 and
C2CD4A-C2CD4B. Nat Genet. 42:864–868. 2010. View Article : Google Scholar : PubMed/NCBI
|
|
20
|
Shu XO, Long J, Cai Q, Qi L, Xiang YB, Cho
YS, Tai ES, Li X, Lin X, Chow WH, et al: Identification of new
genetic risk variants for type 2 diabetes. PLoS Genet.
6:e10011272010. View Article : Google Scholar : PubMed/NCBI
|
|
21
|
Kooner JS, Saleheen D, Sim X, Sehmi J,
Zhang W, Frossard P, Been LF, Chia KS, Dimas AS, Hassanali N, et
al: Genome-wide association study in individuals of South Asian
ancestry identifies six new type 2 diabetes susceptibility loci.
Nat Genet. 43:984–989. 2011. View
Article : Google Scholar : PubMed/NCBI
|
|
22
|
Cho YS, Chen CH, Hu C, Long J, Ong RT, Sim
X, Takeuchi F, Wu Y, Go MJ, Yamauchi T, et al: Meta-analysis of
genome-wide association studies identifies eight new loci for type
2 diabetes in east Asians. Nat Genet. 44:67–72. 2011. View Article : Google Scholar : PubMed/NCBI
|
|
23
|
Alberti KG and Zimmet PZ: Definition,
diagnosis and classification of diabetes mellitus and its
complications. Part 1: diagnosis and classification of diabetes
mellitus provisional report of a WHO consultation. Diabet Med.
15:539–553. 1998. View Article : Google Scholar : PubMed/NCBI
|
|
24
|
Mardis ER: Next-generation DNA sequencing
methods. Annu Rev Genomics Hum Genet. 9:387–402. 2008. View Article : Google Scholar : PubMed/NCBI
|
|
25
|
Wang J, Wang W, Li R, Li Y, Tian G,
Goodman L, Fan W, Zhang J, Li J, Zhang J, et al: The diploid genome
sequence of an Asian individual. Nature. 456:60–65. 2008.
View Article : Google Scholar : PubMed/NCBI
|
|
26
|
Wheeler DA, Srinivasan M, Egholm M, Shen
Y, Chen L, McGuire A, He W, Chen YJ, Makhijani V, Roth GT, et al:
The complete genome of an individual by massively parallel DNA
sequencing. Nature. 452:872–876. 2008. View Article : Google Scholar : PubMed/NCBI
|
|
27
|
Li H and Durbin R: Fast and accurate short
read alignment with Burrows-Wheeler transform. Bioinformatics.
25:1754–1760. 2009. View Article : Google Scholar : PubMed/NCBI
|
|
28
|
Li R, Li Y, Fang X, Yang H and Wang J,
Kristiansen K and Wang J: SNP detection for massively parallel
whole-genome resequencing. Genome Res. 19:1124–1132. 2009.
View Article : Google Scholar : PubMed/NCBI
|
|
29
|
Li H, Handsaker B, Wysoker A, Fennell T,
Ruan J, Homer N, Marth G, Abecasis G and Durbin R: 1000 Genome
project data processing subgroup: The sequence alignment/Map format
and SAMtools. Bioinformatics. 25:2078–2079. 2009. View Article : Google Scholar : PubMed/NCBI
|
|
30
|
McKenna A, Hanna M, Banks E, Sivachenko A,
Cibulskis K, Kernytsky A, Garimella K, Altshuler D, Gabriel S, Daly
M and DePristo MA: The Genome Analysis Toolkit: A MapReduce
framework for analyzing next-generation DNA sequencing data. Genome
Res. 20:1297–1303. 2010. View Article : Google Scholar : PubMed/NCBI
|
|
31
|
DePristo MA, Banks E, Poplin R, Garimella
KV, Maguire JR, Hartl C, Philippakis AA, del Angel G, Rivas MA and
Hanna M: A framework for variation discovery and genotyping using
next-generation DNA sequencing data. Nat Genet. 43:491–498. 2011.
View Article : Google Scholar : PubMed/NCBI
|
|
32
|
Abyzov A, Urban AE, Snyder M and Gerstein
M: CNVnator: An approach to discover, genotype, and characterize
typical and atypical CNVs from family and population genome
sequencing. Genome Res. 21:974–984. 2011. View Article : Google Scholar : PubMed/NCBI
|
|
33
|
Mills RE, Walter K, Stewart C, Handsaker
RE, Chen K, Alkan C, Abyzov A, Yoon SC, Ye K, Cheetham RK, et al:
Mapping copy number variation by population-scale genome
sequencing. Nature. 470:59–65. 2011. View Article : Google Scholar : PubMed/NCBI
|
|
34
|
Koboldt DC, Chen K, Wylie T, Larson DE,
McLellan MD, Mardis ER, Weinstock GM, Wilson RK and Ding L:
VarScan: Variant detection in massively parallel sequencing of
individual and pooled samples. Bioinformatics. 25:2283–2285. 2009.
View Article : Google Scholar : PubMed/NCBI
|
|
35
|
Chen K, Wallis JW, McLellan MD, Larson DE,
Kalicki JM, Pohl CS, McGrath SD, Wendl MC, Zhang Q, Locke DP, et
al: BreakDancer: An algorithm for high-resolution mapping of
genomic structural variation. Nat Methods. 6:677–681. 2009.
View Article : Google Scholar : PubMed/NCBI
|
|
36
|
Chiang DY, Getz G, Jaffe DB, O'Kelly MJ,
Zhao X, Carter SL, Russ C, Nusbaum C, Meyerson M and Lander ES:
High-resolution mapping of copy-number alterations with massively
parallel sequencing. Nat Methods. 6:99–103. 2009. View Article : Google Scholar :
|
|
37
|
Wang K, Li M and Hakonarson H: ANNOVAR:
Functional annotation of genetic variants from high-throughput
sequencing data. Nucleic Acids Res. 38:e1642010. View Article : Google Scholar : PubMed/NCBI
|
|
38
|
Kumar P, Henikoff S and Ng PC: Predicting
the effects of coding non-synonymous variants on protein function
using the SIFT algorithm. Nat Protoc. 4:1073–1081. 2009. View Article : Google Scholar : PubMed/NCBI
|
|
39
|
Adzhubei IA, Schmidt S, Peshkin L,
Ramensky VE, Gerasimova A, Bork P, Kondrashov AS and Sunyaev SR: A
method and server for predicting damaging missense mutations. Nat
Methods. 7:248–249. 2010. View Article : Google Scholar : PubMed/NCBI
|
|
40
|
Yasuda K, Miyake K, Horikawa Y, Hara K,
Osawa H, Furuta H, Hirota Y, Mori H, Jonsson A, Sato Y, et al:
Variants in KCNQ1 are associated with susceptibility to type 2
diabetes mellitus. Nat Genet. 40:1092–1097. 2008. View Article : Google Scholar : PubMed/NCBI
|
|
41
|
Vélez JI, Chandrasekharappa SC, Henao E,
Martinez AF, Harper U, Jones M, Solomon BD, Lopez L, Garcia G,
Aguirre-Acevedo DC, et al: Pooling/bootstrap-based GWAS (pbGWAS)
identifies new loci modifying the age of onset in PSEN1 p.Glu280Ala
Alzheimer's disease. Mol Psychiatry. 18:568–575. 2013. View Article : Google Scholar :
|
|
42
|
Clayton DG, Walker NM, Smyth DJ, Pask R,
Cooper JD, Maier LM, Smink LJ, Lam AC, Ovington NR, Stevens HE, et
al: Population structure, differential bias and genomic control in
a large-scale, case-control association study. Nat Genet.
37:1243–1246. 2005. View
Article : Google Scholar : PubMed/NCBI
|
|
43
|
Zondervan KT and Cardon LR: The complex
interplay among factors that influence allelic association. Nat Rev
Genet. 5:89–100. 2004. View Article : Google Scholar : PubMed/NCBI
|
|
44
|
Neel JV: The Genetics of Diabetes
Mellitus. Creutzfeldt W, Köbberling J and Neel JV: Springer;
Berlin: 1976, pp. 1–11. View Article : Google Scholar
|