Introduction
MicroRNAs (miRNAs) are small (~22 nucleotide),
endogenous, non-coding RNAs, which downregulate expression via
complimentary binding to the 3′ untranslated region of target
messenger (m)RNAs, thereby repressing translation or decreasing
mRNA stability (1). In previous
years, >1,000 miRNAs have been identified in the human genome,
which regulate 30% human genes (2,3).
Increasing evidence has indicated that miRNAs are important in the
development of several human diseases, predominantly by targeting
genes, which are key regulators of cell proliferation,
differentiation and survival, DNA repair and the immune response
(4).
Crohn's disease (CD) and ulcerative colitis (UC) are
the two predominant types of idiopathic inflammatory bowel disease
(IBD). IBD is a gastrointestinal chronic inflammatory disorder,
which has been empirically defined by clinical, pathological,
endoscopic and radiological features (5). The worldwide prevalence rate is as
high as 39.6/100,000 individuals, the incidence rate for CD varies
between 0.1 and 16/100,000 individuals and for UC between 0.5 and
24.5. One of the most serious complications faced by patients with
IBD is the potential development of colorectal cancer (CRC).
Although IBD associated CRC (IBD-CRC) accounts for only 1–2% of all
cases of CRC, IBD with colon involvement is among the top three
high risk conditions for CRC (6).
IBD is considered to arise in genetically susceptible individuals
as a consequence of a dysregulated immune response, and involves
complex pathophysiological mechanisms (7). Previous evidence indicates that
genetic factors are important in the pathogenesis of IBD (8,9),
thus genetic risk factors predisposing individuals to IBD remain to
be fully elucidated.
The differential expression of miRNA is described in
multiple autoimmune-associated disorders, including rheumatoid
arthritis, lupus, psoriasis and asthma (10–12).
It has been reported that there are changes in the expression
levels of miRNA in epithelial cells of patients with active UC and
CD, compared with healthy controls, as well as in the progression
from normal colonic tissue to dysplastic tissue in patients with
IBD (13). It is well demonstrated
that single nucleotide polymorphisms (SNPs) or mutations in miRNAs
sequence may alter the expression of miRNAs (14). In addition, several studies have
been performed to investigate the association between SNPs in
miRNAs and susceptibility to CRC (15,16).
Previous studies have shown that four common polymorphisms
(rs2910164, rs11614913, rs3746444 and rs2292832) in pre-miRNAs
(mir-146a, mir-196a, mir-499 and mir-149, respectively) are
associated with an increased risk for several diseases, including
CRC (16–18). The present study involved
performing a case control investigation to elucidate the
association of these polymorphisms with the risk of the occurrence
of IBD, and its progression to IBD-CRC. The results of this study
may indicate markers for the occurrence of IBD and the risk of
progression to IBD-CRC; this would help physicians identify and
treat patients earlier.
Materials and methods
Patient cohorts and study design
Between January 2010 and December 2012, 468 patients
with IBD and 450 healthy, unrelated, age- and gender matched
individuals (as a control group) from The First Hospital Affiliated
of Henan Science and Technology University (Henan, China) were
enrolled in the present study. The diagnosis of IBD was made on the
basis of clinical, radiological, endoscopic and histological
criteria (19). CD and UC were
classified based on the Montreal classification (20). Individuals with other digestive
system diseases, including gastric disease and hepatic disease, or
chronic diseases, including hypertension and heart disease, were
excluded from the investigation. The clinical data documented for
the present study were as follows: Type of IBD (CD or UC), age,
gender, age at diagnosis, disease localization, clinical symptoms
and smoking status. The present study was approved by the Ethical
Committee of The Chinese PLA General Hospital (Beijing, China) on
19 November, 2009 (approval no. 2009-039) and all patients provided
written informed consent.
DNA extraction
Whole blood samples (~2 ml) from the patients and
controls were collected and stored in Vacutainer tubes (BD
Biosciences, Fanklin Lakes, NJ, USA), which contained the
anticoagulant EDTA. Genomic DNA was extracted from the peripheral
whole blood using a Qiagen Blood kit (Qiagen, Chatsworth, CA, USA),
according to the manufacturer's protocol, and stored at −20°C until
use.
Genotyping
The genotypes were determined using polymerase chain
reaction restriction fragment length polymorphism (PCR-RFLP)
analysis. The primers (Beijing Genomics Institute, Beijing, China)
and restriction endonucleases (New England Biolabs, Ipswich, MA,
USA) used are summarized in Table
I. The PCR reactions were performed using an AmpliTaq Gold PCR
kit (Applied Biosystems, Foster City, CA, USA) in a total volume of
25 µl, containing 1X PCR buffer, 0.2 mM dNTPs, 1 mM
MgCl2, 50 pmol of each primer, 20 ng genomic DNA and 1
unit of Ampli Taq Glod DNA polymerase (Applied Biosystems, Foster
City, CA, USA). The PCR parameters were as follows: 95°C for 5 min,
followed by 35 cycles of 95°C for 30 sec, 30 sec at 58°C for
rs2910164, 30 sec at 60°C for rs11614913 and 30 sec at 67°C for
rs3746444, 30 sec at 62°C for rs2292832 and 30 sec at 72°C, with a
final elongation step at 72°C for 10 min. Following PCR
amplification, the products were digested overnight with specific
restriction endonuclease at 37°C. The digested products were
electrophoresed on 3% agarose gels (Agarose bead Technologies,
Madrid, Spain). Alpha Gel Imaging Systems (Alpha Inotech,
Corporation, Santa Clara, CA, USA) was used to detect the
electrophoresis results. The products of the genotyping assays are
presented in Table I.
 | Table IPrimary information from genotyping
assays of microRNA single nucleotide polymorphisms. |
Table I
Primary information from genotyping
assays of microRNA single nucleotide polymorphisms.
| Gene | Primer sequence
(5′–3′) | PCR product | Restriction
endonuclease | Enzyme product |
|---|
| rs2910164 |
F-5′-CATGGGTTGTGTCAGTGTCAGAGCT-3′
R-5′-TGCCTTCTGTCTCCAGTCTTCCAA-3′ | 147 bp | SacI | G allele: 147 bp, C
allele: 122+25 bp |
| rs11614913 |
F-5′-CCCCTTCCCTTCTCCTCCAGATA-3′
R-5′-CGAAAACCGACTGATGTAACTCCG-3′ | 149 bp | MspI | C allele: 125+24 bp,
T allele: 149 bp |
| rs3746444 |
F-5′-CAAAGTCTTCACTTCCCTGCCA-3′
R-5′-GATGTTTAACTCCTCTCCACGTGATC-3′ | 146 | BclI | A allele: 120+26 bp,
G allele: 126 bp |
| rs2292832 |
F-5′-TGTCTTCACTCCCGTGCTTGTCC-3′
R-5′-TGAGGCCCGAAACACCCGTA-3′ | 254 bp | PvuII | C allele: 254 bp, T
allele: 194+60 bp |
Quality control
For quality control purposes, 10% of the samples
were randomly selected and sequence analysis was performed, with
100% concordance to the genotype, by PCR-RFLP.
Analysis of mir-RNA expression
levels
Total RNA was extracted from peripheral blood
mononuclear cells (PBMCs) using TRIzol (Invitrogen; Thermo Fisher
Scientific, Inc., Waltham, MA, USA), according to the
manufacturer's protocol. The quality and quantity of the RNAs were
assessed by a 260/280 optical density ratio. Reverse transcription
reactions were performed using an AffinityScript QPCR cDNA
synthesis kit (Agilent Technologies, La Jolla, CA, USA), according
to the manufacturer's instructions. The mir-RNAs were detected
using TaqMan MicroRNA assays (Applied Biosystems). After the
genotyping of miRNA polymorphisms, ~5 ml peripheral blood was
obtained from patients with IBD. Quantitative (q)PCR was performed
in duplicates on an ABI 7500 Real Time PCR system (Thermo Fisher
Scientific, Inc.). The qPCR reactions were performed in a total
volume of 20 µl, containing 1 µl Taqman Small RNA
Assay (X20), 1.33 µl reverse transcription reaction product,
10 µl TaqMan Universal PCR Master Mix and 7.67 µl
nuclease-free water. The PCR parameters were as follows: 50°C For 2
min, 95°C for 10 min, followed by 40 cycles of 95°C for 15 sec and
60°C for 60 sec. Cycles of quantification (Cq) values were
acquired, and the relative expression levels of the mature miRNAs
were calculated using the CqmiRNA/CqU6 ratio
(21).
Statistical analysis
Statistical analysis was performed using the SPSS
17.0 statistical software package (SPSS for Windows; SPSS, Inc,
Chicago, IL, USA). A two-tailed χ2 test was used to
determine the differences in genotype distribution between patients
and controls. The association between miRNA polymorphisms and IBD
were assessed by calculating odds ratio (OR) and 95% confidence
interval (95% CI) by logistic regression analysis. A non-parametric
Mann Whitney U test was used to compare expression levels of
miRNAs. The Hardy Weinberg equilibrium test was used to evaluate
whether there was stratification within the patients enrolled in
the study. P<0.05 was considered to indicate a statistically
significant difference.
Results
Characteristics of the study
population
A total of 468 patients with IBD and 450 healthy
individuals were recruited from The First Hospital Affiliated of
Henan Science and Technology University for investigation in the
present study. The 468 patients with IBD included 227 patients with
CD (48.5%) and 241 patients with UC (51.5%). The mean age of the
IBD cohort was 42.2±9.8 years, and the male:female ratio was 1.11:1
(246:222 patients). The mean age of the control group was 41.9±8.6
years, and the male:female ratio was 1.11:1 (237:213 individuals).
No significant differences were observed between the patients and
controls in mean age (P=0.76) or gender distribution (P=0.35),
suggesting adequate matching based on these two variables. The
characteristics of the patients with IBD and controls are shown in
Table II.
| Table IICharacteristics of the patient and
control populations. |
Table II
Characteristics of the patient and
control populations.
| Characteristic | CD (n=227) | UC (n=241) | Control (n=450) |
|---|
| Age (year) | 43.8±4.7 | 41.7±10.1 | 41.9±8.6 |
| Gender | | | |
| Male | 118 (52.0) | 128 (53.1) | 237 (52.7) |
| Female | 109 (48.0) | 113 (46.9) | 213 (47.3) |
| Age at diagnosis
(year) | 27.6±9.4 | 29.1±2.7 | |
| ≤16 | 72 (31.7) | – | – |
| 17–40 | 121 (53.3) | – | – |
| >40 | 34 (15.0) | – | – |
| Disease location
CD, n (%) | | – | – |
| Ileum | 84 (37.0) | – | – |
| Colon | 61 (26.9) | – | – |
| Ileocolon | 82 (36.1) | – | – |
| Disease behavior
CD, n (%) | | – | – |
| Inflammatory | 151 (66.5) | – | – |
| Stricturing | 56 (24.7) | – | – |
| Penetrating | 20 (8.8) | – | – |
| Disease extent UC,
n (%) | | | – |
| Ulcerative
proctitis | – | 31 (12.9) | – |
| Left sided UC | – | 109 (45.2) | – |
| Extensive UC | – | 101 (41.9) | – |
| Disease severity
UC, n (%) | | | – |
| Clinical
remission | – | 43 (17.8) | – |
| Mild UC | – | 41 (17.0) | – |
| Moderate UC | – | 118 (49.0) | – |
| Severe UC | – | 39 (16.2) | – |
| Smoking, n (%) | 51 (22.5) | 57 (23.7) | 126 (28.0) |
Genotypes
The genotype and allele distributions for the miRNA
SNPs in 468 patients with IBD and 450 controls subjects are
summarized in Table III. The
distributions of genotypes among the two groups were in agreement
with the Hardy Weinberg equilibrium (rs2910164: patients:
χ2=0.367, P=0.545; controls:
χ2=3.573, P=0.059; rs11614913: patients:
χ2=0.521, P=0.479; controls:
χ2=1.046, P=0.306; rs3746444: patients:
χ2=2.827, P=0.093; controls:
χ2=2.542, P=0.111; rs2292832: patients:
χ2=0.308, P=0.579; controls:
χ2=0.448, P=0.504), providing no evidence of
population stratification within the dataset. There were
statistically significant differences between the frequencies of
rs2910164 and rs2292832 genotypes between the IBD group and the
healthy controls (χ2=11.306, df=2.0,
P=0.004 and χ2=7.957, df=2.0, P=0.032,
respectively). In order to assess whether the risk of IBD was
associated with the genotype of the miRNA SNPs, logistic regression
analysis was performed.
| Table IIIAssociation between single nucleotide
polymorphisms in miRNAs and the risk of inflammatory bowel
disease. |
Table III
Association between single nucleotide
polymorphisms in miRNAs and the risk of inflammatory bowel
disease.
| Genotype | Control (n=450) n
(%) | Inflammatory bowel
disease (n=468)
| Crohn's disease
(n=227)
| Ulcerative coltits
(n=241)
|
|---|
| n (%) | OR (95 CI) | P value | n (%) | OR (95 CI) | P value | n (%) | OR (95 CI) | P value |
|---|
| mir-146a
rs2910164 |
| Genotype |
| GG | 97 (21.6) | 62 (13.2) | 1.00 | | 30 (13.2) | 1.00 | | 32 (13.3) | 1.00 | |
| GC | 202 (44.9) | 225 (48.1) | 1.743
(1.202–2.525) | 0.003a | 112 (49.3) | 1.793
(1.120–2.869) | 0.015a | 113 (46.9) | 1.696
(1.069–2.689) | 0.025a |
| CC | 151 (33.5) | 181 (38.7) | 1.875
(1.276–2.756) | 0.001a | 85 (37.5) | 1.820
(1.117–2.965) | 0.016a | 96 (39.8) | 1.927
(1.119–3.097) | 0.007a |
| Additive | | | 1.310
(1.089–1.576) | 0.004a | | 1.274
(1.016–1.599) | 0.036a | | 1.332
(1.067–1.664) | 0.011a |
| Dominant |
| GC+GG | 299 (66.5) | 287 (61.3) | 1.00 | | 142 (62.5) | 1.00 | | 145 (60.2) | 1.00 | |
| CC | 151 (33.5) | 181 (38.7) | 1.249
(0.953–1.636) | 0.107 | 85 (37.5) | 1.185
(0.850–1.653) | 0.316 | 96 (39.8) | 1.311
(0.948–1.812) | 0.101 |
| Recessive |
| GG | 97 (21.6) | 62 (13.2) | 1.00 | | 30 (13.2) | 1.00 | | 32 (13.3) | 1.00 | |
| CC+GC | 353 (78.4) | 406 (86.8) | 1.799
(1.269–2.551) | 0.001a | 197 (86.8) | 1.804
(1.156–2.816) | 0.009a | 209 (86.7) | 1.795
(1.162–2.772) | 0.008a |
| Allele |
| G | 396 (44.0) | 349 (37.3) | 1.00 | | 172 (37.9) | 1.00 | | 117 (36.7) | 1.00 | |
| C | 504 (56.0) | 587 (62.7) | 1.322
(1.096–1.593) | 0.003a | 282 (62.1) | 1.288
(1.023–1.623) | 0.032a | 305 (63.3) | 1.354
(1.079–1.699) | 0.009a |
| mir-196a
rs11614913 |
| Genotype |
| TT | 135 (30.0) | 137 (29.3) | 1.00 | | 71 (31.3) | 1.00 | | 66 (27.4) | 1.00 | |
| CT | 213 (47.3) | 214 (45.7) | 0.990
(0.730–1.342) | 0.948 | 106 (46.7) | 0.946
(0.654–1.370) | 0.770 | 108 (44.8) | 1.037
(0.713–1.508) | 0.849 |
| CC | 102 (22.7) | 117 (25.0) | 1.130
(0.791–1.614) | 0.500 | 50 (22.0) | 0.932
(0.598–1.453) | 0.756 | 67 (27.8) | 1.344
(0.877–2.058) | 0.174 |
| Additive | | | 1.059
(0.887–1.265) | 0.525 | | 0.964
(0.773–1.202) | 0.745 | | 1.156
(0.933–1.4330 | 0.184 |
| Dominant |
| CT+TT | 348 (77.3) | 351 (75.0) | 1.00 | | 177 (78.0) | 1.00 | | 174 (72.2) | 1.00 | |
| CC | 102 (22.7) | 117 (25.0) | 1.137
(0.839–1.541) | 0.407 | 50 (22.0) | 0.964
(0.657–1.415) | 0.851 | 67 (27.8) | 1.314
(0.918–1.879) | 0.135 |
| Recessive |
| TT | 135 (30.0) | 137 (29.3) | 1.00 | | 71 (31.3) | 1.00 | | 66 (27.4) | 1.00 | |
| CC+CT | 315 (70.0) | 331(70.7) | 0.942
(0.667–1.330) | 0.733 | 156 (68.7) | 0.942
(0.667–1.330) | 0.733 | 175 (72.4) | 1.136
(0.803–1.609) | 0.471 |
| Allele |
| T | 483 (53.7) | 488 (52.1) | 1.00 | | 248 (54.6) | 1.00 | | 240 (49.8) | 1.00 | |
| C | 417 (46.3) | 448 (47.9) | 1.063
(0.885–1.277) | 0.512 | 206 (45.4) | 0.960
(0.756–1.204) | 0.725 | 242 (50.2) | 1.166
(0.934–1.454) | 0.175 |
| mir-499
rs3746444 |
| Genotype |
| AA | 339 (75.3) | 357 (76.3) | 1.00 | | 172 (75.8) | 1.00 | | 185 (76.8) | 1.00 | |
| AG | 105 (23.3) | 105 (22.4) | 0.950
(0.697–1.293) | 0.743 | 51 (22.5) | 0.957
(0.654–1.402) | 0.823 | 54 (22.4) | 0.942
(0.648–1.370) | 0.756 |
| GG | 6 (1.4) | 6 (1.3) | 0.950
(0.303–2.973) | 0.929 | 4 (1.7) | 1.314
(0.366–4.718) | 0.675 | 2 (0.8) | 0.611
(0.122–3.057) | 0.548 |
| Additive | | | 0.955
(0.723–1.261) | 0.745 | | 1.000
(0.712–1.403) | 0.998 | | 0.912
(0.647–1.2850 | 0.599 |
| Dominant |
| AA | 339 (75.3) | 357 (76.3) | 1.00 | | 172 (75.8) | 1.00 | | 185 (76.8) | 1.00 | |
| AG+GG | 111 (24.7) | 111 (23.7) | 0.950
(0.702–1.285) | 0.737 | 55 (24.2) | 0.977
(0.673–1.416) | 0.901 | 56 (23.2) | 0.924
(0.640–1.335) | 0.676 |
| Recessive |
| AA+AG | 444 (98.6) | 462 (98.7) | 1.00 | | 223 (98.3) | 1.00 | | 239 (99.2) | 1.00 | |
| GG | 6 (1.4) | 6 (1.3) | 0.961
(0.308–3.002) | 0.945 | 4 (1.7) | 1.327
(0.371–4.752) | 0.663 | 2 (0.8) | 0.619
(0.124–3.092) | 0.559 |
| Allele |
| A | 783 (87.0) | 819 (87.5) | 1.00 | | 395 (87.0) | 1.00 | | 424 (88.0) | 1.00 | |
| G | 117 (13.0) | 117 (12.5) | 0.956
(0.727–1.258) | 0.748 | 59 (13.0) | 1.000
(0.715–1.398) | 0.998 | 58 (12.0) | 0.915
(0.654–1.281) | 0.607 |
| mir-149
rs2292832 |
| Genotype |
| CC | 50 (11.1) | 39 (8.3) | 1.00 | | 22 (9.7) | 1.00 | | 17 (7.1) | 1.00 | |
| CT | 176 (39.1) | 164 (35.0) | 1.208
(0.755–1.933) | 0.430 | 84 (37.0) | 1.097
(0.624–1.930) | 1.097 | 80 (33.2) | 1.352
(0.734–2.490) | 0.333 |
| TT | 224 (49.8) | 265 (56.7) | 1.517
(0.962–2.390) | 0.073 | 121 (53.3) | 1.228
(0.710–2.124) | 0.463 | 144 (59.7) | 1.891
(1.049–3.407) | 0.034a |
| Additive | | | 1.240
(1.019–1.509) | 0.032a | | 1.112
(0.875–1.412) | 0.385 | | 1.385
(1.084–1.769) | 0.009a |
| Dominant |
| CC | | 39 (8.3) | 1.00 | | 22 (9.7) | 1.00 | | 17 (7.1) | 1.00 | |
| CT+TT | | 429 (91.7) | 1.382
(0.890–2.147) | 0.150 | 205 (90.3) | 1.171
(0.690–1.987) | 0.559 | 224 (92.9) | 1.655
(0.932–2.939) | 0.085 |
| Recessive |
| CT+CC | | 203 (43.3) | 1.00 | | 106 (46.7) | 1.00 | | 97 (40.3) | 1.00 | |
| TT | | 265 (56.7) | 1.305
(1.006–1.693) | 0.045a | 121 (53.3) | 1.142
(0.829–1.572) | 0.417 | 144 (59.7) | 1.485
(1.081–2.039) | 0.015a |
| Allele |
| C | 276 (30.7) | 242 (25.9) | 1.00 | | 128 (28.2) | 1.00 | | 114 (23.7) | 1.00 | |
| T | 624 (69.3) | 694 (74.1) | 1.268
(1.035–1.555) | 0.022a | 326 (71.8) | 1.127
(0.878–1.445) | 0.348 | 368 (76.3) | 1.565
(1.207–2.029) | 0.001a |
Genotypic distribution in patients and
controls
Patients with IBD
As shown in Table
III, statistically significant differences were found in
mir-146a rs2910164 and mir-149 rs2292832 between the control and
IBD groups. For rs2910164 in mir-146a, logistic regression analysis
revealed that the risk of IBD was significantly increased in the GC
genotype (OR=1.743, 95% CI=1.202–2.525, P=0.003) and CC genotype
(OR=1.875, 95% CI=1.276–2.756, P=0.001), compared with the GG
genotype. In addition, a similar trend of increased risk of IBD was
detected in the recessive model, in which the GC and CC genotypes
were combined (OR=1.799, 95% CI=1.269–2.551, P=0.001). The [C]
allele was found to be associated with a significant 1.322-fold
increased risk of IBD (OR=1.322, 95% CI=1.096–1.593, P=0.003),
compared with the [G] allele, indicating that individuals carrying
the G allele may have significantly increased IBD susceptibility.
For rs2292832 in mir-149, an increased risk of IBD was detected in
the recessive model in the TT genotype (OR=1.305, 95%
CI=1.006–1.693, P=0.045), compared with the combination of the CT
and CC genotypes. The [T] allele was found to be at a significant
1.268-fold increased risk of IBD (OR=1.268, 95% CI=1.035–1.555,
P=0.022), compared with the [C] allele. These data showed that
individuals carrying the T allele may have significantly increased
IBD susceptibility. However, no associations were found between
mir-196a rs11614913 or mir-499 rs3746444 and the risk of IBD in the
allelic or genotypic analyses.
Patients with CD and controls
As shown in Table
III, a statistically significant difference in mir-146a
rs2910164 was found between the controls and patients with CD.
Logistic regression analysis revealed that the risk of CD was
significantly increased in the GC genotype (OR=1.793, 95%
CI=1.120–2.869, P=0.015) and CC genotype (OR=1.820, 95%
CI=1.117–2.965, P=0.016), compared with the GG genotype. In
addition, a similar trend of increased risk of CD was detected in
the recessive model, in which GC and CC genotypes were combined
(OR=1.804, 95% CI=1.156–2.816, P=0.009). The [C] allele was found
to be at a significant 1.288-fold increased risk of CD (OR=1.288,
95% CI=1.023–1.623, P=0.032), compared with the [G] allele,
indicating that individuals carrying the G allele may have
significantly increased CD susceptibility.
Patients with UC and controls
As shown in Table
III, there were statistical significances in mir-146a rs2910164
and mir-149 rs2292832 between the controls and patients with UC.
For rs2910164 in mir-146a, logistic regression analysis revealed
that the risk of UC was significantly increased in the GC genotype
(OR=1.696, 95% CI=1.069–2.689, P=0.025) and the CC genotype
(OR=1.927, 95% CI=1.119–3.097, P=0.007), compared with the GG
genotype. In addition, a similar trend of increased risk of UC was
detected in the recessive model, in which GC and CC genotypes were
combined (OR=795, 95% CI=1.162–2.772, P=0.008). The [C] allele was
found to be at a significant 1.354-fold increased risk of UC
(OR=1.354, 95% CI=1.079–1.699, P=0.009), compared with the [G]
allele, indicating that individuals carrying the G allele may have
significantly increased UC susceptibility. For rs2292832 in
mir-149, logistic regression analysis revealed that the risk of UC
was significantly increased in the TT genotype (OR=1.891, 95%
CI=1.049–3.407, P=0.034), compared with the CC genotype. Increased
risk of IBD was detected in the recessive model in the TT genotype
(OR=1.485, 95% CI=1.081–2.039, P=0.015), compared with combination
of the CT and CC genotypes. The [T] allele was found to be at a
significant 1.565-fold increased risk of UC (OR=1.565,
95%CI=1.207–2.029, P=0.001), compared with the [C] allele,
indicating that individuals carrying the T allele may have
significantly increased UC susceptibility.
Association between the clinical data
and mir-146a rs2910164 and mir-149 rs2292832 polymorphisms
To establish whether the investigated SNPs were
associated with specific disease phenotype, the present study
analyzed the association of genotypes with gender, location of CD,
behavior of CD, extent of UC, severity of UC and smoking habits. As
shown in Table IV, no
statistically significant differences were found between the
clinical characteristics and the mir-146a rs2910164 and mir-149
rs2292832 polymorphisms (P>0.05).
| Table IVCorrelation between mir-146a
rs2910164 and mir-149 rs2292832, and clinical characteristics in
patients with CD and UC. |
Table IV
Correlation between mir-146a
rs2910164 and mir-149 rs2292832, and clinical characteristics in
patients with CD and UC.
| Characteristic | mir-146a rs2910164
| mir-149 rs2292832
|
|---|
CD (n=227)
| UC (n=241)
| CD (n=227)
| UC (n=241)
|
|---|
| GG (n=30) | GC (n=112) | CC (n=85) | GG (n=32) | GC (n=113) | CC (n=96) | CC (n=22) | CT (n=84) | TT (n=121) | CC (n=17) | CT (n=80) | TT (n=144) |
|---|
| Gender, n (%) | | | | | | | | | | | | |
| Male | 15 (50.0) | 61 (54.5) | 42 (49.4) | 17 (53.1) | 59 (52.2) | 52 (54.2) | 14 (58.3) | 48 (55.8) | 56 (47.9) | 6 (54.5) | 40 (54.1) | 82 (52.6) |
| Female | 15 (50.0) | 51 (45.5) | 43 (50.6) | 15 (46.9) | 54 (47.8) | 44 (45.8) | 8 (41.7) | 36 (44.2) | 65 (52.1) | 11 (45.5) | 46 (45.9) | 62 (47.4) |
| Location of CD, n
(%) |
| Ileum | 12 (40.0) | 38 (33.9) | 34 (40.0) | | | | 9 (40.9) | 33 (39.3) | 42 (34.7) | | | |
| Colon | 7 (23.3) | 34 (30.4) | 20 (23.5) | | | | 7 (31.8) | 22 (26.2) | 32 (26.4) | | | |
| Ileocolon | 11 (36.7) | 40 (35.7) | 31 (36.5) | | | | 6 (27.3) | 29 (34.5) | 47 (38.9) | | | |
| Behavior of CD, n
(%) |
| Inflammatory | 21 (70.0) | 76 (67.9) | 54 (63.5) | | | | 13 (59.1) | 59 (70.2) | 79 (65.3) | | | |
| Stricturing | 7 (23.3) | 27 (24.1) | 22 (25.9) | | | | 8 (36.4) | 22 (26.2) | 26 (21.5) | | | |
| Penetrating | 2 (6.7) | 9 (8.0) | 9 (10.6) | | | | 1 (4.5) | 3 (3.6) | 16 (13.2) | | | |
| Extent of UC, n
(%) |
| Ulcerative
proctitis | | | | 4 (12.5) | 16 (14.2) | 11 (11.5) | | | | 3 (17.6) | 12 (15.0) | 17 (11.8) |
| Left sided UC | | | | 16 (50.0) | 52 (46.0) | 41 (42.7) | | | | 8 (47.1) | 37 (46.2) | 64 (44.4) |
| Extensive UC | | | | 12 (37.5) | 45 (39.8) | 44 (45.8) | | | | 6 (35.3) | 31 (38.8) | 63 (43.8) |
| Severity of UC, n
(%) |
| Clinical
remission | | | | 5 (15.6) | 20 (17.7) | 18 (18.8) | | | | 3 (17.6) | 15 (18.8) | 25 (17.4) |
| Mild UC | | | | 5 (15.6) | 19 (16.8) | 17 (17.7) | | | | 3 (17.6) | 12 (15.0) | 26 (18.2) |
| Moderate UC | | | | 16 (50.0) | 55 (48.7) | 47 (49.0) | | | | 9 (52.9) | 41 (51.2) | 68 (47.2) |
| Severe UC | | | | 6 (18.8) | 19 (16.8) | 14 (14.5) | | | | 2 (11.9) | 12 (15.0) | 25 (17.4) |
| Smoking, n
(%) | 6 (20.0) | 26 (23.2) | 19 (22.4) | 7 (21.9) | 25 (22.1) | 25 (26.0) | 5 (22.7) | 21 (25.0) | 25 (20.7) | 2 (11.8) | 19 (23.7) | 36 (25.0) |
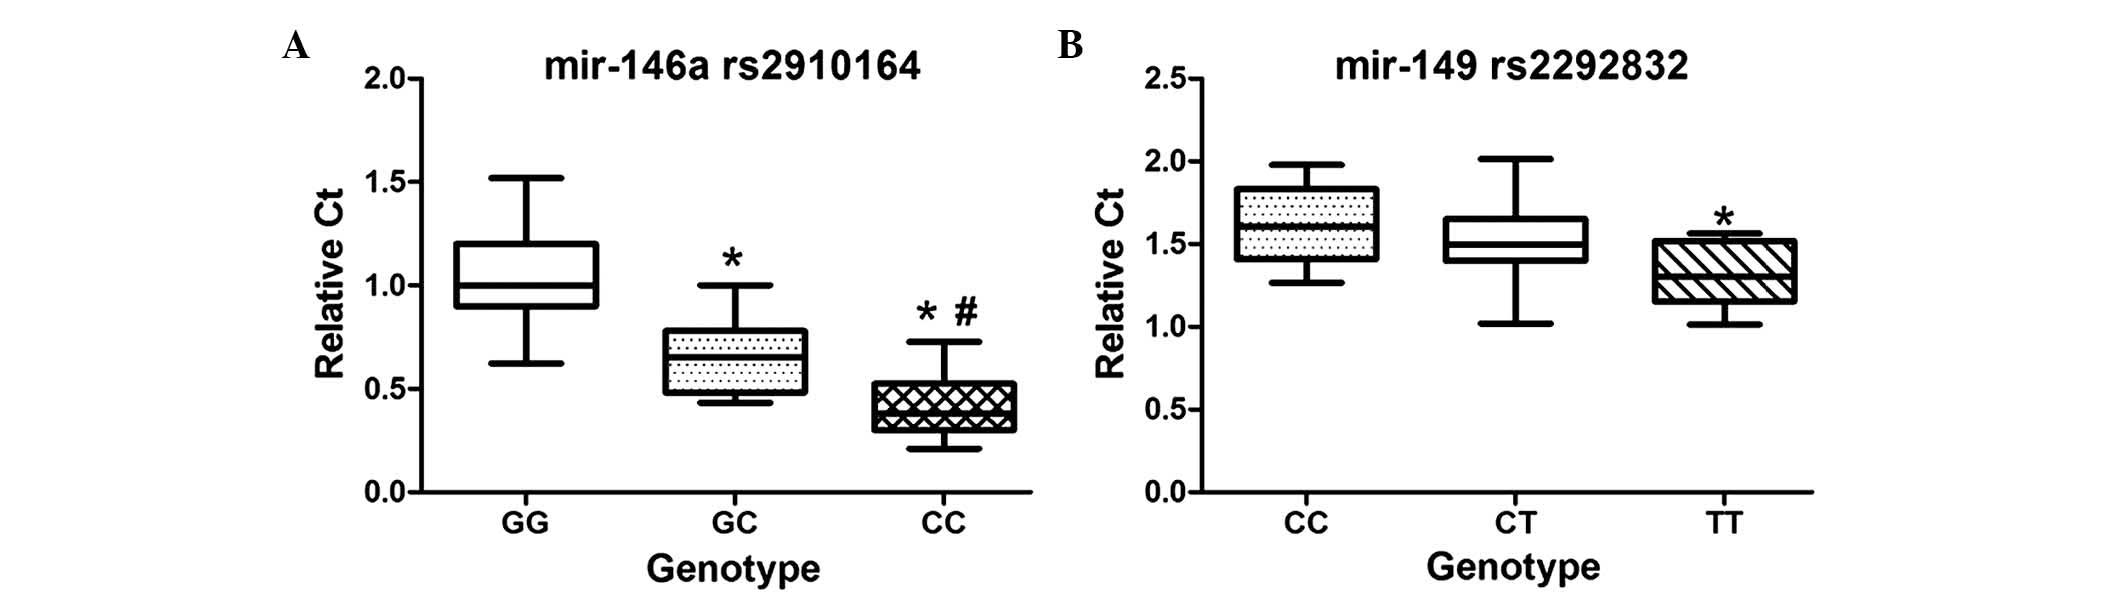
Association between miRNA polymorphism
and miRNA expression levels
To further investigate the functional relevance of
the miRNA polymorphisms, the present study compared between the
genotypes and the expression levels of mir-146a and mir-149 (10
patients for each genotype). As shown in Fig. 1, the mean expression level of
mir-146a in the CC and GC genotypes were lower, compared with that
of the GG genotype (P=0.000 and P=0.003, respectively). The mean
expression level of mir-149 in the TT genotype was lower, compared
with that in the CC genotype (P=0.010).
Association between mir-RNAs
polymorphisms and the risk of IBD-CRC
Among the patients with IBD enrolled in the present
study, 42 patients, including 12 patients with CD and 30 patients
with UC, developed IBD-CRC. The male:female ratio was 1.33 [24:18
patients]. The mean age of diagnosis with IBD-CRC was 48.2±8.7
years, the mean duration between age at diagnosed of IBD and age at
diagnosis with IBD-CRC was 22.7±10.1 years. In order to identify
the association between mirRNA polymorphisms and the risk of
IBD-CRC, the present study performed analyses among the patients
with IBD-CRC, 100 gender and age matched healthy individuals, and
100 patients with IBD, whose gender ratio, age and follow-up
duration were matched with those of the patients with IBD-CRC. As
shown in Table V, for mir-196a
rs11614913, the risk of IBD-CRC was significantly increased in the
CC genotype (OR=2.887, 95% CI=1.054–7.908, P=0.039), compared with
the TT genotype. In the dominant model, the CC genotype had a
higher risk of IBD-CRC (OR=2.625, 95% CI=1.139–6.051, P=0.024),
compared with the combination of the CT and TT genotypes.
Therefore, the [C] allele may be at higher risk of IBD-CRC
(OR=1.706, 95% CI=1.021–2.852, P=0.041).
| Table VAssociation between single nucleotide
polymorphisms in microRNAs and the risk of IBD associated CRC. |
Table V
Association between single nucleotide
polymorphisms in microRNAs and the risk of IBD associated CRC.
| Genotype | Healthy control
(n=100) n (%) | IBD control(n=100)
n (%) | CRC (n=42) n
(%) | OR (95 CI) (CRC,
vs. healthy control) | P value (CRC, vs.
healthy control) | OR (95 CI) (CRC,
vs. IBD control) | P value (CRC, vs.
IBD control) |
|---|
| mir-146a
rs2910164 |
| Genotype |
| GG | 23 (23.0) | 14 (14.0) | 6 (14.2) | 1.00 | | 1.00 | |
| GC | 45 (45.0) | 48 (48.0) | 18 (42.9) | 1.533
(0.536–4.389) | 0.426 | 0.875
(0.292–2.626) | 0.812 |
| CC | 32 (32.0) | 38 (38.0) | 18 (42.9) | 2.156
(0.741–6.274) | 0.159 | 1.105
(0.365–3.349) | 0.860 |
| Additive | | | | 1.539
(0.918–2.580) | 0.102 | 1.103
(0.650–1.870) | 0.717 |
| Dominant |
| GC+GG | 48 (68.0) | 62 (62.0) | 24 (57.1) | 1.00 | | 1.00 | |
| CC | 32 (32.0) | 38 (38.0) | 18 (42.9) | 1.594
(0.759–3.346) | 0.218 | 1.224
(0.588–2.546) | 0.589 |
| Recessive |
| GG | 23 (23.0) | 14 (14.0) | 6 (14.2) | 1.00 | | 1.00 | |
| CC+GC | 77 (77.0) | 86 (86.0) | 36 (85.8) | 1.792
(0.671–4.784) | 0.244 | 0.977
(0.348–2.743) | 0.964 |
| Allele |
| G | 91 (45.4) | 76 (38.0) | 30 (35.7) | 1.00 | | 1.00 | |
| C | 109 (54.5) | 124 (62.0) | 54 (64.3) | 1.555
(0.915–2.642) | 0.103 | 1.103
(0.649–1.874) | 0.716 |
| mir-196a
rs11614913 |
| Genotype |
| TT | 33 (33.0) | 34 (34.0) | 10 (23.8) | 1.00 | | 1.00 | |
| CT | 51 (51.0) | 48 (48.0) | 18 (42.9) | 1.165
(0.479–2.8320 | 0.737 | 1.275
(0.542–3.102) | 0.592 |
| CC | 16 (16.0) | 18 (18.0) | 14 (33.3) | 2.887
(1.054–7.908) | 0.039a | 2.644
(0.980–7.134) | 0.055 |
| Additive | | | | 1.702
(1.012–2.861) | 0.045a | 1.630
(0.982–2.706) | 0.059 |
| Dominant |
| CT+TT | 84 (84.0) | 82 (82.0) | | 1.00 | | 1.00 | |
| CC | 16 (16.0) | 18 (18.0) | | 2.625
(1.139–6.051) | 0.024a | 2.278
(1.004–5.170) | 0.049a |
| Recessive |
| TT | 33 (33.0) | 34 (34.0) | | 1.00 | | 1.00 | |
| CC+CT | 67 (67.0) | 66 (66.0) | | 1.576
(0.692–3.591) | 0.279 | 1.648
(0.725–3.750) | 0.233 |
| Allele |
| T | 117 (58.5) | 116 (58.0) | 38 (45.2) | 1.00 | | 1.00 | |
| C | 83 (41.5) | 84 (42.0) | 46 (54.8) | 1.706
(1.021–2.852) | 0.041a | 1.672
(1.001–2.793) | 0.050 |
| mir-499
rs3746444 |
| Genotype |
| AA | 73 (73.0) | 76 (76.0) | 30 (71.4) | 1.00 | | 1.00 | |
| AG | 25 (25.0) | 22 (22.0) | 11 (26.2) | 1.071
(0.468–2.447) | 0.871 | 1.267
(0.483–3.318) | 0.630 |
| GG | 2 (2.0) | 2 (2.0) | 1 (2.4) | 1.217
(0.106–13.928) | 0.875 | 1.267
(0.076–21.099) | 0.869 |
| Additive | | | | 1.080
(0.530–2.203) | 0.832 | 1.222
(0.535–2.791) | 0.634 |
| Dominant |
| AA | 73 (73.0) | 76 (76.0) | 30 (71.4) | 1.00 | | 1.00 | |
| AG+GG | 27 (27.0) | 24 (24.0) | 12 (28.6) | 1.081
(0.485–2.411) | 0.848 | 1.081
(0.485–2.411) | 0.848 |
| Recessive |
| AA+AG | 98 (98.0) | 98 (98.0) | 41 (97.6) | 1.00 | | 1.00 | |
| GG | 2 (2.0) | 2 (2.0) | 1 (2.4) | 1.195
(0.105–13.548) | 0.886 | 1.195
(0.072–19.706) | 0.901 |
| Allele |
| A | 171 (85.5) | 87 (87.0) | 71 (84.5) | 1.00 | | 1.00 | |
| G | 29 (14.5) | 13 (13.0) | 13 (15.5) | 1.080
(0.531–2.197) | 0.833 | 1.225
(0.534–2.811) | 0.631 |
| mir-149
rs2292832 |
| Genotype |
| CC | 12 (12.0) | 8 (8.0) | 3 (7.1) | 1.00 | | 1.00 | |
| CT | 40 (40.0) | 34 (34.0) | 16 (38.1) | 1.600
(0.398–6.434) | 0.508 | 1.225
(0.293–5.371) | 0.760 |
| TT | 48 (48.0) | 58 (58.0) | 23 (54.8) | 1.917
(0.492–7.462) | 0.348 | 1.057
(0.258–4.340) | 0.938 |
| Additive | | | | 1.305
(0.749–2.273) | 0.348 | 0.934
(0.537–1.656) | 0.839 |
| Dominant |
| CC | 12 (12.0) | 8 (8.0) | 3 (7.1) | 1.00 | | 1.00 | |
| CT+TT | 88 (88.0) | 92 (92.0) | 39 (92.9) | 1.773
(0.473–6.637) | 0.395 | 1.130
(0.285–4.488) | 0.862 |
| Recessive |
| CT+CC | 52 (52.0) | 42 (42.0) | 19 (45.2) | 1.00 | | 1.00 | |
| TT | 48 (48.0) | 58 (58.0) | 23 (54.8) | 1.311
(0.636–2.703) | 0.463 | 0.877
(0.424–1.812) | 0.722 |
| Allele |
| C | 64 (32.0) | 50 (25.0) | 22 (26.2) | 1.00 | | 1.00 | |
| T | 136 (68.0) | 150 (75.0) | 62 (73.8) | 1.326
(0.750–2.345) | 0.332 | 0.939
(0.525–1.681) | 0.833 |
Discussion
The present study involved two innovative aspects.
First, it was the first investigation, to the best of our
knowledge, of the effects of four common polymorphisms (rs2910164,
rs11614913, rs3746444 and rs2292832) in pre miRNAs mir-146a,
mir-196a, mir-499 and mir-149, respectively, on the risk of
occurrence of IBD. The results revealed statistically significant
differences in mir-146a rs2910164 and mir-149 rs2292832 between the
healthy control and IBD groups, and the SNPs in mir-146a and
mir-149 decreased the expression levels of mature miRNA. Second,
the association between these polymorphisms with the risk of
IBD-CRC was examined, which revealed that mir-196a rs11614913 may
be associated with the risk of IBD-CRC.
miRNAs are a class of endogenous, small, single
stranded, non-coding RNAs, which have emerged as key regulators of
fundamental biological processes, including cell proliferation and
differentiation, DNA repair and the immune response, via
controlling the expression levels of >30% of human genes
(22). miRNAs are initially
transcribed as pri-miRNAs with several hundred nucleotides, which
are further cleaved by nuclear Drosha into 60–70 nucleotide hairpin
structured pre miRNAs. Pre-miRNAs are exported to the cytoplasm by
Exportin 5 and are further processed into mature miRNAs. Mature
miRNAs consist of ~22 nucleotides (1). To date, >1,000 miRNAs have been
detected in humans, each of which may regulate multiple genes
(23). Physiologically, miRNAs act
as post transcriptional regulators by complimentary binding to the
3′ untranslated regions of target messenger RNA transcripts,
leading to mRNA degradation or translational repression, and
consequently to the downregulation of protein expression (2,20).
miRNAs are considered to be key in the regulation of several
biological processes, as well as in the induction of inflammatory
and autoimmune diseases (24,25).
Genetic mutations located with its mature sequence or within the
'seed' region may alter its normal function, leading to a
pathological process. In previous years, several studies have
indicated that polymorphisms in miRNA are associated with a number
of diseases (16,18). Therefore, the present study
hypothesized that there is an association between the four common
polymorphisms in pri-miRNAs and the risk of IBD and potentially
IBD-CRC.
In the present study, statistically significant
differences were found in mir-146a rs2910164 and mir-149 rs2292832
between the control and IBD groups. For rs2910164 in mir-146a, the
risk of IBD was significantly increased in the GC and CC genotypes,
compared with the GG genotype. A similar trend of increased risk of
IBD was detected in the recessive model, the [C] allele was found
to be at a significant 1.322-fold increased risk of IBD, compared
with the [G] allele, indicating that individuals carrying the G
allele may have significantly increased IBD susceptibility. In
addition, the patients with IBD with the CC or GC genotypes showed
lower expression levels of mir-146a in the PBMCs, compared with
those with the GG genotype. Previous studies have shown that miRNAs
are important in the development of cells of the innate and
adaptive immune system, and in regulating an immune response
(26). Macrophages and dendritic
cells recognize pathogens via pattern recognition receptors, among
which Toll like receptors (TLR) lead to downstream activation of
signal transduction pathways and the regulation of inflammatory
cytokines (27). The expression of
mir-146a can be induced by exposure to lipopolysaccharide,
peptidoglycan and flagellin trough TLR ligands (13). Of note, mir-146a is known to be a
nuclear factor (NF)κB dependent gene and reduces the expression of
TNF receptor associated factor 6 and IL 1 receptor (ILR) associated
kinase 1, which are two target genes of the TLR signaling cascade,
thus prevent excess inflammation (28). Therefore, the [C] allele associated
reduced expression of mir-146a may affect the negative feedback
signaling pathway and contribute to the enhancement of
inflammation, which may be associated with the high risk of IBD. In
the present study, a difference in the genotypic distribution of
mir-149 rs2292832 was found between the control and IBD groups. The
[T] allele was found to be at a significant 1.268 fold increased
risk of IBD (OR=1.268, 95%CI=1.035–1.555, P=0.022), compared with
the [C] allele. In addition, the IBD patients carrying the [T]
allele had lower expression levels of mir-149. A previous study
reported that mir-149 negatively regulates ILR triggered
inflammatory cytokine production, possibly through a mechanism
directly targeting MyD88, involved in the TLR/NF-κB pathway
(29), thus lower expression
levels of mir-149 decrease the negative regulation of ILR triggered
inflammation.
The present study also analyzed the association
between the miRNA SNPs and the risk of IBD-CRC. In comparing
between the healthy controls and patients with IBD-CRC, the data
showed that, in mir-196a rs11614913, the risk of IBD-CRC was
significantly increased in the CC genotype (OR=2.887, 95%
CI=1.054–7.908, P=0.039), compared with the TT genotype. In the
dominant model, individuals with the CC genotype had a high risk of
IBD-CRC (OR=2.625, 95% CI=1.139–6.051, P=0.024), compared with the
combination of the CT and TT genotypes. The [C] allele may be
associated with a high risk of IBD-CRC (OR=1.706, 95%
CI=1.021–2.852, P=0.041). The analysis between the IBD case
controls and patients with IBD-CRC indicated that the CC genotype
had a 2.278 fold increased risk of IBD-CRC (OR=2.278, 95%
CI=1.004–5.170, P=0.049), compared with the combination of CT and
TT genotypes. Several previous studies have suggested that the
mir-149 rs2292832 polymorphism is associated with a significantly
increased susceptibility of CRC in the TT genotype, compared with
the TC and TC/CC genotypes (30).
Xu et al (31) demonstrated
that mir-149 is epigenetically silenced in CRC, and the
downregulation of mir-149 is associated with hypermethylation of
the neighboring CpG island. mRNA for Specificity protein 1, a
potential oncogenic protein, was also identified as a target of
mir-149. In addition, it has been reported that the target genes of
mir-149, Akt 1 and E2F1, are involved in promoting cell growth and
cell cycle progression (31–33).
Thus, the present study hypothesized that there was an association
between the mir-149 rs2292832 polymorphism and the risk of
IBD-CRC.
In conclusion, the results of the present study
suggested that mir-146a rs2910164 and mir-149 rs2292832 were
associated with an increased risk of IBD in the Chinese population
examined. In addition, an association was identifed between
mir-196a rs11614913 and the risk of progression of IBD-CRC. As the
number of patients with IBD-CRC was limited in the present study, a
large sample size is required for further investigation. Based on
the results in the current study, in clinical practice, testing for
pre-miRNAs polymorphisms may help predict the occurrence of IBD and
IBD-CRC, which would help physicians to make early measures for
patients. For example, for patients with IBD and the CC genotype in
mir-149 rs2292832, regular colonoscopy is necessary to detect early
stages of pre-cancerous lesions.
Acknowledgments
This study was supported by the Clinical Research
Support Foundation of Chinese PLA General Hospital (Beijing, China)
(grant no. 2012FC-TSYS 3011).
References
|
1
|
Landgraf P, Rusu M, Sheridan R, Sewer A,
Iovino N, Aravin A, Pfeffer S, Rice A, Kamphorst AO, Landthaler M,
et al: A mammalian microRNA expression atlas based on small RNA
library sequencing. Cell. 129:1401–1414. 2007. View Article : Google Scholar : PubMed/NCBI
|
|
2
|
Bartel DP: MicroRNAs: Genomics,
biogenesis, mechanism and function. Cell. 116:281–297. 2004.
View Article : Google Scholar : PubMed/NCBI
|
|
3
|
Griffiths Jones S, Grocock RJ, van Dongen
S, Bateman A and Enright AJ: miRBase: MicroRNA sequences, targets
and gene nomenclature. Nucleic Acids Res. 34:D140–D144. 2006.
View Article : Google Scholar :
|
|
4
|
Esquela Kerscher A and Slack FJ: Oncomirs
microRNAs with a role in cancer. Nat Rev Cancer. 6:259–269. 2006.
View Article : Google Scholar
|
|
5
|
Xavier RJ and Podolsky DK: Unravelling the
pathogenesis of inflammatory bowel disease. Nature. 448:427–434.
2007. View Article : Google Scholar : PubMed/NCBI
|
|
6
|
Mattar MC, Lough D, Pishvaian MJ and
Charabaty A: Current management of inflammatory bowel disease and
colorectal cancer. Gastrointest Cancer Res. 4:53–61.
2011.PubMed/NCBI
|
|
7
|
Shanahan F: Probiotics and inflammatory
bowel disease: Is there a scientific rationale? Inflamm Bowel Dis.
6:107–115. 2000. View Article : Google Scholar : PubMed/NCBI
|
|
8
|
Vermeire S and Rutgeerts P: Current status
of genetics research in inflammatory bowel disease. Genes Immun.
6:637–645. 2005.PubMed/NCBI
|
|
9
|
Duerr RH, Taylor KD, Brant SR, Rioux JD,
Silverberg MS, Daly MJ, Steinhart AH, Abraham C, Regueiro M,
Griffiths A, et al: A genome-wide association study identifies
IL23R as an inflammatory bowel disease gene. Science.
314:1461–1463. 2006. View Article : Google Scholar : PubMed/NCBI
|
|
10
|
Sonkoly E, Wei T, Janson PC, Sääf A,
Lundeberg L, Tengvall Linder M, Norstedt G, Alenius H, Homey B,
Scheynius A, et al: MicroRNAs: Novel regulators involved in the
pathogenesis of psoriasis? PLoS One. 2:e6102007. View Article : Google Scholar : PubMed/NCBI
|
|
11
|
Stanczyk J, Pedrioli DM, Brentano F,
Sanchez Pernaute O, Kolling C, Gay RE, Detmar M, Gay S and Kyburz
D: Altered expression of MicroRNA in synovial fibroblasts and
synovial tissue in rheumatoid arthritis. Arthritis Rheum.
58:1001–1009. 2008. View Article : Google Scholar : PubMed/NCBI
|
|
12
|
Dai Y, Huang YS, Tang M, Lv TY, Hu CX, Tan
YH, Xu ZM and Yin YB: Microarray analysis of microRNA expression in
peripheral blood cells of systemic lupus erythematosus patients.
Lupus. 16:939–946. 2007. View Article : Google Scholar : PubMed/NCBI
|
|
13
|
Pekow JR and Kwon JH: MicroRNAs in
inflammatory bowel disease. Inflamm Bowel Dis. 18:187–193. 2012.
View Article : Google Scholar
|
|
14
|
Dalal SR and Kwon JH: The role of microRNA
in inflammatory bowel disease. Gastroenterol Hepatol. 6:714–722.
2010.
|
|
15
|
Hezova R, Kovarikova A, Bienertova Vasku
J, Sachlova M, Redova M, Vasku A, Svoboda M, Radova L, Kiss I and
Vyzula R: Evaluation of SNPs in miR-196 a2, miR-27a and miR-146a as
risk factors of colorectal cancer. World J Gastroenterol.
18:2827–2831. 2012. View Article : Google Scholar : PubMed/NCBI
|
|
16
|
Lv M, Dong W, Li L and Zhang L, Su X, Wang
L, Gao L and Zhang L: Association between genetic variants in pre
miRNA and colorectal cancer risk in a Chinese population. J Cancer
Res Clin Oncol. 139:1405–1410. 2013. View Article : Google Scholar : PubMed/NCBI
|
|
17
|
Podolsky DK: Inflammatory bowel disease. N
Engl J Med. 347:417–429. 2002. View Article : Google Scholar : PubMed/NCBI
|
|
18
|
Wan D, Gu W, Xu G, Shen C, Ding D, Shen S,
Wang S, Gong X, He S and Zhi Q: Effects of common polymorphisms
rs2910164 in miR-146a and rs11614913 in miR-196a2 on susceptibility
to colorectal cancer: A systematic review meta-analysis. Clinical
Transl Oncol. 16:792–800. 2014. View Article : Google Scholar
|
|
19
|
IBD Working Group of the European Society
for Paediatric Gastroenterology Hepatology and Nutrition:
Inflammatory bowel disease in children and adolescents.
Recommendations for diagnosis the Porto criteria. J Pediatr
Gastroenterol Nutr. 41:1–7. 2005. View Article : Google Scholar
|
|
20
|
He L and Hannon GJ: MicroRNAs: Small RNAs
with a big role in gene regulation. Nat Rev Genet. 5:522–531. 2004.
View Article : Google Scholar : PubMed/NCBI
|
|
21
|
Kang K, Peng X, Luo J and Gou D:
Identification of circulating miRNA biomarkers based on global
quantitative real time PCR profiling. J Anim Sci Biotechnol.
3:42012. View Article : Google Scholar
|
|
22
|
Lewis BP, Burge CB and Bartel DP:
Conserved seed pairing, often flanked by adenosines, indicates that
thousands of human genes are microRNA targets. Cell. 120:15–20.
2005. View Article : Google Scholar : PubMed/NCBI
|
|
23
|
Sullivan CS and Ganem D: MicroRNAs and
viral infection. Mol Cell. 20:3–7. 2005. View Article : Google Scholar : PubMed/NCBI
|
|
24
|
Ruan K, Fang X and Ouyang G: MicroRNAs:
Novel regulators in the hallmarks of human cancer. Cancer Lett.
285:116–126. 2009. View Article : Google Scholar : PubMed/NCBI
|
|
25
|
Miska EA: How microRNAs control cell
division, differentiation and death. Curr Opin Genet Dev.
15:563–568. 2005. View Article : Google Scholar : PubMed/NCBI
|
|
26
|
Lu LF and Liston A: MicroRNA in the immune
system, microRNA as an immune system. Immunology. 127:291–298.
2009. View Article : Google Scholar : PubMed/NCBI
|
|
27
|
Dunne A and O'Neill LA: Adaptor usage and
Toll like receptor signaling specificity. FEBS Lett. 579:3330–3335.
2005. View Article : Google Scholar : PubMed/NCBI
|
|
28
|
Taganov KD, Boldin MP, Chang KJ and
Baltimore D: NF kappaB dependent induction of microRNA miR-146, an
inhibitor targeted to signaling proteins of innate immune
responses. Proc Natl Acad Sci USA. 103:12481–12486. 2006.
View Article : Google Scholar
|
|
29
|
Xu G, Zhang Z, Xing Y, Wei J, Ge Z, Liu X,
Zhang Y and Huang X: MicroRNA 149 negatively regulates TLR
triggered inflammatory response in macrophages by targeting MyD88.
J Cell Biochem. 115:919–927. 2014. View Article : Google Scholar : PubMed/NCBI
|
|
30
|
Vinci S, Gelmini S, Mancini I, Malentacchi
F, Pazzagli M, Beltrami C, Pinzani P and Orlando C: Genetic and
epigenetic factors in regulation of microRNA in colorectal cancers.
Methods. 59:138–146. 2013. View Article : Google Scholar
|
|
31
|
Xu Y, Gu L, Pan Y, Li R, Gao T, Song G,
Nie Z, Chen L, Wang S and He B: Different effects of three
polymorphisms in MicroRNAs on cancer risk in Asian population:
Evidence from published literatures. PLoS One. 8:e651232013.
View Article : Google Scholar : PubMed/NCBI
|
|
32
|
Lin RJ, Lin YC and Yu AL:
miR-149* induces apoptosis by inhibiting Akt1 and E2F1
in human cancer cells. Mol Carcinog. 49:719–727. 2010.PubMed/NCBI
|
|
33
|
Du W, Ma XL, Zhao C, Liu T, Du YL, Kong
WQ, Wei BL, Yu JY, Li YY, Huang JW, et al: Associations of single
nucleotide polymorphisms in miR-146a, miR-196a, miR-149 and miR-499
with colorectal cancer susceptibility. Asian Pac J Cancer Prev.
15:1047–1055. 2014. View Article : Google Scholar : PubMed/NCBI
|