Introduction
Endometrial carcinoma (EC) is the most common type
of gynecological malignancy and are categorized as follows: Type I
EC is estrogen-dependent and often occurs in postmenopausal women,
accounting for >85% of cases, whereas type II EC is not
estrogen-dependent (1,2). In estrogen-induced endometrial
carcinogenesis, insulin-like growth factor-1 (IGF-1) has an
important role. Estrogens increase the expression of IGF-1 in
tissues, and IGF-1 is required to mediate their mitogenic effects
on the endometrium (3,4). In addition, estrogens modulate IGF-1
signaling by regulating the expression in other members of the IGF
family, including the ligands insulin receptor substrate-1 (IRS-1)
and IGF binding proteins (IGFBPs) (5). However, the exact mechanisms of
estrogen-induced EC have remained elusive.
Stimulation of uterine epithelial cell proliferation
by estradiol was indicated to be mediated by the
IGF1/IRS-1/phosphoinositide-3 kinase (PI3K)/AKT pathway, which
targets the activity of mitotic kinase cyclin-dependent kinase
(Cdk1)/cyclin B (6). Under
specific conditions, deregulation of Cdks may be essential for DNA
damage and cancer development (7).
Recently, Tang et al (8)
also demonstrated that estrogen and IGF-1 act synergistically to
promote the development of lung adenocarcinoma in mice, which may
be associated with the activation of mitogen-activated protein
kinase (MAPK) signaling pathways, in which estrogen receptors beta
1 and beta 2 as well as IGF1 receptor (IGF1R) have important
roles.
Genes encoding for the human protein IGF-1, located
in the long arm of chromosome 12 (12q22-24.1), cover an area of ~90
kbp and contain six exons separated by long (1.9–50 kbp) introns.
The sequence of the IGF-1 gene is highly conserved and its
transcription is controlled by the two promoters P1 and P2, while
it is estimated that ~90% of IGF-I transcripts are controlled by
P1. The P1 promoter region of the human genome comprises 322
nucleotides located in the 5′-untranslated region (5′UTR) and exon
1 of the regulatory region at 1,630 bp. The most highly conserved
region is a 322-nucleotide sequence in the 5′UTR. The P1 promoter
region lacks typical sequences of other genes, such as TATA or
CCAAT elements, lacking defined transcriptional start points and
also GC-rich areas or CpG islands. The P1 promoter has five
sections, HS3A, HS3B, HS3C, HS3D and HS3E, which are protected from
DNase digestion. HS3D is thought to be responsible for the
regulation of IGF-I expression by estrogens (9,10).
5′ Cytosine-adenosine (CA)n repeats in the P1 promoter
region of the IGF-I gene, 1 kb upstream of the transcription site,
are highly polymorphic microsatellites comprising a variable length
of repeat sequences. The number of CA repeats ranges between 10 and
24 with the most common allele containing 19 CA repeats (192 bp),
characteristic for Caucasian genotypes (9,11).
Numerous studies suggested that the number of CA repeats in the
promoter region is inversely correlated with the transcriptional
activity. The involvement of the polymorphism of CA promoter
dinucleotide repeats in clinical conditions, including cancer,
diabetes and cardiovascular diseases as well as parameters
including birth weight, adult body height and IGF-1 serum levels,
has remained controversial (12,13).
It is well known that IGF-1 is produced in most
organs and tissues where it can function in an autocrine as well as
a paracrine manner to stimulate cell growth. However, the liver is
the major source of circulating IGFs. The activity of IGF-1 is
mediated through IGF1R, a tyrosine kinase receptor that can bind to
IGF-1 and IGF-2 to initiate activation of two principal downstream
signaling pathways, including the Ras-Raf-extracellular
signal-regulated kinase signaling pathway, the PI3K/Akt and the
MAPK signaling pathway. The MAPK signaling pathway is primarily
responsible for cell growth and proliferation (14).
The bioavailability of IGF-1 is regulated by the
circulating concentration and cellular expression of six IGFBPs,
which are expressed in human endometrium. Among them, IGFBP-1 has
the highest abundance and competes with type I IGF receptor for
binding of IGF in the endometrium. Due to its high affinity, the
majority of IGF-1 circulates in a complex with IGFBP-3 and IGFBP-1
(15).
To the best of our knowledge, microsatellite
polymorphisms in the P1 promoter region of the IGF-1 gene have not
been previously studied in human EC. The present study investigated
the correlation between the circulating levels of IGF-1, IGFBP-1,
IGFBP-3 and estrogens in various types of microsatellite
polymorphism in the P1 promoter region of the IGF-1 gene in
patients with EC.
Materials and methods
Ethics statements
The study was approved by the Ethics Committee of
the Medical University of Lublin (Lublin, Poland; Resolution of the
Bioethics Comittee no. 0254/263/2011). Written informed consent was
obtained from all subjects included, and the study was performed in
accordance with the principles of the Helsinki Declaration.
Patient samples
Patient samples used for the assessment of IGF-1
levels as well as CA repeat analysis of the P1 promoter region of
the IGF-1 gene comprised: i) Peripheral blood obtained from the
antecubital vein prior to surgery from 82 patients enrolled in the
present study and ii) tissue sections embedded in paraffin
(Sigma-Aldrich, St. Louis, MO, USA) from patients who underwent
surgery at the Department of Gynecological Oncology and Gynecology,
Medical University of Lublin (Lublin, Poland) between November 2010
and December 2014.
A total of 33 tissue samples were taken from
post-menopausal women with type I EC [endometroid type
adenocarcinoma; G2 stage according to the International Federation
of Gynecology and Obstetrics (FIGO) criteria from 2009 (16)]. The number of samples classified as
FIGO stages Ia, Ib, II and IIIb were 12 (37.5%), 12 (37.5%), 4
(12.5%) and 4 (12.5%), respectively. Diagnosis was performed
histologically by two independent pathologists. Furthermore, tissue
samples from 32 post-menopausal women with hyperplasia simplex (HS;
non-atypical) were used. The control group consisted of endometrial
tissue samples from 27 patients referred to the department for
diagnostic procedures of uterine bleeding in which
histopathological examination found endometrium proliferativum.
Patients with hormone replacement therapy, other types of cancer,
systemic diseases, ischemic heart disease, peripheral vascular
diseases, thyroid diseases and/or other endocrine diseases as well
as liver and bile duct diseases were excluded from the study. The
average age of the patients with EC was 64 years. The mean age in
the groups of patients with EC and HS was higher than that in the
control group (64.2 years [range, 56–78 years] and 62.8 years
[range, 50–71 years] vs. 60.1 years [range, 47–68 years],
respectively; P=0.01.
Enzyme-linked immunosorbent assay
(ELISA)
ELISA was used to assess the plasma levels of IGF-1,
IGFBP-1, IGFBP-3, estrone, estriol and estradiol using the
following kits: Human IGF-I Quantikine ELISA kit (cat. no. DG100;
R&D Systems, Minneapolis, MN, USA), IGFBP-1 ELISA kit (cat. no.
DEE001; Demeditec Diagnostics GmbH; Kiel-Wellsee, Germany), human
Insulin-like Growth Factor Binding Protein-3 ELISA kit (cat. no.
E03A; Mediagnost, Reutlingen, Germany), Estrone ELISA kit (cat. no.
EIA-4174), Estriol ELISA kit (cat. no. EIA-3717) and Estradiol
ELISA kit (cat. no. EIA-2693) (all from DRG Instruments GmbH,
Marburg, Germany) according to the manufacturer's instructions.
DNA isolation from peripheral blood
cells
DNA was isolated from peripheral blood cells using
the QIAamp DNA mini kit (cat. no. 51306; Qiagen, Hilden,
Germany).
DNA isolation from paraffin-embedded
tissue sections
Paraffin-embedded tissue blocks fixed in 10%
buffered formalin (Sigma-Aldrich) were cut into two or three
4-µm sections using a microtome (model SM 2000R; Leica
Biosystems GmbH, Nussloch, Germany) with a razor blade (Feather
Microtome Blade Type R35; Feather Safety Razor Co., Ltd., Osaka,
Japan), which was cleaned with ethanol between samples. A fresh
cutting blade was used for the cutting of each of the paraffin
blocks. The sections obtained were placed in a 1.5-ml test tube
containing polypropylene (Sigma-Aldrich) and stored at 4°C for
future analysis.
The isolation of DNA from archived paraffin tissues
was performed using a Maxwell® 16 Instrument for Nucleic
Acid and Protein Purification device (cat. no. AS1250; Promega
Corp., Madison, WI, USA) equipped with its designated software for
automated DNA isolation with use of the Maxwell 16 FFPE Plus LEV
DNA Purification kit (cat. no. AS1135; Promega Corp.). Quantitative
analysis of the DNA obtained was performed using a Novaspec II
automatic spectrophotometer (GE Healthcare, Little Chalfont, UK).
The resulting DNA was used as template for polymerase chain
reaction (PCR) amplification followed by analysis of CA repeats in
the P1 promoter region of the IGF-1 gene.
Analysis of CA repeats in the P1 region
of IGF-1
Analysis of (CA)n repeats of the IGF-1
gene located 1 kb upstream of the transcription start site was
performed using PCR and fragment analysis. PCR was performed in
15-µl volumes consisting of 100 ng genomic DNA, 3.75 pmol
forward primer (5′-AAGAAAACACACTCTGGCAC-3′) fluorescently labeled
with FAM (Polish Academy of Science, Warsaw, Poland), 3.75 pmol
reverse primer (5′-ACCACTCTGGGAGAAGGGTA-3′; Roche Diagnostics,
Mannheim, Germany), 0.01 mM deoxynucleotide triphosphate (Polish
Academy of Science), 1.5 mM MgCl2 (Fermentas, Poznan
Poland), 1X PCR buffer (Fermentas) and 0.6U HiFi DNA polymerase
(cat. no. N1003 05; Novazym, Poznan, Poland). The analysis was
performed using a thermal cycler (Tgradient Thermocycler, Biometra,
Goettingen, Germany). Amplification cycles included one cycle of 4
min at 94°C; 28 PCR cycles consisting of 5 sec at 94°C
(denaturation), 30 sec at 60°C (annealing) and 1 min at 72°C
(elongation), and a final 30-min elongation step at 65°C. PCR
product size analysis was performed on an automated ABI 3130
sequencer camera XL (Applied Biosystems, Thermo Fisher Scientific,
Inc., Waltham, MA, USA) and determined by comparison with the
GS600LIZ internal size markers (Applied Biosystems). The estimation
of CA repeat numbers in each of the analyzed specimens was based on
an extrapolation to the previously developed specific allelic
ladder (17). The ladder marker
consisted of 14 sequenced amplifications representing alleles with
7, 9, 11, 13 and 23 CA repeats.
Tissues were classified as microsatellite
instability-high (MSI-H) when at least two of the five loci showed
MSI [non19/non 19] and as MSI low (MSI-L) when only one locus
showed MSI [19/non 19 and/or non 19/19]. If none of the
micro-satellite sequences was mutated, the tumor was classified as
microsatellite stable [MSS; 19-19] (9).
Immunohistochemical analysis of IGF-1
expression
Immunohistochemical staining for IGF-1 was performed
using the DAKO LSAB+System-HRP set (Rabbit, Mouse, Goat, DAB+; cat.
no. K0679; Dako North America, Carpinteria, CA, USA). Dako Antibody
Diluent with Background Reducing Components (cat. no. S3022; Dako)
was used to prepare dilutions. Tissue sections (4 µm) were
prepared from paraffin-embedded tissue. Following
de-paraffinization and re-hydration, sections were incubated with
Dako Target Retrieval Solution (pH 9, 10X, cat. no. S2367, Dako) at
95–99°C for 20 min. The sections were rinsed three times for 5 min
each in Tris-buffered saline (TBS; pH-7.6; Dako) and endogenous
peroxidase activity was blocked by incubation in 3% hydrogen
peroxide for 5 min. Following rinsing with distilled water, samples
were immersed in TBS for 5 min and incubated with 5 µg/ml
primary goat polyclonal antibody directed against human IGF-1 (cat.
no. 18773; Sigma-Aldrich) at room temperature for 15 min. The
sections were then incubated with secondary biotinylated anti-goat
polyclonal immunoglobulin (1:1,000 dilution; included in the kit
mentioned above). at room temperature for 10 min. Following rinsing
as above, samples were incubated with streptavidin conjugated to
horseradish peroxidase for 10 min. Following rinsing, antibodies
were visualized by incubation with 3,3′-diaminobenzidine
tetrahydrochloride (Dako) for 5 min. After rinsing with distilled
water, cell nuclei were stained with Meyer's hematoxylin (Dako).
Following dehydration with an ethanol series, samples were rinsed
in xylene, mounted in mounting medium (Consul Mount™, Thermo
Shandon™, Thermo Fisher Scientific, Inc.) and studied using an
optical microscope (Axioskop 40; Carl Zeiss, Oberkochen,
Germany).
Quantitative scoring of slides
Evaluation of immunohistochemical staining was
performed by two independent pathologists using Cell-2 software,
version 4.1 (Poznan University of Medical Sciences, Poznan,
Poland). The scoring method was based on analysis of the
distribution of colors and their optical density. The software
identifies cells with an optical density greater than the
background and classifies them as immunoreactive on the basis of
the color ratio. To determine the percentage of positive cells in
the sections, the number of immunopositive cells was divided by the
total cell count. A minimum of 5,000 cells was counted and the
number of sections was 99, 96 and 71 for the EC, HS and CG group,
respectively. An investigator who was blinded with regard to the
identity of the samples performed all analyses.
Statistical analysis
Differences or correlations between the analyzed
parameters were verified using multi-way tables and homogeneity or
independence were tested using the χ2 test. Due to the
skewed distribution of measurable parameters evaluated on the basis
of the Shapiro-Wilk test, the analysis of differences between the
studied sub-groups was performed by non-parametric tests.
Comparison of two independent groups was performed using the
Mann-Whitney U test. To compare more than two groups, the
Kruskal-Wallis test and multiple comparisons/post-hoc tests were
performed. Bivariate correlations between study variables were
determined by calculating Spearman's rank correlation coefficients.
Analysis assumed a 5% error of inference and the associated
significance level of P<0.05 was considered to indicate a
statistically significant difference. Statistical analyses were
performed using Statistica software version 8.0 (StatSoft, Krakow,
Poland).
Results
Allelic distribution of CA repeats in the
IGF-1 gene P1 promoter in DNA isolated from serum and tissue
samples from patients with EC
DNA from the blood and tissue of patients with EC,
HS and normal controls was isolated and the occurrence of CA
repeats situated in the P1 promoter region of the IGF-1 gene as
well as the serum and tissue levels of IGF-1 were compared between
the groups. The IGF1 genotype distribution in the total cohort and
sub-categories is shown in Table
I. The length range of CA repeats in the DNA of the study
subjects was 17–21. Depending on the single nucleotide CA
polymorphism in the study group, subjects were assigned to three
genotypes: MSS, presence of 19-19 (CA)19 repeat alleles; MSI-L,
presence of only one (CA)19 allele [19/non and/or non 19/19]; and
MSI-H-lack of (CA)19 repeat alleles [non19/non 19]. The most common
genotype of blood cells and tissue samples from the control group
was MSS [homozygote (CA)19 repeat], which was identified in 20 out
of 27 subjects (74%). In the HS group, the MSS genotype was
identified in 62.5% of blood cell specimens and 68.7% of tissue
samples, and in the EC group, 21.2% of blood cell specimens and 9%
of tissue specimens were of the MSS genotype. Statistical analysis
revealed no significant association between serum and tissue
genotype frequency in any of the study groups (P>0.05) (Table I). However, the most frequent
genotype in the control group was MSS (P<0.01), while MSI-H was
most frequent in the EC group (P<0.01). This suggests that
mutations in the IGF-1 promoter are common in EC and may be
associated with its genesis (Table
I).
 | Table IComparison of microsatellite
instability evaluation (CA repeat) in DNA isolated from peripheral
blood cells and paraffin tissues of patients from the study and the
control group. |
Table I
Comparison of microsatellite
instability evaluation (CA repeat) in DNA isolated from peripheral
blood cells and paraffin tissues of patients from the study and the
control group.
| Groups | Control group
(n=27)
| Non-atypical
hyperplasia simplex (n=32)
| Endometrial cancer
(n=33)
|
|---|
| N (serum) | N (tissue) | N (serum) | N (tissue) | N (serum) | N (tissue) |
|---|
| IGF-1
(CA)n genotype |
| CA17/18 | 0 | 0 | 0 | 2 | 5 | 5 |
| CA17/19 | 2 | 1 | 0 | 1 | 3 | 1 |
| CA17/21 | 0 | 0 | 3 | 1 | 5 | 4 |
| CA18/19 | 2 | 1 | 0 | 2 | 0 | 2 |
| CA18/20 | 0 | 1 | 2 | 2 | 6 | 5 |
| CA18/21 | 0 | 0 | 2 | 0 | 4 | 6 |
| CA19/19 | 20 | 20 | 20 | 22 | 7 | 3 |
| CA19/20 | 0 | 1 | 3 | 2 | 0 | 1 |
| CA19/21 | 2 | 2 | 2 | 0 | 0 | 1 |
| CA20/20 | 1 | 1 | 0 | 0 | 3 | 5 |
| IGF-1
(CA)n genotype |
| Group 1 | | | | | | |
| MSS | 20 | 20 | 20 | 22 | 7 | 3 |
| MSI-L | 6 | 5 | 5 | 5 | 3 | 5 |
| MSI-H | 1 | 2 | 7 | 5 | 23 | 25 |
| P-valuea | 0.067a | | 0.098a | | 0.087a | |
| Group 2 | | | | | | |
| 19 allele
present | 26 | 26 | 25 | 27 | 20 | 17 |
| 19 allele
absent | 1 | 1 | 7 | 5 | 13 | 16 |
| P-valueb | 0.098b | | 0.881b | | 0.922b | |
Analysis of blood serum IGF-1, IGFBP-1
and IGFBP-3 levels in study groups of women
The blood serum levels of IGF-1, IGFBP-1 and IGFBP-3
in the experimental groups are shown in Table II. No statistically significant
differences in IGF-1, IGFBP-1 and IGFBP-3 serum concentrations
between the control, HS and EC groups were detected.
| Table IIAnalysis of IGF-1 (ng/ml), IGFBP-1
(ng/ml), IGFBP-3 (ng/ml) levels in blood serum of patients from the
HS and EC groups and the control group. |
Table II
Analysis of IGF-1 (ng/ml), IGFBP-1
(ng/ml), IGFBP-3 (ng/ml) levels in blood serum of patients from the
HS and EC groups and the control group.
| Group | N | Mean | SD | Me | Q1 | Q3 | Min-Max | P-value |
|---|
| IGF-1 |
| Control | 27 | 178.9 | 85.1 | 152.6 | 125.4 | 206.1 | 100–314 | |
| HS | 32 | 180.1 | 114.9 | 171.4 | 142.8 | 221.2 | 101–232 | 0.21 |
| EC | 33 | 209.9 | 60.6 | 193.4 | 121.8 | 230.1 | 102–340 | 0.50 |
| IGFBP-1 |
| Control | 27 | 5.4 | 4.4 | 4.0 | 2.6 | 5.8 | 2.6–5.8 | |
| HS | 32 | 5.0 | 5.0 | 3.3 | 2.4 | 5.5 | 1.2–7.7 | 0.57 |
| EC | 33 | 6.8 | 5.9 | 4.9 | 3.0 | 9.1 | 1.7–13.2 | 0.43 |
| IGFBP-3 |
| Control | 27 | 1689.8 | 542.7 | 1551.3 | 1370.0 | 1893.3 | 942–2387 | |
| HS | 32 | 1712.9 | 589.9 | 1705.3 | 1407.1 | 1749.7 | 1104–2654 | 0.46 |
| EC | 33 | 1725.6 | 412.6 | 1706.0 | 1482.9 | 1956.7 | 1104–2417 | 0.46 |
Correlation of blood serum IGF-1, IGFBP-1
and IGFBP-3 levels with the IGF-1 genotype among patients with
EC
To further evaluate whether blood serum levels of
IGF-1, IGFBP-1 and IGFBP-3 were linked to the genotype of IGF-1 and
the occurrence of EC, the IGF-1 levels were correlated with IGFBP-1
and IGFBP-3 levels within the MSS and MSI-H genotypes. Due to the
low number of patients, the MSI-L group was excluded from this
analysis. IGF-1 levels were positively correlated with IGFBP-3 in
the MSS genotype of IGF-1 (r=0.38, P=0.019), while a high and
negative correlation with IGFBP-1 (r=−0.67, P=0.001) was identified
for the MSI-H genotype (Table
III).
| Table IIISpearman rank correlation
coefficients for the correlation of blood serum levels of IGF-1
with IGFBP-1 and IGFBP-levels for the MSS and MSI-H genotypes among
patients with EC. |
Table III
Spearman rank correlation
coefficients for the correlation of blood serum levels of IGF-1
with IGFBP-1 and IGFBP-levels for the MSS and MSI-H genotypes among
patients with EC.
| Parameter | MSS
| MSI-H
|
|---|
| IGFBP-1 | IGFBP-3 | IGFBP-1 | IGFBP-3 |
|---|
| IGF-1 | 0.12 | 0.38 | −0.67 | −0.21 |
| P-value | 0.2311 | 0.0191a | 0.0007a | 0.3830 |
Blood serum estrone, estriol and
estradiol levels
The serum levels of estrone, estriol and estradiol
in the control, HS and EC groups are shown in Table IV. No significant differences in
the serum concentrations of these estrogens were identified between
any of the groups.
| Table IVAnalysis of estrone (pg/ml), estriol
(ng/ml) and estradiol (ng/ml) levels in the blood serum of patients
with EC. |
Table IV
Analysis of estrone (pg/ml), estriol
(ng/ml) and estradiol (ng/ml) levels in the blood serum of patients
with EC.
| Hormone/group | N | Mean | SD | Me | Q1 | Q3 | Min-Max | P-value |
|---|
| Estrone |
| Control | 27 | 45.6 | 133.4 | 33.8 | 23.7 | 167.5 | 9–132 | |
| HS | 32 | 54.0 | 59.6 | 39.0 | 16.7 | 66.3 | 7–103 | 0.65 |
| EC | 33 | 71.0 | 47.3 | 35.5 | 23.7 | 80.9 | 10–228 | 0.72 |
| Estriol | | | | | | | | |
| Control | 27 | 2.7 | 1.6 | 2.5 | 1.8 | 5.2 | 1–8.8 | |
| HS | 32 | 2.4 | 1.1 | 2.4 | 2.0 | 3.3 | 1.3–1.6 | 0.87 |
| EC | 33 | 2.6 | 0.6 | 1.9 | 1.5 | 2.6 | 1.4–5.5 | 0.74 |
| Estradiol |
| Control | 27 | 39.7 | 83.7 | 24.5 | 12.6 | 67.5 | 7.7–108 | |
| HS | 32 | 68.2 | 31.4 | 32.1 | 20.9 | 46.7 | 1.6–214 | 0.22 |
| EC | 33 | 51.4 | 76.7 | 25.9 | 7.8 | 94.0 | 3.3–214.8 | 0.60 |
Correlation of blood serum IGF-1 with
estrone, estriol and estradiol levels in MSS and MSI-H genotypes
among patients with EC
The present study further assessed whether blood
serum levels of IGF-1 were correlated with estrogen levels for the
individual genotypes MSS and MSI-H (Table V). Due to the low number of
patients, group MSI-L was excluded from this analysis. A
significant correlation was identified between the IGF-1 levels and
estrone levels in the MSI-H genotype group (r=−0.41, P=0.012) as
well as a highly negative correlation between IGF-1 levels and the
estradiol concentration in the MSI-H genotype group (r=−0.6,
P=0.002).
| Table VSpearman rank correlation
coefficients for the correlation of blood serum levels of IGF-1
with levels of estrone, estriol and estradiol in patients with EC
of the MSS and MSI-H genotypes. |
Table V
Spearman rank correlation
coefficients for the correlation of blood serum levels of IGF-1
with levels of estrone, estriol and estradiol in patients with EC
of the MSS and MSI-H genotypes.
| MSS
| MSI-H
|
|---|
| Estrone | Estriol | Estradiol | Estrone | Estriol | Estradiol |
|---|
| IGF-1 | 0.21 | 0.11 | 0.27 | −0.41 | −0.11 | −0.6 |
| P-value | 0.401 | 0.453 | 0.290 | 0.012a | 0.700 | 0.002 |
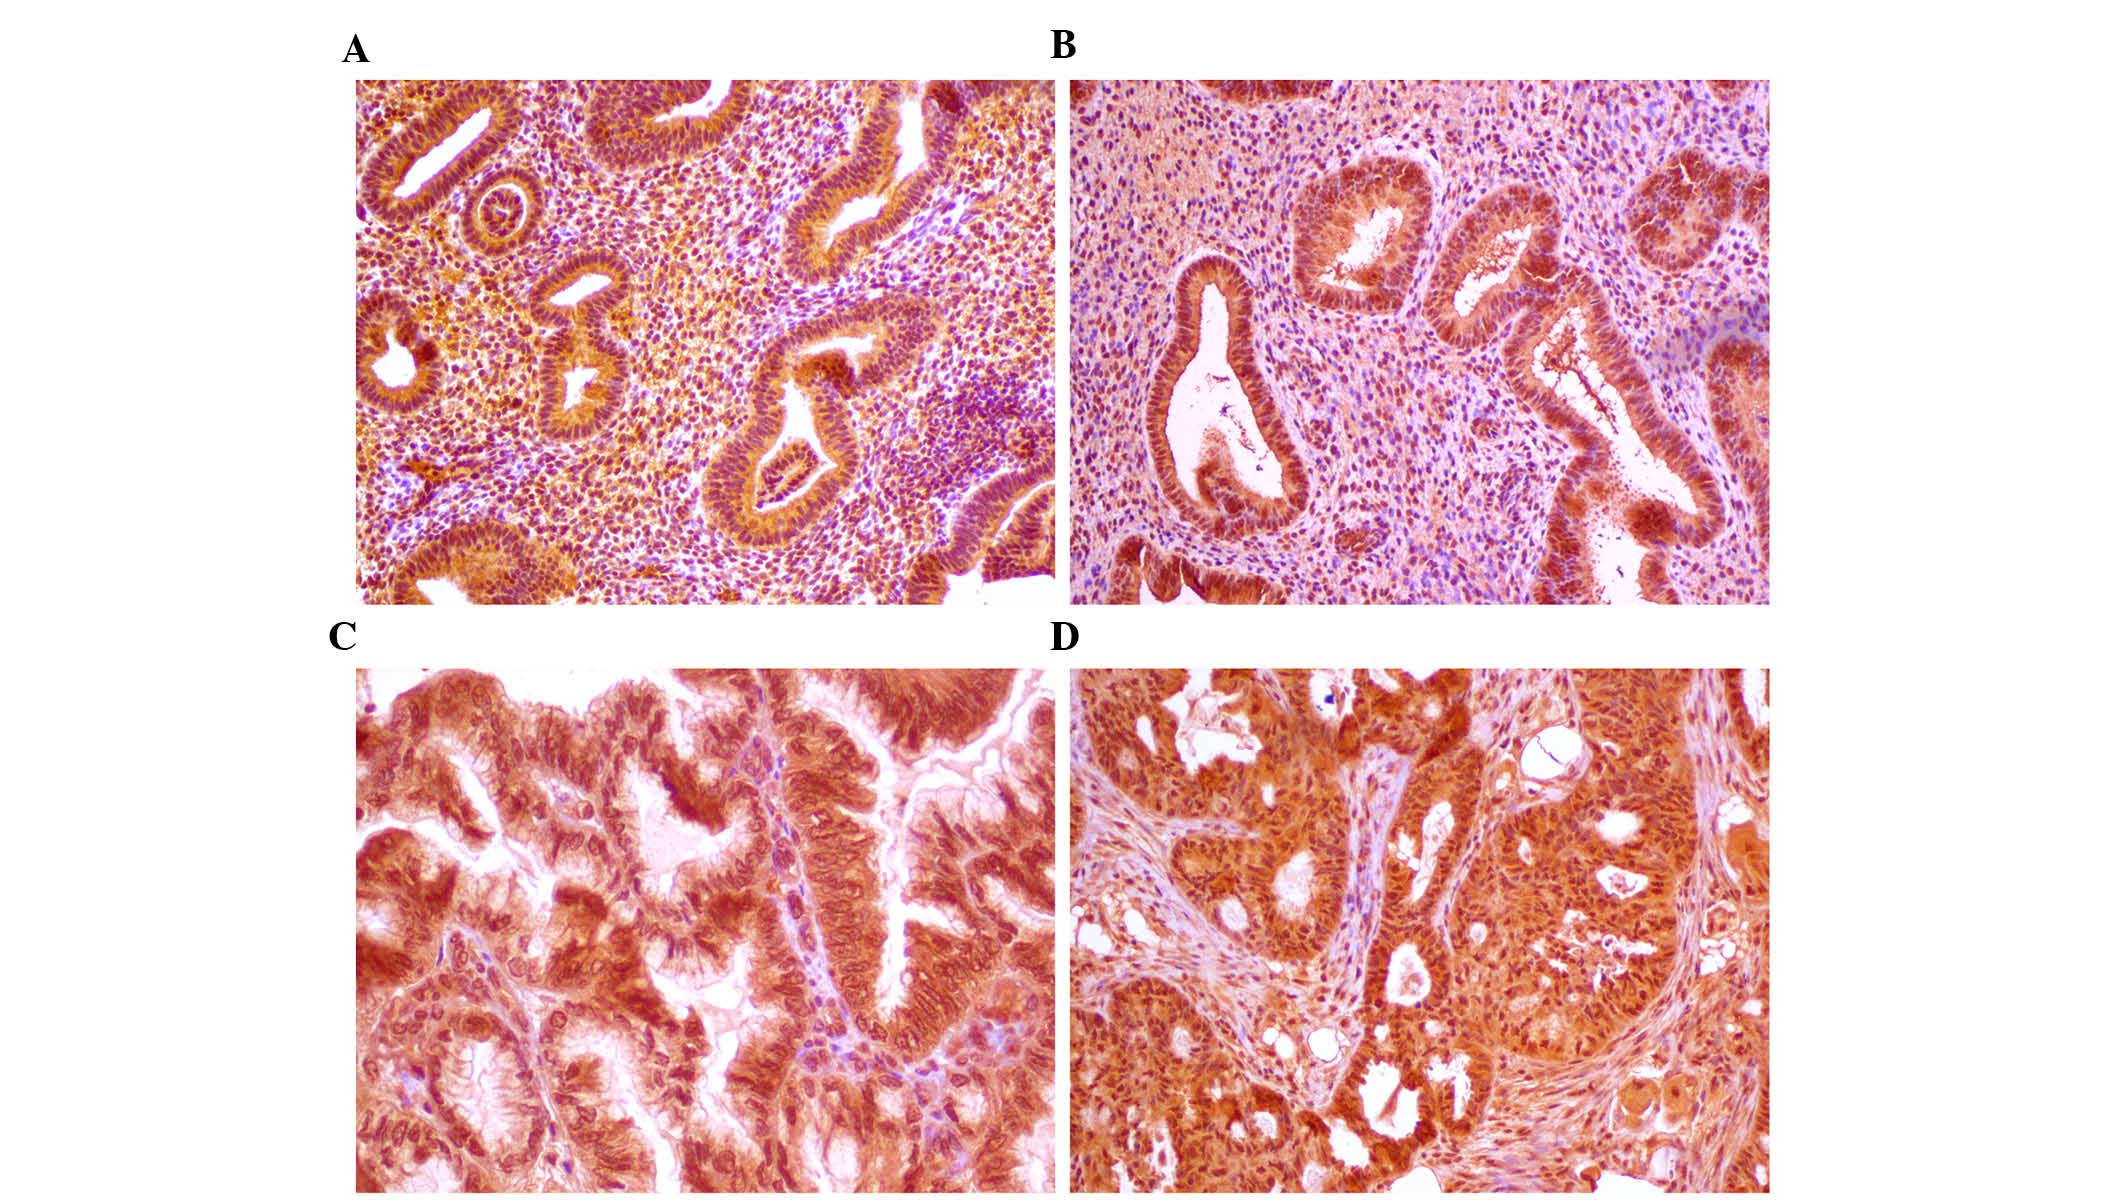
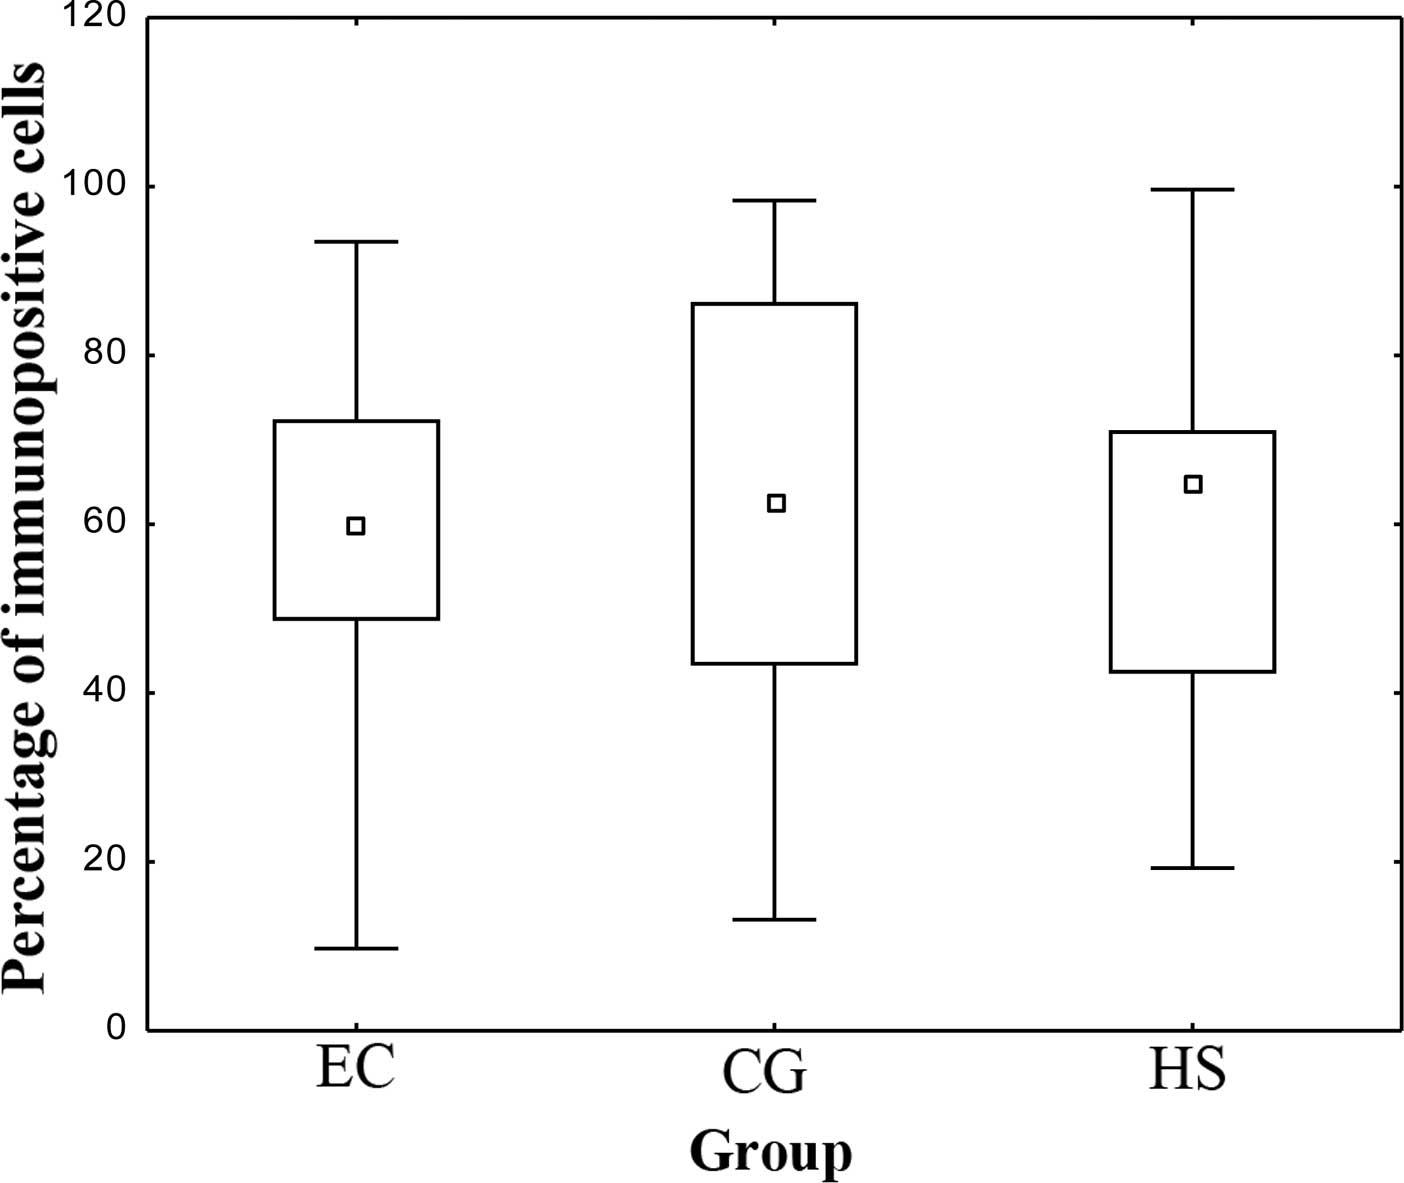
Quantitative scoring of
immunohistochemical samples
The present study investigated the association of
IGF-1 expression in tissues with IGF-1 genotypes. Expression levels
of IGF-1 in tissue samples assigned to control, HS or EC groups
confirmed by histopathological diagnosis were determined by
immunohistochemical scoring (Fig.
1) and are expressed graphically as the median and range in
Figs. 2 and 3. No statistically significant
differences in the number of IGF-1-expressing cells were identified
between the control, HS and EC groups (P>0.05) (Fig. 2). Of note, the number of
IGF-1-expressing cells was significantly higher in the MSI-H-type
18-20 (P=0.007), MSI-L-type 19-20 (P=0.025) and MSS 19-19 (P=0.024;
characteristic for healthy tissues) genotypes compared with that in
the MSI-H type 20-20, which is characteristic for EC (Fig. 3).
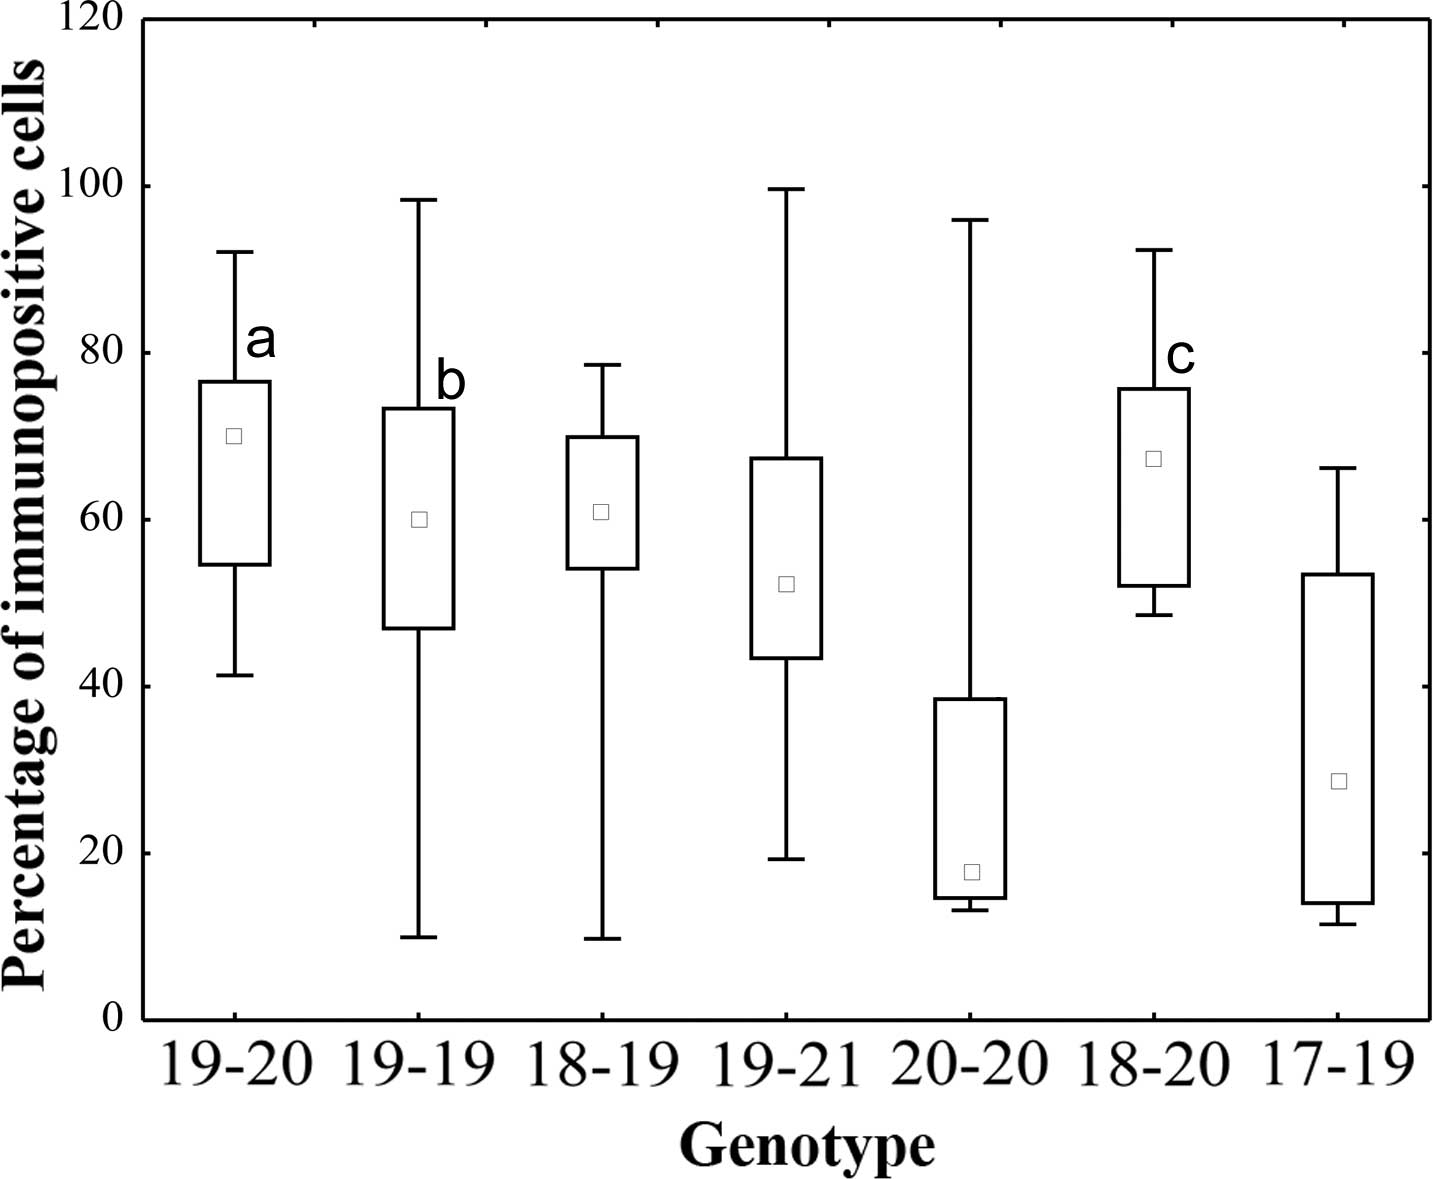 | Figure 3IGF-1 expression in the endometrial
tissues classified as microsatellite instability high (20-20,
18-20), low (19-20,
19-21, 17-19,
18-19) or microsatellite stable (19-19).
The number of IGF-1-expressing cells was significantly higher in
the MSI-L-type 19-20 (aP=0.025), MSS type 19-19
(bP=0.024) and MSI-H-type 18-20 (cP=0.0072)
vs. the MSI-H type 20-20. Small squares indicated the median value,
boxes indicate the 25–75% range and bars indicate the
minimum-maximum range. IGF, insulin-like growth factor; MSS,
microsatellite stable; MSI-L, microsatellite instability low;
MSI-H, micro satellite instability high. |
Discussion
Several studies have demonstrated that the IGF
pathway has an important role in gynecological cancer types in
general and endometrial tumors in particular (18–20).
The results of an epidemiological study shoed that elevated levels
of IGF-1 are correlated with an increased risk of the development
of numerous types of cancer (21).
IGF-1 expression and signaling regulate the transition of the
pre-menopausal endometrium through the proliferative, secretory and
menstrual cycles and have a significant role in the development of
EC. A case-cohort study by Gunter et al (22) that included 250 EC patients and 465
controls suggested an association between the risk for EC and the
serum levels of IGF-1, IGFBP-3, insulin and estradiol. Furthermore,
Ayabe et al (23) reported
elevated IGF-1 and decreased IGFBP-1 levels in post-menopausal EC
patients. However, Petridou et al (24) indicated that EC was positively
correlated with IGF-2 serum levels and inversely associated with
IGF-1. Cao et al (25)
indicated that low serum levels of IGFBP-1 and high levels of IGF-1
are sufficient to elevate the risk of prostate cancer. Low levels
of circulating IGFBP-1 were also shown to be able to predict the
risk of pancreatic cancer (26).
The present study found no statistically significant differences
between serum levels of IGF-1, IGFBP-1 and IGFBP-3 in the control,
HS and EC groups. However, a correlation between serum levels of
IGF-1 and a polymorphism in the CA repeat in the 5′ untranslated
region of the IGF-1 promoter was identified. Serum levels of IGF-1
were positively correlated with IGFBP-3 in the MSS and MSI-L groups
and negatively correlated with IGFBP-1 in the MSI-H group. Analysis
of the polymorphic repeat in the P1 promoter of the IGF-1 gene in
the serum and tissue showed no statistically significant
differences. Polymorphism changes were identical in the serum and
tissues of the control groups (EC and HS). Moreover, IGF-1,
IGFBP-1, IGFBP-3, estrone, estriol and estradiol levels in the
blood serum of the control group and patient study group showed no
statistically significant differences. By contrast, a significant
negative correlation between the plasma levels of IGF-1 and IGFBP-1
as well as between estrone and estradiol levels was observed in EC
patients with IGF-1 polymorphisms of the MSI-H type. Therefore, the
expression of IGF-1 was assessed in tissues. No statistically
significant differences in the number of IGF-1-expressing cells
were identified between the control and study groups; however, the
number of IGF-1-expressing cells was significantly higher in
tissues from patients of the MSI-H type 18-20, the MSI-L type 19-20
and the MSS type 19-19 (characteristic for healthy tissues)
compared with that in the MSI-H type 20-20, which is characteristic
for EC. These results confirmed the notion that (CA)n
microsatellite repeat polymorphisms in the P1 promoter of IGF-1
themselves are not the primary regulatory elements of IGF-1
expression.
Cleveland et al (27) reported that IGF-1 genotypes which
include alleles with less than 19 CA repeats appeared to be
associated with an increased risk of breast cancer. In line with
this, several further studies have also found an association
between the number of IGF-1 CA repeats and the risk for breast
cancer (28–30), while others have not (31). Zecevic et al (32) suggested that IGF-1 variant
genotypes modify the risk of hereditary forms of cancer. The serum
levels of IGF-1 are highly influenced by estrogen. Liang et
al (33) indicated that IGF
signaling has an important role in estrogen-induced endometrial
carcinogenesis. While the molecular mechanisms of estrogen-induced
expression of IGF-1 have largely remained elusive, it has been
reported that estrogen treatment increased the mRNA expression of
IGF-1, possibly through regulation and modulation of the IGF-1
promoter and CCAAT-enhancer-binding protein transcription factors
(34). Estrogens are known to
increase IGFBPs, which regulate the bioavailability and activities
of IGFs, and which either enhance or inhibit the action of IGFs,
while also being able to act independently of IGFs.
When the endometrium is exposed to unopposed
estrogen, the risk of hyperplasia and EC increases, which, however,
may be reduced by sex hormone binding globulin, progesterone and
further steroid hormones and factors (35). Estrone is a precursor of estradiol,
the principal estrogen, whose metabolic waste product is estriol.
All of these estrogens act upon the endometrium through estrogen
receptors, resulting in the induction of growth factors, including
the epidermal growth factor, IGF-1 and growth-enhancing
proto-oncogenes, such as c-fos and c-myc (36). All hormones can also act via
non-genomic pathways to control cell function and proliferation
(35). The present study revealed
a negative correlation between the serum levels of IGF-1 and
estrone and estradiol concentrations in patients with EC (r=−0.41,
P=0.012).
Little is known regarding autocrine activation of
the IGF-1 system and estrogens in endometrial tissues. The
difference in IGF-1 levels among oral contraceptive users with and
without the 19 repeat allele suggests that this allele may be
associated with a conformational change in the IGF-1 promoter
region, possibly involving the estrogen response element (27).
The immunohistochemical analysis performed in the
present study indicated that in tissues with a genotype other than
(CA)19, the number of IGF-1 expressing cells was significantly
higher. This finding confirmed the finding that IGF-1 genotypes
other than (CA)19 show elevated levels of IGF-1 in tissues, which
may be responsible for autocrine stimulation of cancer development
(37). However, as all cancer
types, EC is a multifactorial disease and carcinogenesis is a
result of multiple gene mutations leading to aberrant expression of
proteins, which regulate cell functions and the polymorphism
assessed in the present study leading to aberrant IGF-1 expression
may be one of them.
In the present study, the association between CA
sequence polymorphisms in the IGF-1BP1 promoter region, IGF-1
levels and endometrial cancer development in comparison to healthy
individuals was examined. The study revealed that the length of the
CA repeat sequence in women with non-atypical hyperplasia simplex
and endometrial cancer ranged from 17–21 bp. A similar distribution
of CA polymorphisms was observed among the control group. However,
among healthy individuals, ~74% were homozygote carriers of 19 CA
repeats (MMS) according to serum and tissue analysis, while 62.5
and 68.7% of patients with non-atypical hyperplasia simplex were of
the MMS type according to serum and tissue analysis, respectively.
However, the MMS type was only detected in the serum of 22.2% and
in the tissue of 9.0% of patients with EC. A previous
bioinformatics study by our group showed that the CA repeat region
of the P1 promoter of IGF-1 is able to form DNA loop structures,
which may serve as a recognition site for transcriptional
modulators of the IGF-1 gene (38). Thus, changes in the number of CA
repeats may have an influence on IGF-1 promoter activity and be
associated with EC; however, further studies are required to
confirm this.
Acknowledgments
The present study was supported by grants from the
Medical University of Lublin (nos. DS 120, DS 128 and MB 128).
References
|
1
|
Jemal A, Siegel R, Ward E, Hao Y, Xu J and
Thun MJ: Cancer statistics, 2009. CA Cancer J Clin. 59:225–249.
2009. View Article : Google Scholar : PubMed/NCBI
|
|
2
|
Bokhman JV: Two pathogenetic types of
endometrial carcinoma. Gynecol Oncol. 15:10–17. 1983. View Article : Google Scholar : PubMed/NCBI
|
|
3
|
Clemmons DR: Modifying IGF1 activity: An
approach to treat endocrine disorders atherosclerosis and cancer.
Nat Rev Drug Discov. 6:821–833. 2007. View
Article : Google Scholar : PubMed/NCBI
|
|
4
|
Yu H and Rohan T: Role of the insulin-like
growth factor family in cancer development and progression. J Natl
Cancer Inst. 92:1472–1489. 2000. View Article : Google Scholar : PubMed/NCBI
|
|
5
|
Bruchim I, Sarfstein R and Werner H: The
IGF hormonal network in endometrial cancer: Functions, regulation
and targeting approaches. Front Endocrinol (Lausanne).
5:762014.
|
|
6
|
Walker MP, Diaugustine RP, Zeringue E, et
al: An IGF1/insulin receptor substrate-1 pathway stimulate a
mitotic kinase (cdk1) in the uterine epithelium during the
proliferative response to estradiol. J Endocrinol. 207:225–235.
2010. View Article : Google Scholar : PubMed/NCBI
|
|
7
|
Enders GH and Maude SL: Traffic safety for
the cell: Influence of cyclic-dependent kinase activity on genomic
stability. Gene. 371:1–6. 2006. View Article : Google Scholar : PubMed/NCBI
|
|
8
|
Tang H, Liao Y, Xu L, Zhang C, Liu Z, Deng
Y, Jiang Z, Fu S, Chen Z and Zhou S: Estrogen and insulin-like
growth factor 1 synergistically promote the development of lung
adenocarcinoma in mice. Int J Cancer. 133:2473–2482. 2013.
View Article : Google Scholar : PubMed/NCBI
|
|
9
|
Rotwein P, Pollock KM, Didier DK and Krivi
GG: Organization and sequence of the human insulin-like growth
factor I gene. Alternative RNA processing produces two insulin-like
growth factor I precursor peptides. J Biol Chem. 261:4828–4832.
1986.PubMed/NCBI
|
|
10
|
Adamo ML, Neuenschwander S, LeRoith D and
Roberts CT Jr: Structure, expression and regulation of the IGF-I
gene. Adv Exp Med Biol. 343:1–11. 1993. View Article : Google Scholar
|
|
11
|
Yu H, Li BD, Smith M, Shi R, Berkel HJ and
Kato I: Polymorphic CA repeats in the IGF-I-gene and breast cancer.
Breast Cancer Res Treat. 70:117–122. 2001. View Article : Google Scholar
|
|
12
|
Coletta RR, Jorge AA, D'Alva CB, Pinto EM,
Billerbeck AE, Pachi PR, Longui CA, Garcia RM, Boguszewski M,
Arnhold IJ, et al: Insulin-like growth factor 1 gene (CA)n repeats
and a variable number of tandem repeats of the insulin gene in
Brazilian children born small for gestational age. Clinics
(SaoPaulo). 68:785–791. 2013. View Article : Google Scholar
|
|
13
|
Bläker H, Warth A, Kloor M and Schirmacher
P: Chromosomal instability, microsatellite instability and CpG
island methylator phenotype: Roles in small intestinal
carcinogenesis. Pathologe. 32(Suppl 2): 181–184. 2011. View Article : Google Scholar
|
|
14
|
Avruch J: MAP kinase pathway: The first
twenty years. Biochim Biophys Acta. 1773:1150–1160. 2007.
View Article : Google Scholar : PubMed/NCBI
|
|
15
|
Rutanen EM: Insulin-like growth factors
and insulin-like growth factor binding proteins in the endometrium.
Effect of intrauterine levonorgestrel delivery. Hum Reprod.
15(Suppl 3): 173–181. 2000. View Article : Google Scholar : PubMed/NCBI
|
|
16
|
Creasman W: Revised FIGO staging for
carcinoma of the endometrium. Int J Gynaecol Obstet. 105:1092009.
View Article : Google Scholar : PubMed/NCBI
|
|
17
|
Kaczmarek M, Pacholska-Bogalska J,
Kwaśniewski W, Kotarski J, Halerz-Nowakowska B and
Goździka-Józefiak A: A microsatellite polymorphism in IGF1 gene
promoter and timing of natural menopause in Caucasian women. Int J
Med Sci. 12:32–41. 2015. View Article : Google Scholar : PubMed/NCBI
|
|
18
|
Bruchim I and Werner H: Targeting IGF-1
signaling pathways in gynecological malignancies. Expert Opin Ther
Targets. 17:307–320. 2013. View Article : Google Scholar : PubMed/NCBI
|
|
19
|
Werner HM and Salvesen HB: Current status
of molecular biomarkers in endometrial cancer. Curr Oncol Rep.
16:403–414. 2014. View Article : Google Scholar : PubMed/NCBI
|
|
20
|
Bruchim I, Sarfestein R and Werner H: The
IGF hormonal network in endometrial cancer: Functions, regulation
and targeting approaches. Front Endocrinol (Lausanne).
5:762014.
|
|
21
|
Pollak M: Insulin-like growth factor
signaling in neoplasia. Nat Rev Cancer. 8:915–928. 2008. View Article : Google Scholar : PubMed/NCBI
|
|
22
|
Gunter MJ, Hoover DR, Herbert Yu,
Wassertheil-Smoller S, Manson JE, Li J, Harris TG, Rohan TE, Xue X,
Ho GY, et al: A prospective evaluation of insulin and insulin-like
growth factor-I as risk factors for endometrial cancer. Cancer
Epidemiol Biomarkers Prev. 17:921–929. 2008. View Article : Google Scholar : PubMed/NCBI
|
|
23
|
Ayabe I, Tsutsumi O, Sakai A, Yoshikawa H,
Yano T, Kurimoto F and Taketani Y: Increased circulating levels of
insulin-like growth factor-I and decreased circulating levels of
insulin-like growth factor binding protein-1 in postmenoausal women
endometrial cancer. Endocr J. 44:419–424. 1997. View Article : Google Scholar : PubMed/NCBI
|
|
24
|
Petridou E, Koukoulomatis P, Alexe DM,
Voulgaris Z, Spanos E and Trichopoulos D: Endometrial cancer and
the IGF system: A case-control study in Greece. Oncology.
64:341–345. 2003. View Article : Google Scholar : PubMed/NCBI
|
|
25
|
Cao Y, Nimptsch K, Shui IM, Platz EA, Wu
K, Pollak MN, Kenfield SA, Stampfer MJ and Giovannucci EL:
Prediagnostic plasma IGFBP-1, IGF-1 and risk of prostate cancer.
Inter J Cancer. 10:2418–2426. 2015. View Article : Google Scholar
|
|
26
|
Ma J, Sawai H, Matsuo Y, Ochi N, Yasuda A,
Takahashi H, Wakasugi T, Funahashi H, Sato M and Takeyama H: IGF-1
mediates PTEN suppression and enhances cell invasion and
proliferation via activation of the IGF-1/PI3K/Akt signaling
pathway in pancreatic cancer cells. J Surg Res. 160:90–101. 2010.
View Article : Google Scholar
|
|
27
|
Cleveland RI, Gammon MD, Edmiston SN,
Teitelbaum SL, Britton JA, Terry MB, Eng SM, Neugut AI, Santella RM
and Conway K: IGF1 CA repeat polymorphisms, lifestyle factors and
breast cancer risk in the long island breast cancer study project.
Carcinogenesis. 27:758–765. 2006. View Article : Google Scholar
|
|
28
|
Rietveld I, Janssen J, Hofman A, Pols HA,
van Duijn CM and Lamberts SW: A polymorphism in the IGF-1 gene
influence the age-related decline in circulating total IGF-1
levels. Eur J Endocrinol. 148:171–175. 2003. View Article : Google Scholar : PubMed/NCBI
|
|
29
|
Jernström H, Chu W, Vesprini D, et al:
Genetic factors related to racial variation in plasma levels of
insulin-like growth factor 1: Implications for premenopausal breast
cancer risk. Mol Genet Metab. 72:144–154. 2001. View Article : Google Scholar
|
|
30
|
Chrostopoulos PF, Msaouel P and
Koutsilieris M: The role of the insulin-like growth factor-1 system
in breast cancer. Mol Cancer. 14:432015. View Article : Google Scholar
|
|
31
|
Javadi M, Hematti S and Tavassoli M:
Polymorphic CA repeat length in insulin-like growth factor 1 and
risk of breast cancer in Iranian women. Med Oncol. 29:516–520.
2012. View Article : Google Scholar
|
|
32
|
Zecevic M, Amos CHI, Gu X, Campos IM,
Jones JS, Lynch PM, Rodriguez-Bigas MA and Frazier ML: IGF1 gene
polymorphism and risk for hereditary nonpolyposis colorectal
cancer. J Natl Cancer Inst. 98:139–143. 2006. View Article : Google Scholar : PubMed/NCBI
|
|
33
|
Liang YJ, Hao Q, Zhang HM, Wu YZ and Wang
JD: Insulin like growth factors in endometroid adenocarcinomas:
Correlation with clinic-pathological features and estrogen receptor
expression. BMC Cancer. 12:262–274. 2012. View Article : Google Scholar
|
|
34
|
Billard J, Grewal SS, Lukaeskol P, Stork
PJ and Rotwein P: Hormonal control of insulin like growth factor 1
gene transcription in human osteoblasts: Dual actions of cAMP
dependent protein kinase on CCAAT/enhancer-binding protein delta. J
Biol Chem. 276:31238–31246. 2001. View Article : Google Scholar
|
|
35
|
Bender D, Buekers T and Leslie KK:
Hormones and receptors in endometrial cancer. Proc Obstet Gyn.
2:1–25. 2011.
|
|
36
|
Groothuis PG, Dassen HH, Romano A and
Punyadeera C: Estrogen and the endometrium: Lessons learned from
gene expression profiling in rodents and human. Hum Reprod Update.
13:405–417. 2007. View Article : Google Scholar : PubMed/NCBI
|
|
37
|
Denduluri SK, Idowu O, Wang Z, Liao Z, Yan
Z, Mohammed MK, Ye J, Wei Q, Wang J, Zhao L and Luu HH:
Insulin-like growth factor (IGF) signaling in tumorigenesis and the
development of cancer drug resistance. Genes Dis. 2:13–25. 2015.
View Article : Google Scholar : PubMed/NCBI
|
|
38
|
Broniarczyk J, Kedzia A, Nowak W,
Koscinski ł, Lewandowski M and Gozdzicka-Jozefiak A: Polymorphisms
in the P1 promoter of the IGF-1 gene in children with growth
disorders. Pediatr Endocrinol Diabetes Metab. 20:136–142. 2015.
View Article : Google Scholar : PubMed/NCBI
|