Introduction
Allergic rhinitis (AR), an inflammation disorder of
the nasal mucosa, is caused by various allergens, such as pollen.
Vidian neurectomy or anticholinergic therapy with ipratropium
bromide (IB) contributed to attenuation of nasal symptoms and
downregulation of the Th2-polarized immune response of AR induced
by ovalbumin (OVA) (1). MicroRNA
(miRNA) profiles altered in AR and aberrant expression of miRNAs
have been implicated in the modulation of Th2-type inflammatory
reaction (2). However, the impact
of anticholinergic treatment on the miRNA expression profile in AR
following allergen exposure remains poorly understood, particularly
the interaction between miRNAs and putative target messenger RNAs
(mRNAs), which requires further investigation and may provide the
missing link in the IB-mediated anti-allergic signaling
pathway.
miRNAs are a class of small (18–24 nt)
single-stranded, noncoding RNAs that, in the majority of
situations, negatively regulate the expression of target genes.
Previous studies have determined miRNA profiles in multiple
allergic inflammatory disorders, including AR, bronchial asthma and
atopic dermatitis (3).
Furthermore, it was demonstrated that specific miRNAs were critical
in regulating the pathogenesis in allergic inflammation, including
polarization and activation of CD4+ T cells, regulation
of airway eosinophilia and modulation of T helper (Th)2
cytokine-induced epithelial responses (3). Currently, to the best of our
knowledge, the miRNA profiles, which are distinct from other
allergic diseases, have not been specifically defined following an
intervention with IB in AR induced by OVA. Thus, the present study
focused on these areas to comprehensively elucidate the molecular
mechanisms underlying the effects of IB (4).
The aim of the present study was to investigate the
mRNA transcriptome and miRNA profiles in nasal mucosa of allergic
mice using IB treatment, as well as the potential regulatory
mechanism by which IB interferes with allergic inflammation. The
study may elucidate the association between mRNA transcriptome
alternation, particularly the miRNA expression and intranasal IB
therapy, and the molecular mechanisms intimately involved in the
development, maintenance and exacerbation or attenuation of AR. The
findings may facilitate with the screening and development of novel
miRNA-targeting compounds for AR treatment.
Materials and methods
Experimental animals
Eight-week-old healthy male BALB/c mice, free of
murine-specific pathogens, were used in the present study. A total
of 66 mice (weight, 24.76±2.26 g) were purchased from and
maintained at the Experimental Animal Center of the Third Xiangya
Hospital, Central South University (Changsha, China). The mice were
housed in a controlled environment under a 12-h light/dark cycle
with free access to food and water [Experimental Animal License no.
SCXK-0020003; Environmental Facilities Certificate of Conformity
SYXK-(Hunan) 200,200.20]. All animals used in the current study
were handled according to a protocol approved by the institutional
animal care and use committee of Central South University.
Establishment of the AR model and
treatment protocol
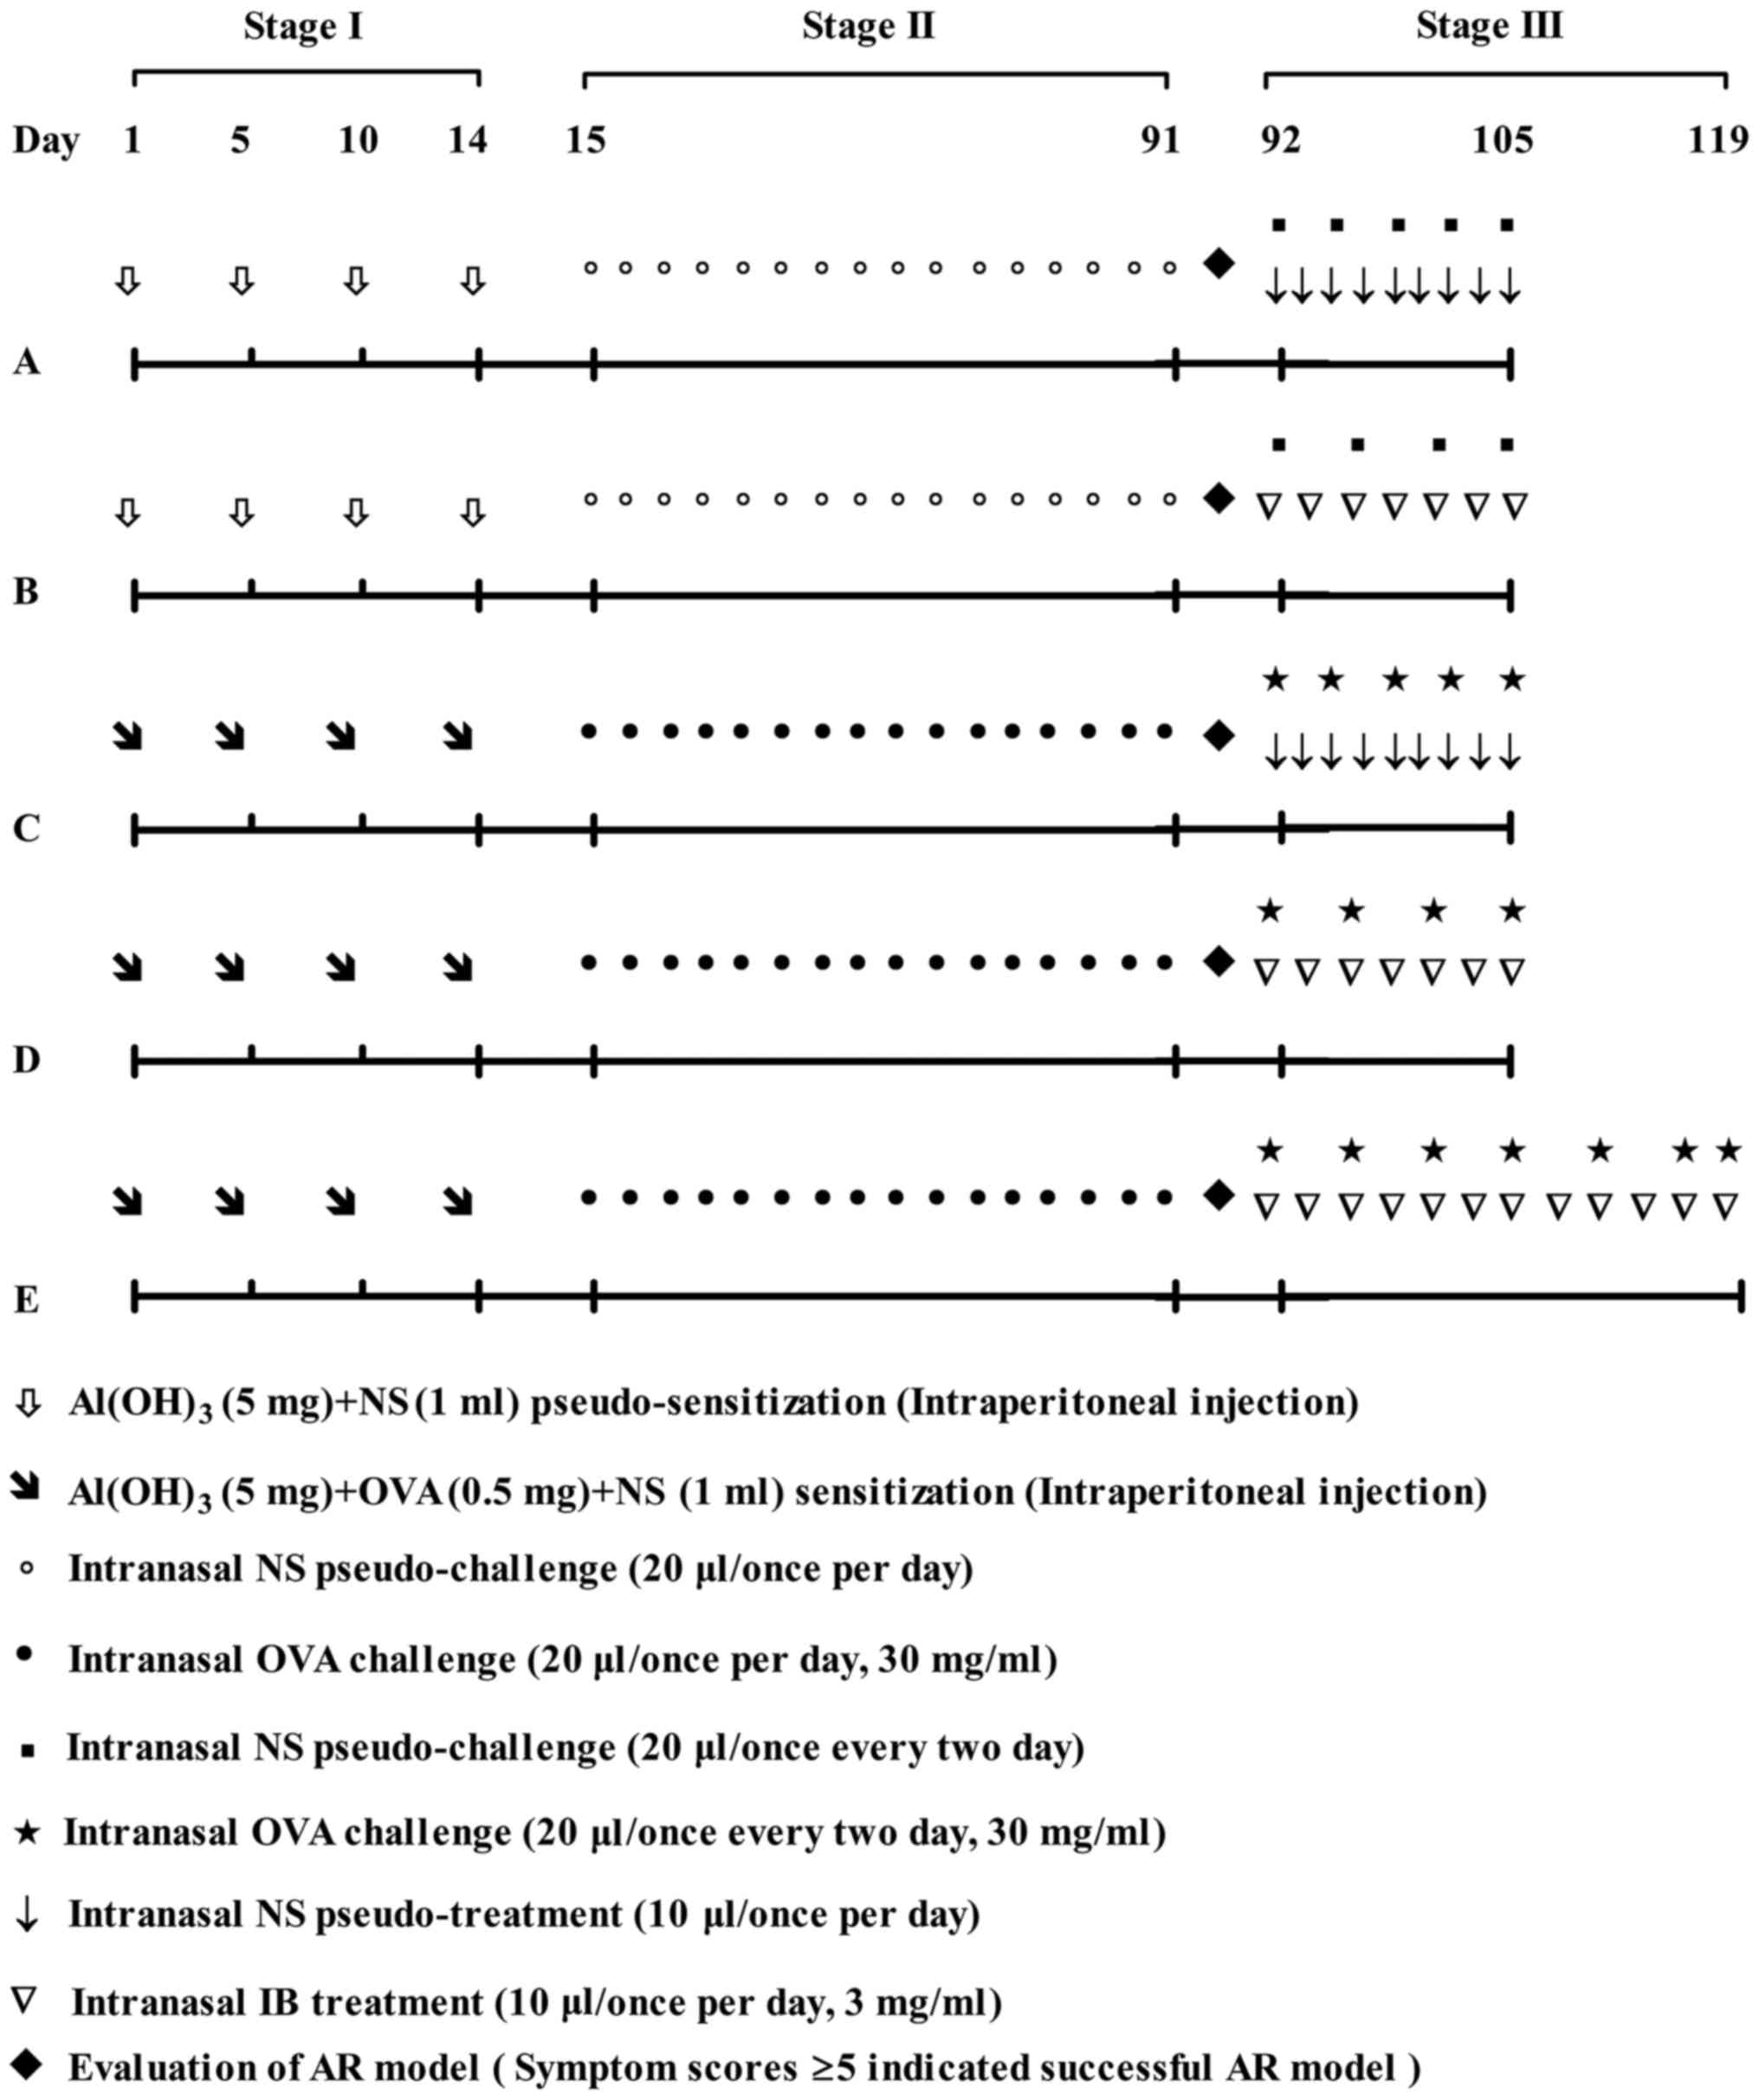
The mouse model of AR was produced as described
previously, but with certain modifications (1). Briefly, 46 mice were randomly
assigned to two groups: Control group (n=16) and model group
(n=30). The model group mice were sensitized with a mixture of OVA
(0.5 mg) (Sigma-Aldrich; Merck KGaA, Darmstadt, Germany), normal
saline (NS; 1 ml) and aluminum hydroxide gel (5 mg) (Sigma-Aldrich;
Merck KGaA) four times (on days 1, 5, 10 and 14) via
intra-peritoneal injection, which was followed by intranasal 3%
(w/v) OVA challenge (20 µl) once per day from week 3 to week 13 (11
weeks in total). In the control group, OVA was substituted with an
equal volume of NS. The allergic mouse model was assessed using
symptom scores on the last day of week 13 (1). Subsequently, mice in the control
group (n=15) were randomly allocated to two groups: Group A (n=7)
and group B (n=8), which received intranasal NS and 0.3% IB (China
Pharmaceutical and Biological Products, Beijing, China) treatment
daily, respectively from week 14 to week 15. Mice in the model
group (n=27) were randomly allocated to three groups: Group C (n=8;
sham group) received NS sham-treatment (10 µl per day) for 2 weeks,
group D (n=10) received intranasal 0.3% IB pre-treatment (10 µl per
day) for 2 weeks and group E (n=9) received intranasal 0.3% IB
pre-treatment (10 µl per day) for 4 weeks. Allergic mice received
the intranasal 3% OVA challenge (20 µl) every 2 days and
non-allergic mice received intranasal NS pseudo-challenge (20 µl)
every 2 days during IB treatment. All mice were sacrificed within
30 min of the final intranasal OVA challenge. Evaluation of symptom
scores was performed prior to sacrifice. Nasal mucosa tissue
samples were harvested within a few min of sacrifice for further
investigation (Fig. 1).
Evaluation of induced allergic
symptom
Allergic symptoms, such as sneezing, nasal itching
and rhinorrhea were observed and counted within 10 min of the last
challenge with OVA or IB treatment. Symptom scores were calculated
as described previously, but with modifications (1). Briefly, sneezing, nasal itching and
rhinorrhea were graded from one to three based on the degree of
severity. Sneezing: The frequency of sneezing <3 within 10 min
after the final OVA challenge were scored 1; 4–10 within 10 min
were scored 2; >11 within 10 min were scored 3. Nasal itching:
The occurrence of mild and occasional nasal scratching within 10
min of the final OVA challenge were scored 1; more severe and
persistent nasal scratching within 10 min were scored 3; nasal
itching in-between these frequencies were scored 2. Rhinorrhea:
Observable watery discharges within the nasal cavity, but without
spilling from the anterior naris within 10 min of the final OVA
challenge were scored 1; watery discharge spilling from the
anterior naris within 10 min were scored 2, the face covered with
abundant watery discharges within 10 min were scored 3. The symptom
scores refer to the accumulative scores of sneezing, nasal itching
and rhinorrhea. The mouse model of AR was regarded as successful
case when the symptom scores were >5.
Total RNA isolation and detection
The RNA sequencing procedure was performed by
Beijing Novogene Bioinformatics Technology Co., Ltd (Beijing,
China). Total RNA was extracted from the mixed nasal mucosa tissue
samples (three samples per group) using TRIzol reagent (Invitrogen;
Thermo Fisher Scientific, Inc., Waltham, MA, USA) according to the
manufacturer's instructions. RNA purity was assessed using a
NanoPhotometer® spectrophotometer (Implen, Inc.,
Westlake Village, CA, USA) and the RNA concentration was measured
using a Qubit® RNA Assay kit in a Qubit® 2.0
Flurometer (Thermo Fisher Scientific, Inc.). RNA integrity was
assessed using the RNA Nano 6000 Assay kit of the Bioanalyzer 2100
system (Agilent Technologies, Inc., Santa Clara, CA, USA).
mRNA library preparation for
transcriptome sequencing and data analysis
The mRNA libraries were generated using
NEBNext® Ultra™ RNA Library Prep kit for
Illumina® (New England BioLabs, Inc., Ipswich, MA, USA)
according to the manufacturer's instructions. The mRNA library for
groups A-E were designated as Am, Bm, Cm, Dm and Em, respectively.
The five libraries were sequenced on an Illumina Hiseq 2000
platform for raw data. Clean reads were obtained by removing
unqualified data and were aligned to the reference genome using
TopHat v2.0.9 (https://ccb.jhu.edu/software/tophat/index.shtml). The
mapped gene expression level was evaluated by HTSeq software v0.6.1
with Reads Per Kilobase of exon model per Million mapped reads
(RPKM) (5). RPKM>1 was
considered as the threshold for gene expression. Subsequently, the
DEGSeq R package (1.12.0) was used to identify differentially
expressed genes (DEGs), and a corrected P<0.005 value and
|log2(Fold change)|>1 were considered statistically significant
(6). A protein-protein interaction
(PPI) network was constructed using Cytoscape software v3.2.1.0 to
investigate the PPI of DEGs and a confidence score of PPI >700
was selected (7). The node
represents a single DEG, and the edges between nodes indicate the
confidence score. The size of the node reflects the node degree;
genes that exhibit a greater number of interconnections are
represented with a larger node. The width of the edge is positively
associated with the confidence score of the PPI. The color of the
nodes increases from green to red and represents the clustering
coefficient. The clustering coefficient is an indicator of the
network connectivity of the node; a higher clustering coefficient
is representative of a more central status of the gene in the
network.
Small RNA library preparation,
sequencing and data analysis
The small RNA libraries were generated using
NEBNext® Multiplex Small RNA Library Prep Set for
Illumina® (New England BioLabs, Inc.) according to the
manufacturer's instructions. The sRNA library for groups A-E were
designated as Ami, Bmi, Cmi, Dmi and Emi, respectively. The five
sRNA libraries were sequenced on Illumina Hiseq 2500/2000 platform
for raw data. Clean reads, length 18–35 nt, were obtained by
removing unqualified data and mapped to the reference sequence
using Bowtie software v0.12.9 (8).
Subsequently, mapped small RNAs (sRNAs) were aligned to miRBase20.0
(http://www.mirbase.org/) to obtain known miRNAs
with software mirdeep2 v0.0.5 and srna-tools-cli (http://Srna-tools.cmp.uea.ac.uk/) (9–11).
The level of identified miRNAs was accessed by ‘transcripts per
million’ according to the following normalization formula: miRNA
expression level = mapped read counts × 1,000,000 /total read
counts (12). The DEGSeq R package
was used to identify the differentially expressed miRNAs, and
q-value (adjusted P-value) <0.01 and log2(fold change)>1 were
considered to be statistically significant. Target genes for
differentially expressed miRNAs were predicted using miRanda
(http://www.microrna.org/) (13). Finally, Kyoto Encyclopedia of Genes
and Genomes (KEGG) pathway analysis of DEGs was implemented with
KOBAS software v2.0, and corrected P<0.05 values were considered
to indicate statistically significant differences (14).
Determination of nasal mucosa
candidate mRNAs and miRNAs by reverse transcription-quantitative
polymerase chain reaction (RT-qPCR)
Total RNA and sRNA within nasal mucosa were
extracted using a total RNA/sRNA kit (Omega Bio-Tek, Inc.,
Norcross, GA, USA) according to the manufacturer's protocol.
RT-qPCR for sRNA was performed using the All-in-One™ qRT-PCR miRNA
Detection kit (GeneCopoeia, Inc., Rockville, MD, USA) according to
the manufacturer's protocol, and U6 served as the reference gene.
RT-qPCR for total RNA was performed using a commercial kit (Toyobo
Co., Ltd., Osaka, Japan) according to the manufacturer's protocol
and β-actin served as the reference gene. A melting curve was
performed to determine potential non-specific amplifications. The
relative expression level of candidate miRNAs or mRNAs was
calculated using the 2−ΔΔCq method (15). The primers used are presented in
Table I.
 | Table I.Primers used for reverse
transcription-quantitative polymerase chain reaction. |
Table I.
Primers used for reverse
transcription-quantitative polymerase chain reaction.
| mRNA | Sense | Sequence
(5′-3′) |
|---|
| IL-4
receptor-α | Forward |
5′-GTGCCCTTATTTACTTTCGG-3′ |
|
| Reverse |
5′-CTGGCTGTGGTGTTGCTT-3′ |
| Prostaglandin D2
synthase | Forward |
5′-TGCTGTGGATGGGTTTGG-3′ |
|
| Reverse |
5′-TTGAGTTGGAGGCGAGGC-3′ |
| Leukemia inhibitory
factor | Forward |
5′-AAGTTGGTGGAGCTGTATAGG-3′ |
|
| Reverse |
5′-AAGGCTTCTTTGTCAGAGTGGT-3′ |
| A20 | Forward |
5′-GCCTCACTTCCAGTATCCC-3′ |
|
| Reverse |
5′-CTTGCTTGTCCCTGCTCT-3′ |
| Nuclear receptor
subfamily 4, group A, member 1 | Forward |
5′-AAAATCCCTGGCTTCATTG-3′ |
|
| Reverse |
5′-AGGACCATGAACCCAAGT-3′ |
| Eotaxin-2 | Forward |
5′-GCTGCACGTCCTTTATTTCC-3′ |
|
| Reverse |
5′-TCTTATGGCCCTTCTTGGTG-3′ |
| IL-4 | Forward |
5′-CATCGGCATTTTGAACGAG-3′ |
|
| Reverse |
5′-TGGAAGCCCTACAGACAAGC-3′ |
| Interferon-γ | Forward |
5′-CTGCTGATGGGAGGAGATGT-3′ |
|
| Reverse |
5′-ATTTGTCATTCGGGTGTAGTCA-3′ |
| IL-5 | Forward |
5′-GGGCTTCCTGCTCCTATCTAA-3′ |
|
| Reverse |
5′-CAACCTTCTCTCTCCCCAAG-3′ |
| IL-13 | Forward |
5′-GAGGAGGGTTGAGGAGGAAG-3′ |
|
| Reverse |
5′-TTTCTGTAGGGATGGGATGG-3′ |
| IL-17 | Forward |
5′-CGGCTGACCCCTAAGAAAC-3′ |
|
| Reverse |
5′-CAGAAAAACAAACACGAAGCAG-3′ |
| Forkhead box
P3 | Forward |
5′-CCAGTGCCCATCCAATAAAC-3′ |
|
| Reverse |
5′-GTATCCGCTTTCTCCTGCTG-3′ |
| IL-10 | Forward |
5′-GGACAACATACTGCTAACCGACT-3′ |
|
| Reverse |
5′-TGGGGCATCACTTCTACCA-3′ |
Statistical analysis
Statistical comparisons of symptoms scores were
performed using one-way analysis of variance followed by the
Student-Newman-Keuls post hoc test, and RT-qPCR data were analyzed
using the Kruskal-Wallis test followed by pairwise multiple
comparisons. PASW Statistics 19.0 (IBM Corp., Armonk, NY, USA) was
used to perform all analyzes and P<0.05 was considered to
indicate a statistically significant difference. The data are
presented as means ± standard deviations.
Results
Animal model of AR evaluated by
symptom scores
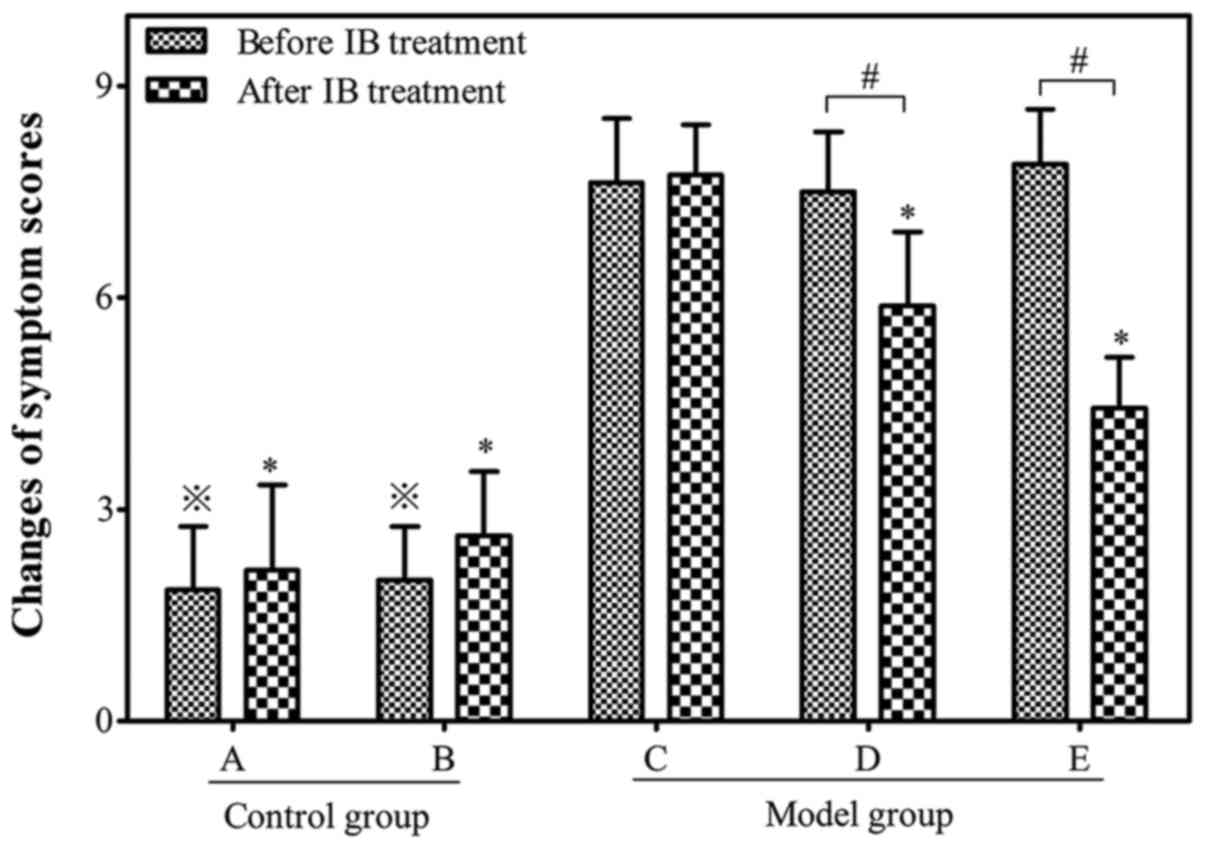
The number of sneezes, nasal itching and rhinorrhea
were observed in order to calculate the symptom scores of the
allergic mouse models (Fig. 2). A
successful mouse model of AR was determined by symptom scores
>5. By week 14, 27 of the 30 OVA-sensitized mice in the model
group had symptom scores >5. The average score was significantly
higher in the allergen-challenged model group than those in the
non-allergic control group prior to IB treatment (7.72±1.03 vs.
1.93±0.35; P<0.05).
Attenuation of allergic symptoms of AR
using anticholinergic drug IB
The symptom scores decreased significantly to
5.89±1.05 and 4.44±0.72 in the allergic mice of group D and E,
respectively following IB treatment when compared with group C
(7.63±0.92; P<0.05). The symptom scores of allergic mice in
group D were higher than those of group E following IB treatment,
indicating that IB pre-treatment may reduce the symptom scores in a
time-dependent manner (Fig.
2).
DEGs in nasal mucosa following IB
treatment
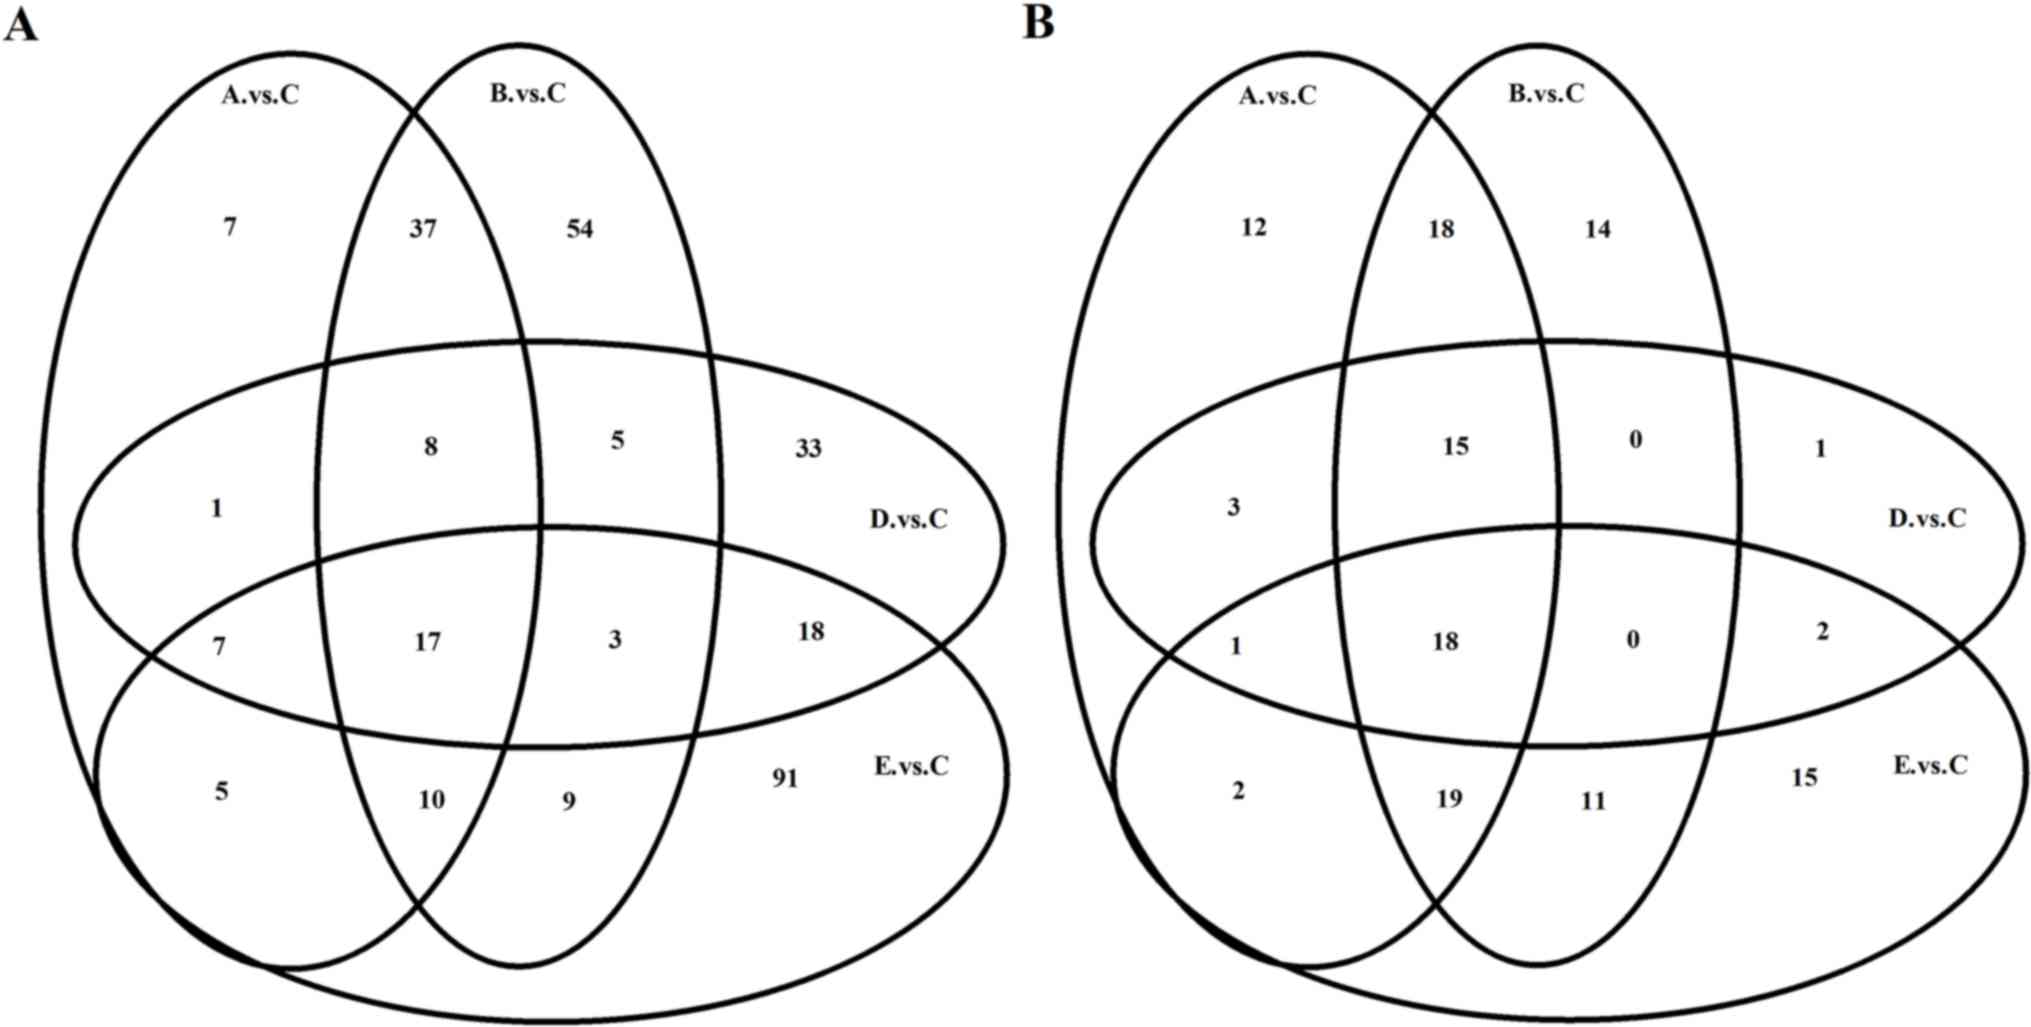
Compared with group C, 92 transcripts were
identified to be differentially expressed in the nasal mucosa of
allergic mice in group D, and 92, 143, and 160 transcripts in group
A, B, and E, respectively. Of which 81, 112, 67 and 116 transcripts
were upregulated, whereas 11, 31, 25 and 44 transcripts were
downregulated in the group A, B, D and E, respectively (data not
shown). The transcripts of the different groups overlap and the
Venn diagram for mRNA demonstrates the similarity in their
responses to IB treatment among the different groups (Fig. 3A). Notably, 207 mRNAs were
differentially expressed in the nasal mucosa of the allergic mice
that received IB treatment compared with the NS sham-treatment
(data not shown).
Compared with group C, various allergic-associated
genes changed their expression response to IB, which was validated
by RT-qPCR. IB treatment induced significant 23- and 30-fold
decreases in interleukin (IL)-4 receptor-α (IL-4Rα) mRNA expression
levels in groups D and E, respectively. Furthermore, 30- and
100-fold decreases in prostaglandin D2 synthase (PGDS) were
observed in groups D and E, respectively. Additionally, leukemia
inhibitory factor (LIF), tumor necrosis factor α-induced protein
3/A20 and nuclear receptor subfamily 4, group A, member 1 (NR4A1)
in group D exhibited significant 14-, 5- and 74-fold increases in
mRNA expression, respectively, and a 53-, 3- and 290-fold increase
in group E, respectively. The expression levels of IL-4Rα and PGDS
exhibited a decreasing tendency, whereas LIF and NR4A1 demonstrated
a tendency to increase following IB treatment (Fig. 4 and Table II).
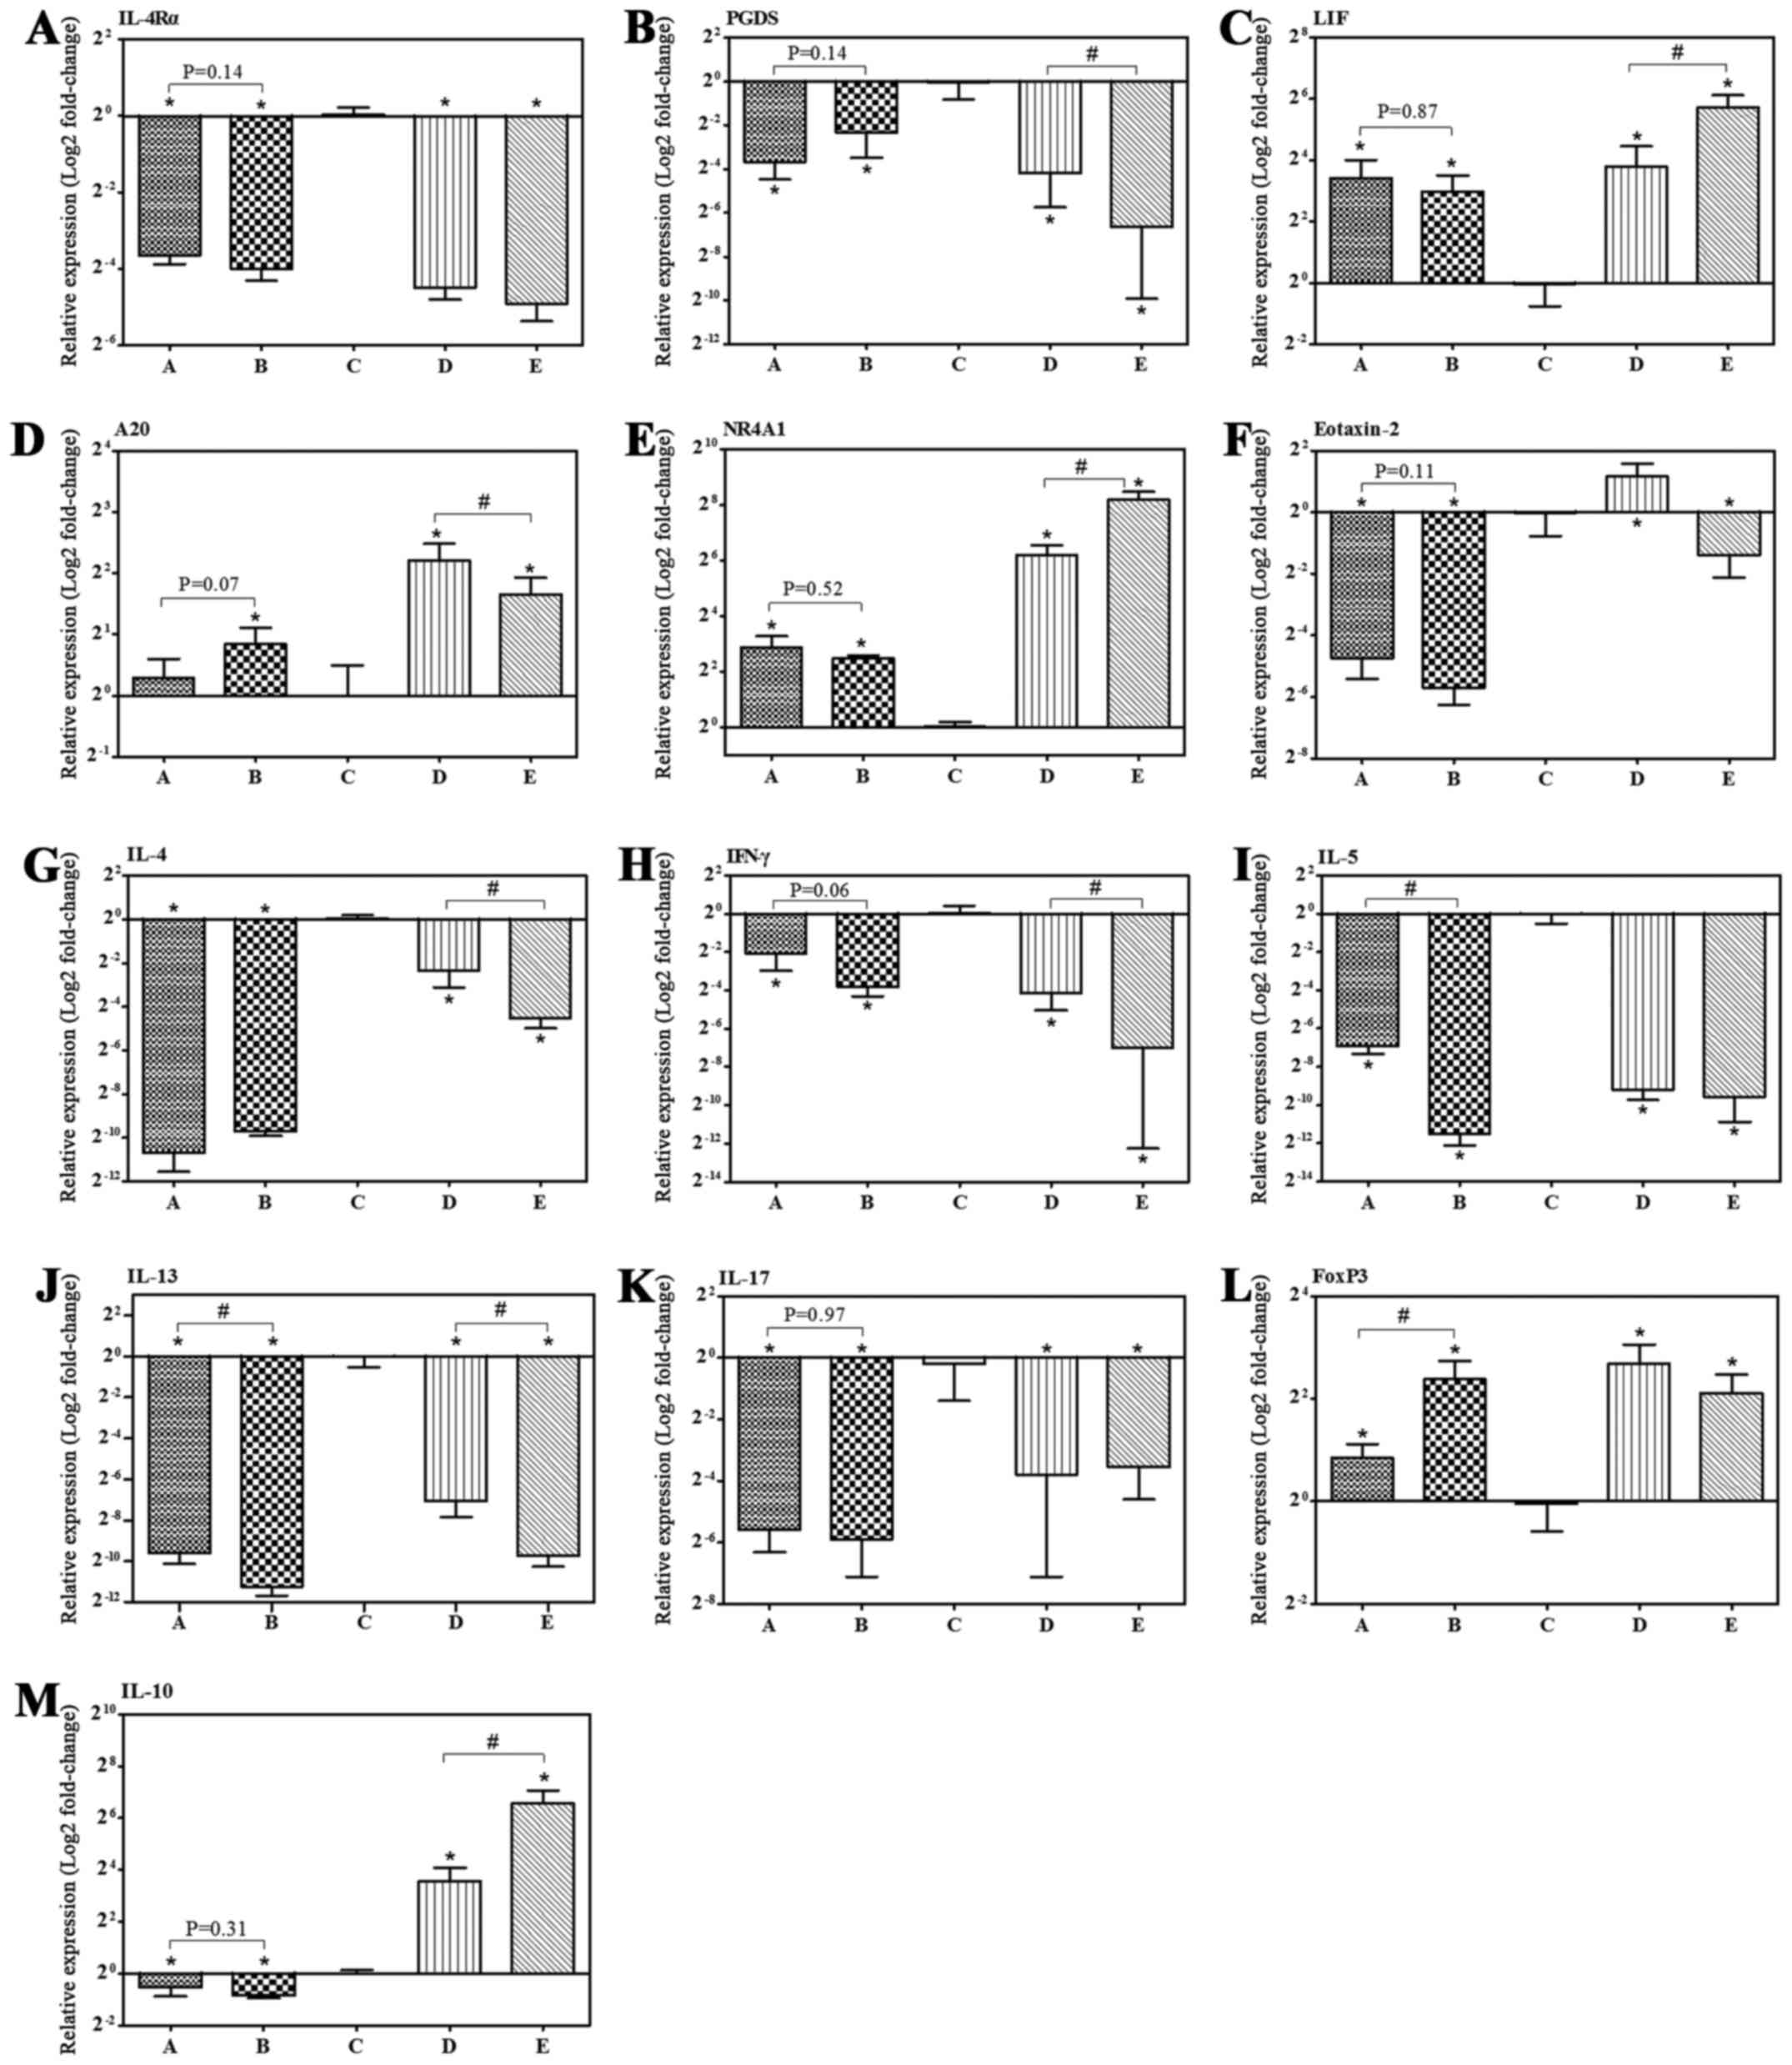 | Figure 4.IB treatment regulated mRNA
expression levels of allergic-associated genes. (A-M) The mRNA
expression level in nasal mucosa was determined by reverse
transcription-quantitative polymerase chain reaction with β-actin
as the reference gene. Control: Group A (n=7) and group B (n=8).
Model: Group C (n=8), group D (n=10) and group E (n=9). Data are
presented as the mean ± standard deviation. *P<0.05 vs. group C
following IB treatment; #P<0.05. IB, ipratropium
bromide; mRNA, messenger RNA; IL, interleukin; PGDS, prostaglandin
D2 synthase; LIF, leukemia inhibitory factor; A20, tumor necrosis
factor α-induced protein 3; NR4A1, nuclear receptor subfamily 4,
group A, member 1; IFN-γ, interferon-gamma; FoxP3, forkhead box
P3. |
| Table II.Fold change of differentially
expressed genes in the nasal mucosa of allergic mice post-treatment
with ipratropium bromide. |
Table II.
Fold change of differentially
expressed genes in the nasal mucosa of allergic mice post-treatment
with ipratropium bromide.
|
| Expression level
(RPKMa) | log2 (Fold
change)a |
|---|
|
|
|
|
|---|
| Gene
description | A | B | C | D | E | A/C | B/C | D/C | E/C |
|---|
| Interleukin 4
receptor-α | 66.08 | 62.76 | 64.87 | 37.37 | 28.08 | 0 | −0.03 | −0.9 | −1.34 |
| Prostaglandin D2
synthase | 112.15 | 161.23 | 101.91 | 62.51 | 34.47 | 0.01 | 0.47 | −0.66 | −1.69 |
| Leukemia inhibitory
factor | 10.42 | 10.28 | 10.16 | 18.05 | 26.86 | −0.1 | −0.18 | 0.73 | 1.27 |
| Tumor necrosis
factor α-induced protein 3 | 39.35 | 49.74 | 35.47 | 62.61 | 97.08 | 0.02 | 0.29 | 0.72 | 1.32 |
| Nuclear receptor
subfamily 4, group A, member 1 | 15.62 | 16.09 | 22.38 | 25.38 | 51.83 | −0.65 | −0.67 | 0.08 | 1.08 |
Interaction network analysis for DEGs
following IB treatment
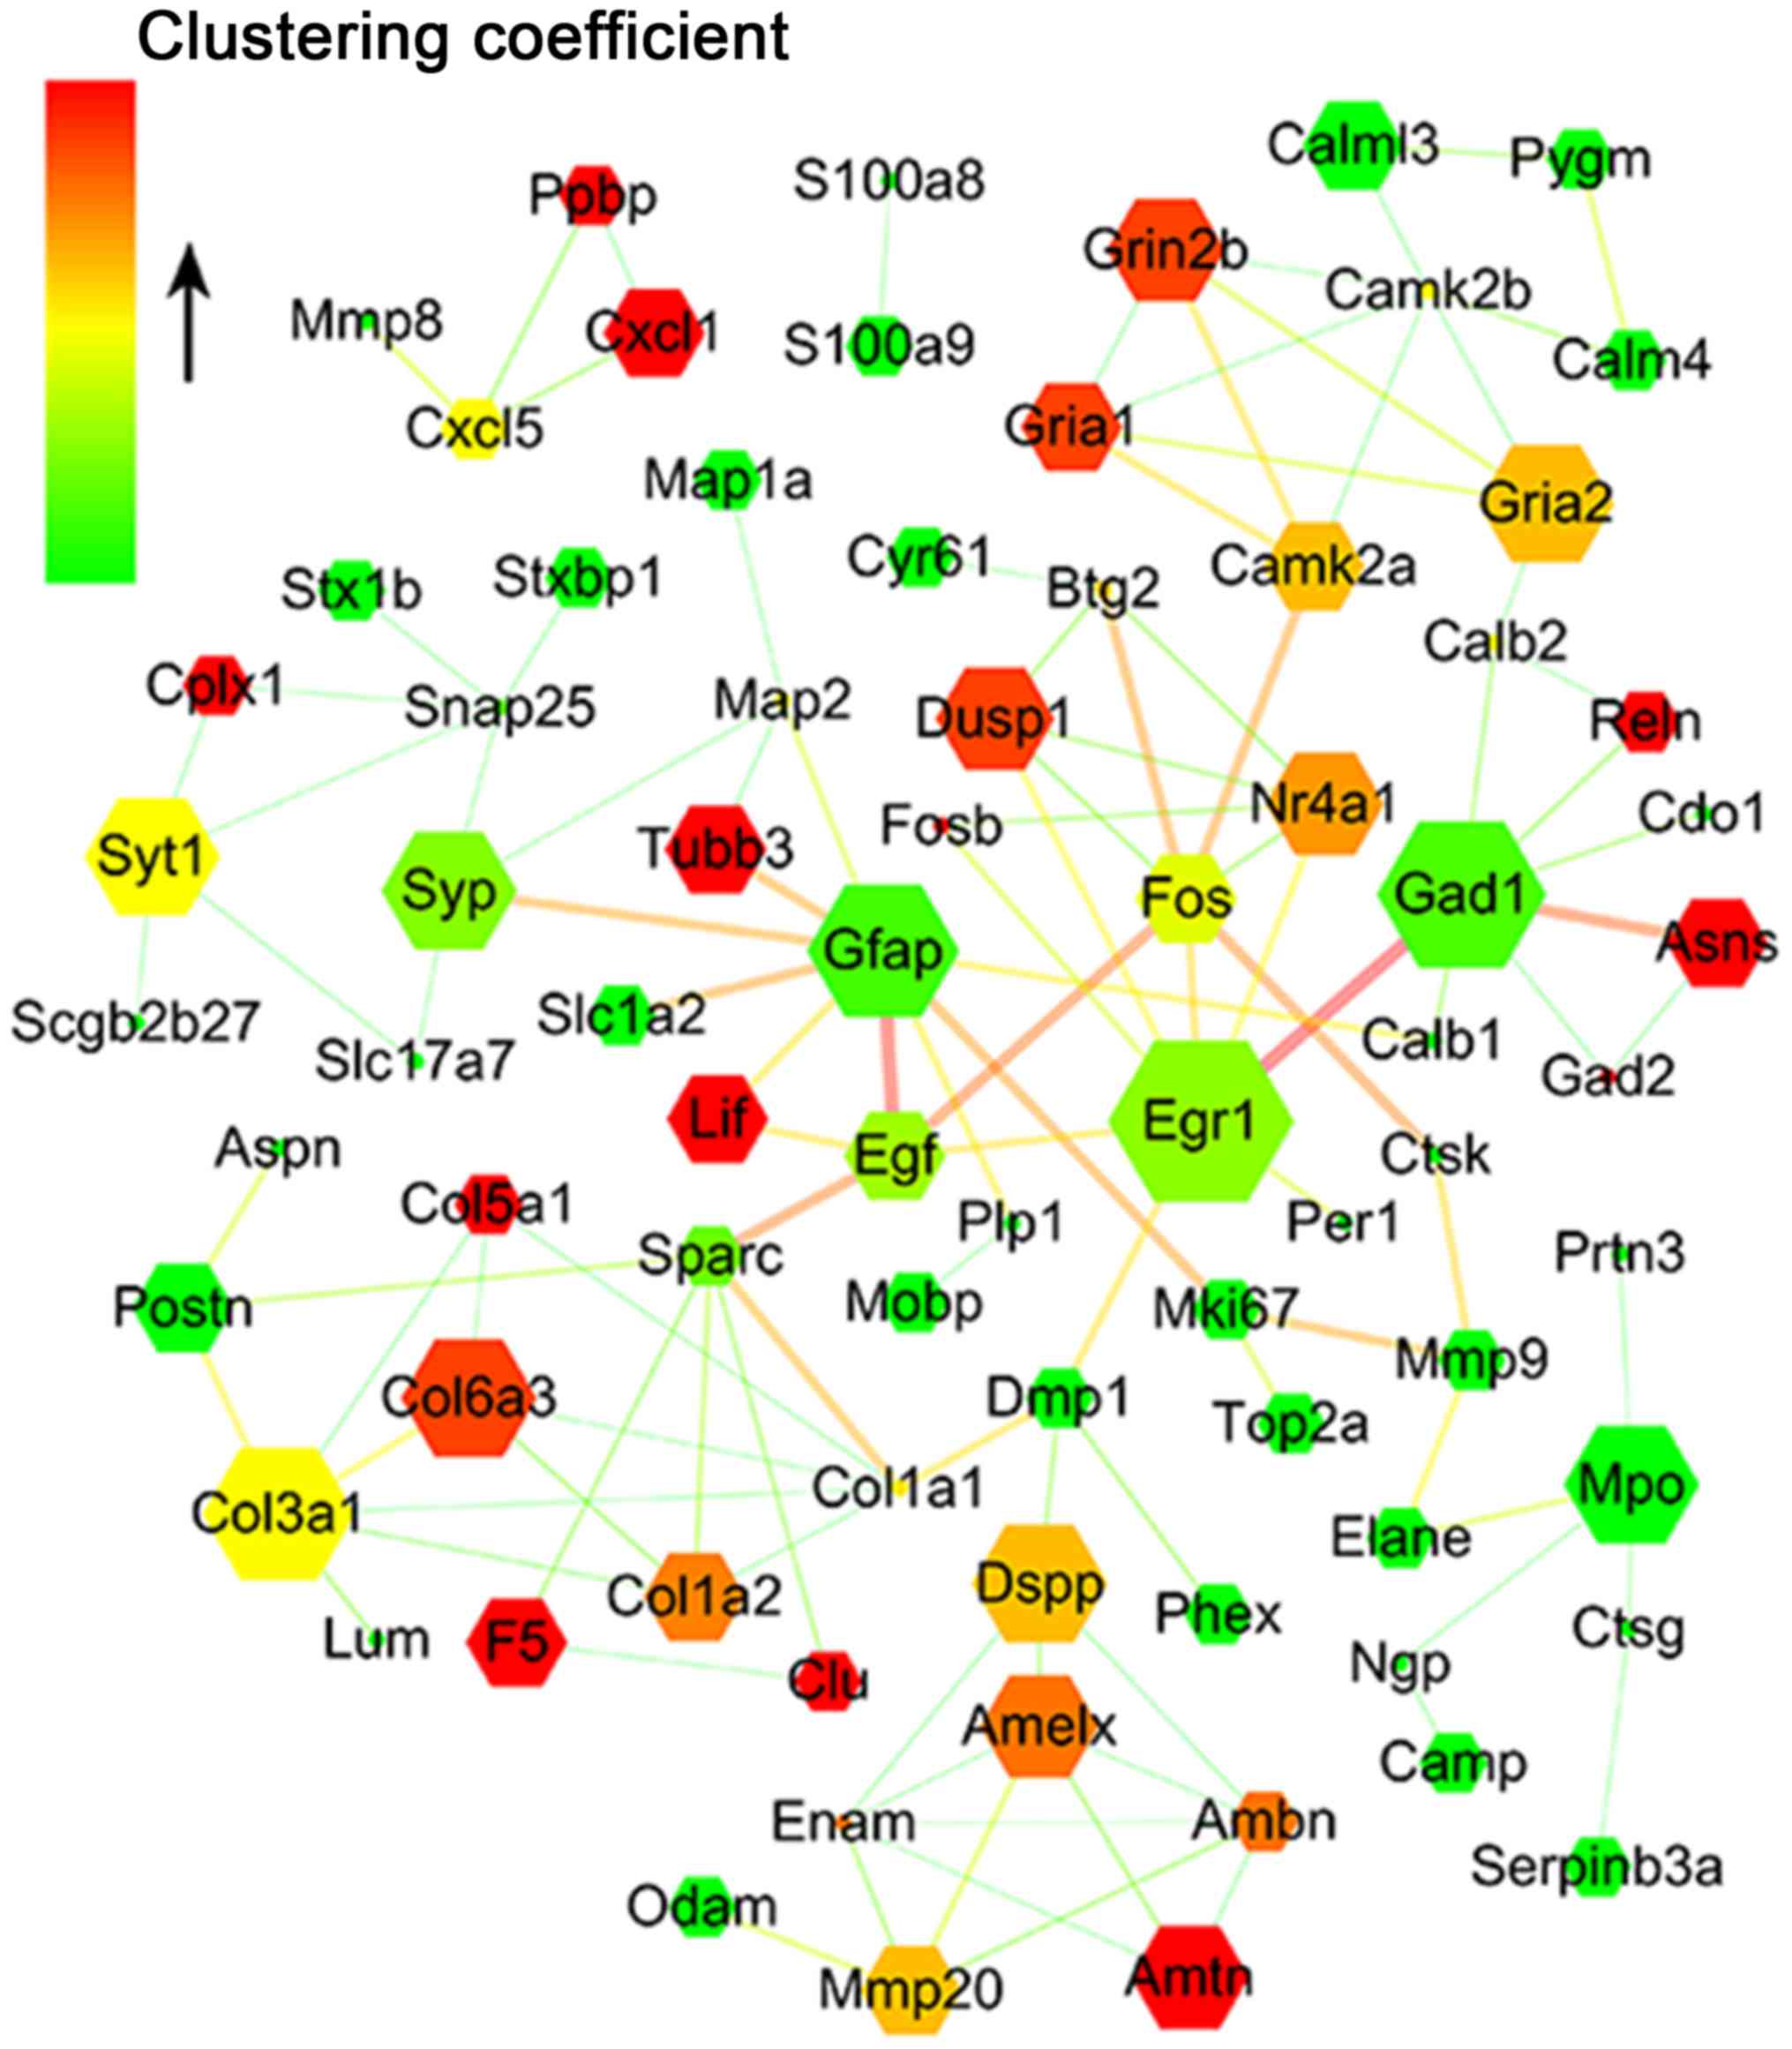
The interaction network for differentially expressed
transcripts was established based on the string score to
investigate the role and function of the DEG response to IB
treatment. Finally, a total of 162 transcripts were identified to
participate in the formation of the interaction network (Fig. 5). According to the network, a
series of the above-mentioned genes were associated with allergic
inflammation responses, and interacted in the network directly or
indirectly (data not shown). These gene products are located in the
cytoplasm (A20), nucleus [early growth response protein 1 (EGR-1),
dual-specificity phosphatase 1 (DUSP-1), serine (or cysteine)
peptidase inhibitor, clade B (ovalbumin), member 3A, Fos/FosB and
NR4A] or secreted into the extracellular space [LIF and chemokine
(C-X-C motif) ligand 1)], which may locally co-regulate the nasal
mucosa allergic immune response.
Differentially expressed miRNAs in the
nasal mucosa following IB treatment
The specific miRNA responses in nasal mucosa with AR
following treatment with IB were investigated. Compared with group
C, 40 miRNAs were identified to be differentially expressed in the
nasal mucosa of the allergic mice in group D, and 88, 95 and 68
miRNAs in group A, B, and E, respectively. Of which 60, 77, 31 and
40 miRNAs, respectively, were upregulated, and 28, 18, 9 and 28
miRNAs were downregulated in groups A, B, D and E, respectively
(data not shown). Similarly, there were overlaps in the miRNAs of
the different groups and the Venn diagram of the miRNAs
demonstrates the similarity of responses to IB treatment between
the different groups (Fig. 3B).
Notably, 87 miRNAs were differentially expressed in the nasal
mucosa of the allergic mice with IB treatment compared with the NS
sham-treatment (data not shown).
Prediction of potential target genes
of differentially expressed miRNAs and function analysis of
putative target genes
Based on the differentially expressed miRNAs induced
by IB treatment, the potential targets of these dysfunctional
miRNAs were identified, and the interaction between miRNAs and
corresponding predicted genes associated with allergic inflammation
were analyzed. IL-4Rα was identified to be potentially regulated by
mmu-miR-124-3p, −181a/b/c-5p, −128-3p, −129-5p, 129b-3p. In
addition, PGDS was predicted as the target gene of mmu-miR-378a-3p.
A20 was likely to be negatively regulated by mmu-miR-384-3p, −7b-5p
and −592-5p. mmu-miR-133a-3p, −133b-3p, −181a/b/c-5p, −138-5p and
−128-3p may be negative regulators of LIF, and mmu-miR-124-3p,
−138-5p and −200a/b-5p were expected to target NR4A1 (data not
shown). In order to further understand the role of these miRNAs,
their candidate targets underwent KEGG analysis. T/B cell receptor,
high-affinity IgE receptor (FcεRI) and neurotrophin signaling
pathways, as well as leukocyte transendothelial migration were
perceived as the most enriched pathways (data not shown).
Modulation of allergic
inflammation-associated genes expression by IB treatment
The microarray analysis identified a substantial
number of differentially expressed mRNAs and miRNAs with various
functions. The genes associated with allergic inflammation were
subsequently selected for further confirmation by RT-qPCR. Nasal
mucosa IL-4Rα, PGDS, LIF, A20 and NR4A1 mRNA expression responses
to IB were presented above, and are consistent with the microarray
analysis. Furthermore, no significant differences in IL-4Rα, PGDS,
LIF, A20 and NR4A1 mRNA expression levels were identified between
group A and B (Fig. 4). In
addition, we have determined the mRNA expression of Th2
response-promoting or -restraining genes, which were not in
included in the aforementioned DEGs. The mRNA expression levels in
response to IB treatment in the nasal mucosa of allergic mice for
forkhead box P3 (FOXP3), IL-10 and eotaxin-2 (termed C-C motif
chemokine ligand 24; CCL24) increased, whereas those for interferon
(IFN)-γ, IL-4, IL-5, IL-13 and IL-17 decreased (Fig. 4).
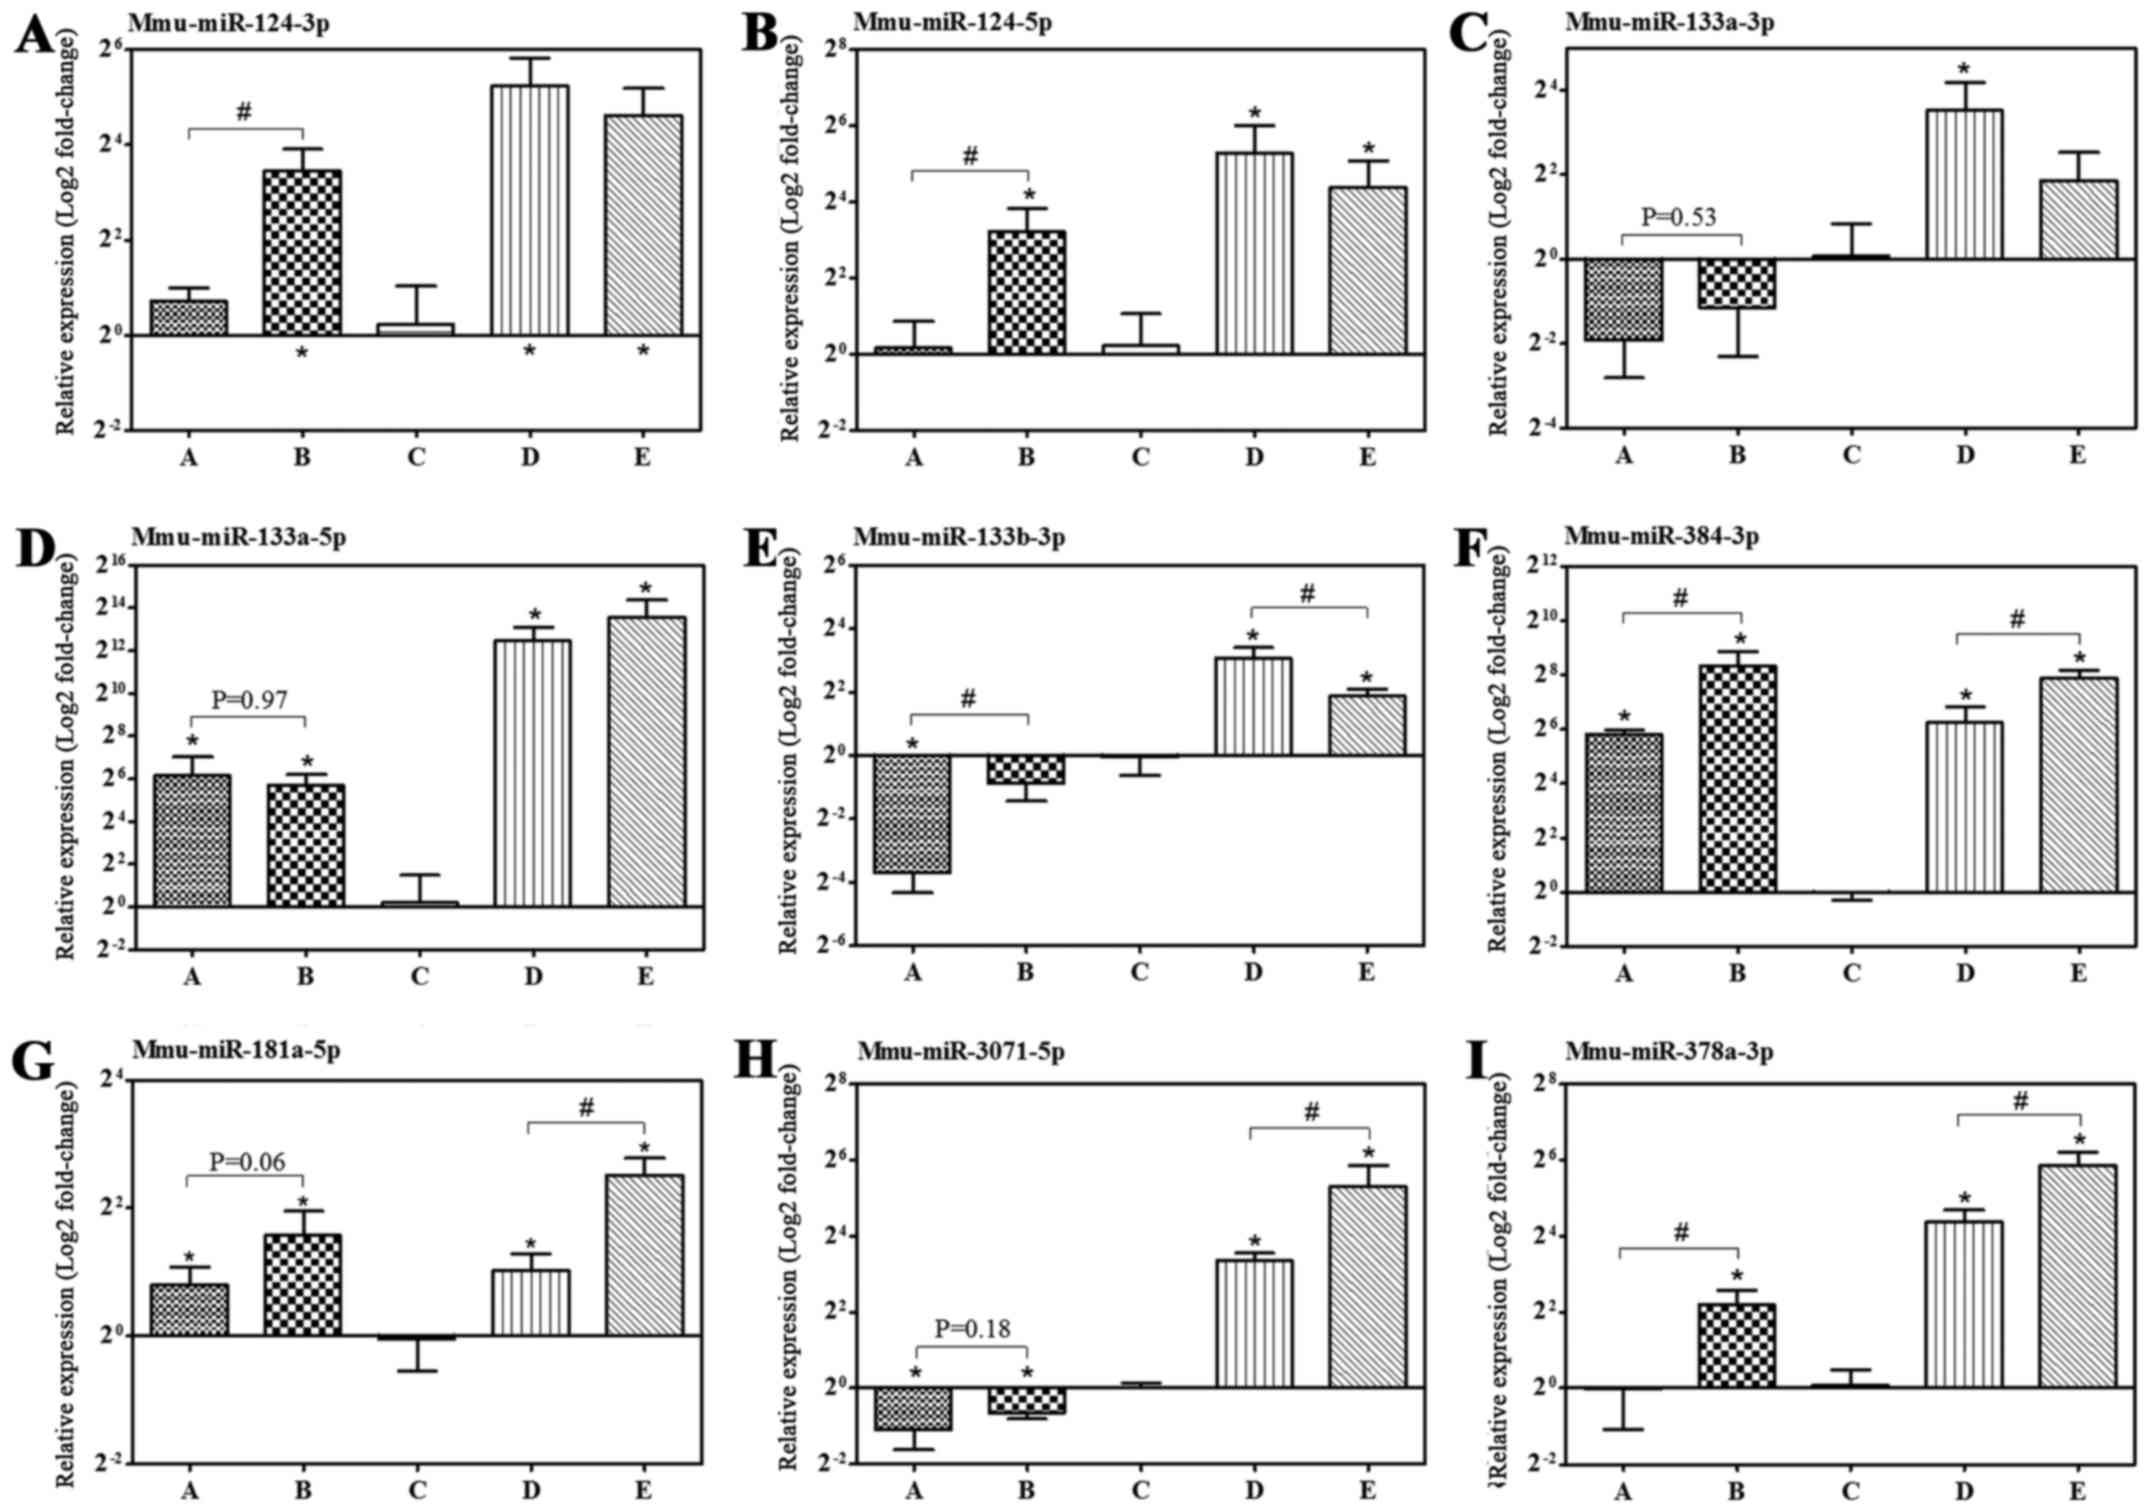
Furthermore, the expression levels of miRNAs
targeting the above-mentioned corresponding putative genes were
confirmed by RT-qPCR. The expression levels of mmu-miR-124-3p/5p,
−133a-5p, −384-3p, −181a-5p, −378a-3p and −3071-5p in the nasal
mucosa of allergic mice increased by IB treatment compared with the
NS sham-treatment group, which are consistent with the observations
of microarray analysis, apart from mmu-miR-378a-3p (Fig. 6 and Table III).
| Table III.Differentially expressed nasal mucosa
miRNAs in allergic mice post-treatment with ipratropium
bromide. |
Table III.
Differentially expressed nasal mucosa
miRNAs in allergic mice post-treatment with ipratropium
bromide.
|
| Expression level
(TPM) | log2 (Fold
change)a |
|---|
|
|
|
|
|---|
| miRNA | A | B | C | D | E | A/C | B/C | D/C | E/C |
|---|
| mmu-miR-124-3p | 293.5 | 377.3 | 4.4 | 101.4 | 14.4 | 5.6 | 5.9 | 4.5 | 1.2 |
| mmu-miR-124-5p | 26.8 | 32.6 | 0.3 | 10 | 1.2 | 5.9 | 6.1 | 4.9 | 1.3 |
|
mmu-miR-133a-3p | 755.3 | 964.6 | 16.3 | 72.6 | 1,272.6 | 5.1 | 5.4 | 2.2 | 5.8 |
|
mmu-miR-133a-5p | 48.9 | 55.9 | 0.7 | 2.4 | 60.1 | 5.7 | 5.8 | 1.8 | 5.9 |
|
mmu-miR-133b-3p | 46.5 | 47.9 | 1.7 | 5.3 | 74.9 | 4.4 | 4.3 | 1.7 | 4.9 |
| mmu-miR-138-5p | 69 | 93.6 | 6.1 | 23.8 | 22.8 | 3.1 | 3.4 | 2 | 1.4 |
|
mmu-miR-181a-5p | 2,114.3 | 2,962.1 | 967.2 | 1,279.7 | 2,957.1 | 0.7 | 1.1 | 0.4 | 1.1 |
|
mmu-miR-181b-5p | 364.9 | 453.5 | 139.3 | 223.3 | 493.2 | 1 | 1.2 | 0.7 | 1.3 |
|
mmu-miR-181c-5p | 28.7 | 32.2 | 4.1 | 4.4 | 35.7 | 2.4 | 2.5 | 0.1 | 2.6 |
|
mmu-miR-181d-5p | 102.7 | 87.2 | 33.2 | 45.2 | 95 | 1.2 | 0.9 | 0.5 | 1 |
| mmu-miR-1a-3p | 18,773.7 | 21,540.8 | 728.6 | 4,349.9 | 21,603.1 | 4.3 | 4.4 | 2.6 | 4.4 |
| mmu-miR-1b-5p | 18,757.4 | 21,523.9 | 727.9 | 4,348.7 | 21,586.7 | 4.3 | 4.4 | 2.6 | 4.4 |
| mmu-miR-206-3p | 79.1 | 99.1 | 2.4 | 19.7 | 165.9 | 4.6 | 4.9 | 3.1 | 5.6 |
|
mmu-miR-3071-3p | 39.2 | 83.8 | 6.1 | 24.4 | 41.7 | 2.3 | 3.3 | 2 | 2.2 |
|
mmu-miR-3071-5p | 178 | 160.1 | 15.2 | 74.6 | 82.5 | 3.1 | 2.9 | 2.3 | 1.9 |
|
mmu-miR-378a-3p | 3,206.9 | 4,143.5 | 6,531.4 | 4,011.7 | 3,798.9 | −1.5 | −1.2 | −0.7 | −1.3 |
| mmu-miR-378c | 529.6 | 558.1 | 900.1 | 408.4 | 618.3 | −1.2 | −1.2 | −1.1 | −1.1 |
| mmu-miR-384-3p | 14.3 | 17.8 | 0.3 | 9.1 | 2.4 | 5 | 5.2 | 4.8 | 2.3 |
| mmu-miR-384-5p | 12.8 | 12.7 | 0.3 | 6.2 | 1.2 | 4.8 | 4.7 | 4.2 | 1.3 |
Discussion
AR is an inflammatory disorder within the nasal
mucosa. Currently, correlation between the immune and nervous
systems in AR have gained substantial attention. IB is a
nonselective anticholinergic agent and its anti-inflammatory effect
may function via muscarinic acetylcholine receptors (mAChRs)
(16). In the current study, the
effects of mAChR antagonist, IB on nasal mucosa allergic-associated
inflammation were investigated by microarray analysis of the
transcriptome and miRNAome in a mouse model of AR induced by OVA.
Treatment with IB mitigated the nasal mucosa allergic symptoms
induced by OVA challenge. IB treatment significantly modulated the
expression levels of multiple mRNAs and miRNAs. IL-4Rα and PGDS
mRNA expression levels were downregulated, and LIF, A20 and NR4A1
mRNA expression levels were upregulated. mmu-miR-124-3p/5p,
−133a-5p, −384-3p, −181a-5p, −138-5p and −3071-5p expression levels
increased, while the mmu-miR-378a-5p expression level decreased.
Furthermore, IB treatment promoted or inhibited the cytokine mRNA
level of particular CD4+ T cell subpopulations, and
enhanced FOXP3 and CCL24 mRNA expression levels. These observations
indicate the involvement of IB in modulating upper airway allergic
inflammation, influencing regulatory T cell (Treg)
differentiation and eosinophil chemotaxis.
The immunoregulatory effect of IB was previously
demonstrated in a mouse model of allergic nasal mucosa
inflammation, which highlighted the inhibition of IL-4 production,
the increase in FOXP3 expression level and reduction of eosinophil
infiltration (1). However, the
present study profiled allergic nasal mucosa mRNA and miRNA
expression levels in response to IB treatment, which indicated the
beneficial effect of IB on nasal mucosa allergic inflammation
partially via a complex immune mechanism involved in various
allergic reaction-associated candidate genes.
IL-4/-13 were pivotal in allergic inflammation
(17). In the present study, IB
treatment significantly decreased the OVA-triggered upper airway
IL-4 and IL-13 mRNA expression levels, which was consistent with
the previous study (1). IL-4Rα, a
common subunit shared by IL-4R and IL-13R, which is responsible for
IL-4/IL-13 pathway signal transduction (18,19),
exhibited a decreased mRNA expression level in the nasal mucosa
following IB treatment compared with the NS-sham treatment.
Therefore, IB treatment appeared to inhibit nasal allergic
inflammation via a dual mechanism with decreased IL-4/IL-13
expression levels and reduced IL-4/IL-4Rα and IL-13/IL-4Rα
signaling. The percentage of IFN-γ-expressing cells within the
nasal mucosa of allergic mice remained unchanged following IB
treatment for two weeks (1),
whereas the IFN-γ mRNA expression level decreased following IB
treatment for two or four weeks. The discrepancy may partially be
attributed to the prolonged OVA intranasal challenge in the present
study. Repetitive OVA exposure induced eosinophil accumulation
within the nasal mucosa (20).
Furthermore, IL-5 acted synergistically with eotaxins leading to
airway eosinophilia, and IB indeed inhibited eosinophil
infiltration in the nasal mucosa via an undefined mechanism
(1). The present study
demonstrated that the IL-5 mRNA expression level decreased,
although the CCL24 mRNA expression level increased significantly
following IB treatment. Considering that eotaxins primarily account
for eosinophil tissue recruitment (21), the current observations indicate
the potential mechanism for the decreased nasal mucosa eosinophil
count (22).
Th17/Treg cell imbalance has
been associated with airway allergic inflammation (23,24).
A previous study demonstrated that the FOXP3+
Treg cell count in the nasal mucosa of allergic mice
increased significantly following IB treatment (1), which was consistent with the current
results of enhanced nasal mucosa FOXP3 mRNA expression following IB
treatment. Furthermore, IB inhibited the nasal mucosa IL-17 mRNA
expression level and increased the IL-10 mRNA expression level,
which are predominantly secreted by IL-10-producing
Treg1 cells (25). The
LIF/IL-6 axis formed opposing feed-forward loops at the
Th17/Treg axis. LIF directly promoted FOXP3
expression levels and simultaneously repressed retinoic
acid-related orphan receptor-γt expression levels, resulting in the
increased expansion of inducible FOXP3+ Treg
(iTreg) cells; however, IL-6 demonstrated the opposite effect,
leading to impaired LIF signaling and enhanced Th17 cell
development (26,27). Allergic mice with IB treatment
exhibited significantly elevated LIF mRNA expression levels and
concomitant decreasing IL-17 mRNA expression levels compared with
the NS sham treatment group, which indicated the role of IB in
modulation of the LIF/IL-6 axis and the subsequent
Th17/Treg axis.
Th17/Treg axis imbalance was observed in the
present study and regarded as a promising therapeutic target for AR
(23). NR4A receptors promoted
Treg differentiation by directly enhancing the
transcription of FOXP3, and NR4A deficiency within Tregs
induced an augmented conversion to cells with a Th2-like
phenotype due to impaired depression of IL-4 expression levels
(28–30). The current study demonstrated that
nasal mucosa NR4A1 mRNA expression levels were significantly
upregulated by IB treatment.
Communication between barrier epithelial cells (ECs)
and dendritic cells determined the outcome of local immune
responses to allergens, and A20 expressed in ECs markedly
ameliorated allergic reactions (31). A20, as an inhibitor of nuclear
factor-κB signaling, attenuated IL-5 and IL-13 expression levels,
as well as the eotaxin level within bronchoalveolar fluid induced
by OVA challenge (32). The
present study demonstrated that nasal mucosa A20 levels
significantly increased, whereas IL-5 and IL-13 mRNA expression
levels significantly decreased, subsequent to IB treatment in
allergic mice. Thus, IB treatment may modulate various allergic
immune-associated candidate genes leading to resolution of allergic
inflammation.
In the present study IB significantly attenuated the
nasal allergic symptoms of sneezing, watery rhinorrhea and nasal
itching. However, the symptom scores of allergic mice were >5
despite IB treatment. Nasal hyper-responsiveness, such as enhanced
sneezing response to allergens in allergic mice was dependent on
allergen-specific CD4+ T cells (33). Presumably, IB partially inhibited,
rather than completely abrogated, the allergen-specific
CD4+ T cell response. Nsal congestion was not evaluated
in the current study. However, the PGDS, associated with induction
of late-phase nasal blockage (34,35),
exhibited markedly decreased mRNA expression levels in the nasal
mucosa following IB treatment. Whether the IB-induced decrease in
PGDS, and even subsequent PGD2 production, improved nasal
obstruction requires further investigation. Furthermore, A20
attenuates OVA-induced airway hyper-responsiveness and mucus
production (32), which may
account for the IB-mediated improved nasal symptoms.
To investigate the potential function of DEGs by IB,
PPI networks were constructed in the present study. Multiple
allergic inflammation response-associated genes coexisted within
the PPI regulatory network. Among them, NR4A1, dual specificity
phosphatase 1 (DUSP-1), Fos, FosB, early growth response 1 (EGR-1),
epidermal growth factor (EGF) and LIF interconnected in a direct or
indirect manner. Reduced EGR-1 and/or DUSP-1 expression levels in
the nasal epithelium resulted in prolonged activated response to
allergens (36). Increased DUSP-1
expression levels in airway ECs enhanced the anti-inflammatory
effect of glucocorticoids (37)
and DUSP-1 knockout mast cells demonstrated an enhanced
degranulation response (38).
EGR-1 expressed in Th2 cells directly increased T cell
receptor-induced IL-4 transcription (39). However, EGR-1 deficiency impaired
IL-13-induced inflammatory responses and EGR-1-deficient mast cells
demonstrated reduced stem cell factor-induced IL-13 expression
levels (40). Indeed, IB treatment
increased nasal mucosa NR4A1, LIF, DUSP-1 and EGR-1 expression
levels. Although the current study does not clarify the mechanism
by which IB modulates the expression levels of the above-mentioned
genes, the network implied that the expression levels of these
allergic response-associated candidate genes changed in response to
IB in the nasal mucosa in a specific manner, which may jointly
affect the local immune status; however, this requires further
investigation.
Dysregulation of nasal mucosa miRNAs is associated
with an allergen-induced Th2-polarized immune response
(41). However, which miRNAs are
directly implicated in the upper airway allergic inflammation was
poorly understood. In the current study, the expression levels of
various miRNAs in the nasal mucosa of allergic mice were
demonstrated to change significantly in response to IB
treatment.
miR-124 positively modulated neuropilin-1-expressing
cell responsiveness to semaphorin-3A, which alleviated allergic
nasal symptoms (42,43). Methyl CpG binding protein 2-induced
miR-124 promoted the Th1 response via signal transducer
and activator of transcription (STAT)1/STAT3 derepression due to
miR-124-mediated reduced expression of suppressor of cytokine
signaling 5 (44). The nasal
mucosa miR-124 expression level in allergic mice was significantly
upregulated with intranasal IB. A decreased miR-384 expression
level was observed in allergic inflammation and miR-384 mitigated
allergic inflammation by inhibiting the level of histone
deacetylase 3 (HDAC3) expression (45,46).
In the present study, the nasal mucosa miR-384 expression level in
allergic mice was undetectable following OVA challenge, but
increased significantly following IB treatment, which is consistent
with a previous study (45).
Notably, HDAC3 downregulated miR-384 expression forming the
negative feedback loop of miR-384/HDAC3, which appeared to be a
candidate target for allergic inflammation resolution (47).
The canonical myomiRs (miR-1, −133a/b and −206) are
expressed in the nasal mucosa. These miRNA levels in the nasal
mucosa of allergic mice were significantly increased by IB
treatment, and OVA challenge decreased the level of nasal mucosa
miR-133a expression. Circulating miR-206 and miR-133b expression
levels were regarded as biomarkers for allergic and asthmatic
status (48), whereas miR-133b and
miR-206 co-expression in CD4+ T cells were deemed to be
specific for Th17 cells (49). The role and function of miR-133b
and miR-206 expression requires further investigation. Furthermore,
the allergic mice in the present study exhibited a declined nasal
mucosa miR-181a expression level, which was consistent with a
previous study (50). IB treatment
markedly increased the local level of miR-181a, which may
negatively regulate allergic inflammation by targeting osteopontin
and transglutaminase II (51).
Taken together, IB treatment may modulate the expression levels of
various immune-associated candidate miRNAs in the nasal mucosa,
which downregulate the allergic inflammation directly or
indirectly. However, further studies are required to elucidate the
molecular mechanism underlying altered miRNA expression levels.
Subsequently, the putative target gene of these differentially
expressed miRNAs were predicted using bioinformatics. Unexpectedly,
allergic response-associated genes, such as IL-4Rα, PGDS, A20, LIF
and NR4A1 were identified as putative target gene of these miRNAs.
Furthermore, the miRNA putative target gene-KEGG pathway analysis
indicated IB treatment-induced changes in the miRNA transcriptome
influenced a broad range of cellular signaling pathways. Among
them, T/B cell receptor, FcεRI and neurotrophins, and leukocyte
transendothelial migration signaling pathways are perceived as the
most enriched pathways. These miRNAs may present as potential novel
targets for anti-allergic therapy, which require further
investigation focused on their effects on allergic
inflammation.
In conclusion, the present study demonstrated the
effect of IB treatment on the nasal mucosa mRNA transcriptome and
miRNA profile in allergic mice induced by OVA. A unique panel of
differentially expressed miRNAs and mRNAs implicated in the
Th2 immune response were identified. Furthermore, IB
treatment was shown to downregulate the expression levels of
Th2 cytokines, and upregulate the expression levels of
FOXP3 and IL-10 locally, which may account for the IB-elicited
ameliorated nasal allergic symptoms. In addition, IB or other mAChR
antagonists may be beneficial for the treatment of AR.
Acknowledgements
The present study was supported by Funds from the
Hunan Scientific Plan in China (grant no. S2013F1023). The authors
would like to thank the staff at Beijing Novogene Bioinformatics
Technology Co., Ltd for their help with high-throughput RNA
sequencing and their technical assistance during the bioinformatics
analysis.
References
|
1
|
Daoud A, Xie Z, Ma Y, Wang T and Tan G:
Changes of T-helper type 1/2 cell balance by anticholinergic
treatment in allergic mice. Ann Allergy Asthma Immunol.
112:249–255. 2014. View Article : Google Scholar : PubMed/NCBI
|
|
2
|
Teng Y, Zhang R, Liu C, Zhou L, Wang H,
Zhuang W, Huang Y and Hong Z: miR-143 inhibits
interleukin-13-induced inflammatory cytokine and mucus production
in nasal epithelial cells from allergic rhinitis patients by
targeting IL13Rα1. Biochem Biophys Res Commun. 457:58–64. 2015.
View Article : Google Scholar : PubMed/NCBI
|
|
3
|
Lu TX and Rothenberg ME: Diagnostic,
functional, and therapeutic roles of microRNA in allergic diseases.
J Allergy Clin Immunol. 132:3–14. 2013. View Article : Google Scholar : PubMed/NCBI
|
|
4
|
Ogoda M, Niiya R, Koshika T and Yamada S:
Comparative characterization of lung muscarinic receptor binding
after intratracheal administration of tiotropium, ipratropium, and
glycopyrrolate. J Pharmacol Sci. 115:374–382. 2011. View Article : Google Scholar : PubMed/NCBI
|
|
5
|
Anders S, Pyl PT and Huber W: HTSeq-a
Python framework to work with high-throughput sequencing data.
Bioinformatics. 31:166–169. 2015. View Article : Google Scholar : PubMed/NCBI
|
|
6
|
Wang L, Feng Z, Wang X and Zhang X:
DEGseq: An R package for identifying differentially expressed genes
from RNA-seq data. Bioinformatics. 26:136–138. 2010. View Article : Google Scholar : PubMed/NCBI
|
|
7
|
Shannon P, Markiel A, Ozier O, Baliga NS,
Wang JT, Ramage D, Amin N, Schwikowski B and Ideker T: Cytoscape: A
software environment for integrated models of biomolecular
interaction networks. Genome Res. 13:2498–2504. 2003. View Article : Google Scholar : PubMed/NCBI
|
|
8
|
Langmead B, Trapnell C, Pop M and Salzberg
SL: Ultrafast and memory-efficient alignment of short DNA sequences
to the human genome. Genome Biol. 10:R252009. View Article : Google Scholar : PubMed/NCBI
|
|
9
|
Griffiths-Jones S, Saini HK, van Dongen S
and Enright AJ: miRBase: Tools for microRNA genomics. Nucleic Acids
Res. 36(Database issue): D154–D158. 2008.PubMed/NCBI
|
|
10
|
Friedländer MR, Chen W, Adamidi C,
Maaskola J, Einspanier R, Knespel S and Rajewsky N: Discovering
microRNAs from deep sequencing data using miRDeep. Nat Biotechnol.
26:407–415. 2008. View
Article : Google Scholar : PubMed/NCBI
|
|
11
|
Moxon S, Schwach F, Dalmay T, Maclean D,
Studholme DJ and Moulton V: A toolkit for analysing large-scale
plant small RNA datasets. Bioinformatics. 24:2252–2253. 2008.
View Article : Google Scholar : PubMed/NCBI
|
|
12
|
Zhou L, Chen J, Li Z, Li X, Hu X, Huang Y,
Zhao X, Liang C, Wang Y, Sun L, et al: Integrated profiling of
microRNAs and mRNAs: microRNAs located on Xq27.3 associate with
clear cell renal cell carcinoma. PLoS One. 5:e152242010. View Article : Google Scholar : PubMed/NCBI
|
|
13
|
John B, Enright AJ, Aravin A, Tuschl T,
Sander C and Marks DS: Human MicroRNA targets. PLoS Biol.
2:e3632004. View Article : Google Scholar : PubMed/NCBI
|
|
14
|
Wu J, Mao X, Cai T, Luo J and Wei L: KOBAS
server: A web-based platform for automated annotation and pathway
identification. Nucleic Acids Res. 34(Web Server issue): W720–W724.
2006. View Article : Google Scholar : PubMed/NCBI
|
|
15
|
Arocho A, Chen B, Ladanyi M and Pan Q:
Validation of the 2-DeltaDeltaCt calculation as an alternate method
of data analysis for quantitative PCR of BCR-ABL P210 transcripts.
Diagn Mol Pathol. 15:56–61. 2006. View Article : Google Scholar : PubMed/NCBI
|
|
16
|
Kistemaker LE, Bos ST, Mudde WM, Hylkema
MN, Hiemstra PS, Wess J, Meurs H, Kerstjens HA and Gosens R:
Muscarinic M3 receptors contribute to allergen-induced airway
remodeling in mice. Am J Respir Cell Mol Biol. 50:690–698. 2014.
View Article : Google Scholar : PubMed/NCBI
|
|
17
|
Oeser K, Maxeiner J, Symowski C, Stassen M
and Voehringer D: T cells are the critical source of IL-4/IL-13 in
a mouse model of allergic asthma. Allergy. 70:1440–1449. 2015.
View Article : Google Scholar : PubMed/NCBI
|
|
18
|
Wei Q, Sha Y, Bhattacharya A, Fattah E
Abdel, Bonilla D, Jyothula SS, Pandit L, Hershey GK Khurana and
Eissa NT: Regulation of IL-4 receptor signaling by STUB1 in lung
inflammation. Am J Respir Crit Care Med. 189:16–29. 2014.PubMed/NCBI
|
|
19
|
Moshkovits I, Karo-Atar D, Itan M,
Reichman H, Rozenberg P, Morgenstern-Ben-Baruch N, Shik D,
Ejarque-Ortiz A, Hershko AY, Tian L, et al: CD300f associates with
IL-4 receptor α and amplifies IL-4-induced immune cell responses.
Proc Natl Acad Sci USA. 112:8708–8713. 2015; View Article : Google Scholar : PubMed/NCBI
|
|
20
|
Liang MJ, Fu QL, Jiang HY, Chen FH, Chen
D, Chen DH, Lin ZB and Xu R: Immune responses to different patterns
of exposure to ovalbumin in a mouse model of allergic rhinitis. Eur
Arch Otorhinolaryngol. 273:3783–3788. 2016. View Article : Google Scholar : PubMed/NCBI
|
|
21
|
Nussbaum JC, Van Dyken SJ, von Moltke J,
Cheng LE, Mohapatra A, Molofsky AB, Thornton EE, Krummel MF, Chawla
A, Liang HE and Locksley RM: Type 2 innate lymphoid cells control
eosinophil homeostasis. Nature. 502:245–248. 2013. View Article : Google Scholar : PubMed/NCBI
|
|
22
|
Pope SM, Brandt EB, Mishra A, Hogan SP,
Zimmermann N, Matthaei KI, Foster PS and Rothenberg ME: IL-13
induces eosinophil recruitment into the lung by an IL-5- and
eotaxin-dependent mechanism. J Allergy Clin Immunol. 108:594–601.
2001. View Article : Google Scholar : PubMed/NCBI
|
|
23
|
Zhao J, Lloyd CM and Noble A: Th17
responses in chronic allergic airway inflammation abrogate
regulatory T-cell-mediated tolerance and contribute to airway
remodeling. Mucosal Immunol. 6:335–346. 2013. View Article : Google Scholar : PubMed/NCBI
|
|
24
|
Huang X, Chen Y, Zhang F, Yang Q and Zhang
G: Peripheral Th17/Treg cell-mediated immunity imbalance in
allergic rhinitis patients. Braz J Otorhinolaryngol. 80:152–155.
2014.(In English, Portuguese). View Article : Google Scholar : PubMed/NCBI
|
|
25
|
Coomes SM, Kannan Y, Pelly VS, Entwistle
LJ, Guidi R, Perez-Lloret J, Nikolov N, Müller W and Wilson MS:
CD4+ Th2 cells are directly regulated by IL-10 during
allergic airway inflammation. Mucosal Immunol. 10:150–161. 2017.
View Article : Google Scholar : PubMed/NCBI
|
|
26
|
Janssens K, van den Haute C, Baekelandt V,
Lucas S, van Horssen J, Somers V, Van Wijmeersch B, Stinissen P,
Hendriks JJ, Slaets H and Hellings N: Leukemia inhibitory factor
tips the immune balance towards regulatory T cells in multiple
sclerosis. Brain Behav Immun. 45:180–188. 2015. View Article : Google Scholar : PubMed/NCBI
|
|
27
|
Metcalfe SM: LIF in the regulation of
T-cell fate and as a potential therapeutic. Genes Immun.
12:157–168. 2011. View Article : Google Scholar : PubMed/NCBI
|
|
28
|
Sekiya T, Kashiwagi I, Inoue N, Morita R,
Hori S, Waldmann H, Rudensky AY, Ichinose H, Metzger D, Chambon P
and Yoshimura A: The nuclear orphan receptor Nr4a2 induces Foxp3
and regulates differentiation of CD4+ T cells. Nat
Commun. 2:2692011. View Article : Google Scholar : PubMed/NCBI
|
|
29
|
Sekiya T, Kondo T, Shichita T, Morita R,
Ichinose H and Yoshimura A: Suppression of Th2 and Tfh immune
reactions by Nr4a receptors in mature T reg cells. J Exp Med.
212:1623–1640. 2015. View Article : Google Scholar : PubMed/NCBI
|
|
30
|
Fassett MS, Jiang W, D'Alise AM, Mathis D
and Benoist C: Nuclear receptor Nr4a1 modulates both regulatory
T-cell (Treg) differentiation and clonal deletion. Proc Natl Acad
Sci USA. 109:3891–3896. 2012; View Article : Google Scholar : PubMed/NCBI
|
|
31
|
Schuijs MJ, Willart MA, Vergote K, Gras D,
Deswarte K, Ege MJ, Madeira FB, Beyaert R, van Loo G, Bracher F, et
al: Farm dust and endotoxin protect against allergy through A20
induction in lung epithelial cells. Science. 349:1106–1110. 2015.
View Article : Google Scholar : PubMed/NCBI
|
|
32
|
Kang NI, Yoon HY, Lee YR, Won M, Chung MJ,
Park JW, Hur GM, Lee HK and Park BH: A20 attenuates allergic airway
inflammation in mice. J Immunol. 183:1488–1495. 2009. View Article : Google Scholar : PubMed/NCBI
|
|
33
|
Nishimura T, Kaminuma O, Saeki M, Kitamura
N, Matsuoka K, Yonekawa H, Mori A and Hiroi T: Essential
contribution of CD4+ T cells to antigen-induced nasal
hyperresponsiveness in experimental allergic rhinitis. PLoS One.
11:e01466862016. View Article : Google Scholar : PubMed/NCBI
|
|
34
|
Nabe T, Kuriyama Y, Mizutani N, Shibayama
S, Hiromoto A, Fujii M, Tanaka K and Kohno S: Inhibition of
hematopoietic prostaglandin D synthase improves allergic nasal
blockage in guinea pigs. Prostaglandins Other Lipid Mediat.
95:27–34. 2011. View Article : Google Scholar : PubMed/NCBI
|
|
35
|
Kajiwara D, Aoyagi H, Shigeno K, Togawa M,
Tanaka K, Inagaki N and Miyoshi K: Role of hematopoietic
prostaglandin D synthase in biphasic nasal obstruction in guinea
pig model of experimental allergic rhinitis. Eur J Pharmacol.
667:389–395. 2011. View Article : Google Scholar : PubMed/NCBI
|
|
36
|
Golebski K, van Egmond D, de Groot EJ,
Roschmann KI, Fokkens WJ and van Drunen CM: EGR-1 and DUSP-1 are
important negative regulators of pro-allergic responses in airway
epithelium. Mol Immunol. 65:43–50. 2015. View Article : Google Scholar : PubMed/NCBI
|
|
37
|
Luo X, Ma R, Wu X, Xian D, Li J, Mou Z and
Li H: Azelastine enhances the clinical efficacy of glucocorticoid
by modulating MKP-1 expression in allergic rhinitis. Eur Arch
Otorhinolaryngol. 272:1165–1173. 2015. View Article : Google Scholar : PubMed/NCBI
|
|
38
|
Maier JV, Brema S, Tuckermann J, Herzer U,
Klein M, Stassen M, Moorthy A and Cato AC: Dual specificity
phosphatase 1 knockout mice show enhanced susceptibility to
anaphylaxis but are sensitive to glucocorticoids. Mol Endocrinol.
21:2663–2671. 2007. View Article : Google Scholar : PubMed/NCBI
|
|
39
|
Lohoff M, Giaisi M, Köhler R, Casper B,
Krammer PH and Li-Weber M: Early growth response protein-1 (Egr-1)
is preferentially expressed in T helper type 2 (Th2) cells and is
involved in acute transcription of the Th2 cytokine interleukin-4.
J Biol Chem. 285:1643–1652. 2010. View Article : Google Scholar : PubMed/NCBI
|
|
40
|
Li B, Berman J, Wu P, Liu F, Tang JT and
Lin TJ: The early growth response factor-1 contributes to
interleukin-13 production by mast cells in response to stem cell
factor stimulation. J Immunotoxicol. 5:163–171. 2008. View Article : Google Scholar : PubMed/NCBI
|
|
41
|
Liu Z, Zhang XH, Callejas-Diaz B and
Mullol J: MicroRNA in united airway diseases. Int J Mol Sci.
17(pii): E7162016. View Article : Google Scholar : PubMed/NCBI
|
|
42
|
Sawaki H, Nakamura F, Aihara M, Nagashima
Y, Komori-Yamaguchi J, Yamashita N, Nakazawa M, Goshima Y and
Ikezawa Z: Intranasal administration of semaphorin-3A alleviates
sneezing and nasal rubbing in a murine model of allergic rhinitis.
J Pharmacol Sci. 117:34–44. 2011. View Article : Google Scholar : PubMed/NCBI
|
|
43
|
Baudet ML, Zivraj KH, Abreu-Goodger C,
Muldal A, Armisen J, Blenkiron C, Goldstein LD, Miska EA and Holt
CE: miR-124 acts through CoREST to control onset of Sema3A
sensitivity in navigating retinal growth cones. Nat Neurosci.
15:29–38. 2011. View Article : Google Scholar : PubMed/NCBI
|
|
44
|
Jiang S, Li C, McRae G, Lykken E, Sevilla
J, Liu SQ, Wan Y and Li QJ: MeCP2 reinforces STAT3 signaling and
the generation of effector CD4+ T cells by promoting
miR-124-mediated suppression of SOCS5. Sci Signal. 7:ra252014.
View Article : Google Scholar : PubMed/NCBI
|
|
45
|
Eom S, Kim Y, Park D, Lee H, Lee YS, Choe
J, Kim YM and Jeoung D: Histone deacetylase-3 mediates positive
feedback relationship between anaphylaxis and tumor metastasis. J
Biol Chem. 289:12126–12144. 2014. View Article : Google Scholar : PubMed/NCBI
|
|
46
|
Kim Y, Kim K, Park D, Lee E, Lee H, Lee
YS, Choe J and Jeoung D: Histone deacetylase 3 mediates allergic
skin inflammation by regulating expression of MCP1 protein. J Biol
Chem. 287:25844–25859. 2012. View Article : Google Scholar : PubMed/NCBI
|
|
47
|
Kim Y, Eom S, Park D, Kim H and Jeoung D:
The hyaluronic acid-HDAC3-miRNA network in allergic inflammation.
Front Immunol. 6:2102015. View Article : Google Scholar : PubMed/NCBI
|
|
48
|
Panganiban RP, Wang Y, Howrylak J,
Chinchilli VM, Craig TJ, August A and Ishmael FT: Circulating
microRNAs as biomarkers in patients with allergic rhinitis and
asthma. J Allergy Clin Immunol. 137:1423–1432. 2016. View Article : Google Scholar : PubMed/NCBI
|
|
49
|
Haas JD, Nistala K, Petermann F, Saran N,
Chennupati V, Schmitz S, Korn T, Wedderburn LR, Förster R, Krueger
A and Prinz I: Expression of miRNAs miR-133b and miR-206 in the
Il17a/f locus is co-regulated with IL-17 production in αβ and γδ T
cells. PLoS One. 6:e201712011. View Article : Google Scholar : PubMed/NCBI
|
|
50
|
Eom S, Kim Y, Kim M, Park D, Lee H, Lee
YS, Choe J, Kim YM and Jeoung D: Transglutaminase
II/microRNA-218/-181a loop regulates positive feedback relationship
between allergic inflammation and tumor metastasis. J Biol Chem.
289:29483–29505. 2014. View Article : Google Scholar : PubMed/NCBI
|
|
51
|
Liu W, Zeng Q and Luo R: Correlation
between serum osteopontin and miR-181a levels in allergic rhinitis
children. Mediators Inflamm. 2016:94712152016. View Article : Google Scholar : PubMed/NCBI
|