Introduction
Obstructive sleep apnea hypopnea syndrome (OSAHS) is
a common clinically treated disease characterized by repeated
obstruction of the upper airways during sleep and by frequently
interrupted breathing (1).
Multiple factors, such as obesity, may lead to the obstruction of
the upper airways leading to OSAHS (2). OSAHS is commonly accompanied by
snoring. Symptoms of OSAHS may be present for years or even decades
without identification. During the daytime, OSAHS patients might
become conditioned to the daytime tiredness and the sleep
disturbance will increase (3).
Usually, an adult or adolescent with severe long-standing OSAHS
will fall asleep for brief periods in the daytime, which will
influence his or her behavior, with unwelcome results. Children
with severe OSAHS will appear over-tired or hyperactive (4).
Numerous treatments are used for OSAHS (5). Relinquishing smoking and alcohol is
recommended, and is helpful for relaxing the central nervous system
(6). Another useful treatment is
weight loss and physical training, which can correct sleep apnea
(7). However, evidence on
medications for treating OSAHS is insufficient. At present, only a
few common medicines, including fluoxetine, paroxetine,
acetazolamide and tryptophan, have been confirmed as possessing
positive effects (8). Therefore,
the causes and mechanisms of OSAHS pathogenesis, and effective
treatments and protection are required.
Chronic intermittent hypoxia (CIH), characterized by
periods of low oxygen, is the most common physiological
characteristic of OSAHS. Diabetes mellitus (DM), particularly type
II DM (T2DM), is one of the risk factors of OSAHS (9–11).
However, data on the association between DM and CIH are scarce.
Based on the hypothesis that OSAHS is a risk factor of T2DM,
researchers have investigated the association between CIH and DM
(12).
According to Vatansever et al (13), hypoxia may lead to insulin
resistance. Clinical experiments conducted by Louis et al
(14) demonstrated that under
intermittent hypoxia, healthy volunteers demonstrated decreasing
insulin sensitivity and glucose utilization. Reichmuth et al
(15) determined that as the
degree of OSAHS worsens, the risk of T2DM increases from 2.8 to
14.75%. All of the above studies indicate that OSAHS is one of the
causes of DM.
OSAHS is associated with stimulation of oxidative
stress (OS) (16). According to
Lavie et al (17),
thiobarbituric acid reactive substances (TBARS) may be used to
estimate the degree of OS. Multiple other metabolic dysfunctions
are associated with OSAHS, such as the dysfunction of lipid
metabolism, which result in symptoms similar to those of DM
(18). Certain metabolic
dysfunctions occur in organs during OSAHS, including chronic injury
to the liver, alteration in enzyme homeostasis, and renal hypoxia
and endothelia dysfunction in the kidney (19,20).
Previous studies have also focused on the association of OSAHS with
alterations in brain morphology (21,22).
Although many studies have focused on the
association between OSAHS or CIH with DM, few efficient therapies
are available for the treatment of OSAHS combined with DM. Garlic
(G; Allium sativum) is one of the most popular herbs used
worldwide, particularly as a spice. As a member of the Liliaceae
family, G is used in folk medicine. G was a medicine listed in the
Egyptian Codex Ebers from 1,550 BC (23). G is hypothesized to be an effective
remedy for heart problems, headaches, insect bites, the immune
system and tumors (24,25). Previous investigations reported
that G may be an effective medicine for the treatment of DM,
particularly due to its antioxidant and protective effects,
including reducing cardiovascular risk factors, decreasing
cholesterol, inhibiting low density lipoprotein oxidation,
hyperlipidemia, atherosclerosis, thrombosis, hypertension and
diabetes (26,27).
To the best of our knowledge, there is currently no
data available on the effect of G on CIH and CIH combined with DM
(CIH-DM). By determining multiple indices in the serum, liver,
kidney and brain, the present study aimed to investigate the
protective effect of G on rats with CIH-DM.
Materials and methods
Animals
A total of 32 specific pathogen-free male Wistar
rats (60–70 days old, 250–280 g) were obtained from Kangda
Biotechnology Co., Ltd. (Qingdao, China). The rats were
individually housed in polycarbonate cages with wire lids under a
12-h light/dark cycle, 22–25°C and 50–70% humidity at the Animal
Research Center of Wuhan University (Wuhan, China). Standard
laboratory diet was supplied with unlimited access to water. All
animal experiments were performed in accordance with the National
Institutes of Health Principles of Laboratory Animal Care (28), the European Guidelines for the
Protection of Animals used for Scientific Purposes (29). The Animal Research Ethics Committee
of Renmin Hospital of Wuhan University (Wuhan, China) approved the
animal welfare and experimental protocols.
G extract preparation
G bulbs (Beijing Dongsheng Group, Beijing, China),
peeled on crushed ice, were used for preparation of an aqueous G
extract. A total of 50 g peeled G was cut into pieces, homogenized
in liquid nitrogen and dissolved in 70 ml pre-cooling 0.9% NaCl. A
blender was used to perform homogenization and the samples were
blended with a 30 sec burst for 10 min. The solution was collected
and centrifuged at 2,000 × g for 10 min at 25°C. Clear supernatant
was collected and diluted in 100 ml saline. The concentration of G
preparation was adjusted to 500 mg/ml based on the weight of the
primary material (50 g/100 ml). G extract was stored at −20°C for 3
days.
Experimental groups and models
A total of 32 rats were allowed to adapt to the
laboratory conditions for a week and then randomly divided into
eight groups: Control (C), CIH, DM, CIH-DM, C-G, CIH-G, DM-G and
CIH-DM-G.
Rats in the C group were untreated and given
standard laboratory diet and free access to water. Rats in the CIH
group, supplied with standard laboratory diet and unlimited water,
were treated in a hypobaric hypoxia chamber (OxycyclerA84A-chamber;
BioSpherix, Ltd., Parish, NY, USA) with 5-min cycles of 90 sec
hypoxia (5% O2) and 210 sec normoxia (21%
O2), 8 h/day for 3 weeks during light exposure. The
pressure was kept at 69.3 kPa (520 mm Hg), corresponding to an
altitude of 3,000 m to induce pathophysiological effects (30). All experiments were performed
between 9:00 a.m. and 5:00 p.m.
Rats in the DM group were injected intraperitoneally
with a single dose of streptozotocin (50 mg/kg; Sigma-Aldrich;
Merck KGaA, Darmstadt, Germany) dissolved in a freshly prepared
citrate buffer (0.1 M, pH 4.5; Beyotime Institute of Biotechnology,
Shanghai, China). A high-fat diet (cat. no. D12451; Research Diets,
Inc., New Brunswick, NJ, USA) was used as a daily diet. A total of
1 week following injection with streptozotocin, the blood glucose
level was detected in the tail vein blood using a glucose meter
(Optium Xceed; Abbott Pharmaceutical Co., Ltd., Lake Bluff, IL,
USA). If the blood glucose level exceeded 250 mg/dl, rats were
considered diabetic. Non-diabetic rats were excluded from the
study. At least 3 rats were included in each group.
Rats in the CIH-DM group were subjected to the same
protocol as the DM group. Rats confirmed positive for diabetes were
subsequently exposed to the same hypoxia conditions as
aforementioned for the CIH group.
All G-treatment groups were intraperitoneally
injected 500 mg/kg/day G extract for 7 weeks. All experiments
lasted for 7 weeks, including the first week for establishing the
DM model and 6 weeks for establishing CIH. Rat weight was measured
1 day prior to the experiment (day 0) and then weekly on days 7,
14, 21, 28, 35, 42 and 49 of the experiment.
Blood glucose, insulin levels and
homeostasis model assessment of insulin resistance (HOMA-IR)
Rats were fasted overnight and blood samples were
collected by retro-orbital bleeding between 7:00-8:00 a.m. prior to
and during the experiment weekly. Fresh blood was used for
determination of blood glucose by a glucose meter and then
centrifuged at 3,000 × g for 15 min at 25°C to separate the serum.
Fasting insulin level was determined using a Rat Insulin ELISA kit
(10-1145-01; Mercodia AB, Uppsala, Sweden). HOMA-IR was calculated
using the following equation (31): Fasting insulin (µU/ml) × fasting
glucose (mg/dl)/22.5.
Tissue collection
At the end of the experiment, all rats were
sacrificed using sodium pentobarbital anesthesia according to the
Guide for the Care and Use of Laboratory Animals (32). Blood samples were collected and
serum was separated, as aforementioned. The liver, kidney, pancreas
and brain were removed immediately and weighed. The organs were
washed with chilled saline solution and cut into pieces. Tissues
were homogenized to 10% weight/volume with pre-cooling phosphate
buffered saline (pH 7.4) containing 1.15% KCl using
Potter-Elvehjem-Type Tissue Grinders (Thermo Fisher Scientific,
Inc., Waltham, MA, USA) and centrifuged at 10,000 × g for 30 min at
4°C. The supernatant was separated for subsequent enzyme
assays.
Index detections in serum and
tissues
Lipid peroxide levels were measured as
thiobarbituric acid reactive substances and the products of the
reactions were measured with a Lipid Peroxidation (MDA) Assay kit
(ab118970; Abcam, Cambridge, UK) as previously described (33). Nitric oxide (NO) levels were
measured with a Total Nitric Oxide Assay Kit (S0024; Beyotime
Institute of Biotechnology). Superoxide dismutase (SOD;
19160-1KT-F; Sigma-Aldrich; Merck KGaA), glutathione S-transferase
(GST; CS410-1KT; Sigma-Aldrich; Merck KGaA), glutathione peroxidase
(GST-Px; CGP-1KT; Sigma-Aldrich; Merck KGaA), glutathione reductase
(GR; GRSA-1KT; Sigma-Aldrich; Merck KGaA), catalase activity (CAT;
CAT100; Sigma-Aldrich; Merck KGaA), uric acid (UA; MAK077;
Sigma-Aldrich; Merck KGaA), albumin (MAK124; Sigma-Aldrich; Merck
KGaA), aspartate aminotransferase (AST; MAK055; Sigma-Aldrich;
Merck KGaA), total lipids (TL; MAK040; Sigma-Aldrich; Merck KGaA),
alanine aminotransferase (ALT; MAK052, Sigma-Aldrich; Merck KGaA),
lactate dehydrogenase (LDH; MAK066; Sigma-Aldrich; Merck KGaA),
alkaline phosphatases (ALP; AP0100; Sigma-Aldrich; Merck KGaA) and
acid phosphatases (ACP; CS0740; Sigma-Aldrich; Merck KGaA) were
measured with corresponding assay kits (Sigma-Aldrich; Merck KGaA).
Urine protein (UP; JL21197-48T), total cholesterol (TC,
JL13847-48T) and triglycerides (TG, JL13528-48T) were measured with
corresponding assay kits (Shanghai Jianglai Biotechnology Co.,
Ltd., Shanghai, China).
Statistical analysis
Data are expressed as the mean ± standard deviation
and were analyzed by SPSS (version 19.0; IBM Corp., Armonk, NY,
USA). One-way analysis of variance (ANOVA) was used to compare
values at different time points in each group. One-way ANOVA and
Bonferroni's post hoc test were used for multiple comparisons with
95% confidence intervals. P<0.05 was considered to indicate a
statistically significant difference.
Results
Alterations in body weight
The average weight in the C, CIH, DM and CIH-DM
groups increased with time (Fig.
1A). The increase in weight in the C group was significantly
elevated at each time point from day 14 onwards compared with the
CIH, DM and CIH-DM groups (P<0.05). The CIH group weighed
significantly more than the DM and CIH-DM groups at each time point
from day 14 onwards (all P<0.05). However, the increase in
weight in the DM group was similar to that in the CIH-DM group.
These results indicate that induction of CIH, DM and CIH-DM models
in rats influenced the increase in weight over the experimental
period. The influence of the DM model on weight was more evident
compared with the CIH model.
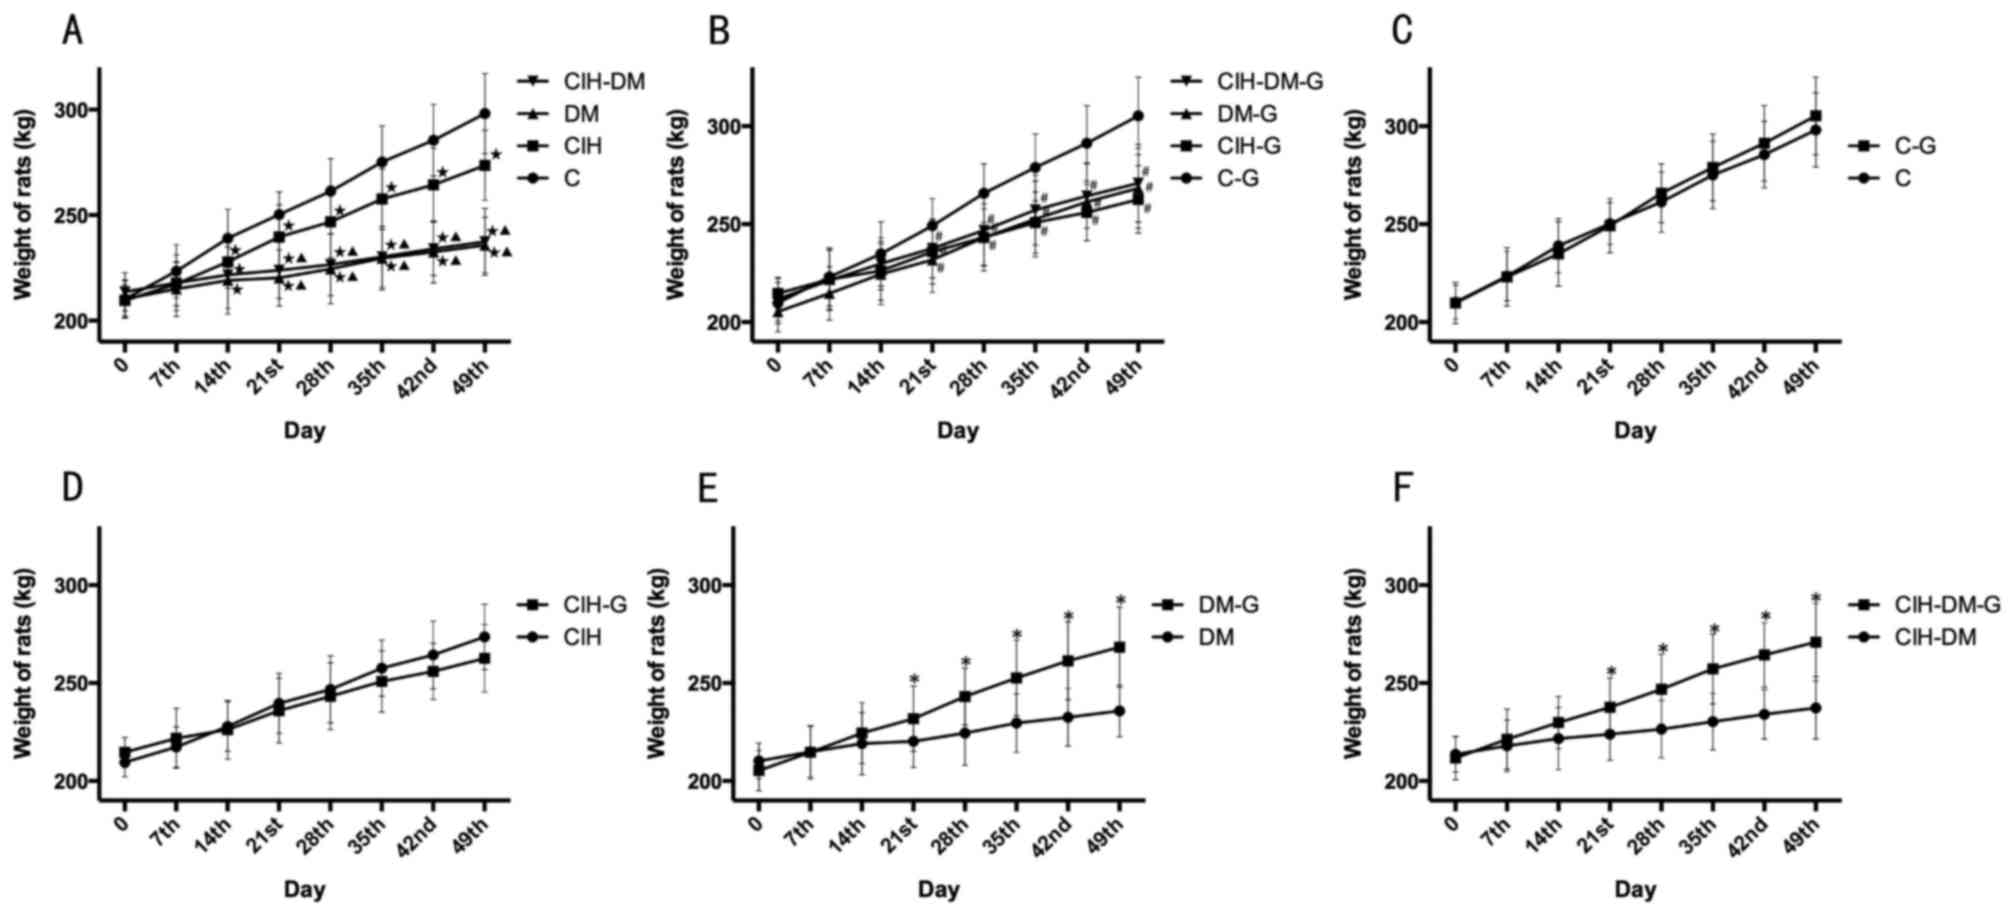 | Figure 1.Comparisons of rats' weight between
different groups at different time points. Alterations in body
weight in rats form (A) C, CIH, DM and CIH-DM groups, (B) C-G,
CIH-G, DM-G and CIH-DM-G groups, (C) C and C-G groups, (D) CIH and
CIH-G groups, (E) DM and DM-G groups, and (F) CIH-DM and CIH-DM-G
groups. *P<0.05 vs. the respective group without G treatment;
⋆P<0.05 vs. the C group; ▲P<0.05 vs.
the CIH group; #P<0.05 vs. the C-G group. C, control;
CIH, chronic intermittent hypoxia; DM, diabetes mellitus; CIH-DM,
chronic intermittent hypoxia combined with diabetes mellitus; G,
garlic. |
The average weight in the C-G, CIH-G, DM-G and
CIH-DM-G groups also increased with time (Fig. 1B). The weight of rats from the C-G
group was increased compared with any other group at each time
point from day 21 onwards (all P<0.05), while the other three
groups were not significantly different from each other throughout
the experiment. It may therefore be concluded that, in spite of G
treatment, the weight of rats with DM, CIH and CIH-DM remained
lower compared with the healthy C rats.
Pairwise comparisons revealed no significant
difference in weight between the C group and the C-G group or the
CIH group and the CIH-G group (Fig. 1C
and D, respectively). However, the increase in weight was
significantly elevated in the DM-G group compared with the DM group
and in the CIH-DM-G group compared with the CIH-DM group, from day
21 onwards (Fig. 1E and F,
respectively; all P<0.05) The above results demonstrate that G
treatment exhibited a positive effect on the weight of rats in the
DM and CIH-DM groups.
Blood glucose
As demonstrated in Fig.
2A, the change of blood glucose in rats in the C and CIH groups
were steady during the experiments. However, serum glucose in rats
in the DM and CIH-DM groups significantly increased compared with C
group, and remained high from the day 7 to the end of the
experiment (P<0.05). These results indicate that when rats had
DM or CIH-DM, the blood glucose increased to an abnormal level, but
CIH would not induce increased blood glucose alone.
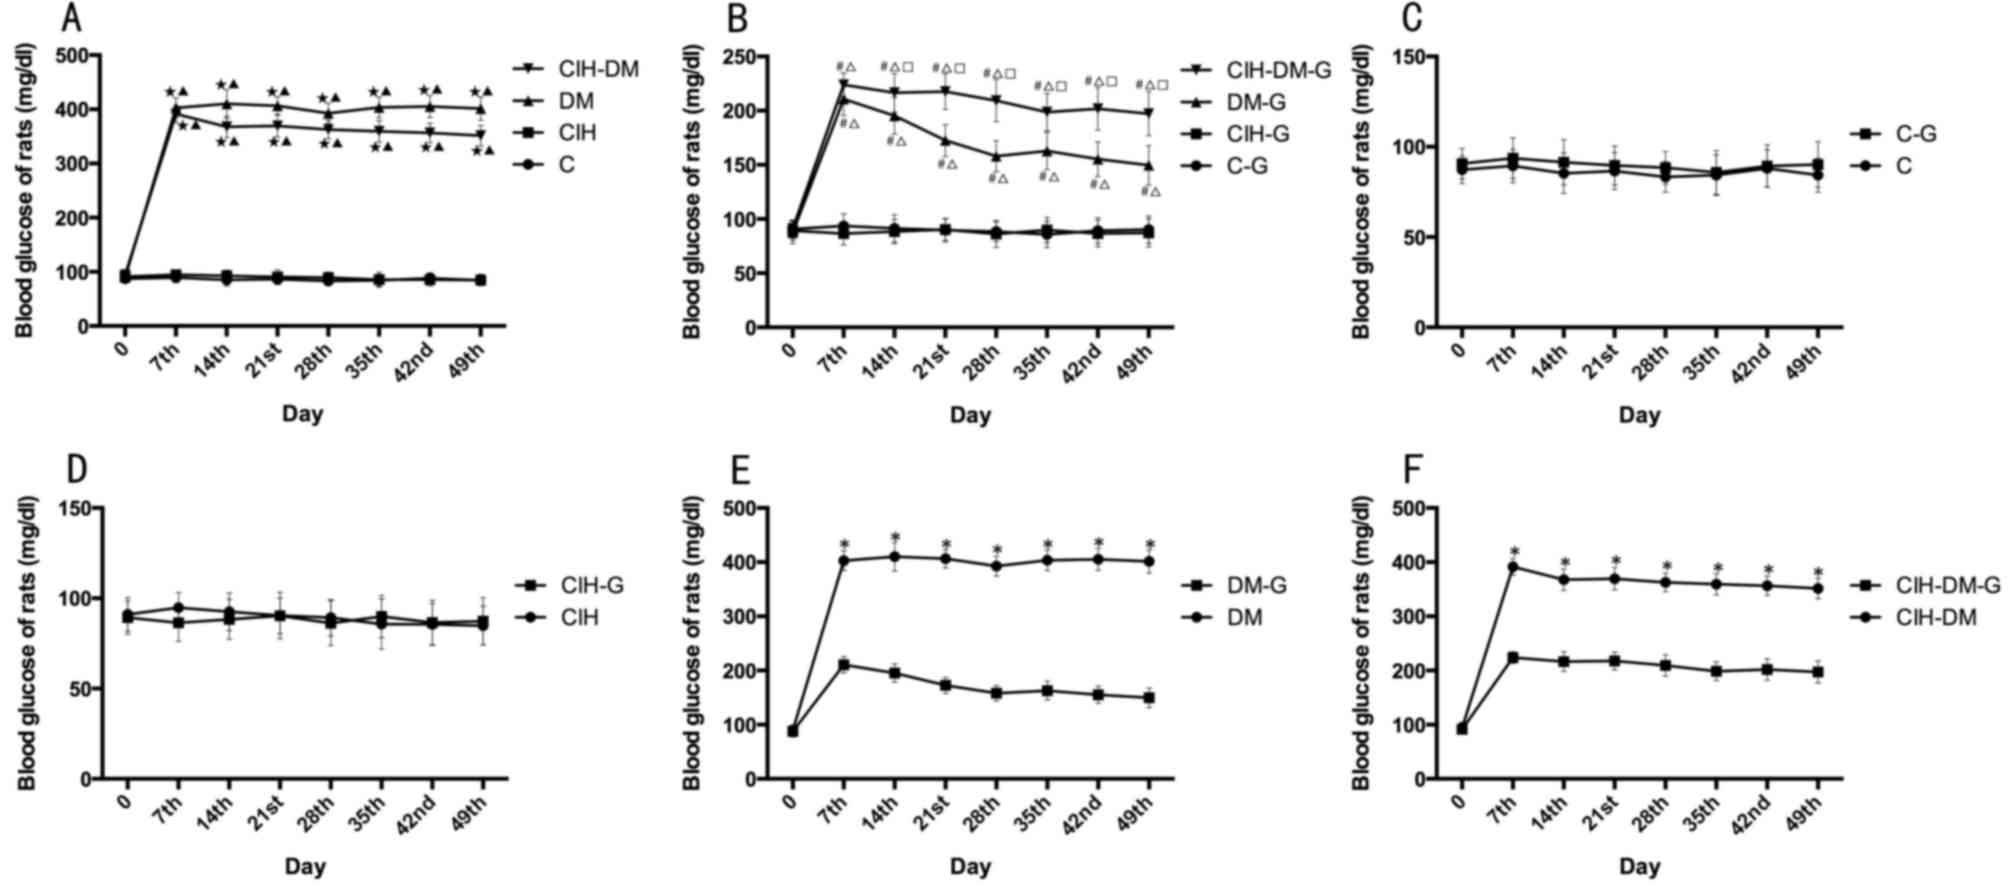 | Figure 2.Comparisons of blood glucose levels
between different groups. Blood glucose in rats from (A) C, CIH, DM
and CIH-DM groups, (B) C-G, CIH-G, DM-G and CIH-DM-G groups, (C) C
and C-G groups, (D) CIH and CIH-G groups, (E) DM and DM-G groups,
and (F) CIH-DM and CIH-DM-G groups. *P<0.05 vs. the respective
group without G treatment; ⋆P<0.05 vs. the C group;
▲P<0.05 vs. the CIH group; #P<0.05 vs.
the C-G group; ∆P<0.05 vs. the CIH-G group;
□P<0.05 vs. the DM-G group. C, control; CIH, chronic
intermittent hypoxia; DM, diabetes mellitus; CIH-DM, chronic
intermittent hypoxia combined with diabetes mellitus; G,
garlic. |
Following G treatment, blood glucose levels in rats
from the DM group demonstrated a decreasing tendency from day 7
onwards. At each time point, blood glucose in the DM-G and CIH-DM-G
groups was increased compared with the C-G and CIH-G groups (all
P<0.05; Fig. 2B).
By pairwise comparisons, there was no significant
difference in blood glucose levels between the C group and the C-G
group, or between the CIH group and the CIH-G group (Fig. 2C and D). However, following G
treatment, blood glucose levels in the DM-G group and the CIH-DM-G
decreased significantly compared with the respective untreated
groups (all P<0.05; Fig. 2E and
F). The above results indicate that G treatment decreased the
high blood glucose induced by DM or CIH-DM.
Blood insulin
The average level of blood insulin in rats with CIH
was significantly increased compared with that in the C group from
day 14 onwards, while insulin levels in the DM and the CIH-DM group
were significantly lower compared with the C and the CIH group from
day 7 onwards (all P<0.05). The above results, suggest that CIH
increased blood insulin levels in rats, while the induction of DM
and CIH-DM models decreased blood insulin levels (Fig. 3A).
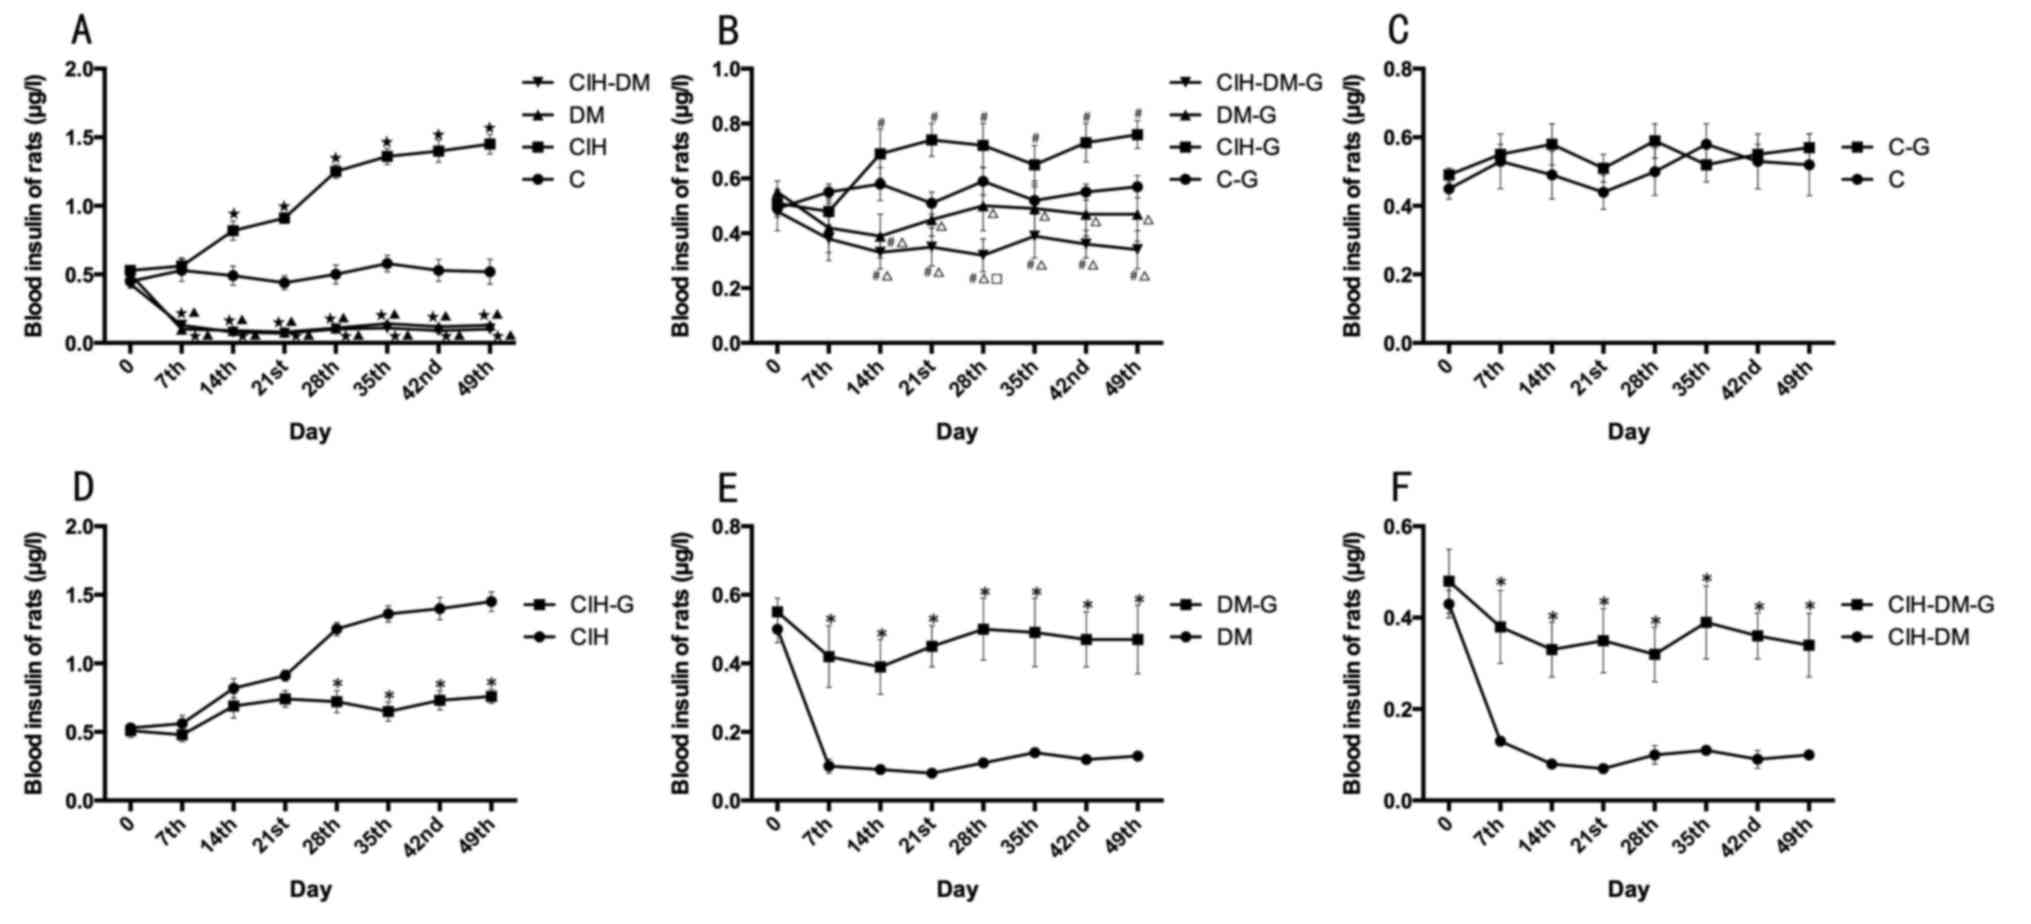 | Figure 3.Comparisons of blood insulin levels
between different groups. Blood insulin in rats from the (A) C,
CIH, DM and CIH-DM groups, (B) C-G, CIH-G, DM-G and CIH-DM-G
groups, (C) C and C-G groups, (D) CIH and CIH-G groups, (E) DM and
DM-G groups, and (F) CIH-DM and CIH-DM-G groups. *P<0.05 vs. the
respective group without G treatment; ⋆P<0.05 vs. the
C group; ▲P<0.05 vs. the CIH group;
#P<0.05 vs. the C-G group; ∆P<0.05 vs.
the CIH-G group; □P<0.05 vs. the DM-G group. C,
control; CIH, chronic intermittent hypoxia; DM, diabetes mellitus;
CIH-DM, chronic intermittent hypoxia combined with diabetes
mellitus; G, garlic. |
Following G treatment, the average level of blood
insulin in rats with DM remained not significantly different from
the C-G group (Fig. 3B).
Significant differences were observed between the C-G group and
both the CIH-DM-G group and the CIH-G group, from day 14 onwards
(all P<0.05). The results indicate that G treatment did improve
blood insulin in rats with DM, but with not in rats with CIH or
CIH-DM.
Pairwise comparisons revealed that there was no
significant difference in blood insulin levels between the C group
and the C-G group (Fig. 3C). In
the CIH-G group, the blood insulin level was significantly lower
than that of the CIH group at each time point from day 28 onwards
(P<0.05; Fig. 3D), suggesting
that G treatment decreased the high level of blood insulin induced
by CIH. Following G treatment, from day 7 onwards, blood insulin
levels in the DM-G and CIH-DM-G groups were significantly increased
compared with the respective groups untreated with G (all
P<0.05; Fig. 3E and F),
indicating that G treatment increased blood insulin in rat models
of DM and CIH-DM.
HOMA-IR values
HOMA-IR values were significantly increased in the
CIH group compared with all other groups (P<0.05; Fig. 4A). An elevated HOMA-IR value
indicated high insulin resistance in the CIH group.
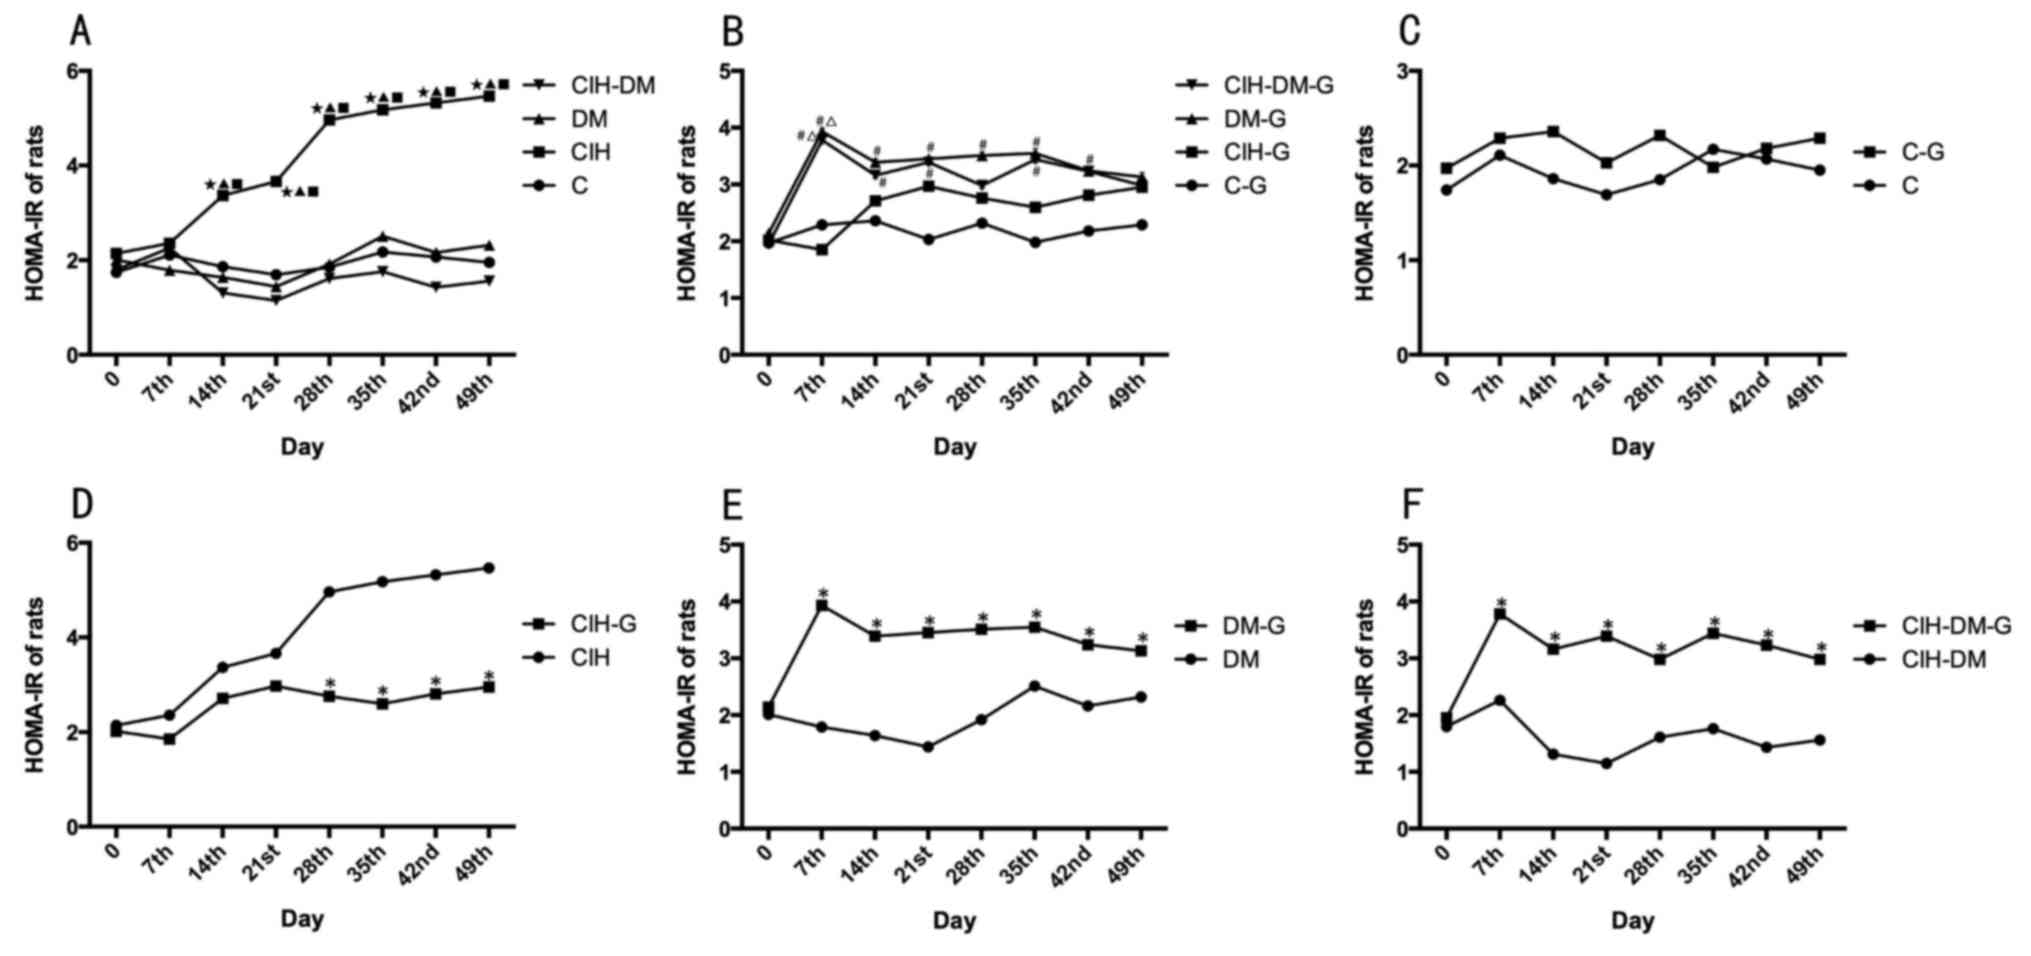 | Figure 4.Comparisons of rat HOMA-IR in
different groups. HOMA-IR in rats from the (A) C, CIH, DM and
CIH-DM groups, (B) C-G, CIH-G, DM-G and CIH-DM-G groups, (C) C and
C-G groups, (D) CIH and CIH-G groups, (E) DM and DM-G groups, (F)
CIH-DM and CIH-DM-G groups. *P<0.05 vs. the respective group
without G treatment; ⋆P<0.05 vs. the C group;
▲P<0.05 vs. the CIH group; #P<0.05 vs.
the C-G group; ∆P<0.05 vs. the CIH-G group;
□P<0.05 vs. the DM-G group. HOMA-IR, homeostasis
model assessment of insulin resistance; C, control; CIH, chronic
intermittent hypoxia; DM, diabetes mellitus; CIH-DM, chronic
intermittent hypoxia combined with diabetes mellitus; G,
garlic. |
Following G treatment, there was no significant
difference in HOMA-IR values between the C-G group and the CIH-G
group (Fig. 4B). In the DM-G
group, the HOMA-IR value was significantly increased compared with
that in the C-G group from day 7 to day 42 (all P<0.05), while
on the day 49 of the experiment, the HOMA-IR value in the DM-G
group decreased to a level similar to all other groups including
the C group. In the CIH-DM-G group, the HOMA-IR value was
significantly increased compared with the C-G group between days
7–35 of treatment (all P<0.05).
There was no significant difference in the HOMA-IR
values between the C group and the C-G group (Fig. 4C). From day 28 onwards, the HOMA-IR
value was significantly lower in the CIH-G group compared with the
CIH group (P<0.05; Fig. 4D).
HOMA-IR values in the DM-G and CIH-DM-G groups were significantly
increased compared with the respective G-untreated controls (all
P<0.05; Fig. 4E and F). The
above results indicate that G treatment significantly altered the
insulin resistance in all experimental groups.
Serum parameters
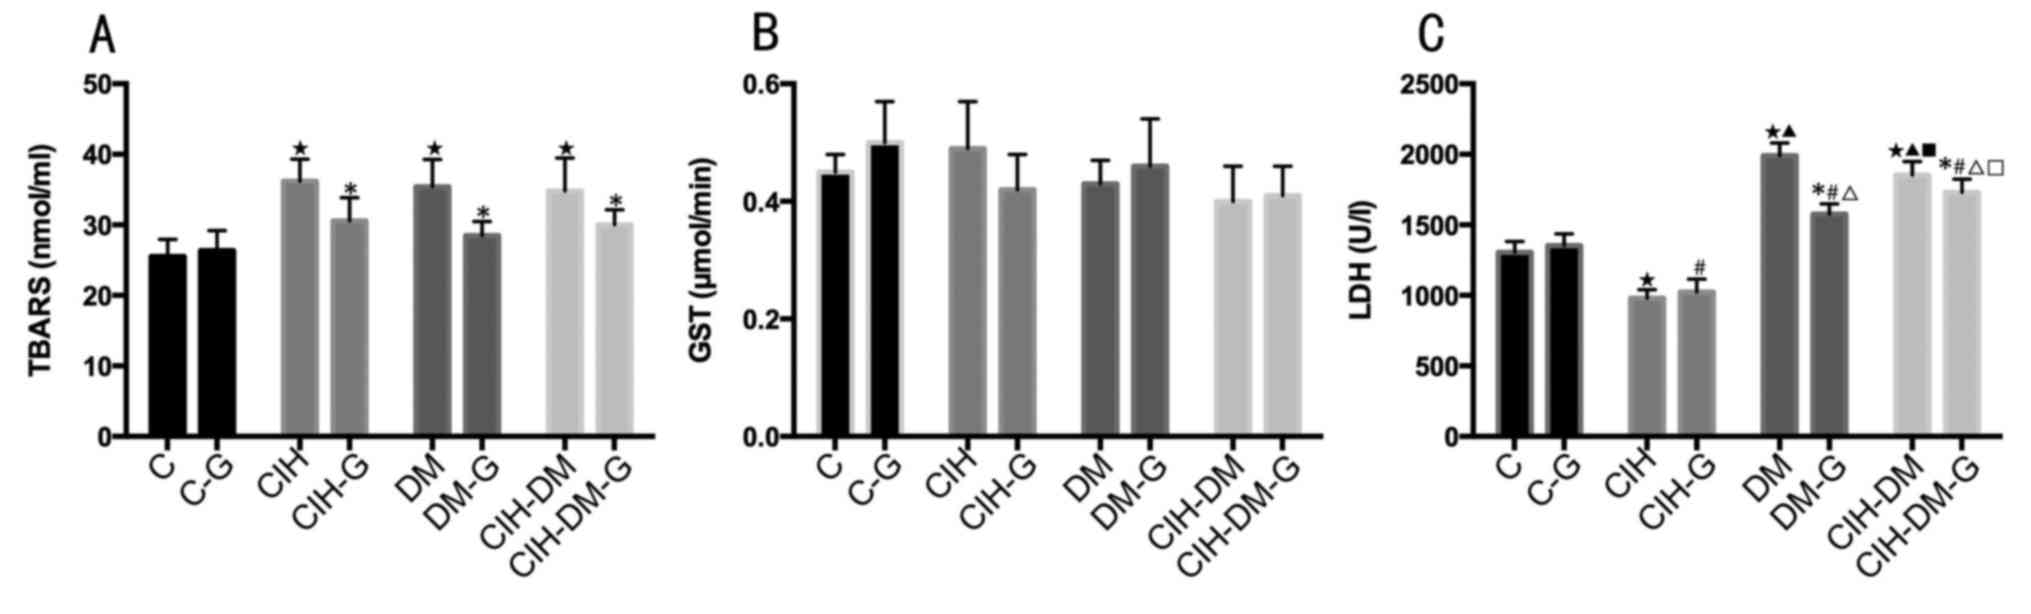
Serum TBARS values in all experimental groups
without and with G treatment were increased compared with the C and
C-G groups, respectively (all P<0.05). Pairwise comparisons
revealed that, following G treatment, TBARS values were
significantly decreased in all G-treated experimental groups
compared with the values in the corresponding G-untreated groups
(all P<0.05; Fig. 5A).
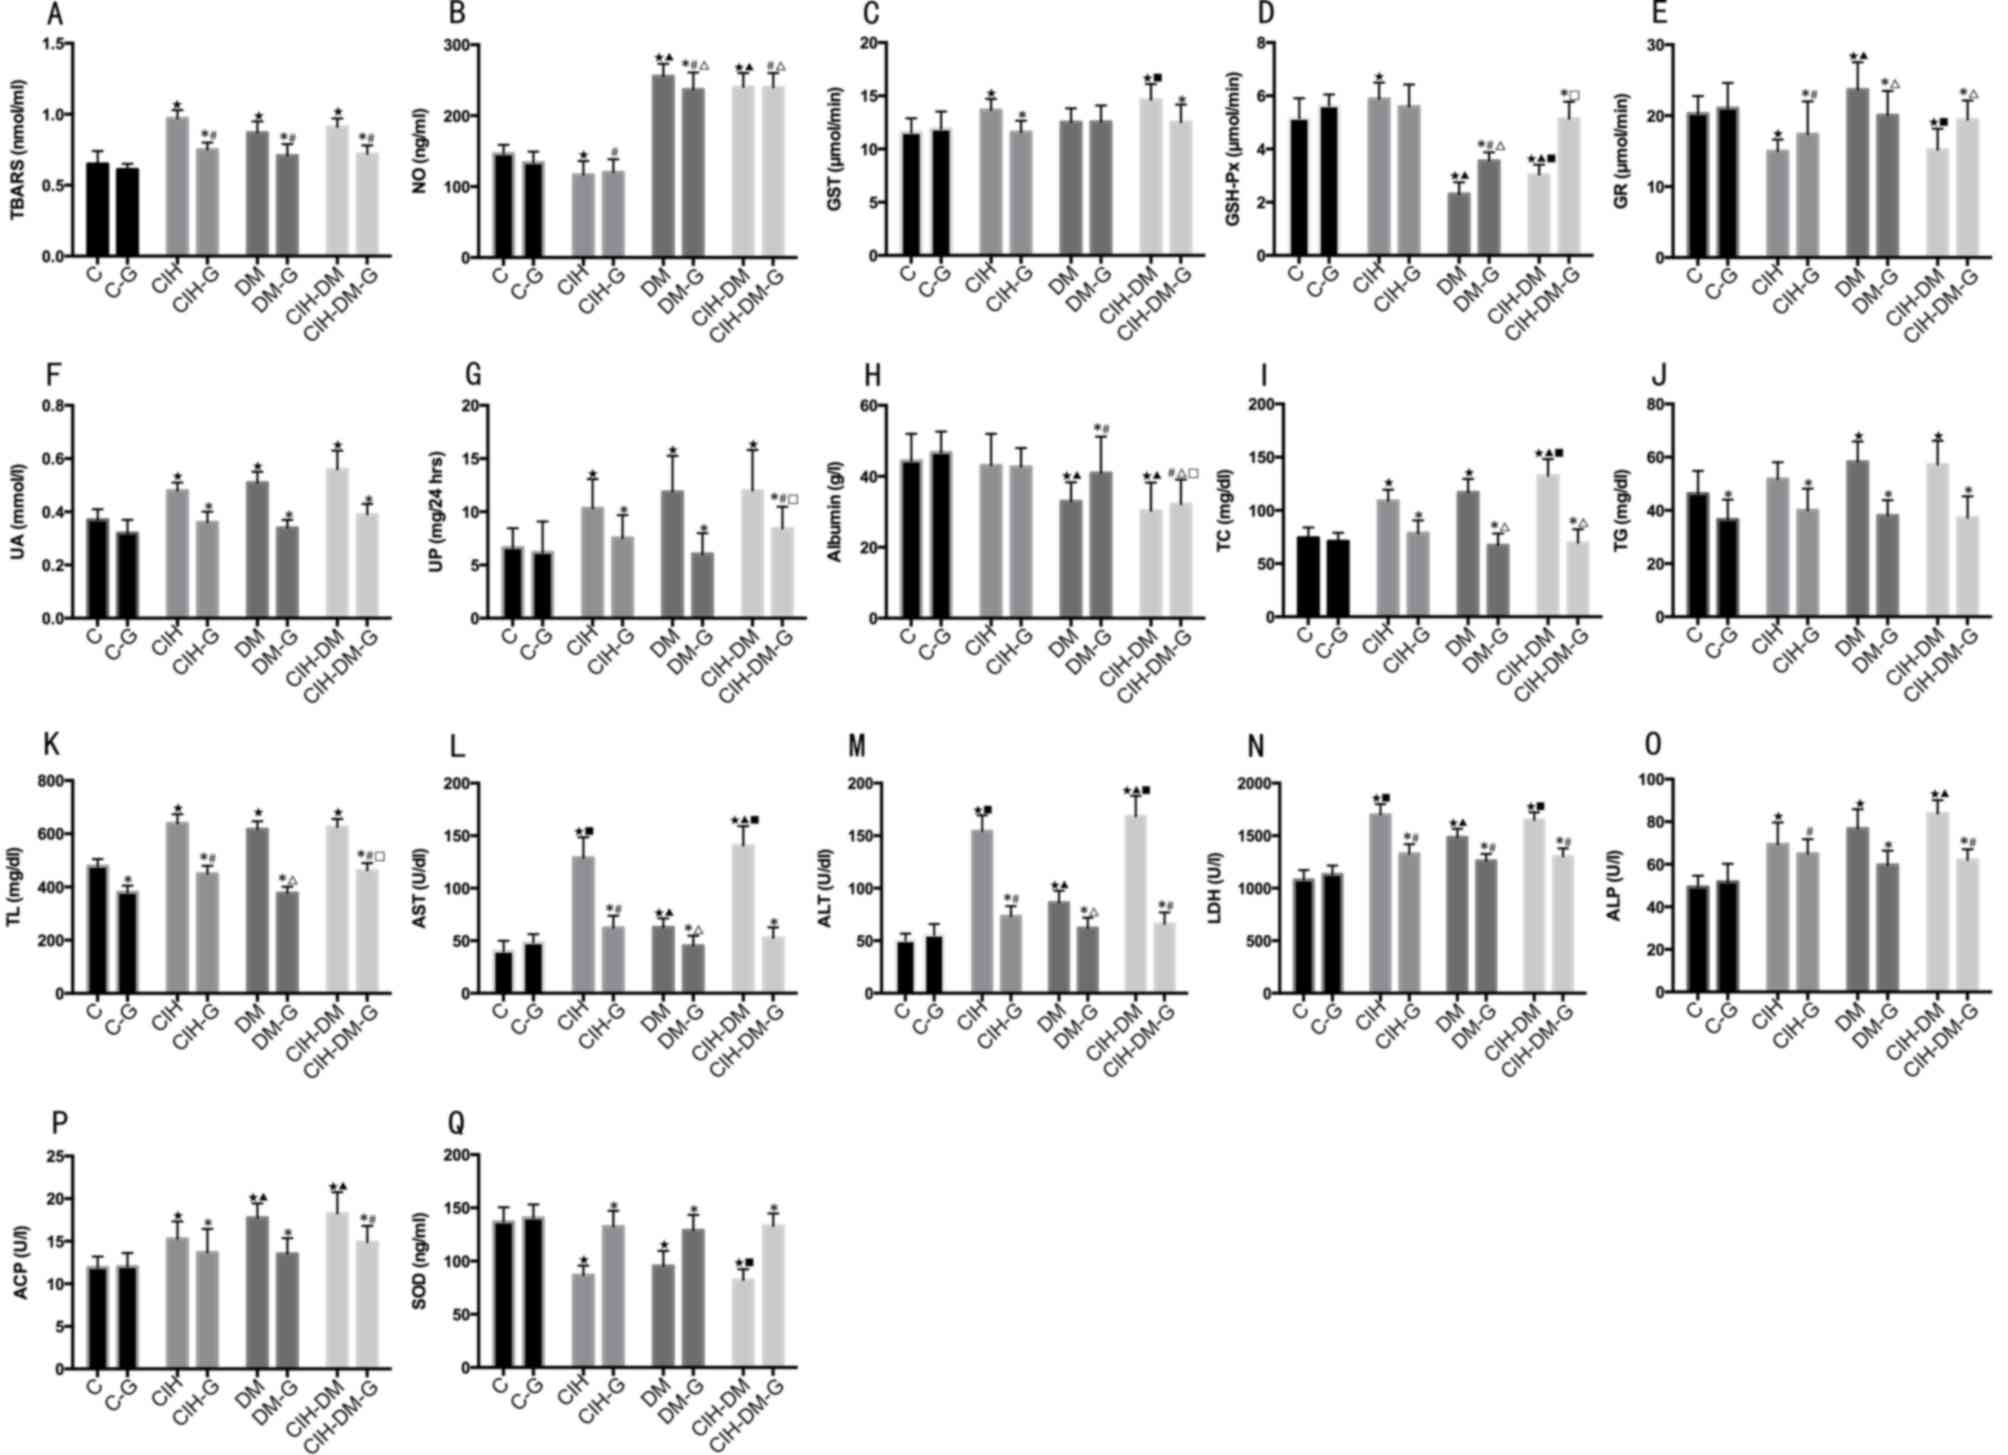 | Figure 5.Comparisons of serum parameters in
rats from different groups. Serum levels of (A) TBARS, (B) NO, (C)
GST, (D) GSH-Px, (E) GR, (F) UA, (G) UP, (H) albumin, (I) TC, (J)
TG, (K) TL, (L) AST, (M) ALT, (N) LDH, (O) ALP, (P) ACP and (Q)
SOD. *P<0.05 vs. the respective group without G treatment;
⋆P<0.05 vs. the C group; ▲P<0.05 vs.
the CIH group; #P<0.05 vs. the C-G group;
∆P<0.05 vs. the CIH-G group; ■P<0.05
vs. the DM group; □P<0.05 vs. the DM-G group. C,
control; CIH, chronic intermittent hypoxia; DM, diabetes mellitus;
CIH-DM, chronic intermittent hypoxia combined with diabetes
mellitus; G, garlic; TBARS, thiobarbituric acid reactive
substances; NO, nitric oxide; GST, glutathione S-transferase;
GSH-Px, glutathione peroxidase; GR, glutathione reductase; UA, uric
acid; UP, urine protein; TC, total cholesterol; TG, triglycerides;
TL, total lipids; AST, aspartate aminotransferase; ALT, alanine
aminotransferase; LDH, lactate dehydrogenase; ALP, alkaline
phosphatases; ACP, acid phosphatases; SOD, superoxide
dismutase. |
Serum NO level in the CIH group was significantly
lower than that in the C group (P<0.05), while it was increased
in the DM and CIH-DM groups compared with that in the C group (both
P<0.05; Fig. 5B). The NO level
in the DM-G and CIH-DM-G groups was significantly increased
compared with that in the C-G group (both P<0.05; Fig. 5B). Additionally, NO levels in the
DM and CIH-DM groups with and without G treatment were
significantly increased compared with that in the CIH group with
and without G treatment, respectively (all P<0.05). Pairwise
comparisons revealed that NO levels in the DM-G group was
significantly lower compared with that in the DM group (P<0.05).
The above results indicate that CIH induced a decrease of serum NO
level in rats, while DM or CIH-DM increased NO levels in rats. The
G treatment could decrease the serum NO level induced by DM;
however, it could not induce this decrease in rats with CIH or
CIH-DM.
Serum GST levels in the CIH and CIH-DM groups were
significantly increased compared with that in the C group (Fig. 5C; both P<0.05). Pairwise
comparisons revealed that serum GST levels in the CIH-G group and
the CIH-DM-G group were lower compared with the CIH group and the
CIH-DM group, respectively (both P<0.05). The above results
indicate that CIH and CIH-DM demonstrated elevated serum GST levels
compared with the control and that G treatment decreased serum GST
levels in rat models of CIH and CIH-DM.
Serum GSH-Px levels in the CIH group were
significantly increased compared with that in the C group
(P<0.05; Fig. 5D). The GSH-Px
levels in the CIH-DM group were significantly elevated compared
with the DM group (P<0.05; Fig.
5D). Serum levels of GSH-Px in the DM and CIH-DM groups were
significantly lower than those in the C and CIH groups (both
P<0.05; Fig. 5D). Serum GSH-Px
in the DM-G group was significantly lower than that in the other
G-treated groups (all P<0.05). Pairwise comparisons revealed
that, serum GSH-Px levels in the DM-G and CIH-DM-G groups were
increased compared with the corresponding G-untreated groups (both
P<0.05). These results indicate that CIH induces an increase in
serum levels of GSH-Px in rats, while models of DM and CIH-DM
demonstrated decreased levels of serum GSH-Px compared with healthy
controls. G treatment decreased the serum GSH-Px in the rats with
CIH to the normal level, but increased the serum GSH-Px in the rats
with CIH-DM to the normal level. G treatment also increased the
serum GSH-Px in the rats with DM, but not back to the healthy
level.
Serum GR levels in the CIH and CIH-DM groups were
both significantly lower compared with the C and DM groups,
respectively (both P<0.05; Fig.
5E), and DM group levels were significantly elevated compared
with that in the C group (P<0.05). Serum GR levels in the CIH-G
group were significantly lower than those in the C-G, DM-G and
CIH-DM-G groups (P<0.05). Pairwise comparisons of serum GR
levels revealed that in the CIH-G and CIH-DM-G groups, G treatment
resulted in an increase of the GR level compared with the
respective G-untreated model groups (both P<0.05). GR level in
the DM-G group was lower than that of the DM group (P<0.05).
Serum UA and UP levels in all experimental groups
(G-untreated) were significantly increased compared with the level
in the C group (all P<0.05; Fig. 5F
and G). Pairwise comparisons revealed that in all model groups,
G treatment significantly decreased UA and UP levels compared with
the respective G-untreated groups (P<0.05).
Serum albumin in the DM and CIH-DM groups was
significantly lower than that in the C and CIH groups (both
P<0.05; Fig. 5H). Serum albumin
in the DM-G group was lower than that in the C-G group (P<0.05).
Additionally, serum albumin levels in the CIH-DM-G group were
significantly lower than any other G-treated group (all P<0.05;
Fig. 5H). Pairwise comparisons
revealed that serum albumin in the DM-G group was significantly
increased compared with that in the DM group (P<0.05).
Serum TC levels were elevated in all model groups
(G-untreated) compared with the level in the C group (all
P<0.05; Fig. 5I). Serum TC
levels in the DM-G and CIH-DM-G groups were lower than those in the
CIH-G group (P<0.05). Pairwise comparisons revealed that,
following G treatment, serum TC levels decreased significantly in
all G-treated model groups compared with the corresponding
G-untreated groups (all P<0.05).
Serum TG levels in the DM and CIH-DM groups were
significantly increased compared with the levels in the C group
(both P<0.05; Fig. 5J).
Pairwise comparison revealed that, following G treatment, serum TG
levels decreased compared with all the levels in the corresponding
G-untreated groups (all P<0.05).
Serum TL levels were significantly increased in all
model groups compared with the level in the C group (all P<0.05;
Fig. 5K). Serum TL levels in the
CIH-G and CIH-DM-G groups were both increased compared with the C-G
and DM-G groups, respectively (both P<0.05). Pairwise
comparisons revealed that, following G treatment, serum TL levels
decreased in all groups, including the C group, compared with the
levels in the corresponding G-untreated groups (all P<0.05).
Serum AST, ALT and LDH levels significantly
increased in all model groups compared with the levels in the C
group (all P<0.05; Fig. 5L-N,
respectively). A significant increase in AST, ALT and LDH was also
observed in the CIH and CIH-DM groups compared with the DM group.
The CIH-DM group demonstrated significantly increased levels of
serum AST, ALT and LDH compared with the levels in the CIH group
(all P<0.05). Serum AST, ALT and LDH in the CIH group were
significantly increased compared with the C and DM groups (all
P<0.05). Pairwise comparisons revealed that G treatment
significantly decreased serum levels of AST, ALT and LDH compared
with the levels in the respective G-untreated model groups (all
P<0.05). Additionally, serum levels of ALT were significantly
increased in the CIH-G and CIH-DM-G groups compared with the level
in the C-G group (P<0.05; Fig.
5M).
Serum ALP levels in all experimental groups
(G-untreated) were increased compared with the C group (all
P<0.05; Fig. 5O). CIH-DM
demonstrated elevated ALP levels compared with the CIH group
(P<0.05). Serum ALP levels in the CIH-G and CIH-DM-G groups were
both increased compared with the level in the C-G group (both
P<0.05). Pairwise comparisons revealed that serum ALP levels in
the DM-G and CIH-DM-G groups were lower than those of the
respective G-untreated groups (both P<0.05).
Serum ACP levels were significantly increased in all
experimental groups (G-untreated) compared with the level in the C
group (all P<0.05; Fig. 5P).
Serum APC levels in the CIH group were significantly lower than
those of the DM and CIH-DM groups (both P<0.05). Serum ACP in
the CIH-DM-G group was increased compared with the C-G group
(P<0.05). Pairwise comparisons demonstrated that, following G
treatment, serum ACP levels decreased significantly in all groups
compared with the respective G-untreated groups (all
P<0.05).
Serum SOD decreased in all experimental groups
(G-untreated) compared with the C group (all P<0.05). CIH-DM
group levels of SOD decreased significantly compared with the level
in the DM group (P<0.05). Pairwise comparisons revealed that
serum SOD levels increased significantly following G treatment in
all model groups compared with the respective G-untreated groups
(all P<0.05; Fig. 5Q).
Liver parameters
Liver TBARS levels were elevated in all model groups
compared with the level in the C group (all P<0.05; Fig. 6A). Liver TBARS levels were also
elevated in the CIH-DM group compared with the DM group
(P<0.05). Pairwise comparisons revealed that G treatment
resulted in the decrease of liver TBARS in all model groups
compared with the respective G-untreated groups (P<0.05).
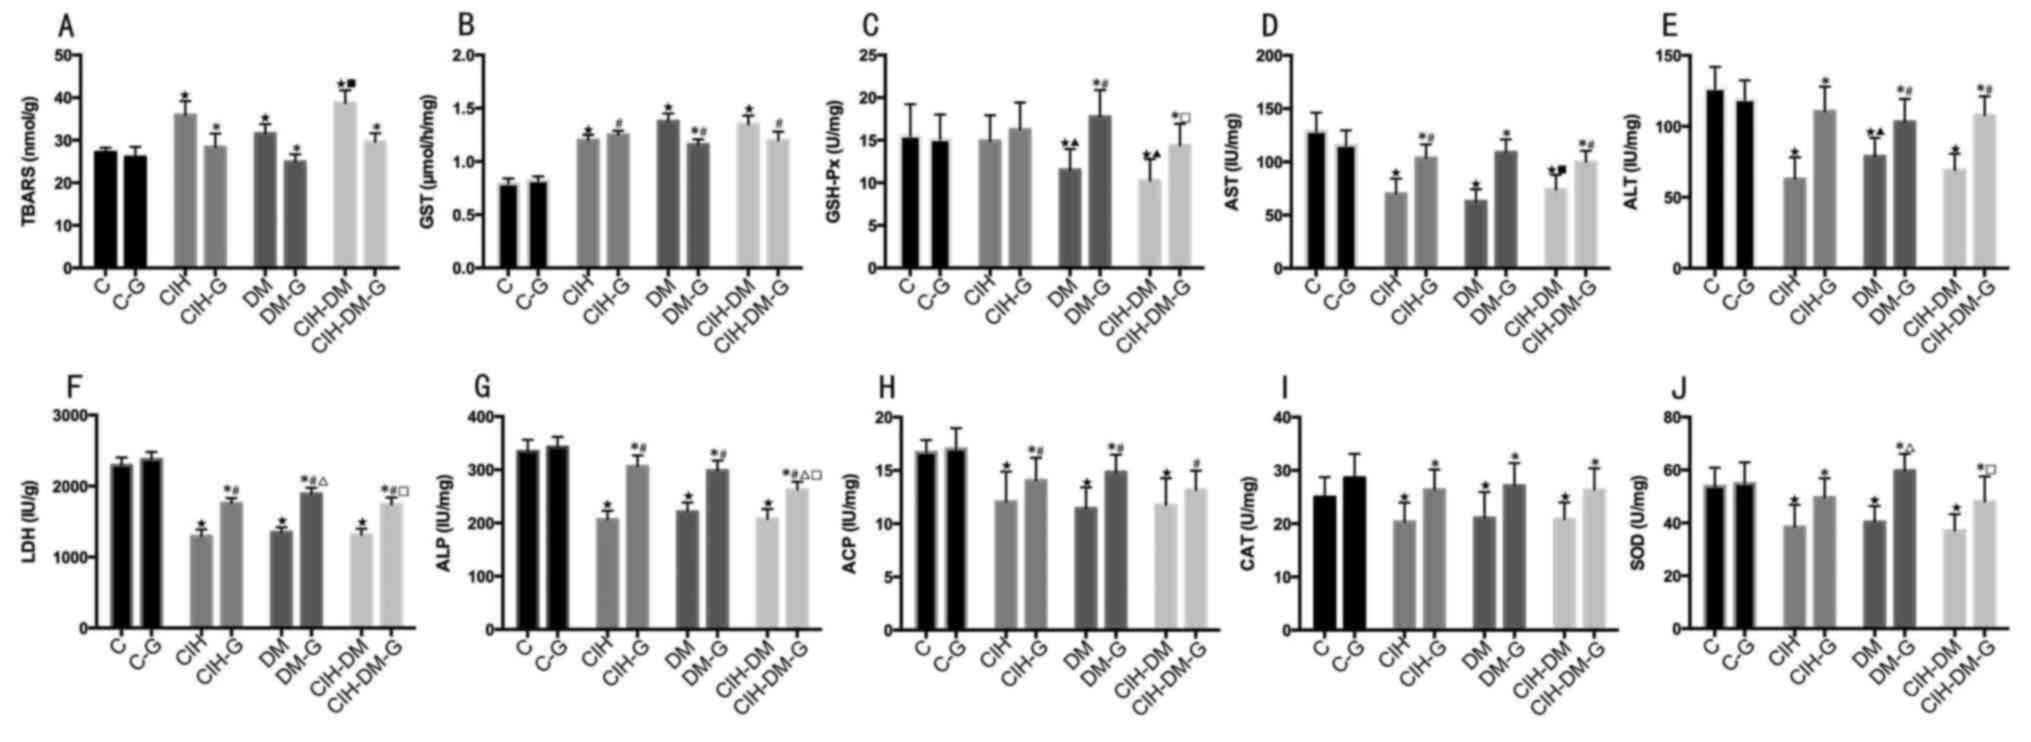 | Figure 6.Comparison of liver parameters
between different groups. Liver levels of (A) TBARS, (B) GST, (C)
GSH-Px, (D) AST, (E) ALT, (F) LDH, (G) ALP, (H) ACP, (I) CAT and
(J) SOD. *P<0.05 vs. the respective group without G treatment;
⋆P<0.05 vs. the C group; ▲P<0.05 vs.
the CIH group; #P<0.05 vs. the C-G group;
∆P<0.05 vs. the CIH-G group; ■P<0.05
vs. the DM group; □P<0.05 vs. the DM-G group. C,
control; CIH, chronic intermittent hypoxia; DM, diabetes mellitus;
CIH-DM, chronic intermittent hypoxia combined with diabetes
mellitus; G, garlic; TBARS, thiobarbituric acid reactive
substances; GST, glutathione S-transferase; GSH-Px, glutathione
peroxidase; AST, aspartate aminotransferase; ALT, alanine
aminotransferase; LDH, lactate dehydrogenase; ALP, alkaline
phosphatases; ACP, acid phosphatases; CAT, catalase activity; SOD,
superoxide dismutase. |
Liver GST levels were significantly elevated in all
model groups with and without G treatment compared with the C group
with and without G treatment, respectively (all P<0.05; Fig. 6B). Pairwise comparisons revealed
that liver TBARS levels decreased significantly only in the DM
group following G treatment (P<0.05)
Liver GSH-Px levels in the DM and CIH-DM groups
decreased significantly compared with the levels in the C and CIH
groups (both P<0.05; Fig. 6C).
Liver GSH-Px in the DM-G group was significantly increased compared
with that in the C-G and CIH-DM-G groups (both P<0.05). Pairwise
comparisons revealed that liver GSH-Px levels in the DM-G and
CIH-DM-G groups were significantly increased compared with the
levels in the respective G-untreated groups (both P<0.05).
Liver AST, ALT, LDH and ALP levels in all
experimental groups (G-untreated) were decreased compared with the
levels in the respective C groups (all P<0.05, Fig. 6D-G). Liver AST levels in the CIH-DM
group were increased compared with the DM group (P<0.05;
Fig. 6D). Liver AST, ALT and LDH
in the CIH-G and CIH-DM-G groups were lower than the levels in the
respective C-G groups (all P<0.05; Fig. 6D-F). Pairwise comparisons reveled
that G treatment significantly increased AST, ALT, LDH and ALP
levels in all model groups compared with the levels in the
respective G-untreated groups (all P<0.05; Fig. 6D-F).
Liver ACP, CAT and SOD levels decreased
significantly in all model groups compared with the respective
control groups (all P<0.05; Fig.
6H-J). Liver ACP levels in all experimental G-treated groups
were elevated compared with the C-G group (all P<0.05; Fig. 6H). Pairwise comparisons revealed
that, except for the APC levels in the CIH-DM-G group, APC, CAT and
SOD levels in all model groups were significantly increased
following G treatment (all P<0.05; Fig. 6H-J).
Renal parameters
Renal TBARS levels in the DM and CIH-DM groups were
significantly increased compared with the level in the C group
(both P<0.05; Fig. 7A). Renal
GST levels in all experimental groups untreated and treated with G
were elevated compared with the C and C-G groups, respectively (all
P<0.05; Fig. 7B). Pairwise
comparisons revealed that renal levels of GST in the CIH-G, DM-G
and CIH-DM-G groups were lower than those of the respective
G-untreated groups (both P<0.05). Renal CAT and SOD levels
decreased in all model groups treated and untreated with G compared
with the levels in the respective C-G and C groups, respectively
(all P<0.05; Fig. 7C and
D).
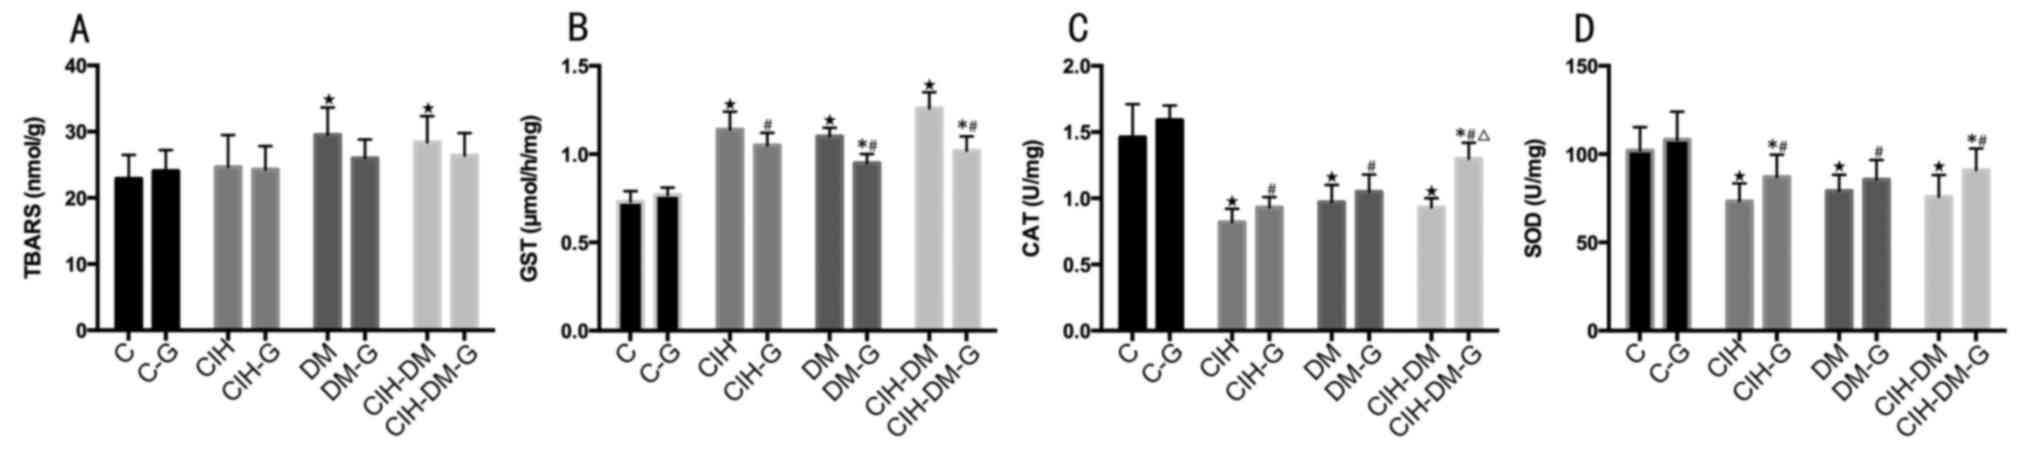 | Figure 7.Comparison of renal parameters
between different groups. Renal levels of (A) TBARS, (B) GST, (C)
CAT and (D) SOD. *P<0.05 vs. the respective group without G
treatment; ⋆P<0.05 vs. the C group;
▲P<0.05 vs. the CIH group; #P<0.05 vs.
the C-G group; ∆P<0.05 vs. the CIH-G group;
■P<0.05 vs. the DM group; □P<0.05 vs.
the DM-G group. C, control; CIH, chronic intermittent hypoxia; DM,
diabetes mellitus; CIH-DM, chronic intermittent hypoxia combined
with diabetes mellitus; G, garlic; TBARS, thiobarbituric acid
reactive substances; GST, glutathione S-transferase; CAT, catalase
activity; SOD, superoxide dismutase. |
Cerebral parameters
Cerebral TBARS levels were elevated in the CIH, DM
and CIH-DM groups compared with the levels in the C group (all
P<0.05; Fig. 8A). In all model
groups, G treatment reduced the TBARs levels compared with the
levels in the respective G-untreated groups (P<0.05). The CIH,
DM and CIH-DM models exhibited no significant effect on cerebral
GST in rats. Furthermore, G treatment had no significant effect on
cerebral GST levels in rats (Fig.
8B).
Cerebral LDH levels in the CIH group were lower than
those in the C, DM and CIH-DM groups (all P<0.05; Fig. 8C). Cerebral LDH levels in the DM
and CIH-DM groups were increased compared with the levels in the C
group (both P<0.05). Cerebral LDH levels in the DM group were
elevated compared with the levels in the CIH-DM group (P<0.05).
Cerebral LDH levels in the CIH-G group were lower than those in any
other G-treated group (all P<0.05). The DM-G and CIH-DM-G groups
demonstrated increased levels of cerebral LDH compared with the
levels in the C-G and CIH-G groups (all P<0.05). Pairwise
comparisons revealed that cerebral LDH levels in the DM-G and
CIH-DM-G groups were lower than those of the respective G-untreated
groups (both P<0.05).
Discussion
In the present study, G extract was used to treat
rats with CIH, DM and CIH-DM. G extract demonstrated beneficial
effects on certain aspects of CIH, DM and CIH-DM. It was determined
that body weight in the CIH, DM and CIH-DM groups decreased
compared with healthy rats from day 14 of the experiment onwards,
which was consistent with results obtained by other research groups
(34,35). G injection increased weight of the
DM and CIH-DM groups, but not the CIH rats, and G improved body
weight and appetite of rats with DM or CIH-DM.
According to Orekhov and Grunwald (36), G may reduce hyperlipidemia and
hypertension and prevent DM and thrombus formation. In the present
study it was demonstrated that, in rat models of DM and CIH-DM,
blood glucose increased markedly, while blood glucose in rats with
CIH was similar to the levels observed in healthy controls. These
results indicated that DM resulted in high levels of blood glucose.
Following G treatment, blood glucose in rats with DM decreased with
time; however, it did not recover to the healthy level. The
decreasing tendency in blood glucose levels in the DM group was
more evident compared with the CIH-DM group, suggesting that CIH
may be one of the factors influencing blood glucose levels and G
treatment could aid in the control of blood glucose, as suggested
in a previous report (36).
Augusti and Sheela (37) demonstrated that G was an insulin
secretagogue in diabetic rats. By detecting insulin, the present
study demonstrated that CIH induced elevated blood insulin levels
with time, while in the DM and CIH-DM groups insulin levels
decreased. These results indicated that the effect of the DM model
on blood insulin in rats may be more significant than the effect of
CIH. G treatment efficiently decreased blood insulin of the CIH, DM
and CIH-DM groups. G treatment increased blood insulin to the
healthy level only in the DM group, while CIH and CIH-DM insulin
levels remained abnormal following treatment. The above results are
consistent with a previous report (37).
In the present study, the HOMA-IR level was elevated
in the CIH group but did not increase in the CIH-DM group. This
observation suggested that IR was primarily induced by CIH. G
treatment recovered the HOMA-IR to the healthy level in the DM and
CIH-DM groups. The above results indicated that G demonstrated a
protective effect in rats with IR.
Increased TBARS levels in serum and organs indicated
elevated levels of lipid peroxides. Elevated serum NO levels in
rats with DM and CIH-DM suggested that oxidative stress (OS) was
enhanced in DM and CIH-DM rats. Seo et al (38) reported elevated TBARS levels in
erythrocytes and the liver in rats with DM, indicating that
hyperglycemia may increase the OS. The results of the present study
supported the above hypothesis. Following G treatment, TBARS
decreased markedly in serum and organs (except for the kidney). The
results of the present study demonstrated that G improves
antioxidant enzyme activities in serum and organs.
In order to protect molecules from ROS and free
radicals, cells stimulate antioxidant defense systems including
SOD, CAT, GR and GSH-Px. According to Harman (39), SOD converts superoxide anions into
H2O2 by CAT or into glutathione disulfide
(GSSG) by GSH-Px. GR catalyzes cleavage of GSSG into GSH (40). In the present study, the activity
of CAT and SOD in serum, and CAT, GSH-Px and SOD in the liver and
kidney in CIH, DM and CIH-DM models decreased, as did serum GR in
the CIH and CIH-DM groups, while serum GR markedly increased in the
DM group. Except for the kidney in the CIH and DM groups, garlic
efficiently improved the activities of CAT, GR, GSH-Px and SOD in
serum and organs in all model groups, demonstrating the potency of
garlic to remove superoxide anions.
Additionally, serum AST, ALT, LDH, ALP and ACP, and
cerebral LDH increased markedly in the DM and CIH-DM groups, while
liver AST, ALT, LDH, ALP and ACP, and cerebral LDH in decreased in
CIH rats. The above results suggest the possibility of hepatic
dysfunction and the leakage of these enzymes from liver cell
cytosol into the blood stream, as previously suggested by
Concepción Navarro et al (41). Cerebral LDH levels in rats in the
CIH-DM group were similar to the levels in the DM group in the
present study, suggesting that DM was the predominant factor
influencing cerebral LDH. The research conducted by Larcan et
al (42) supported the results
of the present study. Except for serum ALP and cerebral LDH in the
CIH group, and liver ACP in the CIH-DM group, G treatment reduced
the activities of ALP and APC in serum and increased them in the
liver, suggesting a therapeutic and protective effect of G on CIH,
DM and CIH-DM models, as previously hypothesized by Ohaeri
(43).
GST serves a role in detoxification and metabolism
of xenobiotic and endobiotic compounds (44). Elevated levels of GST in serum and
organs of rats in the CIH, DM or CIH-DM groups in the present study
indicated that defense mechanisms were stimulated. G therapy
decreased GST levels in serum and organs, suggesting that G could
protect the body from imbalance between free radicals and
anti-oxidants, as previously suggested by Anwar and Meki (45).
CIH, DM and CIH-DM induced elevated serum TC, TG and
TL, while serum albumin decreased in DM and CIH-DM but not in CIH
rats. Abnormal albumin was induced predominantly by DM, as
previously suggested (46,47). G aided in the regulation of serum
albumin, TC, TG and TL in rats with CIH, DM and CIH-DM, indicating
that G may regulate lipid metabolism. In addition, increased
secretion of UA and UP indicates elevated free radical production
due to the activation of the xanthine oxidase enzyme system
(48). In the present study, UA
and UP levels increased in the CIH, DM and CIH-DM groups,
suggesting dysregulation of metabolism. As a result of G therapy,
UA and UP decreased, demonstrating that G may regulate
metabolism.
In a conclusion, to the best of our knowledge, the
present study is the first to demonstrate the anti-oxidant,
alexeteric and protective effects of G in the context of regulating
the imbalance of glucose, insulin and lipid metabolisms in rat
models of CIH, DM and CIH-DM. The present study suggested that
garlic might ameliorate the disorders of homeostasis and metabolism
induced by CIH combined with DM.
Acknowledgements
The present study was supported by Dr Ke Hu and
Renmin Hospital of Wuhan University (Wuhan China).
References
|
1
|
Lin Z: Advancement on obstructive sleep
apnea hypopnea syndrome (OSAHS) in last decade. Chin Arch
Otolaryngol Head Neck Surgery. 11:43–45. 2004.(In Chinese).
|
|
2
|
de Sousa AG, Cercato C, Mancini MC and
Halpern A: Obesity and obstructive sleep apnea-hypopnea syndrome.
Obesity Rev. 9:340–354. 2008. View Article : Google Scholar
|
|
3
|
Taxy JB: Surgical pathology of the head
and neck. Mod Pathol. 5:6691992.PubMed/NCBI
|
|
4
|
Halbower AC, Degaonkar M, Barker PB,
Earley CJ, Marcus CL, Smith PL, Prahme MC and Mahone EM: Childhood
obstructive sleep apnea associates with neuropsychological deficits
and neuronal brain injury. Plos Med. 3:e3012006. View Article : Google Scholar : PubMed/NCBI
|
|
5
|
Choo J: Michael Friedman sleep apnea and
snoring-surgical and non-surgical therapy 2008 Saunders Elsevier
452 pages, $249.00. Otolaryngology-Head and Neck Surgery. 142
Suppl:S43. 2010. View Article : Google Scholar
|
|
6
|
Eva AC, Eduardo EE, José MB, José MLC and
Enrique SR: Obstructive sleep apnea syndrome (OSAS). Review of the
literature. Med Oral Patol Oral Cir Bucal. 17:e925–e929.
2012.PubMed/NCBI
|
|
7
|
Iftikhar IH, Kline and Youngstedt SD:
Effects of exercise training on sleep apnea: A meta-analysis. Lung.
192:175–184. 2014. View Article : Google Scholar : PubMed/NCBI
|
|
8
|
Qaseem A, Dallas P, Owens DK, Starkey M,
Holty JE and Shekelle P; Clinical Guidelines Committee of the
American College of Physicians, : Diagnosis of obstructive sleep
apnea in adults: A clinical practice guideline from the American
college of physicians. Ann Intern Med. 161:210–220. 2014.
View Article : Google Scholar : PubMed/NCBI
|
|
9
|
Peng Y, Kline DD, Dick TE and Prabhakar
NR: Chronic intermittent hypoxia enhances carotid body
chemoreceptor response to low oxygen. Adv Exp Med Biol. 499:33–38.
2001. View Article : Google Scholar : PubMed/NCBI
|
|
10
|
Ma L, Zhang J and Liu Y: Roles and
mechanisms of obstructive sleep apnea-hypopnea syndrome and chronic
intermittent hypoxia in atherosclerosis: Evidence and prospective.
Oxid Med Cell Longev. 2016:1–10. 2016. View Article : Google Scholar
|
|
11
|
Torrella M, Castells I, Gimenez-Perez G,
Recasens A, Miquel M, Simó O, Barbeta E and Sampol G: Intermittent
hypoxia is an independent marker of poorer glycaemic control in
patients with uncontrolled type 2 diabetes. Diabetes Metab.
41:312–318. 2015. View Article : Google Scholar : PubMed/NCBI
|
|
12
|
Liu YY, Sun ZL, Li ZX, Jiang W and Feng
XR: Relation between obstructive sleep apnea-hypopnea syndrome and
type-2 diabetes mellitus. Clin J Med Officer. 2006.(In
Chinese).
|
|
13
|
Vatansever E, Surmen-Gur E, Ursavas A and
Karadag M: Obstructive sleep apnea causes oxidative damage to
plasma lipids and proteins and decreases adiponectin levels. Sleep
Breath. 15:275–282. 2011. View Article : Google Scholar : PubMed/NCBI
|
|
14
|
Louis M and Punjabi NM: Effects of acute
intermittent hypoxia on glucose metabolism in awake healthy
volunteers. J Appl Physiol (1985). 106:1538–1544. 2009. View Article : Google Scholar : PubMed/NCBI
|
|
15
|
Reichmuth KJ, Austin D, Skatrud JB and
Young T: Association of sleep apnea and type II diabetes: A
population-based study. Am J Respir Crit Care Med. 172:1590–1595.
2005. View Article : Google Scholar : PubMed/NCBI
|
|
16
|
Lavie L: Obstructive sleep apnoea
syndrome-an oxidative stress disorder. Sleep Med Rev. 7:35–51.
2003. View Article : Google Scholar : PubMed/NCBI
|
|
17
|
Lavie L, Vishnevsky A and Lavie P:
Evidence for lipid peroxidation in obstructive sleep apnea. Sleep.
27:123–128. 2004.PubMed/NCBI
|
|
18
|
Statsenko ME and Talagaev SV: The
influence of obstructive sleep apnea syndrome on lipid metabolism
and atherosclerotic lesion of carotid arteries in patients with
arterial hypertension. Russian J Cardiol. 110:52–56. 2014.(In
Russian). View Article : Google Scholar
|
|
19
|
Tanné F, Gagnadoux F, Chazouillères O,
Fleury B, Wendum D, Lasnier E, Lebeau B, Poupon R and Serfaty L:
Chronic liver injury during obstructive sleep apnea. Hepatology.
41:1290–1296. 2005. View Article : Google Scholar : PubMed/NCBI
|
|
20
|
Abuyassin B, Sharma K, Ayas NT and Laher
I: Obstructive sleep apnea and kidney disease: A potential
bidirectional relationship? J Clin Sleep Med. 11:915–924.
2015.PubMed/NCBI
|
|
21
|
Macey PM, Henderson LA, Macey KE, Alger
JR, Frysinger RC, Woo MA, Harper RK, Yan-Go FL and Harper RM: Brain
morphology associated with obstructive sleep apnea. American J
Respir Crit Care Med. 166:1382–1387. 2002. View Article : Google Scholar
|
|
22
|
Morrell MJ, McRobbie DW, Quest RA, Cummin
AR, Ghiassi R and Corfield DR: Changes in brain morphology
associated with obstructive sleep apnea. Sleep Med. 4:451–454.
2003. View Article : Google Scholar : PubMed/NCBI
|
|
23
|
Ahmed N, Laverick L, Sammons J, Zhang H,
Maslin DJ and Hassan HT: Ajoene, a garlic-derived natural compound,
enhances chemotherapy-induced apoptosis in human myeloid leukaemia
CD34-positive resistant cells. Anticancer Res. 21:3519–3523.
2001.PubMed/NCBI
|
|
24
|
Macan H, Uykimpang R, Alconcel M, Takasu
J, Razon R, Amagase H and Niihara Y: Aged garlic extract may be
safe for patients on warfarin therapy. J Nutr. 136 3
Suppl:S793–S795. 2006. View Article : Google Scholar
|
|
25
|
Belman S: Onion and garlic oils inhibit
tumor promotion. Carcinogenesis. 4:1063–1065. 1983. View Article : Google Scholar : PubMed/NCBI
|
|
26
|
Ashraf R, Aamir K, Shaikh AR and Ahmed T:
Effects of garlic on dyslipidemia in patients with type 2 diabetes
mellitus. J Ayub Med Coll Abbottabad. 17:60–64. 2005.PubMed/NCBI
|
|
27
|
Lee YM, Gweon OC, Seo YJ, Im J, Kang MJ,
Kim MJ and Kim JI: Antioxidant effect of garlic and aged black
garlic in animal model of type 2 diabetes mellitus. Nutr Res Pract.
3:156–161. 2009. View Article : Google Scholar : PubMed/NCBI
|
|
28
|
Committee for the Update of the Guide for
the Care and Use of Laboratory Animals, Institute for Laboratory
Animal Research, Division on Earth and Life Studies and National
Research Council, . Guide for the Care and Use of Laboratory
Animals. The National Academies Press; Washington, D.C.: 1996
|
|
29
|
Louhimies S: Revised EU legislation on the
protection of animals used for scientific purposes. Directive
2010/63/EU. J Shellfish Res. 30:2011.
|
|
30
|
Muhm JM, Rock PB, McMullin DL, Jones SP,
Lu IL, Eilers KD, Space DR and McMullen A: Effect of aircraft-cabin
altitude on passenger discomfort. N Engl J Med. 357:18–27. 2007.
View Article : Google Scholar : PubMed/NCBI
|
|
31
|
Geloneze B, Vasques AC, Stabe CF, et al:
HOMA1-IR and HOMA2-IR indexes in identifying insulin resistance and
metabolic syndrome: Brazilian Metabolic Syndrome Study (BRAMS).
Arquivos Brasileiros De Endocrinologia E Metabologia. 53:281–287.
2009. View Article : Google Scholar : PubMed/NCBI
|
|
32
|
Albus U: Guide for the Care and Use of
Laboratory Animals, 8th Ed. Laboratory Animals. 46:267–268. 2012.
View Article : Google Scholar
|
|
33
|
Thayer WS: Serum lipid peroxides in rats
treated chronically with adriamycin. Biochem Pharmacol.
33:2259–2263. 1984. View Article : Google Scholar : PubMed/NCBI
|
|
34
|
Pozo ME, Cave A, Köroğlu OA, Litvin DG,
Martin RJ, Di Fiore J and Kc P: Effect of postnatal intermittent
hypoxia on growth and cardiovascular regulation of rat pups.
Neonatology. 102:107–113. 2012. View Article : Google Scholar : PubMed/NCBI
|
|
35
|
Sahin K, Onderci M, Tuzcu M, Ustundag B,
Cikim G, Ozercan IH, Sriramoju V, Juturu V and Komorowski JR:
Effect of chromium on carbohydrate and lipid metabolism in a rat
model of type 2 diabetes mellitus: The fat-fed,
streptozotocin-treated rat. Metabolism. 56:1233–1240. 2007.
View Article : Google Scholar : PubMed/NCBI
|
|
36
|
Orekhov AN and Grünwald J: Effects of
garlic on atherosclerosis. Nutrition. 13:656–663. 1997. View Article : Google Scholar : PubMed/NCBI
|
|
37
|
Augusti KT and Sheela CG: Antiperoxide
effect of S-allyl cysteine sulfoxide, an insulin secretagogue, in
diabetic rats. Experientia. 52:115–119. 1996. View Article : Google Scholar : PubMed/NCBI
|
|
38
|
Seo YJ, Gweon OH, Seo YJ, Lee YM, Kang MJ
and Kim JI: Effect of garlic and aged black garlic on hyperglycemia
and dyslipidemia in animal model of type 2 diabetes mellitus. J
Food Sci Nutr. 14:1–7. 2009.
|
|
39
|
Harman D: The aging process: Major risk
factor for disease and death. Proc Natl Acad Sci USA. 88:pp.
5360–5363. 1991; View Article : Google Scholar : PubMed/NCBI
|
|
40
|
Moron MS, Depierre JW and Mannervik B:
Levels of glutathione, glutathione reductase and glutathione
S-transferase activities in rat lung and liver. Biochim Biophys
Acta. 582:67–78. 1979. View Article : Google Scholar : PubMed/NCBI
|
|
41
|
Concepción Navarro M, Pilar Montilla M,
Martín A, Jiménez J and Pilar Utrilla M: Free radicals scavenger
and antihepatotoxic activity of Rosmarinus. Planta Med. 59:312–314.
1993. View Article : Google Scholar : PubMed/NCBI
|
|
42
|
Larcan A, Lambert H, Laprevote-Heully MC
and Delorme N: Light and electron microscopic study of hepatic
lesions in the course of hyperlactatemia in diabetic patients
(author's transl). Diabete Metab. 5:103–112. 1979.(In French).
PubMed/NCBI
|
|
43
|
Ohaeri OC: Effect of garlic oil on the
levels of various enzymes in the serum and tissue of streptozotocin
diabetic rats. Biosci Rep. 21:19–24. 2001. View Article : Google Scholar : PubMed/NCBI
|
|
44
|
Ji X, Zhang P, Armstrong RN and Gilliland
GL: The three-dimensional structure of a glutathione S-transferase
from the mu gene class. Structural analysis of the binary complex
of isoenzyme 3-3 and glutathione at 2.2-A resolution. Biochemistry.
31:10169–10184. 1992. View Article : Google Scholar : PubMed/NCBI
|
|
45
|
Anwar MM and Meki AR: Oxidative stress in
streptozotocin-induced diabetic rats: Effects of garlic oil and
melatonin. Comp Biochem Physiol A Mol Integr Physiol. 135:539–547.
2003. View Article : Google Scholar : PubMed/NCBI
|
|
46
|
Yao Q, Shin MK, Jun JC, Hernandez KL,
Aggarwal NR, Mock JR, Gay J, Drager LF and Polotsky VY: Effect of
chronic intermittent hypoxia on triglyceride uptake in different
tissues. J Lipid Res. 54:1058–65. 2013. View Article : Google Scholar : PubMed/NCBI
|
|
47
|
Vergès B: Anomalies of lipid metabolism in
diabetes mellitus. Rev Med Interne. 12:277–281. 1991.(In French).
View Article : Google Scholar : PubMed/NCBI
|
|
48
|
Németh I, Tálosi G, Papp A and Boda D:
Xanthine oxidase activation in mild gestational hypertension.
Hypertens Pregnancy. 21:1–11. 2002. View Article : Google Scholar
|