Introduction
Multiple organ dysfunction syndrome (MODS) is
characterized by the development of progressive physiological
dysfunction of at least two organs or organ systems that is induced
by various acute physiological damages, including trauma, burns,
shock and severe infection (1,2).
MODS is responsible for the majority of the morbidity and mortality
among patients in intensive care units (3,4).
MODS primarily affects the lungs, liver, kidney and heart (3).
Multiple factors contribute to the pathological
process of MODS; however, the immunoinflammatory system is
considered to serve the most important role in the pathogenesis of
MODS (5,6). In the early stage of MODS, abundant
release of proinflammatory cytokines, including tumor necrosis
factor-α and interleukin (IL)-1β, upregulates the expression of
vascular cell adhesion molecule 1 and endothelial leukocyte
adhesion molecule 1, and enhances the adhesion of monocytes and T
cells to endothelial cells (7,8).
During later stages of MODS, damage to the endothelium activates
innate inflammatory cells in the interstitial region of affected
organs and parenchymal injury occurs (5). Furthermore, other factors have been
reported to be closely associated with the pathogenesis of MODS.
For example, mitochondrial dysfunction is implicated in organ
injury through accelerated secretion of oxidants and promotion of
cell death (9). Increased heme
oxygenase-1 and reduced non-specific δ-aminolevulinate synthase has
been reported in septic animal models of MODS (10). A recent study demonstrated that
tissue fibrosis is a common pathogenic pathway that is implicated
in organ injury or failure, and multiple molecules are involved in
this pathway, including mitogen-activated protein kinase (MAPK),
rho-associated protein kinase and transforming growth factor
(TGF)-β (11).
Gene microarrays have been widely used to
investigate the nosogenesis of various diseases, including
psychiatric disorders, eczema, sepsis and multiple cancer types
(12–16). A recent study by Gharib et
al (17) focused on processes
that were frequently activated in at-risk organs and identified
various putative factors implicated in early MODS based on a
microarray analysis. However, numerous genes associated with the
progression of MODS have not yet been identified and underlying
gene regulatory mechanisms remain to be elucidated. In the present
study, a gene expression profile (GSE60088) submitted by Gharib
et al (17). was used to
identify differentially expressed genes (DEGs) in lung, liver and
kidney tissues of mouse models of MODS. The functions of, and
interactions between, DEGs were subsequently analyzed. Furthermore,
DEGs that were common among lung, liver and kidney tissues were
determined, and the transcription factors (TFs) regulating them
were predicted. The results of the present study may contribute to
the understanding of the molecular mechanisms underlying MODS.
Materials and methods
Affymetrix microarray data
The raw gene expression profile dataset GSE60088 was
downloaded from the public Gene Expression Omnibus database
(http://www.ncbi.nlm.nih.gov/geo/)
(17). Microarray data were
generated by the Affymetrix Mouse Genome 430 2.0 Array platform
(accession no. GPL1261; Affymetrix; Thermo Fisher Scientific, Inc.,
Waltham, MA, USA). A total of 27 tissue samples from a murine model
of sepsis-induced MODS or controls were included in the dataset,
including 5 lung samples from mice with MODS, 4 healthy lung
samples, 5 liver samples from mice with MODS, 3 healthy liver
samples, 5 kidney samples from mice with MODS and 5 healthy kidney
samples. The murine model of sepsis-induced MODS was established by
exposure to a combination of mechanical ventilation and
Staphylococcus aureus pneumonia (17).
CEL files and probe annotation files were downloaded
from the Affymetrix database. Gene expression data from all samples
were preprocessed with background correction, quantile
normalization and calculation of gene expression using the robust
microarray analysis algorithm of the Affy package (v1.54.0)
(18) downloaded from Bioconductor
(http://www.bioconductor.org/).
Subsequently, annotations file org.Mm.eg.db and mouse4302.db in R
language (v3.1.3) were downloaded from Bioconductor, and were used
for the conversion of probe IDs to gene symbols (19,20).
If one gene symbol was matched by multiple probe IDs, then the mean
expression value was selected as the expression level of this
gene.
Identification of DEGs
The linear models for microarray data (Limma;
v3.32.2) package (21) in R
language (v3.1.3) was used to identify DEGs between samples from
mice with MODS and healthy lung, liver and kidney control samples.
The P-value for the differential expression of each gene was
calculated using an unpaired t-test and adjusted to the false
discovery rate (FDR) using the Benjamini-Hochberg method (22). Only genes with FDR<0.05 and
|log2fold change|≥1 were selected as DEGs. Additionally,
DEGs identified in each type of tissue were clustered using gplots
package (v3.5.0) in the R software (v3.1.3) (23). Ultimately, heatmaps were generated
with the pheatmap (24) package in
R language (v3.1.3).
Pathway enrichment analysis
Kyoto Encyclopedia of Genes and Genomes (KEGG)
pathway enrichment analysis of DEGs in lung, liver and kidney
samples was performed using the Database for Annotation,
Visualization and Integrated Discovery (DAVID; http://david.abcc.ncifcrf.gov/) (25). The P-value was calculated by
Fisher's exact test, and P<0.05 and gene count >2 were set as
the cut-off criteria.
Construction of protein-protein
interaction (PPI) networks
The PPI networks of DEGs in lung, liver and kidney
tissues were identified using the Search Tool for the Retrieval of
Interacting Genes (STRING; http://string-db.org/) database, which integrates
various known and predicted protein associations (26). A combined score >0.7 was set as
the cut-off criterion. Subsequently, the PPI network was visualized
by Cytoscape software (v3.3.0; http://cytoscape.org/) (27). In the network, a node represents a
protein product of a gene and lines represent interactions between
proteins. The degree of each node represents the number of nodes
that interact with a given node. The greater the degree, the closer
the connection to other nodes.
Analysis of the DEGs identified in
lung, liver and kidney tissues
Upregulated and downregulated DEGs that were common
among lung, liver and kidney tissues were identified using the
online tool Venny (v2.0; http://bioinfogp.cnb.csic.es/tools/venny/index.html)
and Venn diagrams were constructed based on the data.
Subsequently, TFs regulating DEGs in all samples
were analyzed using the plugin iRegulon (v1.3) in Cytoscape
(28). Minimum identity between
orthologous genes was set at 0.05 and maximum FDR on motif
similarity was set as 0.001. The larger the normalized enrichment
score (NES) for the output, the more reliable the regulatory
association. In the present study, regulatory associations with
NES>5 were selected to construct the regulatory network
visualized by Cytoscape.
Results
Identification of DEGs
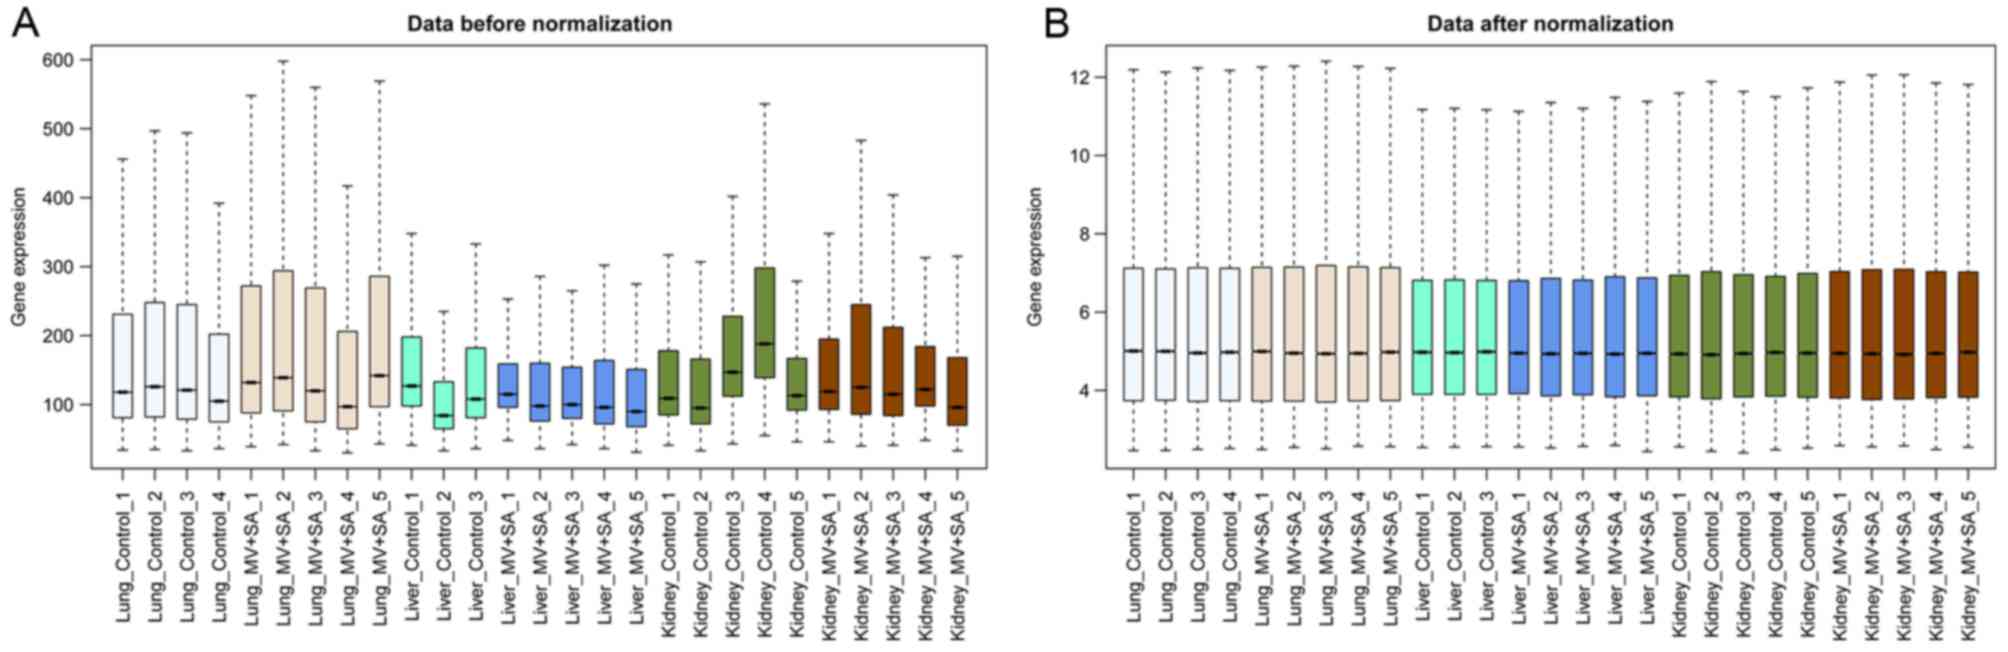
Following data normalization, median gene expression
in each sample was similar (Fig.
1), confirming that the normalized data was suitable for
further analyses. Based on the cut-off criteria, a total of 943
DEGs (618 upregulated and 325 downregulated) were identified in
lung samples from mice with MODS, 267 DEGs (185 upregulated and 82
downregulated) were identified in liver samples from mice with MODS
and 227 DEGs (161 upregulated and 66 downregulated) were identified
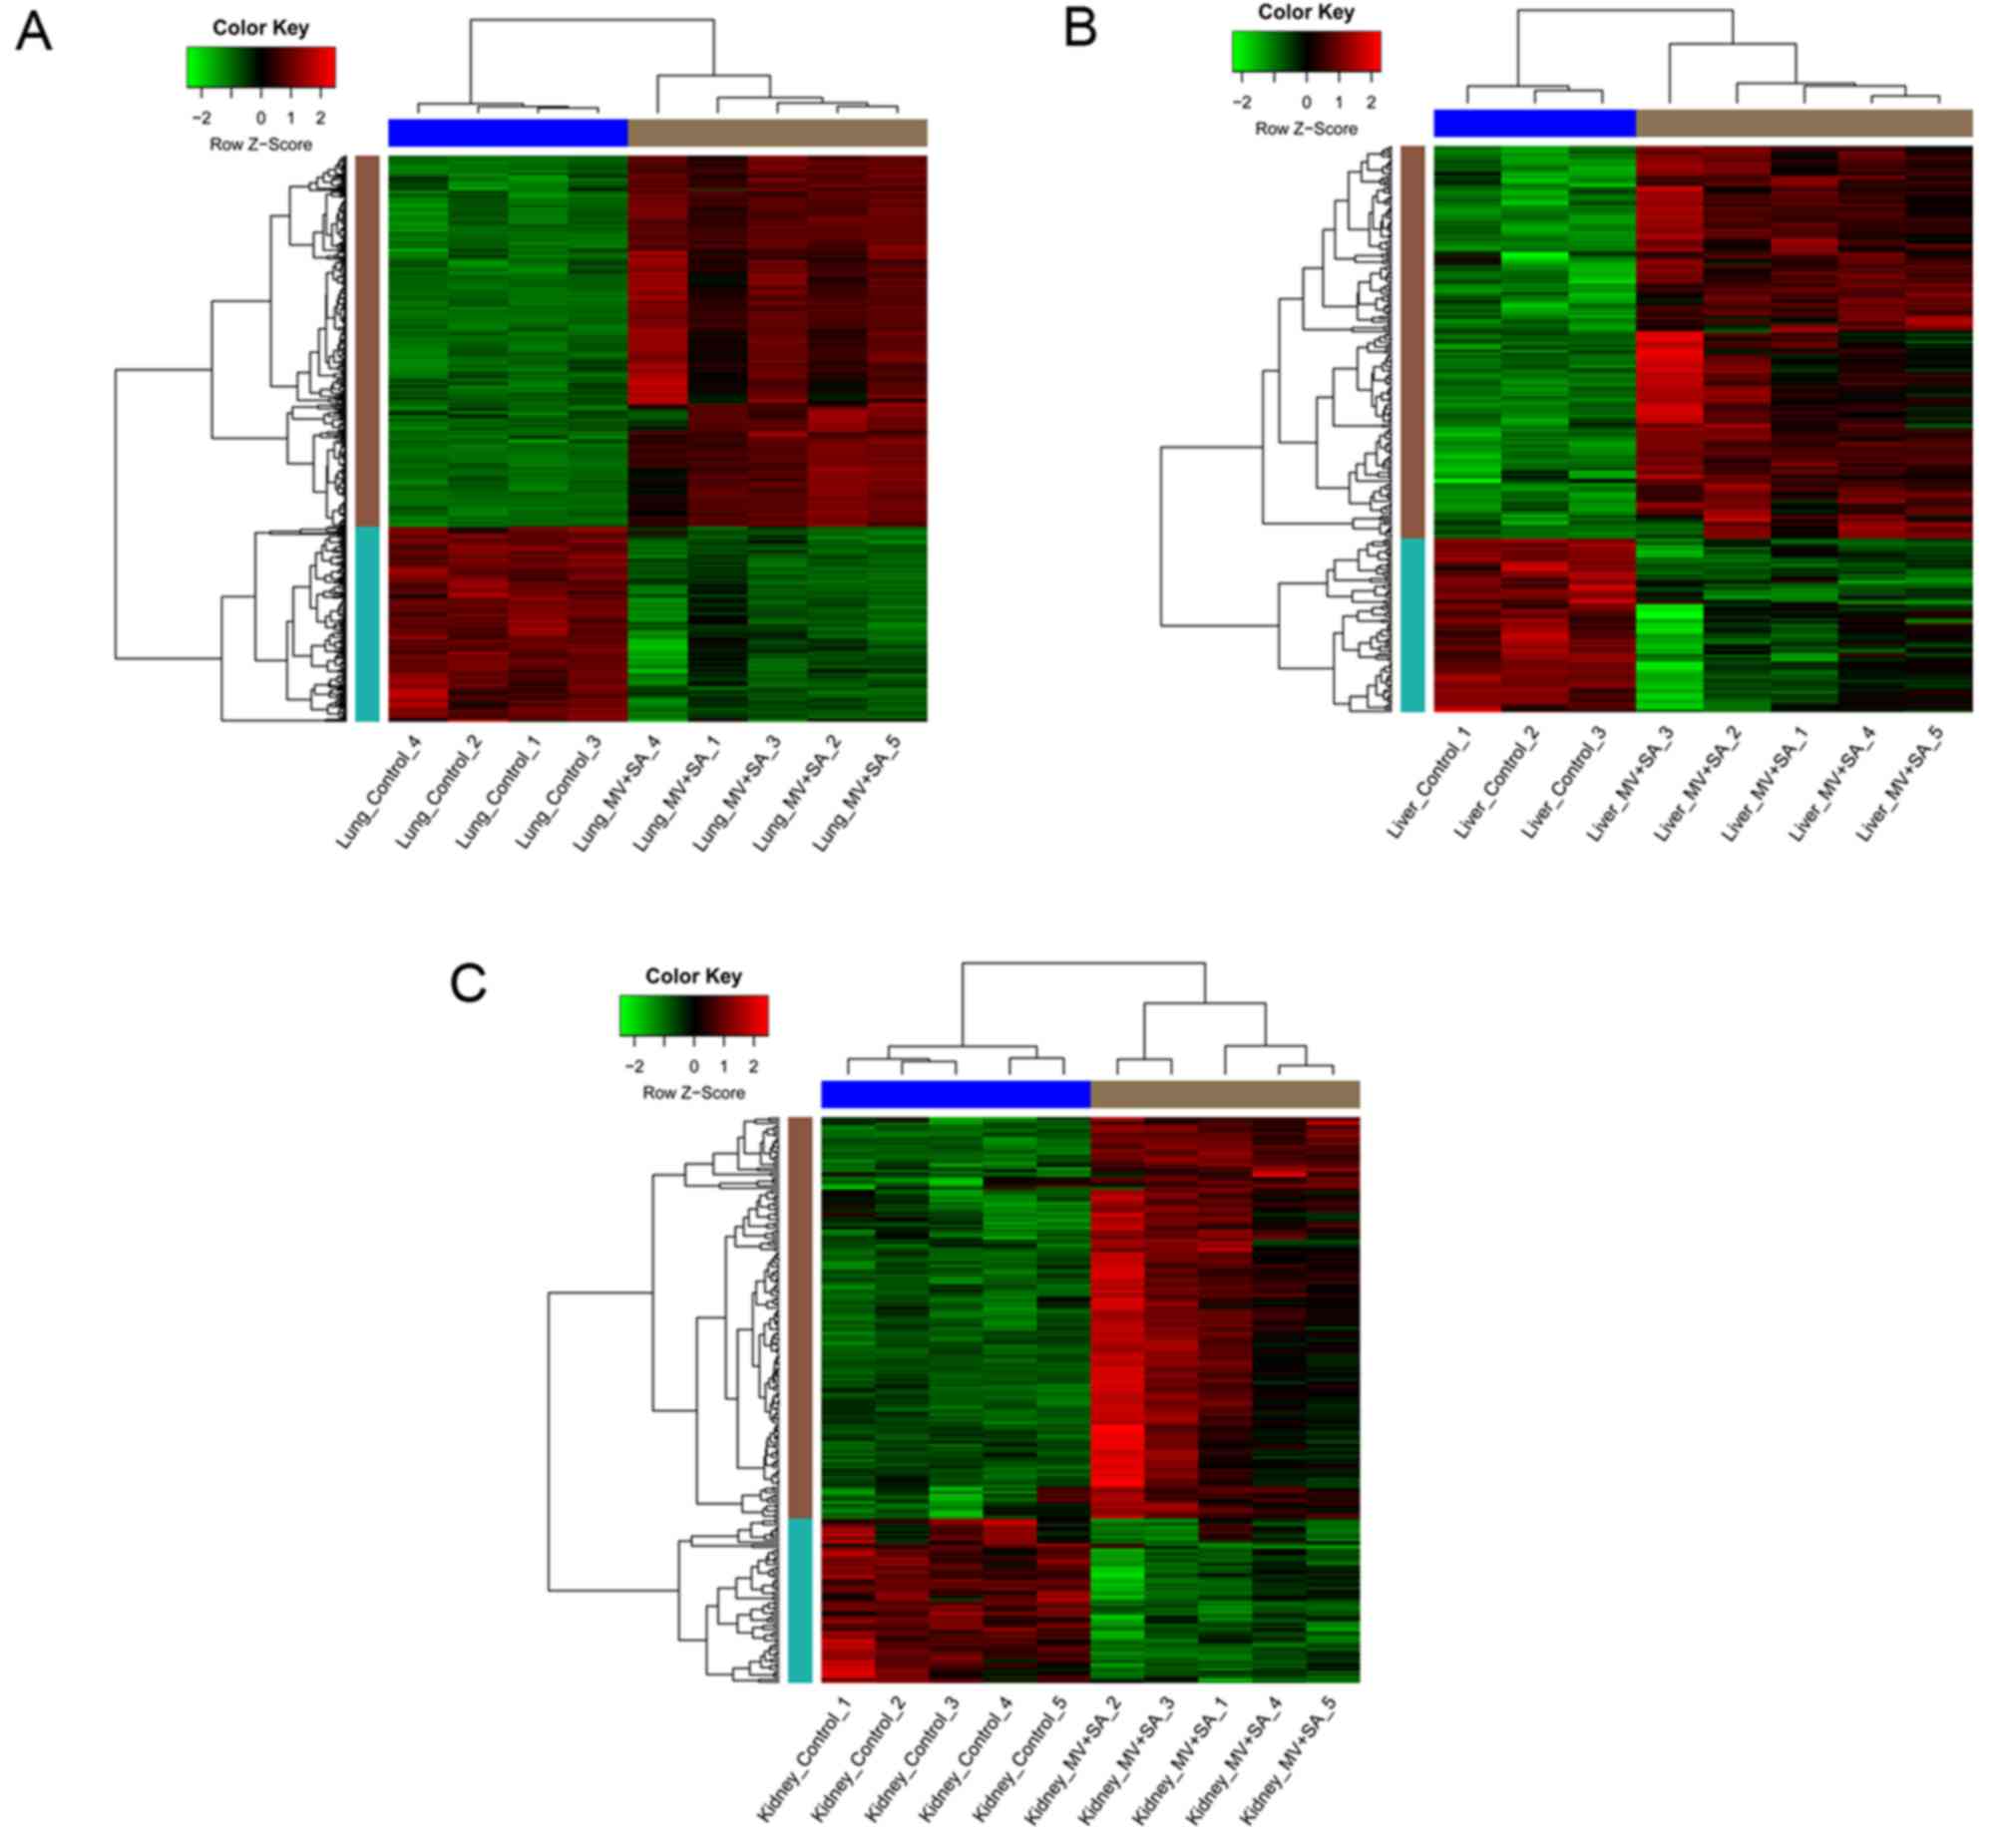
in kidney samples from mice with MODS. Clustering heatmaps
demonstrated that samples from mice with MODS were different
compared with the healthy controls (Fig. 2).
KEGG pathway enrichment analysis of
DEGs
To investigate the biological functions of the
identified DEGs, KEGG pathway enrichment analysis was conducted for
DEGs in lung, liver and kidney samples. According to the pathway
enrichment analysis, in lung samples from mice with MODS,
upregulated DEGs were primarily involved in the following pathways
implicated in immunity: ‘Cytokine-cytokine receptor interaction’,
including C-X-C motif chemokine ligand (Cxcl)1, Cxcl10 and IL-6
DEGs; ‘toll-like receptor signaling pathway’, including Cxcl10,
IL-6 and signal transducer and activator of transcription (Stat)1
DEGs; and ‘Jak-STAT signaling pathway’, including
colony-stimulating factor 3, IL-6 and Stat1 DEGs. The downregulated
DEGs in lung samples from mice with MODS were involved in the
following pathways: ‘Metabolism of xenobiotics by cytochrome P450’,
including glutathione S-transferase α2, aldehyde dehydrogenase 3
family member A1 (Aldh3A1) and cytochrome P450 family 1 subfamily A
member 1 DEGs; ‘ECM-receptor interaction’, including laminin
subunit α2 and collagen type IV α4 chain DEGs; and ‘histidine
metabolism’, including histamine N-methyltransferase and Aldh3A1
DEGs (Table I).
 | Table I.Pathways enriched with DEGs in lung
samples from mice with MODS compared with healthy controls. |
Table I.
Pathways enriched with DEGs in lung
samples from mice with MODS compared with healthy controls.
| A, Pathways that
upregulated DEGs in lung samples from MODS mice were enriched
in |
|---|
|
|---|
| Pathway | P-value | Gene count | DEGs |
|---|
| mmu04060:
Cytokine-cytokine receptor interaction |
7.75×10⁻²² | 52 | Il17Ra, Cxcl10,
Il18Rap, Cd40, Osm, Inhba, Tnfrsf9, Ccr7, Cxcl1, IL-6… |
| mmu04062: Chemokine
signaling pathway |
2.32×10⁻¹⁶ | 39 | Cxcl1, Cxcl10,
Stat1, Ccr5, Cxcl13, Cxcl16, Ccr2, Jak2, Jak3, Xcl1… |
| mmu04620: Toll-like
receptor signaling pathway |
4.06×10⁻¹² | 25 | Ccl3, Tnf, Cxcl10,
Myd88, IL-6, Cd40, Stat1, Ripk1, Irf7, Cd14… |
| mmu04621: NOD-like
receptor signaling pathway |
8.60×10⁻¹¹ | 19 | Cxcl1, IL-6, Tnf,
Ccl2, Cxcl2, Ccl8, Nfkbia, Nlrp3, Ccl5, Ccl7… |
| mmu04630: Jak-STAT
signaling pathway |
7.80×10⁻⁷ | 23 | Csf3, Socs1, Pim1,
Stat1, Il7R, Stat2, Csf2Rb, Jak2, Pik3R5, Jak3… |
|
| B, Pathways that
downregulated DEGs in lung samples from MODS mice were enriched
in |
|
| Pathway | P-value | Gene
count | DEGs |
|
| mmu00982: Drug
metabolism |
5.02×10⁻⁸ | 12 | Gstm1, Gsta2,
Gsta3, Cyp2D22, Adh1, Fmo1, Fmo2, Fmo3, Maob, Aldh3A1… |
| mmu00980:
Metabolism of xenobiotics by cytochrome P450 |
1.68×10⁻⁶ | 10 | Gstm1, Gsta2,
Gsta3, Cyp2F2, Cyp1A1, Adh1, Gstt1, Ephx1, Cyp2E1, Aldh3A1 |
| mmu04512:
ECM-receptor interaction |
5.56×10⁻⁴ | 8 | Lama2, Col4A4,
Tnxb, Npnt, Itga8, Vtn, Thbs3, Chad |
| mmu05414: Dilated
cardiomyopathy |
1.03×10⁻³ | 8 | Lama2, Actc1,
Adrb1, Adcy8, Pln, Itga8, Myh7, Tnni3 |
| mmu00340: Histidine
metabolism |
8.94×10⁻³ | 4 | Hnmt, Acy3, Maob,
Aldh3A1 |
In liver samples from mice with MODS, the
upregulated DEGs were primarily enriched in the following pathways:
‘Jak-STAT signaling pathway’, including Stat1 and Stat3 DEGs;
‘cytokine-cytokine receptor interaction’, including IL-17 receptor
A and Cxcl10 DEGs; ‘p53 signaling pathway’, including serpin family
E member 1 and growth arrest and DNA damage-inducible (Gadd)β
(Gadd45B) DEGs; and ‘MAPK signaling pathway’, including Jun
proto-oncogene, AP-1 transcription factor subunit (Jun) and Gadd45B
DEGs. The downregulated DEGs were primarily involved in the
following pathways: ‘Steroid hormone biosynthesis’, including
hydroxy-∆-5-steroid dehydrogenase, 3 β- and steroid ∆-isomerase 2
(Hsd3B2) and steroid 5 α-reductase 1 (Srd5A1) DEGs; ‘nitrogen
metabolism’, including carbonic anhydrase (Car)5A and Car1 DEGs;
and ‘androgen and estrogen metabolism’, including Hsd3B2 and Srd5A1
DEGs (Table II).
| Table II.Pathways enriched with DEGs in liver
samples from mice with MODS compared with healthy controls. |
Table II.
Pathways enriched with DEGs in liver
samples from mice with MODS compared with healthy controls.
| A, Pathways that
upregulated DEGs in liver samples from MODS mice were enriched
in |
|---|
|
|---|
| Pathway | P-value | Gene count | DEGs |
|---|
| mmu04630: Jak-STAT
signaling pathway |
1.36×10⁻² | 6 | Irf9, Osmr, Socs3,
Il13Ra1, Stat1, Stat3 |
| mmu04060:
Cytokine-cytokine receptor interaction |
2.60×10⁻² | 7 | Inhbb, Cxcl1,
Tnfrsf1A, Osmr, Il13Ra1, Il17Ra, Cxcl10 |
| mmu04115: p53
signaling pathway |
2.67×10⁻² | 4 | Rrm2, Serpine1,
Gadd45B, Gadd45A |
| mmu04010: MAPK
signaling pathway |
3.70×10⁻² | 7 | Tnfrsf1A, Jun,
Pla2G12A, Fgf21, Gadd45B, Gadd45A, Dusp6 |
|
| B, Pathways that
downregulated DEGs in liver samples from MODS mice were enriched
in |
|
| Pathway | P-value | Gene
count | DEGs |
|
| mmu00140: Steroid
hormone biosynthesis |
5.43×10⁻⁴ | 4 | Hsd3B2, Cyp7A1,
Hsd3B5, Srd5A1 |
| mmu00910: Nitrogen
metabolism |
3.08×10⁻³ | 3 | Car5A, Car1,
Car3 |
| mmu00150: Androgen
and estrogen metabolism |
6.29×10⁻³ | 3 | Hsd3B2, Hsd3B5,
Srd5A1 |
In kidney samples from mice with MODS, upregulated
DEGs were primarily involved in the following pathways: ‘MAPK
signaling pathway’, including dual-specificity phosphatase 1 and
Jun DEGs; ‘TGF-β signaling pathway’, including inhibin β B subunit
and SMAD family member 1 DEGs; and ‘p53 signaling pathway’,
including thrombospondin 1 and Gadd α (Gadd45A) DEGs. The
downregulated DEGs were primarily implicated in ‘PPAR signaling
pathway’, including uncoupling protein 1, adiponectin, C1Q and
collagen domain-containing, and fatty acid-binding protein 5 DEGs,
and ‘terpenoid backbone biosynthesis’, including mevalonate
diphosphate decarboxylase and isopentenyl-diphosphate ∆ isomerase 1
DEGs (Table III).
| Table III.Pathways enriched with DEGs in kidney
samples from mice with MODS compared with healthy controls. |
Table III.
Pathways enriched with DEGs in kidney
samples from mice with MODS compared with healthy controls.
| A, Pathways that
upregulated DEGs in kidney samples from MODS mice were enriched
in |
|---|
|
|---|
| Pathway | P-value | Gene count | DEGs |
|---|
| mmu04010: MAPK
signaling pathway |
8.18×10⁻⁴ | 10 | Dusp5, Fos, Dusp4,
Dusp1, Jun, Nr4A1, Fgf21, Gadd45A, Myc, Ddit3 |
| mmu04350: TGF-β
signaling pathway |
9.34×10⁻³ | 5 | Inhbb, Smad1,
Thbs1, Myc, Bmp6 |
| mmu04115: p53
signaling pathway |
2.80×10⁻² | 4 | Cdkn1A, Pmaip1,
Thbs1, Gadd45A |
| mmu05200: Pathways
in cancer |
3.33×10⁻² | 8 | Fos, Cdkn1A, IL-6,
Ptgs2, Jun, Fgf21, Myc, Stat3 |
| mmu04610:
Complement and coagulation cascades |
3.46×10⁻² | 4 | Fgg, Thbd, Fga,
F3 |
|
| B, Pathways that
downregulated DEGs in kidney samples from MODS mice were enriched
in |
|
| Pathway | P-value | Gene
count | DEGs |
|
| mmu03320: PPAR
signaling pathway |
2.75×10⁻² | 3 | Ucp1, Adipoq,
Fabp5 |
| mmu00900: Terpenoid
backbone biosynthesis |
4.54×10⁻² | 2 | Mvd, Idi1 |
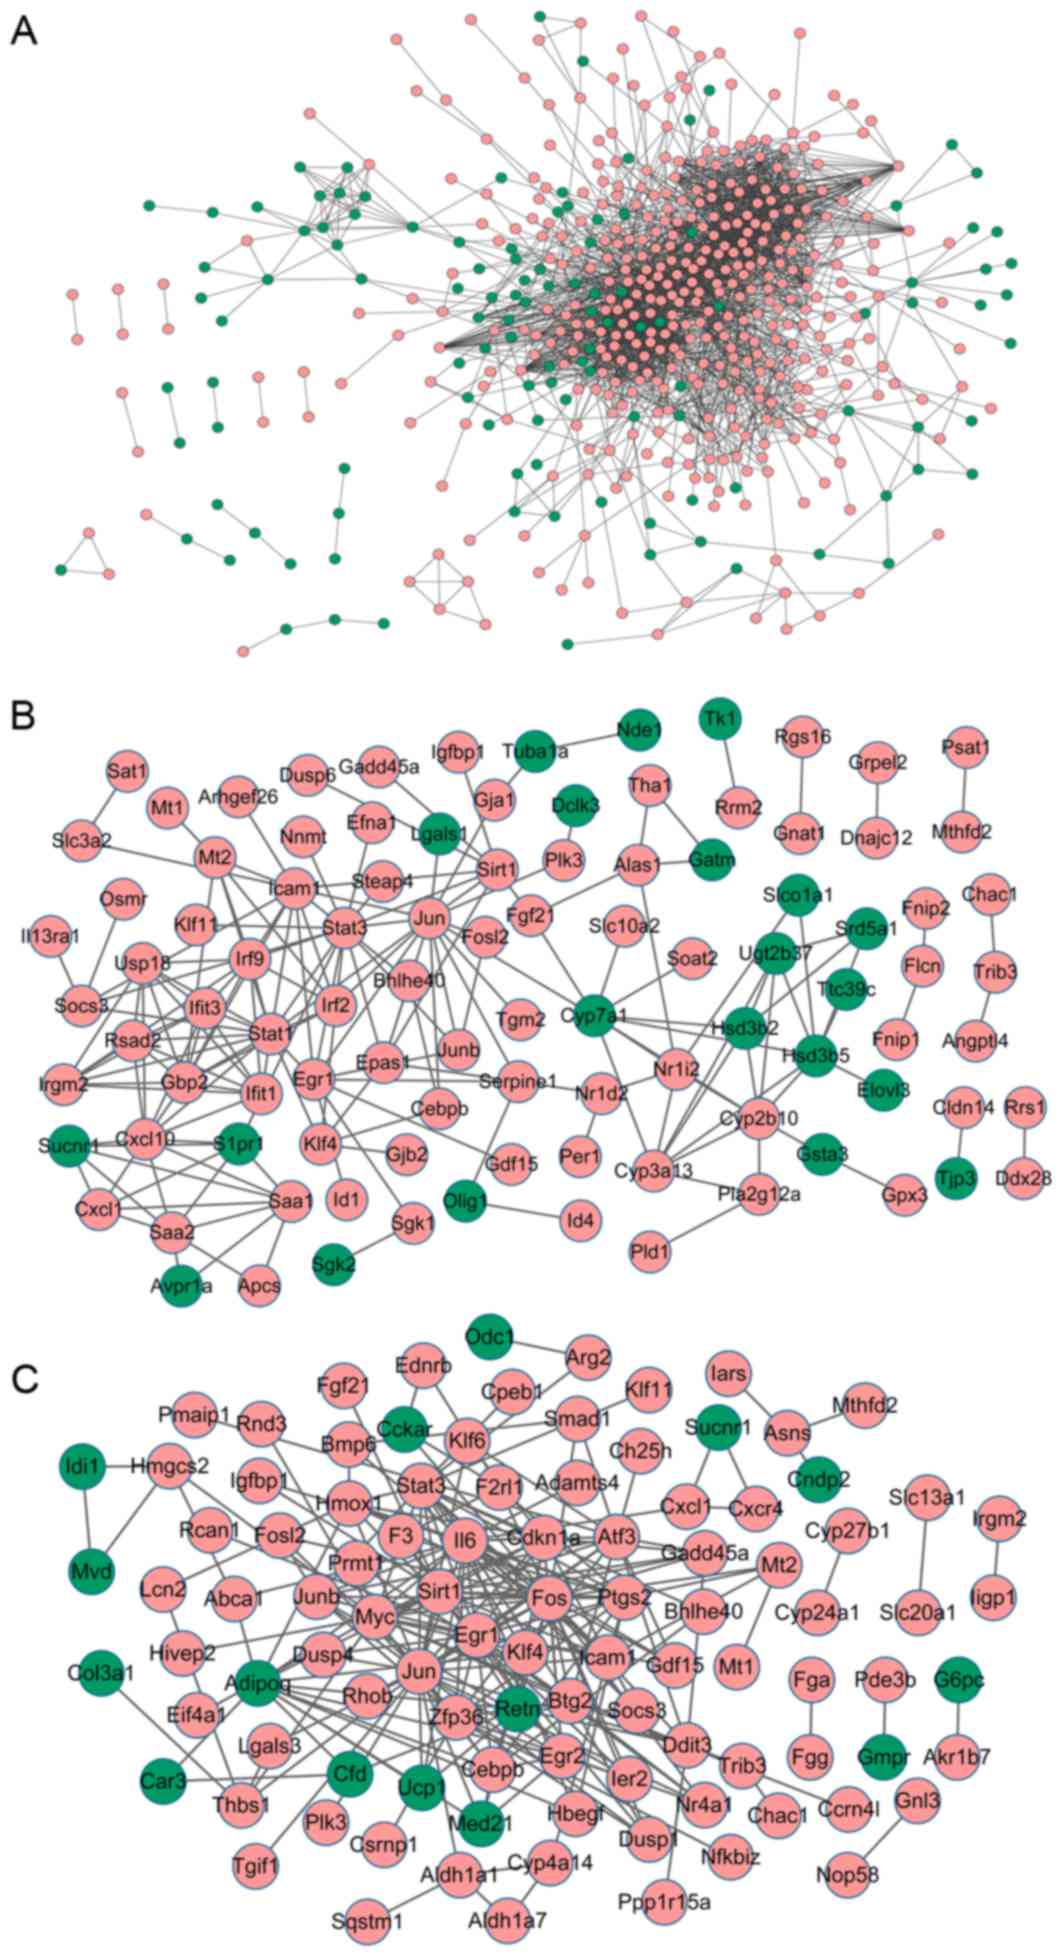
Analysis of PPI networks
To investigate the interactions between DEGs, PPI
networks for the DEGs in lung, liver and kidney samples were
constructed. For DEGs in lung samples from mice with MODS, the PPI
network consisted of 524 nodes and 2,703 interactions (Fig. 3A). In particular, Stat1
(degree=99), IL-6 (degree=4) and Cxcl10 (degree=54) with higher
degrees were identified (Table
IV).
| Table IV.Top 20 DEG nodes from mice with MODS
demonstrating the highest degrees in PPI networks. |
Table IV.
Top 20 DEG nodes from mice with MODS
demonstrating the highest degrees in PPI networks.
| A, Top 20 DEG nodes
with the highest degrees in the lung PPI network |
|---|
|
|---|
| Node | Degree |
|---|
| Stat1 | 99 |
| Tnf | 71 |
| IL-6 | 64 |
| Ccr7 | 57 |
| Cxcl10 | 54 |
| Irf1 | 50 |
| Mmp9 | 47 |
| Irf7 | 46 |
| Cxcr2 | 46 |
| Gbp2 | 45 |
| Ccr5 | 44 |
| Ifit1 | 43 |
| Ccr1 | 43 |
| Ifit3 | 42 |
| Ccr2 | 42 |
| Oasl2 | 41 |
| Cxcr6 | 41 |
| Icam1 | 41 |
| Oasl1 | 40 |
| Tyrobp | 40 |
|
| B, Top 20 DEG
nodes with the highest degrees in the liver PPI network |
|
| Node | Degree |
|
| Jun | 16 |
| Stat3 | 16 |
| Stat1 | 16 |
| Icam1 | 12 |
| Gbp2 | 11 |
| Cxcl10 | 11 |
| Irf9 | 10 |
| Egr1 | 9 |
| Cyp7a1 | 9 |
| Sirt1 | 8 |
| Ifit1 | 8 |
| Usp18 | 8 |
| Ifit3 | 8 |
| Hsd3b5 | 8 |
| Cyp2b10 | 8 |
| Cyp3a13 | 7 |
| Rsad2 | 7 |
| Irgm2 | 7 |
| Saa1 | 7 |
| Saa2 | 7 |
|
| C, Top 20 DEG
nodes with the highest degrees in the kidney PPI network |
|
| Node | Degree |
|
| Jun | 28 |
| Fos | 27 |
| IL-6 | 23 |
| Myc | 20 |
| Egr1 | 20 |
| Stat3 | 17 |
| Atf3 | 14 |
| Sirt1 | 14 |
| Ptgs2 | 14 |
| Adipoq | 13 |
| Cdkn1a | 12 |
| Zfp36 | 11 |
| Btg2 | 10 |
| Hmox1 | 10 |
| Cebpb | 10 |
| Junb | 9 |
| Egr2 | 9 |
| Icam1 | 8 |
| Ddit3 | 8 |
| Retn | 7 |
| Klf4 | 7 |
A total of 99 nodes and 179 interactions were
included in the PPI network of DEGs from liver samples of mice with
MODS (Fig. 3B). Notably, Jun
(degree=16), Stat3 (degree=16), Stat1 (degree=16) and Cxcl10
(degree=11) with higher degrees were identified (Table IV).
Analysis of DEGs in kidney samples from mice with
MODS revealed that the PPI network contained 100 nodes and 229
interactions (Fig. 3C).
Especially, Jun (degree=28), IL-6 (degree=23) and Stat3 (degree=17)
with higher degrees were identified (Table IV).
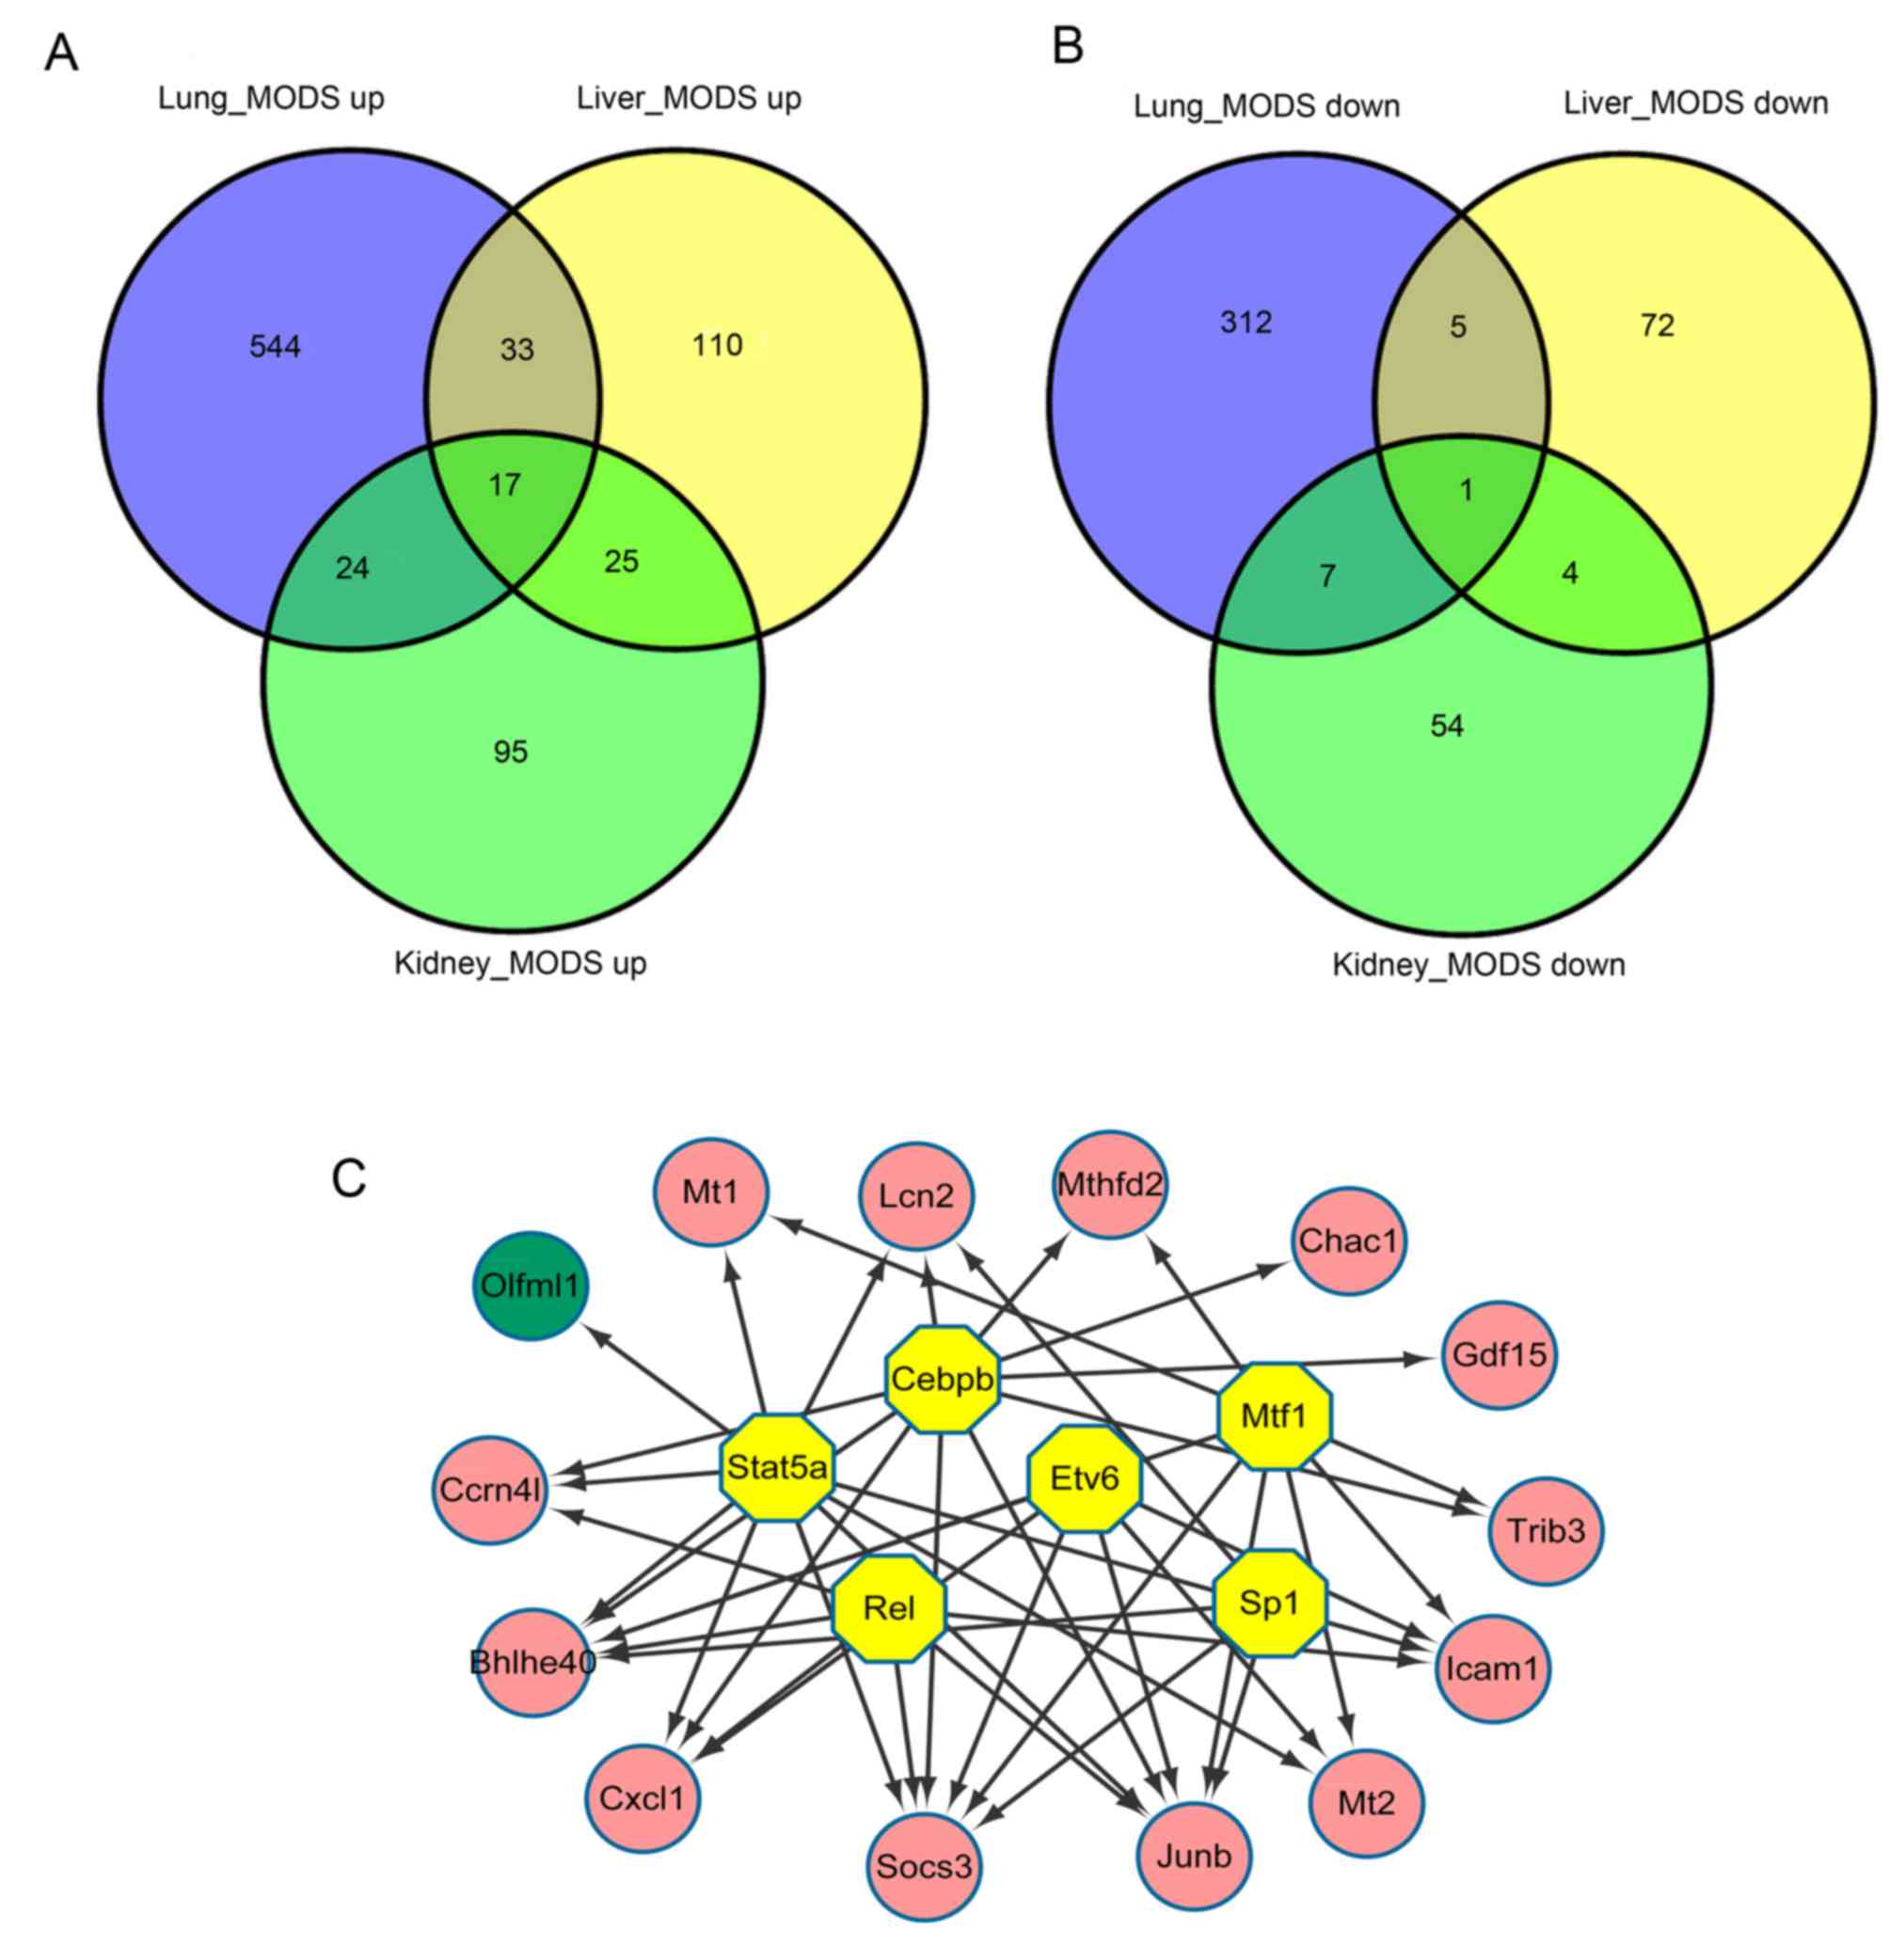
DEGs that are common among lung, liver
and kidney samples
The present study identified 17 upregulated DEGs
that were common among lung, liver and kidney samples: ChaC
glutathione-specific γ-glutamylcyclotransferase 1; predicted gene
Gm20186; growth differentiation factor 15; lipocalin 2 (Lcn2);
metallothionein (Mt)2; suppressor of cytokine signaling 3; JunB
proto-oncogene, AP-1 transcription factor subunit (Junb); tribbles
pseudokinase 3; CCAAT/enhancer binding protein β (Cebpb);
nocturnin; methylenetetrahydrofolate dehydrogenase (NADP+
dependent)2, methenyltetrahydrofolate cyclohydrolase; Cxcl1; basic
helix-loop-helix family member e40; Mt1; intercellular adhesion
molecule 1; NLR family CARD domain-containing 5; and
immunity-related GTPase family M member 2 (Fig. 4A). However, only 1 downregulated
DEG, olfactomedin-like 1 (Olfml1), was identified in all three
tissue types (Fig. 4B).
iRegulon analysis revealed that 6 TFs were predicted
to regulate DEGs that were common among all three tissue types,
including Cebpb (NES=8.957), Stat5a (NES=6.51), metal regulatory
transcription factor 1 (NES=5.431), REL proto-oncogene, nuclear
factor-κB subunit (NES=5.177), ETS variant 6 (NES=5.154) and Sp1
transcription factor (NES=5.119). Cebpb and Stat5a were indicated
to modulate 10 DEGs, including Lcn2 and Cxcl1, and Olfml1, Cxcl1
and Junb, respectively (Fig.
4C).
Discussion
MODS is a major cause of morbidity and mortality
among patients with acute physiological damages (3,4). In
the present study, based on the analysis of the gene expression
profile of mice with MODS compared with healthy controls, 943, 267
and 227 DEGs were identified in lung, liver and kidney samples,
respectively. Pathway enrichment analysis of DEGs revealed that
several DEGs that were common among lung and liver tissues were
implicated in ‘cytokine-cytokine receptor interaction’ and the
‘Jak-STAT signaling pathway’.
Cxcl1 and Cxcl10, DEGs that were identified in lung
and liver tissue, are implicated in the ‘cytokine-cytokine receptor
interaction’ pathway. During the immune response in MODS, cytokine
secretion is reported to cause universal endothelial injury in
organs, a pathological process that results in MODS (5). Cxcl1 and Cxcl10 encode CXC subfamily
inflammatory chemokines (29,30).
Upon binding to CXC receptor (CXCR) 3, Cxcl10 induced the
recruitment of natural killer effectors, including T cells and
dendritic cells (31). During the
early stages of multiple organ failure (MOF), Cxcl10 expression was
significantly increased compared with the non-MOF control (32), which is consistent with the results
of the present study. In the PPI network of DEGs in the lungs and
liver, Cxcl10 exhibited one of the highest degrees and interacted
with Cxcl1. The receptor for Cxcl1, CXCR2, is hypothesized to act
as a potential therapeutic target in sepsis, and the outcomes of
the disease were improved in CXCR2-knockout mice with severe sepsis
(33). There is evidence
indicating that a CXCR2 chemokine receptor antagonist protected
mice from acute pancreatitis and lung injury (34). The above studies indicate that
CXCR2 and its ligand Cxcl1 may serve a role in the immune response
in sepsis and organ failure. Taken together, Cxcl1 and Cxcl10 may
exert functions in the progression of MODS.
Stat1, implicated in the Jak-STAT signaling pathway,
demonstrated the highest degree in the PPI network for lung and
liver tissue. Stat1 encodes a protein member of the STAT family,
which mediates cellular responses to cytokines and growth factors
(35). Stat1 is activated by
various cytokines and is associated with proinflammatory signaling
and the development of inflammatory tissue damage (36). In severe acute pancreatitis with
organ failure, Stat1 was reported to be activated in monocytes
(37). Furthermore, the Jak-STAT
signaling pathway has been reported to be implicated in heart
failure through the activity of the Stat3 protein (38). In the PPI network of DEGs in the
lungs and liver, Stat1 interacted with Cxcl10. Therefore, Stat1 may
serve a role in the progression of MODS via regulation of the
Jak-STAT signaling pathway or interaction with Cxcl10.
Two signaling pathways, MAPK and p53 pathways, were
common to liver and kidney samples. The results of the present
study demonstrated that the DEG Gadd45A was enriched in both
pathways. Gadd45A is a p53-regulated stress response protein and
its transcription is stimulated by stress-associated conditions
inhibiting growth and by exposure to DNA-damaging agents (39,40).
Gadd45A has been demonstrated to be highly expressed in a mouse
model of lung injury (41). In
addition, upregulated Gadd45A has been detected in autoimmune
diseases and contributed to autoimmunity by promoting DNA
demethylation in T cells (39).
Gadd45A is able to activate MEK kinase 4, which results in the
phosphorylation and activation of the MAPKs p38 and c-Jun
N-terminal kinase during an inflammatory response (42,43).
It has been reported that MAPKs are upregulated in the toll-like
receptor 4-mediated progression of multi-organ failure (44). Furthermore, p53 has been
demonstrated to serve a role in inflammation (45). Therefore, Gadd45Amay function in
the progression of MODS through regulation of the MAPK and p53
signaling pathways.
In lung, liver and kidney samples, there were 18
common DEGs, including 17 upregulated genes and 1 downregulated
gene. Among the 17 upregulated genes, Cebpb was identified as a TF
and regulated multiple DEGs that were common among the three tissue
types, including Cxcl1. Cebpb encodes a transcription factor that
contains a basic leucine zipper domain and functions in the
regulation of genes associated with immune and inflammatory
responses (46). It has been
demonstrated that Cebpb in the lung epithelium contributed to
lipopolysaccharide-induced Cxcl1 expression. There is no direct
evidence to confirm a role for Cebpb in MODS. Therefore, the
present study hypothesized that Cebpb may serve a role in the
progression of MODS as a TF regulating the expression of Cxcl1 and
other genes.
Additionally, in the three organs analyzed in the
present study, the only common downregulated gene, Olfml1, is a
glycoprotein containing the olfectamine domain. In neural tissues,
olfactomedin was associated with the growth and differentiation of
chemosensory cilia (47). To the
best of our knowledge, an association between Olfml1 and MODS has
not been previously reported. In the present study, Olfml1 was
regulated by Stat5a, a member of the STAT family transcription
factors. Stat5a functions in immunity by regulating the development
and maintenance of T regulatory cells (48–50).
Therefore, Olfml1 may be implicated in the progression of MODS
through regulation by Stat5a.
There were several limitations of the present study.
The predicted results should be confirmed by laboratory data.
Furthermore, in the present study, a limited number of samples were
used, which should be increased to improve the reliability of the
conclusions drawn. In future studies, a higher number of organ
samples from mice with MODS will be included to validate the
expression levels of potentially implicated genes and to elucidate
their functions.
In conclusion, 943, 267 and 227 DEGs were identified
in lung, liver and kidney samples from mice with MODS,
respectively, compared with the normal healthy controls. Certain
DEGs were implicated in pathways that were common to both lung and
liver samples, including ‘cytokine-cytokine receptor interaction’
(such as Cxcl1 and Cxcl10) and the ‘Jak-STAT signaling pathway’
(such as Stat1). In addition, several DEGs, including Gadd45A, were
common to two signaling pathways in liver and kidney samples.
Furthermore, 18 DEGs were common to all three types of tissues
analyzed in the present study, including Cebpb and Olfml1. Cebpb
regulated multiple DEGs, such as Cxcl1, and Stat5a regulated the
expression of Olfml1. The genes and pathways identified in the
present study may be implicated in the progression of MODS.
Therefore, the results of the present study may provide potential
therapy targets for the treatments of MODS.
Acknowledgements
The present study was supported by the Scientific
and Technological Project in the Social Development Area of Science
and Technology Department of Shaanxi Province (grant no.
2012K16-12-02).
References
|
1
|
Volman TJ, Hendriks T and Goris RJ:
Zymosan-induced generalized inflammation: Experimental studies into
mechanisms leading to multiple organ dysfunction syndrome. Shock.
23:291–297. 2005. View Article : Google Scholar : PubMed/NCBI
|
|
2
|
Henao FJ, Daes JE and Dennis RJ: Risk
factors for multiorgan failure: A case-control study. J Trauma.
31:74–80. 1991. View Article : Google Scholar : PubMed/NCBI
|
|
3
|
Deitch EA: Multiple organ failure.
Pathophysiology and potential future therapy. Ann Surg.
216:117–134. 1992. View Article : Google Scholar : PubMed/NCBI
|
|
4
|
Marshall JC: Inflammation, coagulopathy,
and the pathogenesis of multiple organ dysfunction syndrome. Crit
Care Med. 29 7 Suppl:S99–S106. 2001. View Article : Google Scholar : PubMed/NCBI
|
|
5
|
Wang H and Ma S: The cytokine storm and
factors determining the sequence and severity of organ dysfunction
in multiple organ dysfunction syndrome. Am J Emerg Med. 26:711–715.
2008. View Article : Google Scholar : PubMed/NCBI
|
|
6
|
Gustot T: Multiple organ failure in
sepsis: Prognosis and role of systemic inflammatory response. Curr
Opin Crit Care. 17:153–159. 2011. View Article : Google Scholar : PubMed/NCBI
|
|
7
|
Henninger DD, Panés J, Eppihimer M,
Russell J, Gerritsen M, Anderson DC and Granger DN:
Cytokine-induced VCAM-1 and ICAM-1 expression in different organs
of the mouse. J Immunol. 158:1825–1832. 1997.PubMed/NCBI
|
|
8
|
Bratt J and Palmblad J: Cytokine-induced
neutrophil-mediated injury of human endothelial cells. J Immunol.
159:912–918. 1997.PubMed/NCBI
|
|
9
|
Crouser ED: Mitochondrial dysfunction in
septic shock and multiple organ dysfunction syndrome.
Mitochondrion. 4:729–741. 2004. View Article : Google Scholar : PubMed/NCBI
|
|
10
|
Suzuki T, Takahashi T, Yamasaki A,
Fujiwara T, Hirakawa M and Akagi R: Tissue-specific gene expression
of heme oxygenase-1 (HO-1) and non-specific delta-aminolevulinate
synthase (ALAS-N) in a rat model of septic multiple organ
dysfunction syndrome. Biochem Pharmacol. 60:275–283. 2000.
View Article : Google Scholar : PubMed/NCBI
|
|
11
|
Rockey DC, Bell PD and Hill JA: Fibrosis-a
common pathway to organ injury and failure. N Engl J Med.
372:1138–1149. 2015. View Article : Google Scholar : PubMed/NCBI
|
|
12
|
Bunney WE, Bunney BG, Vawter MP, Tomita H,
Li J, Evans SJ, Choudary PV, Myers RM, Jones EG, Watson SJ and Akil
H: Microarray technology: A review of new strategies to discover
candidate vulnerability genes in psychiatric disorders. Am J
Psychiatry. 160:657–666. 2003. View Article : Google Scholar : PubMed/NCBI
|
|
13
|
Nylund L, Satokari R, Nikkilä J,
Rajilić-Stojanović M, Kalliomäki M, Isolauri E, Salminen S and De
Vos WM: Microarray analysis reveals marked intestinal microbiota
aberrancy in infants having eczema compared to healthy children in
at-risk for atopic disease. BMC Microbiol. 13:122013. View Article : Google Scholar : PubMed/NCBI
|
|
14
|
Maslove DM and Wong HR: Gene expression
profiling in sepsis: Timing, tissue, and translational
considerations. Trends Mol Med. 20:204–213. 2014. View Article : Google Scholar : PubMed/NCBI
|
|
15
|
Gutschner T, Hämmerle M, Eissmann M, Hsu
J, Kim Y, Hung G, Revenko A, Arun G, Stentrup M, Gross M, et al:
The noncoding RNA MALAT1 is a critical regulator of the metastasis
phenotype of lung cancer cells. Cancer Res. 73:1180–1189. 2013.
View Article : Google Scholar : PubMed/NCBI
|
|
16
|
Di Narzo AF, Tejpar S, Rossi S, Yan P,
Popovici V, Wirapati P, Budinska E, Xie T, Estrella H, Pavlicek A,
et al: Test of four colon cancer risk-scores in formalin fixed
paraffin embedded microarray gene expression data. J Natl Cancer
Inst. 106:pii: dju247. 2014. View Article : Google Scholar : PubMed/NCBI
|
|
17
|
Gharib SA, Mar D, Bomsztyk K, Denisenko O,
Dhanireddy S, Liles WC and Altemeier WA: System-wide mapping of
activated circuitry in experimental systemic inflammatory response
syndrome. Shock. 45:148–156. 2016. View Article : Google Scholar : PubMed/NCBI
|
|
18
|
Gautier L, Cope L, Bolstad BM and Irizarry
RA: affy-analysis of Affymetrix GeneChip data at the probe level.
Bioinformatics. 20:307–315. 2004. View Article : Google Scholar : PubMed/NCBI
|
|
19
|
Carlson M, Falcon S, Pages H and Li N:
org. Mm. eg. db: Genome wide annotation for Mouse. org. Mm. eg. db:
Genome wide annotation for Mouse. R package version. 2012.
|
|
20
|
Carlson M: Mouse4302.db: Affymetrix Mouse
genome 430 2.0 array annotation data (chip mouse4302). R package.
version 3.1.3. 2016.
|
|
21
|
Smyth GK: Limma: linear models for
microarray dataBioinformatics and Computational Biology Solutions
Using R and Bioconductor. Gentleman R, Carey V, Huber W, Irizarry R
and Dudoit S: Springer; New York, NY: pp. 397–420. 2005, View Article : Google Scholar
|
|
22
|
Glueck DH, Mandel J, Karimpour-Fard A,
Hunter L and Muller KE: Exact calculations of average power for the
Benjamini-Hochberg procedure. Int J Biostat. 4:Article 11. 2008.
View Article : Google Scholar : PubMed/NCBI
|
|
23
|
Warnes GR, Bolker B, Bonebakker L,
Gentleman R, Huber W, Liaw A, Lumley T, Maechler M, Magnusson A,
Moeller S, et al: gplots: Various R programming tools for plotting
data. R package. version 2. 2009.
|
|
24
|
Kolde R: Pretty heatmaps. 2015.https://cran.r-project.org/web/packages/pheatmap/pheatmap.pdfDecember
11–2015
|
|
25
|
Huang DW, Sherman BT, Tan Q, Collins JR,
Alvord WG, Roayaei J, Stephens R, Baseler MW, Lane HC and Lempicki
RA: The DAVID gene functional classification tool: A novel
biological module-centric algorithm to functionally analyze large
gene lists. Genome Biol. 8:R1832007. View Article : Google Scholar : PubMed/NCBI
|
|
26
|
Szklarczyk D, Franceschini A, Wyder S,
Forslund K, Heller D, Huerta-Cepas J, Simonovic M, Roth A, Santos
A, Tsafou KP, et al: STRING v10: Protein-protein interaction
networks, integrated over the tree of life. Nucleic Acids Res.
43:(Database Issue). D447–D452. 2015. View Article : Google Scholar : PubMed/NCBI
|
|
27
|
Kohl M, Wiese S and Warscheid B:
Cytoscape: Software for visualization and analysis of biological
networks. Methods Mol Biol. 696:291–303. 2011. View Article : Google Scholar : PubMed/NCBI
|
|
28
|
Janky R, Verfaillie A, Imrichová H, Van de
Sande B, Standaert L, Christiaens V, Hulselmans G, Herten K,
Sanchez Naval M, Potier D, et al: iRegulon: From a gene list to a
gene regulatory network using large motif and track collections.
PLoS Comput Biol. 10:e10037312014. View Article : Google Scholar : PubMed/NCBI
|
|
29
|
Booth V, Keizer DW, Kamphuis MB,
Clark-Lewis I and Sykes BD: The CXCR3 binding chemokine
IP-10/CXCL10: Structure and receptor interactions. Biochemistry.
41:10418–10425. 2002. View Article : Google Scholar : PubMed/NCBI
|
|
30
|
Haskill S, Peace A, Morris J, Sporn SA,
Anisowicz A, Lee SW, Smith T, Martin G, Ralph P and Sager R:
Identification of three related human GRO genes encoding cytokine
functions. Proc Natl Acad Sci USA. 87:7732–7736. 1990. View Article : Google Scholar : PubMed/NCBI
|
|
31
|
Panzer U, Steinmetz OM, Paust HJ,
Meyer-Schwesinger C, Peters A, Turner JE, Zahner G, Heymann F,
Kurts C, Hopfer H, et al: Chemokine receptor CXCR3 mediates T cell
recruitment and tissue injury in nephrotoxic nephritis in mice. J
Am Soc Nephrol. 18:2071–2084. 2007. View Article : Google Scholar : PubMed/NCBI
|
|
32
|
Jastrow KM III, Gonzalez EA, McGuire MF,
Suliburk JW, Kozar RA, Iyengar S, Motschall DA, McKinley BA, Moore
FA and Mercer DW: Early cytokine production risk stratifies trauma
patients for multiple organ failure. J Am Coll Surg. 209:320–331.
2009. View Article : Google Scholar : PubMed/NCBI
|
|
33
|
Robertson CM and Coopersmith CM: The
systemic inflammatory response syndrome. Microbes Infect.
8:1382–1389. 2006. View Article : Google Scholar : PubMed/NCBI
|
|
34
|
Bhatia M and Hegde A: Treatment with
antileukinate, a CXCR2 chemokine receptor antagonist, protects mice
against acute pancreatitis and associated lung injury. Regul Pept.
138:40–48. 2007. View Article : Google Scholar : PubMed/NCBI
|
|
35
|
Quelle FW, Thierfelder W, Witthuhn BA,
Tang B, Cohen S and Ihle JN: Phosphorylation and activation of the
DNA binding activity of purified Stat1 by the Janus
protein-tyrosine kinases and the epidermal growth factor receptor.
J Biol Chem. 270:20775–20780. 1995. View Article : Google Scholar : PubMed/NCBI
|
|
36
|
Durbin JE, Hackenmiller R, Simon MC and
Levy DE: Targeted disruption of the mouse Stat1 gene results in
compromised innate immunity to viral disease. Cell. 84:443–450.
1996. View Article : Google Scholar : PubMed/NCBI
|
|
37
|
Oiva J, Mustonen H, Kylänpää ML, Kyhälä L,
Alanärä T, Aittomäki S, Siitonen S, Kemppainen E, Puolakkainen P
and Repo H: Patients with acute pancreatitis complicated by organ
failure show highly aberrant monocyte signaling profiles assessed
by phospho-specific flow cytometry. Crit Care Med. 38:1702–1708.
2010. View Article : Google Scholar : PubMed/NCBI
|
|
38
|
Boengler K, Hilfiker-Kleiner D, Drexler H,
Heusch G and Schulz R: The myocardial JAK/STAT pathway: From
protection to failure. Pharmacol Ther. 120:172–185. 2008.
View Article : Google Scholar : PubMed/NCBI
|
|
39
|
Li Y, Zhao M, Yin H, Gao F, Wu X, Luo Y,
Zhao S, Zhang X, Su Y, Hu N, et al: Overexpression of the growth
arrest and DNA damage-induced 45alpha gene contributes to
autoimmunity by promoting DNA demethylation in lupus T cells.
Arthritis Rheum. 62:1438–1447. 2010. View Article : Google Scholar : PubMed/NCBI
|
|
40
|
Zhan Q: Gadd45a, a p53-and BRCA1-regulated
stress protein, in cellular response to DNA damage. Mutat Res.
569:133–143. 2005. View Article : Google Scholar : PubMed/NCBI
|
|
41
|
Altemeier WA, Matute-Bello G, Gharib SA,
Glenny RW, Martin TR and Liles WC: Modulation of
lipopolysaccharide-induced gene transcription and promotion of lung
injury by mechanical ventilation. J Immunol. 175:3369–3376. 2005.
View Article : Google Scholar : PubMed/NCBI
|
|
42
|
Uhlig U, Haitsma JJ, Goldmann T, Poelma
DL, Lachmann B and Uhlig S: Ventilation-induced activation of the
mitogen-activated protein kinase pathway. Eur Respir J. 20:946–956.
2002. View Article : Google Scholar : PubMed/NCBI
|
|
43
|
Li LF, Yu L and Quinn DA:
Ventilation-induced neutrophil infiltration depends on c-Jun
N-terminal kinase. Am J Respir Crit Care Med. 169:518–524. 2004.
View Article : Google Scholar : PubMed/NCBI
|
|
44
|
McGhan LJ and Jaroszewski DE: The role of
toll-like receptor-4 in the development of multi-organ failure
following traumatic haemorrhagic shock and resuscitation. Injury.
43:129–136. 2012. View Article : Google Scholar : PubMed/NCBI
|
|
45
|
Cooks T, Harris CC and Oren M: Caught in
the cross fire: p53 in inflammation. Carcinogenesis. 35:1680–1690.
2014. View Article : Google Scholar : PubMed/NCBI
|
|
46
|
Wang W, Bergh A and Damber JE: Increased
expression of CCAAT/enhancer-binding protein beta in proliferative
inflammatory atrophy of the prostate: Relation with the expression
of COX-2, the androgen receptor, and presence of focal chronic
inflammation. Prostate. 67:1238–1246. 2007. View Article : Google Scholar : PubMed/NCBI
|
|
47
|
Bal RS and Anholt RR: Formation of the
extracellular mucous matrix of olfactory neuroepithelium:
Identification of partially glycosylated and nonglycosylated
precursors of olfactomedin. Biochemistry. 32:1047–1053. 1993.
View Article : Google Scholar : PubMed/NCBI
|
|
48
|
Takatori H, Nakajima H, Kagami S, Hirose
K, Suto A, Suzuki K, Kubo M, Yoshimura A, Saito Y and Iwamoto I:
Stat5a inhibits IL-12-induced Th1 cell differentiation through the
induction of suppressor of cytokine signaling 3 expression. J
Immunol. 174:4105–4112. 2005. View Article : Google Scholar : PubMed/NCBI
|
|
49
|
Takatori H, Nakajima H, Hirose K, Kagami
S, Tamachi T, Suto A, Suzuki K, Saito Y and Iwamoto I:
Indispensable role of Stat5a in Stat6-independent Th2 cell
differentiation and allergic airway inflammation. J Immunol.
174:3734–3740. 2005. View Article : Google Scholar : PubMed/NCBI
|
|
50
|
Wei L, Laurence A and O'Shea JJ: New
insights into the roles of Stat5a/b and Stat3 in T cell development
and differentiation. Semin Cell Dev Biol. 19:394–400. 2008.
View Article : Google Scholar : PubMed/NCBI
|