Introduction
Great progress has been made in the study of cancer
including the mechanism of cancer, drug discovery and therapeutic
modes, during the past 10 years (1). However, gastric cancer (GC) is one of
the most common malignancies (2,3), and
the 5-year survival rate of GC patients remains very low (4). Since GC patients are often diagnosed
at an advanced stage and because malignant proliferation, as well
as lymphatic metastasis, frequently occurs in GC, few patients can
be completely cured by surgery (5). Hence, the early diagnosis and
treatment of gastric cancer are very necessary. Currently,
biomarkers and regular clinicopathological parameters that can
predict prognosis are limited; hence, few effective treatment
options are available (6).
Fibrinogen-like-protein 1 (FGL1, also called FREP1
or hepassocin), a member of the fibrinogen family, is expressed
mainly in the liver and was first cloned from human hepatocellular
carcinoma (7,8). Previous studies have demonstrated
that the expression of FGL1 was increased in the regenerated liver
and could stimulate 3H-thymidine uptake in primary hepatocytes
which implied that FGL1 facilitate hepatocyte proliferation
(9). Moreover, recombinant FGL1
protected against liver injury in rats with fulminant hepatic
failure (10). These observations
suggest that FGL1 plays a role in liver regeneration and liver
protection. In addition to its expression in the liver, FGL1
expression has also been reported in adipose tissue (8). Until now, no research has
investigated FGL1 expression in GC tissues, and the role of FGL1 in
GC remains large unclear.
In this study, we investigated the correlation
between FGL1 expression and prognosis in GC patients. Besides, the
effect of FGL1 on GC SGC-7901 cell proliferation, invasion and
migration were also explored by silencing FGL1. Furthermore, the
involvement of FGL1 in EMT regulation in SGC-7901 cells was
determined by analyzing the expression of EMT markers using western
blot. Our results indicated that high FGL1 expression was
correlated with poor prognosis of GC patients and silencing FGL1
could inhibit SGC-7901 cell proliferation, invasion and
migration.
Materials and methods
Data collection
The RNA-Seq gene expression data and clinical
information of 375 gastric adenocarcinoma samples and 32 nomal
gastric samples were downloaded from The Cancer Genome Atlas (TCGA;
tcga-data.nci. Nih.gov/tcga). The difference of FGL1
expression between normal gastric tissue and gastric adenocarcinoma
tissue was analyzed by using Student's t-test. The data collection
process complies with all laws and regulations.
Patients and tissue samples
The GC cancer tissues and the corresponding adjacent
tissues used in this study were collected from 50 patients who
experienced a surgery for GC at Zhengzhou Central Hospital
Affiliated to Zhengzhou University from 2008 to 2011. All patients
did not undergo radiotherapy or chemotherapy before surgery.
Histological diagnosis of gastric cancer is based on the World
Health Organization (WHO) standards. Clinicopathological factors of
the 7th edition of the (Union for International Cancer Control)
UICC classification for gastric cancer were used to explore the
importance of FGL1. Detailed clinicopathological information is
shown in Table I. The present
study was approved by the Ethics Committee of Zhengzhou Central
Hospital Affiliated to Zhengzhou University (Henan, China). Written
informed consent was obtained from all patients.
 | Table I.Clinicopathological characteristics of
50 gastric cancer patients. |
Table I.
Clinicopathological characteristics of
50 gastric cancer patients.
| Variable | Case, n (%) |
|---|
| Age at diagnosis,
years |
|
|
<60 | 18 (36) |
| ≥60 | 32 (64) |
| Sex |
|
|
Female | 19 (38) |
| Male | 31 (62) |
| Grade |
|
| G1 | 3 (6) |
| G2 | 16 (32) |
| G3 | 31 (62) |
| Stage |
|
| I | 7 (14) |
| II | 15 (30) |
| III | 18 (36) |
| IV | 10 (20) |
| Pathologic-T |
|
| T1 | 4 (8) |
| T2 | 10 (20) |
| T3 | 17 (34) |
| T4 | 19 (38) |
| Pathologic-N |
|
| N0 | 20 (40) |
| N1 | 4 (8) |
| N2 | 7 (14) |
| N3 | 19 (38) |
| Pathologic-M |
|
| M0 | 40 (80) |
| M1 | 10 (20) |
Cell culture
The Human Gastric cancer cell lines BGC-823,
SGC-7901 and human gastric normal epithelial mucosa cell line GES-1
were all purchased from the Chinese Academy of Sciences and
cultured in RPMI-1640 medium (Hyclone, USA) added with 10% serum,
100 U/ml penicillin, and 0.1 mg/ml streptomycin at 37°C with 5%
CO2. When cells growing into the logarithmic growth
phase, single cell suspensions were prepared using trypsin
(Solarbio, Beijing, China) and inoculated into 6-well plate for the
subsequent tests.
Reverse transcription-quantitative
polymerase chain reaction (RT-qPCR)
Total RNA was extracted using Ultrapure RNA kit
(CwBio, Beijing, China) following the manufacturer's description.
HiFiScript cDNA Synthesis kit (CwBio, Beijing, China) was used to
perform RT-PCR to synthesize cDNA. Then the cDNA was used as
template to perform qPCR. GAPDH was used as an internal reference
gene. The following primer sequences were used: FGL1 forward,
5′-GCAAGGAGTCTGCTTCTGCT-3′ and reverse, 5′-TGCCATGTTCCCCCTTGAAA-3′;
and GAPDH forward 5′-GGAGCGAGATCCCTCCAAAAT-3′, reverse
5′-GGCTGTTGTCATACTTCTCATGG-3′ (Genewiz, Beijing, China). qPCR was
performed using SYBR Premix Ex Taq II kit (Takara Biotechnology
Co., Ltd., Dalian, China) and carried out in a ABI 7500 system
(Applied Biosystems, Carlsbad, CA, USA). qPCR procedure was as
follows: 95°C for 5 min, followed by 40 cycles of 5 sec at 95°C, 34
sec at 60°C, and then 72°C for 30 min. All experiments were
performed in triplicate and repeated for independently 3 times. The
relative expression level of TGFBI was calculated using the 2-∆∆Cq
method (11).
Transfection
Transfection was performed using Lipofectamine 2000
(Invitrogen; Thermo Fisher Scientific, Inc., Waltham, MA, USA).
When the cells in the 6-well plate grew to logarithmic period, the
media was replaced with fresh complete culture medium 2 h before
transfection. Cells were transfected with either FGL1 siRNA
(siRNA1: 5′-AGGUGUUCAGUUUCAUCCU-3′ or siRNA2:
5′-ACAGCAACAGGUCAAGAUC-3′) or scramble siRNA
(5′-CUAGAACUGGACAACGACA-3′) following manufacturer's procedure.
After incubating the transfected cells in the incubator for 6 h,
the medium was replaced with complete medium. Forty eight h later,
the inhibitory efficiency of these siRNAs was verified by RT-qPCR
and western blot assay, and the most effective siRNA were used for
the following functional experiments.
Cell proliferation assay
After being transfected for 48 h, cell suspensions
were prepared and inoculated into 96-well plate with 1,000 cells
for each well followed by culturing in a carbon dioxide incubator.
The viability of cells were tested every 24 h by adding 10 µl CCK8
chemicals (Solarbio), incubating at 37°C for 1.5 h and detecting
the optical density (OD) at 450 nm. The proliferation curves were
drawn using Graph Pad Prism 5.
Colony formation assay
Single cell suspensions were prepared after
transfected for 48 h. And cells were plated in a 60 mm dish (500
cells/dish) containing 5 ml culture medium. The dish was maintained
at 37°C with 5% CO2 and saturated humidity for 14 days.
The experimental group was supplemented with 1 ml of the
supernatant liquid every 2–3 days and the control group with the
same amount of PBS. The cultivation will be terminated when
macroscopic colonies appeared in the dish. After removing the
supernatant, the colonies were carefully washed by PBS. Then cells
were fixed with 4% paraformaldehyde for 30 min followed by staining
with 0.1% crystal violet for 30 min. Next the dyes were washed
using the running water and the number of clones was counted
directly. All tests were performed in triplicate.
Wound healing assay
We performed wound healing assay to investigate the
effect of FGL1 on SGC-7901 cell migration. Cell suspensions were
prepared and seeded into 6-well plate with about 5×10⁵
cells/well. After cultured for 24 h, a 200 ml micropipette tip was
used to make the wounds. The widths of the wounds were photographed
after 0 and 24 h scratching using an optical microscope (Olympus
Corporation, Tokyo, Japan). The relative wounds of SGC-7901 cells
transfected with FGL1 siRNA or scramble siRNA at 24 h were compared
to the accordingly wounds at 0 h.
Transwell invasion and migration
assay
To further determine the role of FGL1 in cell
invasion and migration, Transwell assays were performed. Transwell
invasion chambers coated with Matrigel (100 µl, diluted with
serum-free medium at a ratio of 1:6) (BD Biosciences, Franklin
Lakes, NJ, USA) was used to perform the invasion assays. Cell
suspensions were prepared using serum-free medium after transfected
for 24 h and transferred to the up chamber (1×10⁵ cells/well). Then
500 µl of complete medium were added to the lower chamber. After
incubating at 37°C for 24 h, the chamber was taken out, and the
invaded cells were stained by 0.1% crystal violet stain. Then the
number of the invaded cells was counted under a light microscope.
Transwell migration assay was similar with Transwell invasion
assay, but Matrigel was not needed and 5,000 cells were added to
each well.
Western blot
After transfected for 48 h, total protein were
extracted using RIPA lysate supplemented with protease inhibitor.
The proteins were heated at 95°C for 5 min and separated by 10%
SDS-PAGE. Then proteins on the gel were electric transferred to a
PVDF membrane (Millipore, Bedford, MA) and blocked in 5% skimmed
milk for 1 h. Subsequently, the membrane was incubated with the
primary anti-body at 4°C overnight followed by washing with TBST
for 3×5 min. Then the membrane was incubated with the secondary
anti-body for 1 h and washed with TBST for 3×5 min. Enhanced
chemiluminescence (ECL) plus detection kit (Thermo Fisher
Scientific, Inc.) was used to detect signals of the protein.
Quantity One software was used to perform the densitometric
analysis of the bands. GAPDH was used as an intrinsic quality
control. The ratio of the target protein to the internal reference
protein is considered as the relative expression level.
Statistical analysis
The correlation between FGL1 expression and
clinicopathological features were assessed using Chi-square
(χ2) test. The survival curve was drawn using
Kaplan-Meier method and the difference between groups was assessed
by log-rank test. The median of FGL1 expression was used to divide
the samples into high and low expression groups. The prognostic
role of FGL1 in gastric adenocarcinoma was assessed using
univariate and multivariate Cox proportional hazards analysis. SPSS
15.0 software (SPSS, Inc., Chicago, IL, USA) was used to perform
the statistical analysis. The mean of multiple samples was compared
using one-way analysis of variance analysis followed by Dunnett's
post hoc test. P<0.05 was considered to indicate a statistically
significant difference.
Results
FGL1 was upregulated in gastric cancer
tissues and associated with poor prognosis
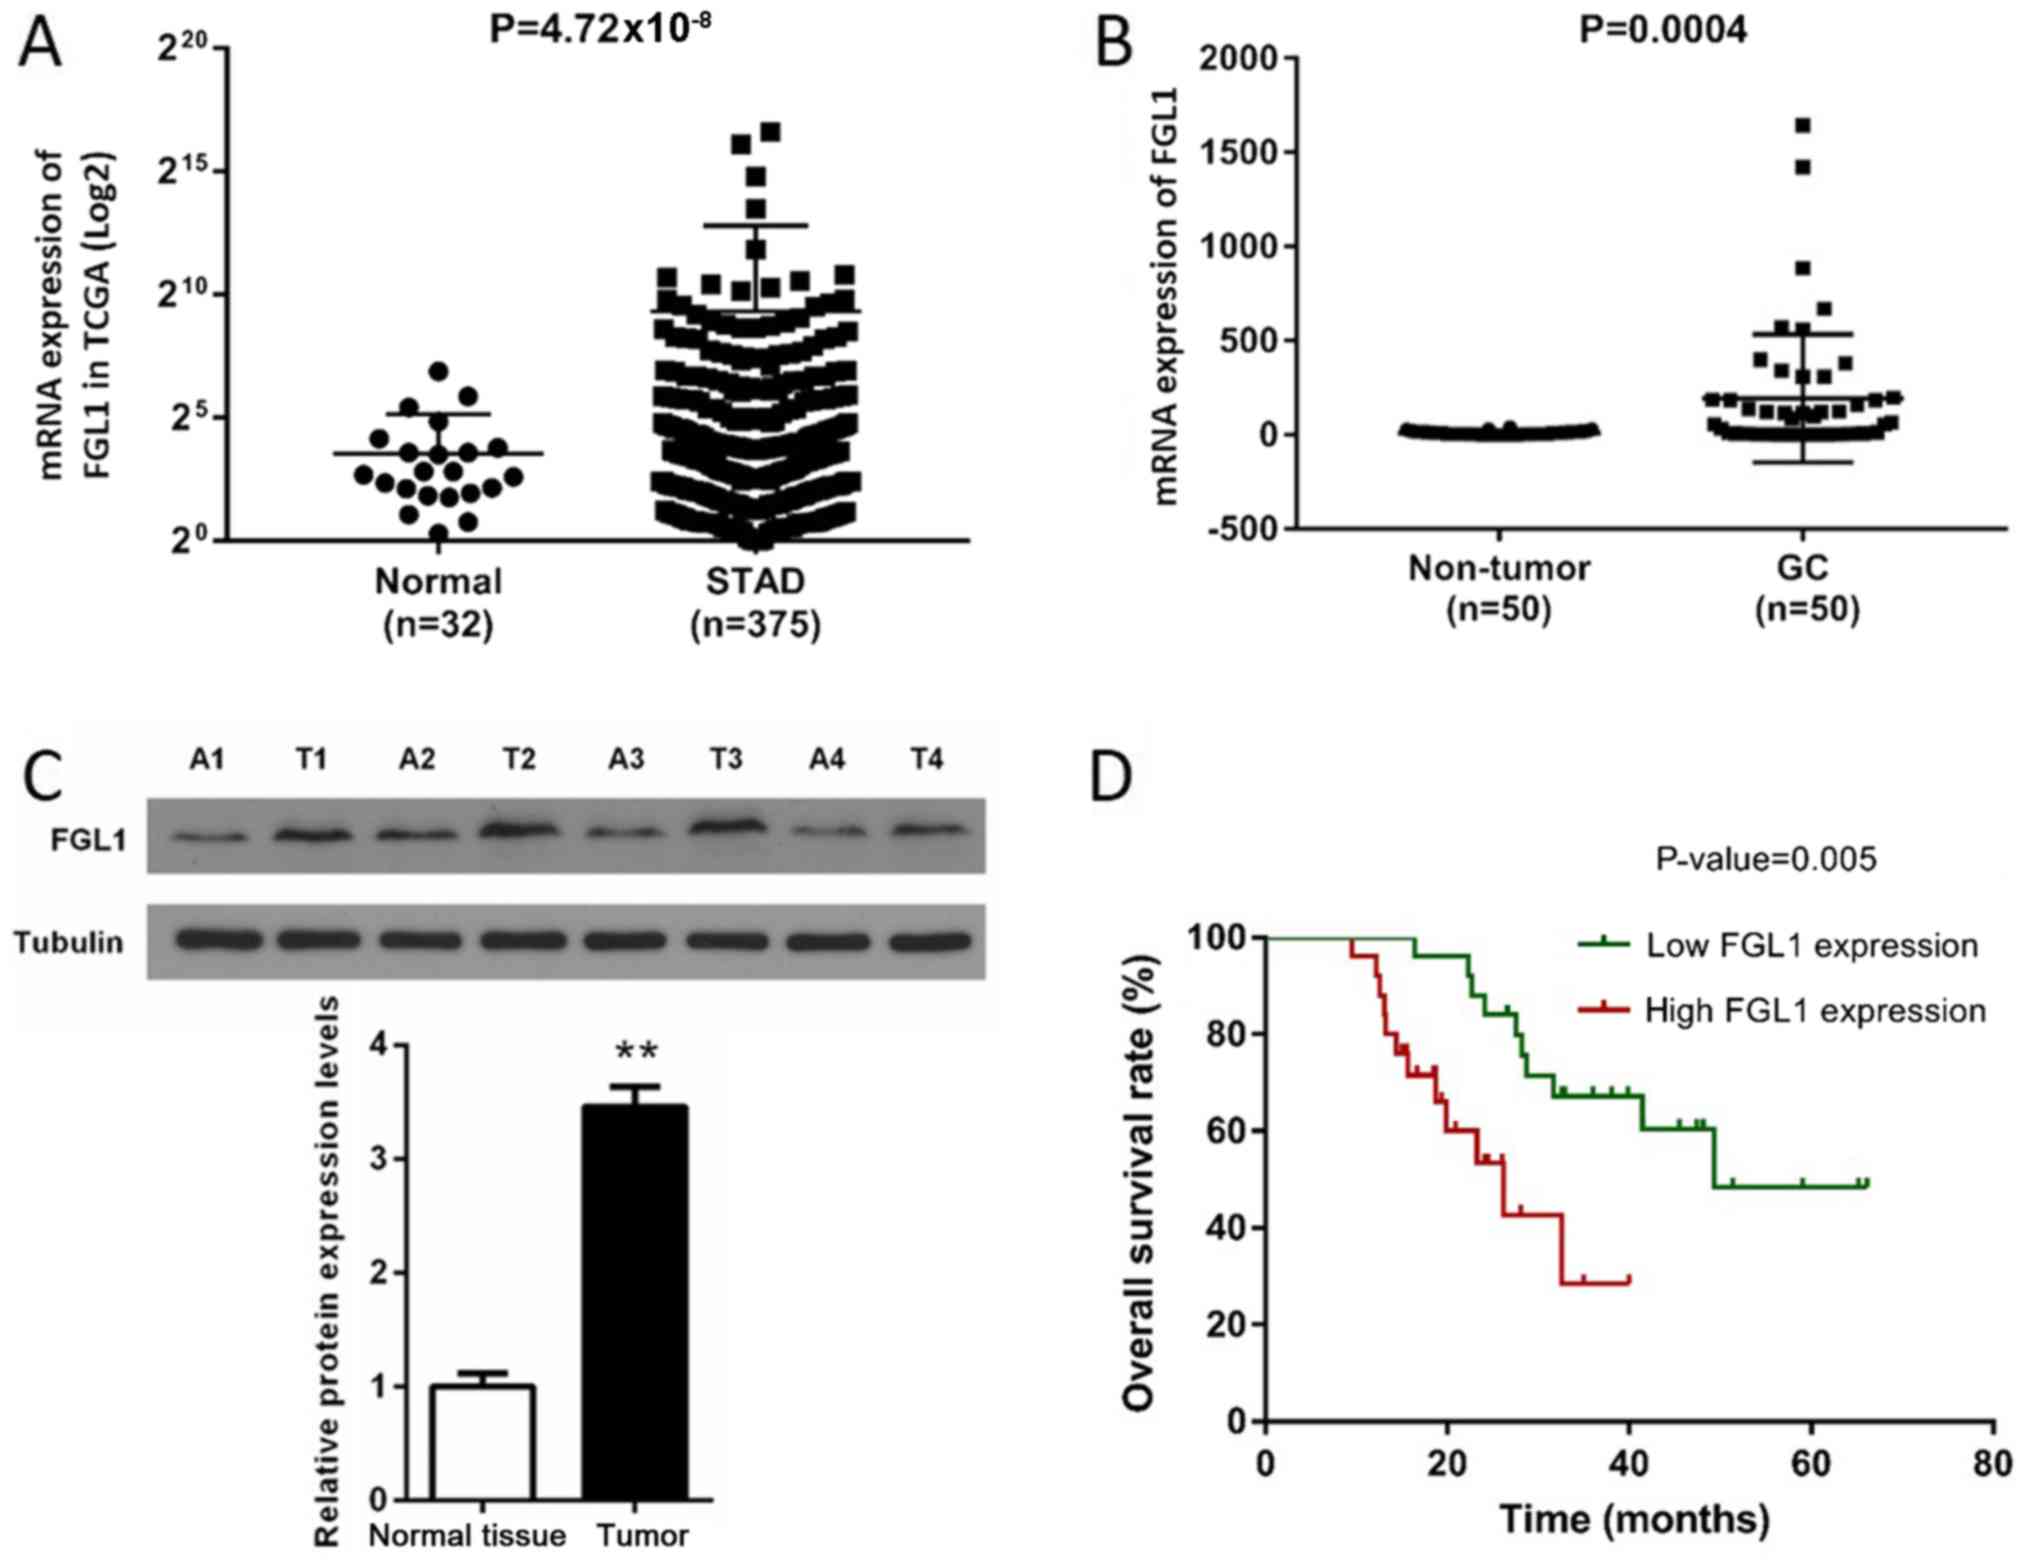
Firstly, the expression of FGL1 was analyzed based
on the data downloaded from TCGA database. As shown in Fig. 1A, the expression of FGL1 was
significantly increased in gastric cancer tissues compared with the
normal tissues (P<0.001). Then the expression of FGL1 of 50
patients in the gastric cancer tissues and the corresponding
adjacent tissues were analyzed by qPCR and western blotting. We
found that the expression of FGL1 in GC tissues were obviously
higher than that in the adjacent tissues at both mRNA and protein
levels (P<0.001, Fig. 1B and
C).
In order to further investigate the role of FGL1 in
GC, the correlation of FGL1 expression with clinicopathological
features was analyzed using Chi-square (χ2) test
(Table II). The 50 samples were
divided into high expression and low expression groups according to
the median of FGL1 expression. The results showed that high
expression of FGL1 was positive correlated with higher histological
grade (P=0.041), advanced pathologic-stage (P=0.023) and Lymph node
metastasis (P=0.021). Whereas, no significant association between
FGL1 expression and age, sex, pathologic-T, or pathologic-M was
observed. These data indicated that the upregulation of FGL1
expression maybe involve in malignant development of GC.
| Table II.Correlation between FGL1 expression
and clinicopathological features of 50 GC patients. |
Table II.
Correlation between FGL1 expression
and clinicopathological features of 50 GC patients.
|
| Expression of
FGL1 |
|
|---|
|
|
|
|
|---|
| Characteristics | Low (n) | High (n) | P-value |
|---|
| Age, years |
|
| 0.556 |
|
<60 | 8 | 10 |
|
| ≥60 | 17 | 15 |
|
| Sex |
|
| 0.382 |
|
Female | 11 | 8 |
|
|
Male | 14 | 17 |
|
| Grade |
|
| 0.041a |
|
G1+G2 | 13 | 6 |
|
| G3 | 12 | 19 |
|
|
Pathologic-Stage |
|
| 0.023a |
|
I+II | 15 | 7 |
|
|
III+IV | 10 | 18 |
|
| Pathologic-T |
|
| 0.107 |
|
T1+T2 | 9 | 4 |
|
|
T3+T4 | 16 | 21 |
|
| Pathologic-N |
|
| 0.021a |
| N0 | 14 | 6 |
|
|
N1+N2+N3 | 11 | 19 |
|
| Pathologic-M |
|
| 0.157 |
| M0 | 22 | 18 |
|
| M1 | 3 | 7 |
|
Subsequently, we analyzed the correlation between
FGL1 expression and prognosis of the 50 GC patients. The survival
curve showed that the overall survival rate (%) was significantly
different between low expression and high expression groups
(P<0.01) and high FGL1 expression was often associated with poor
prognosis (Fig. 1D). To
investigate whether FGL1 can serve as an independent predictor of
gastric adenocarcinoma prognosis, univariate and multivariate Cox
proportional hazards analyses was performed on 50 samples (Table III). Univariate analysis found
that FGL1 expression, pathologic-M, pathologic-N and histological
grade were obviously related to the overall survival of GC patients
(P<0.05). Multivariate analysis further demonstrated that FGL1
expression, pathologic-M and pathologic-N can serve as independent
predictors of poor prognosis in GC patients (P<0.05). These data
suggested that FGL1 possess the potential to serve as a marker for
the prognosis of GC patients.
| Table III.Univariate and multivariate Cox
proportional hazards analyses of clinico-pathological features for
the overall survival of 50 GC patients. |
Table III.
Univariate and multivariate Cox
proportional hazards analyses of clinico-pathological features for
the overall survival of 50 GC patients.
|
| Univariate
analysis | Multivariate
analysis |
|---|
|
|
|
|
|---|
| Variable | P-value | HR | 95% CI | P-value | HR | 95% CI |
|---|
| FGL1 expression
(high/low) | 0.007b | 3.598 | 1.409–9.191 | 0.009b | 4.052 | 1.412–11.629 |
| Pathologic-T
(T1+T2/T3+T4) | 0.646 | 1.250 | 0.482–3.240 | – | – | – |
| Pathologic-M
(M0/M1) | 0.001c | 6.304 | 2.104–18.888 | 0.030a | 3.592 | 1.135–11.367 |
| Pathologic-N
(N0/N1+N2+N3) | 0.001c | 7.496 | 2.409–23.328 | 0.022a | 4.403 | 1.237–15.666 |
| Histological grade
(G1+G2/G3) | 0.009b | 3.748 | 1.400–10.031 | 0.166 | 2.295 | 0.708–7.437 |
| Age (<60/≥60
years) | 0.512 | 0.751 | 0.319–1.767 | – | – | – |
| Sex
(female/male) | 0.680 | 0.835 | 0.356–1.962 | – | – | – |
Knockdown of FGL1 suppresses GC cell
proliferation
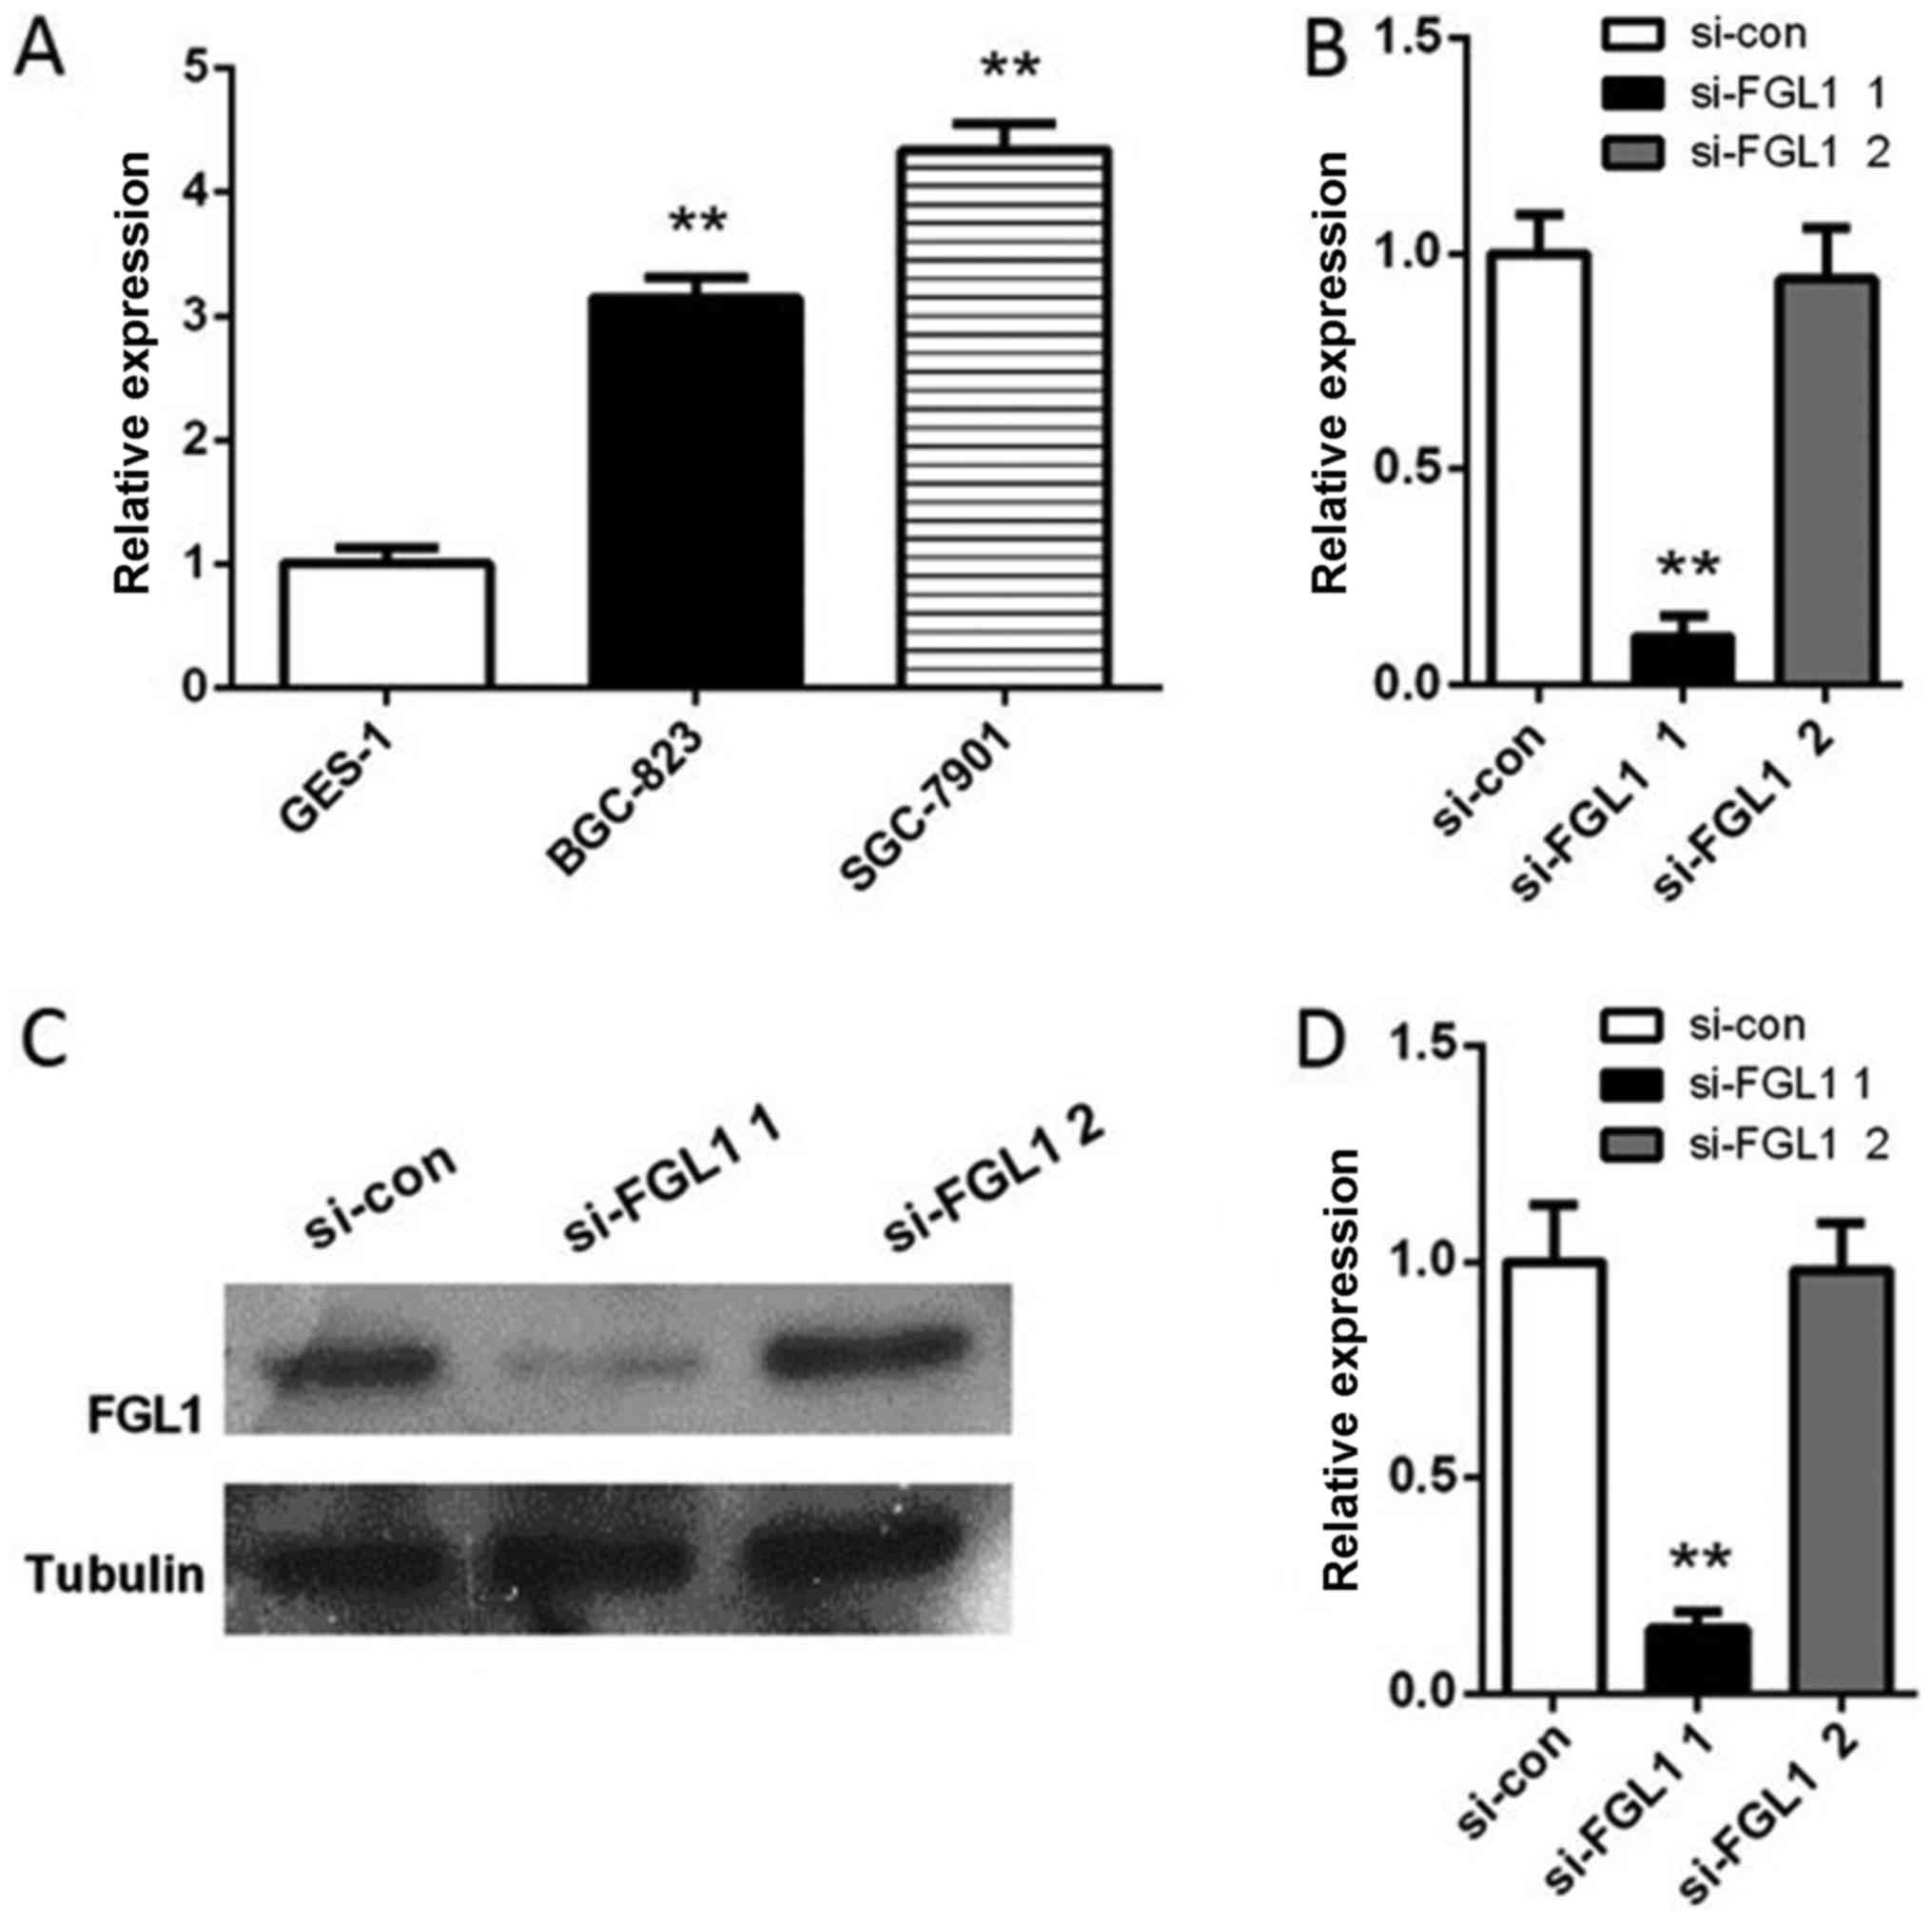
In order to further investigate the expression level
of FGL1 in gastric cancer cell lines, qPCR was performed on gastric
cancer cell line BGC-823, SGC-7901 and human gastric normal
epithelial mucosa cell line GES-1. We found that the expression of
FGL1 in BGC-823 and SGC-7901 cells were significantly upregulated
compared with that in GES-1 cells (P<0.01, Fig. 2A). Since the expression of FGL1 in
SGC-7901 cells was higher than that in BGC-823, we used SGC-7901
cells to perform subsequent experiments. SGC-7901 cells were
transfected with either FGL1 siRNA1 or FGL1 siRNA2, or scramble
siRNA. After transfected for 24 h, the expression of FGL1 in
SGC-7901 cells transfected with FGL1 siRNA1 decreased significantly
compared with the control both at RNA level (P<0.01, Fig. 2B) and at protein level (P<0.01,
Fig. 4C and D). While the level of
FGL1 was almost not changed in SGC-7901 cells transfected with FGL1
siRNA2 (Fig. 4). Hence cells
transfected with FGL1 siRNA1 were used for next experiments.
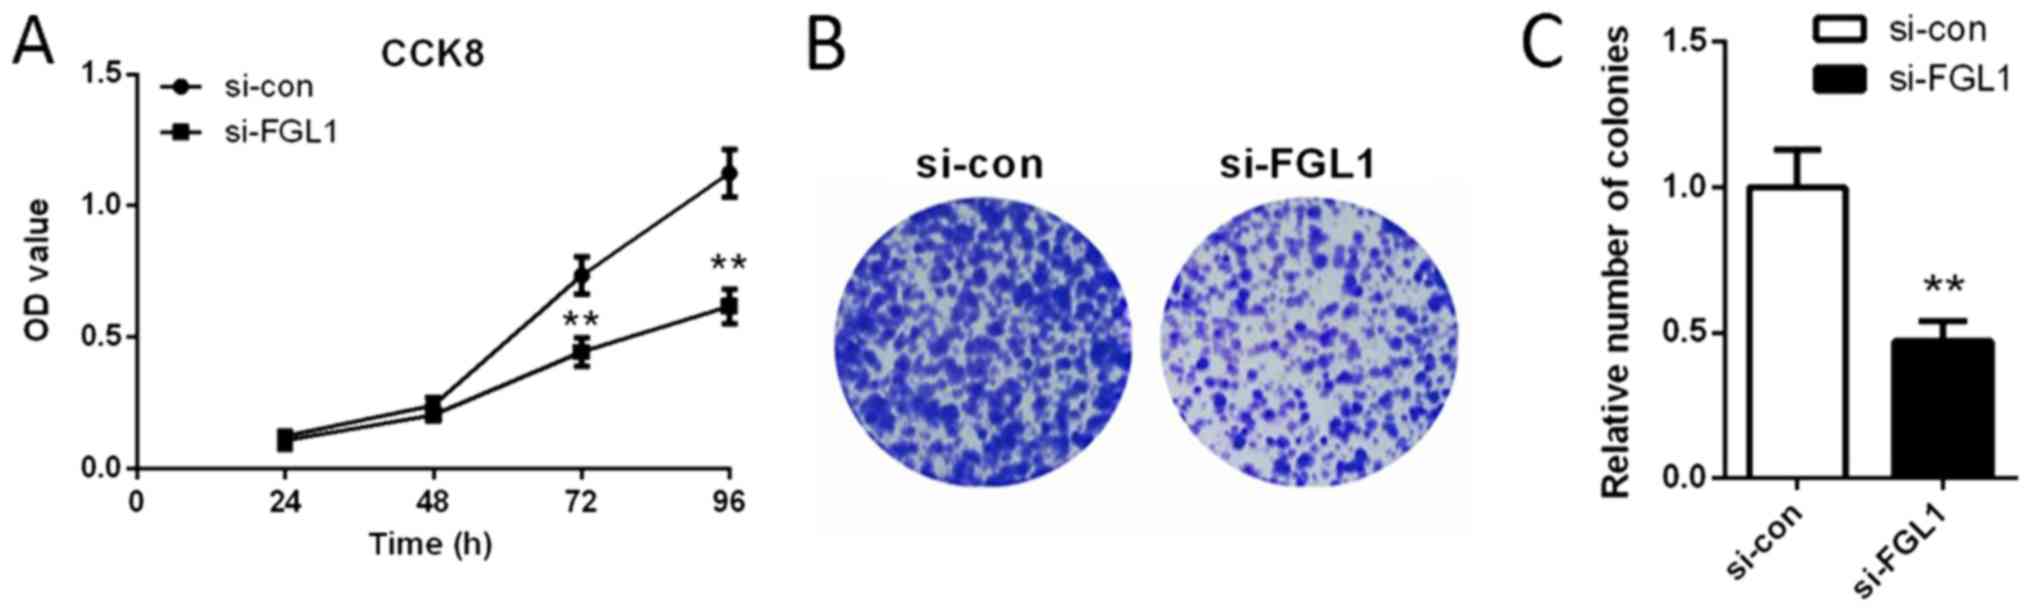
We explored the effect of FGL1 siRNA 1 on SGC-7901
cell proliferation by CCK8 assay and colony formation assay. We
found that the OD value was significantly lower after transfected
with FGL1 siRNA1 (siFGL1) for 72 and 96 h compared with the cells
transfected with scramble siRNA (si-con) (P<0.01, Fig. 3A). These data indicated that,
siFGL1 played an inhibitory role in SGC-7901 cell proliferation.
These results were further confirmed by the colony formation assay.
As shown in Fig. 3B and C,
knockdown of FGL1 significantly reduced the colony formation rate
of SGC-7901 cells (P<0.01).
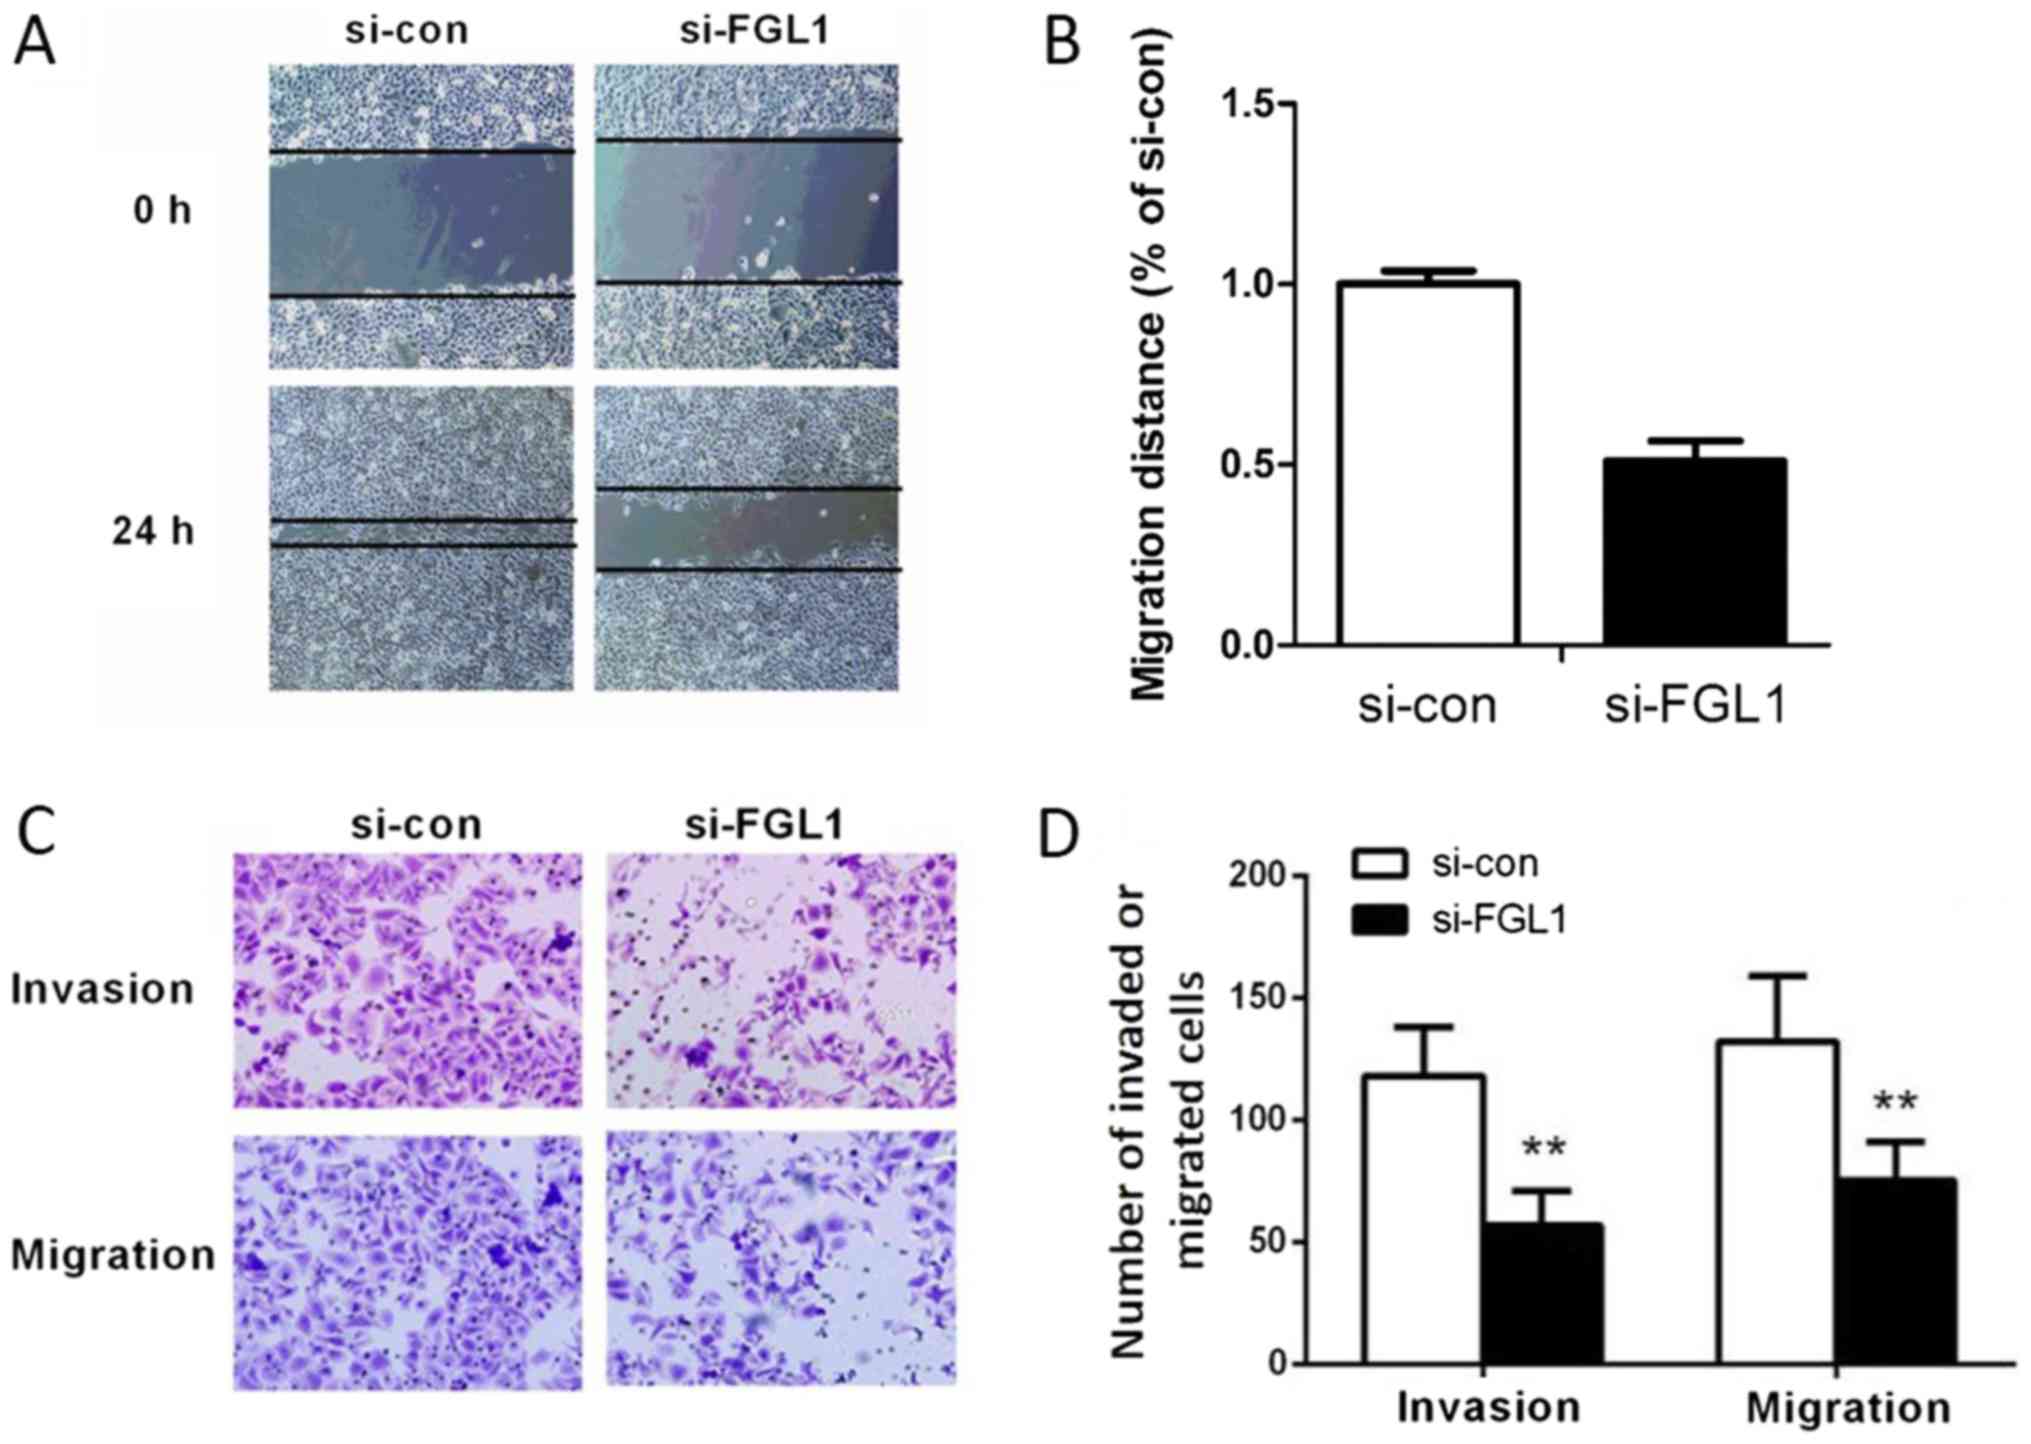
Knockdown of FGL1 suppressed SGC-7901
cell migration and invasion
To assess the effect of FGL1 on SGC-7901 cell
migration, scratch wound healing assay and Transwell migration
assay were utilized. Compared with the control group, a narrower
migratory distance was observed after silencing of FGL1 (P<0.01,
Fig. 4A and B). We also identified
that knockdown of FGL1 obviously reduced the number of migrated
SGC-7901 cells (P<0.01, Fig. 4C and
D). These data indicated that FGL1 play a promoting role in
SGC-7901 cell migration.
The invasion ability of SGC-7901 cells was tested
using Transwell invasion assay. As shown in Fig. 4C and D, the number of invaded cells
in siFGL1 group declined remarkably compared with the si-con group
(P<0.01). These results demonstrated that FGL1 also have a
promoting effect on SGC-7901 cell invasion.
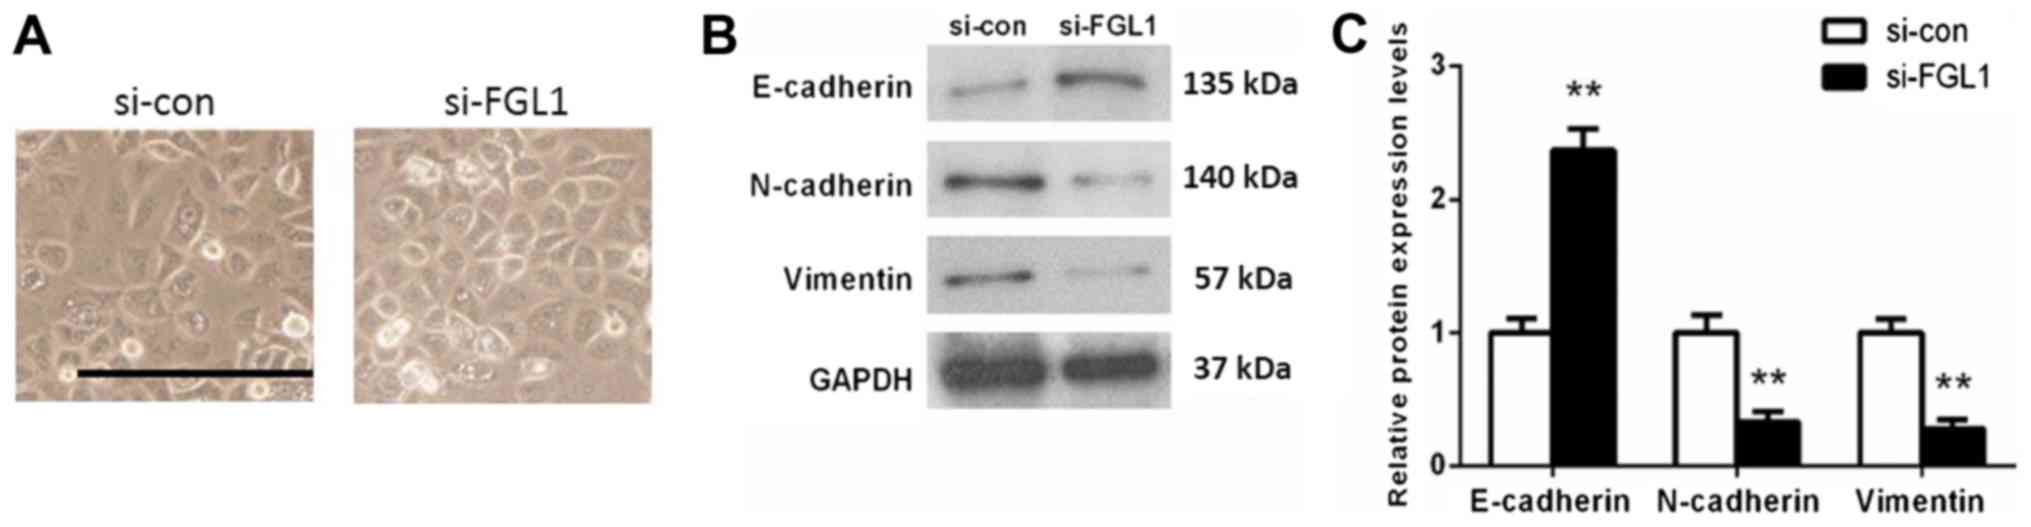
FGL1 involved in the regulation of
epithelial to mesenchymal transitions in SGC-7901 cells
Epithelial to mesenchymal transitions (EMT) is a
process that epithelial cells transform into mesenchymal cells
under physiological or pathological conditions, which allows for
cell movement. We further explored the effects of FGL1 on EMT of
SGC-7901 cells. Morphological observation found that cells in
si-con group include spindle-shaped cells, while cells with
depleting FGL1 were pebble-alike (Fig.
5A). Western blot analysis showed that knock down of FGL1 lead
to an obviously increase in E-cadherin expression (P<0.01) and a
significant decrease in N-cadherin (P<0.01) and Vimentin
expression (P<0.01) compared with the si-con group (Fig. 5B and C). These results implied that
FGL1 was indeed involved in the regulation of EMT in SGC-7901
cells.
Discussion
This study aimed to elucidate the role of FGL1 in
GC. We identified that FGL1 was upregulated in GC tissues and high
FGL1 expression was significantly correlated with poor prognosis.
Moreover, an inhibitory effect on SGC-7901 cell proliferation,
invasion and migration was observed after silencing FGL1.
Previous studies of FGL1, have mainly focused on its
role in stimulating tritiated thymidine uptake into hepatocytes,
rescuing animals from liver failure (9,10,12).
Demchev et al (8) have
reported that FGL1 was also expressed in brown adipose tissue and
the expression was enhanced following liver injury, suggesting a
correlation between the injured liver and adipose tissues. Further
experiments indicated that FGL1 plays a role in metabolism and
liver regeneration (8). At the
present study, we reported the upregulation of FGL1 in GC at the
first time, indicating FGL1 may be a promotor of GC. While, it has
been reported that the level of FGL1 in hepatocellular carcinoma
(HCC) was downregulated and it may serves as a tumor inhibitor in
HCC through an Akt dependent mechanism (13,14).
These difference indicating that FGL1 may be either upregulated or
downregulated depending on the cancer type.
To further explore the clinical value of FGL1, the
relationship between FGL1 expression and the clinical and
pathological factors of GC was analyzed. Our results suggested that
FGL1 was obviously correlated with histological grade,
pathologic-stage and Lymph node metastasis. However, no significant
associations between FGL1 the following factors, including age,
sex, pathologic-T, or pathologic-M were found. Simultaneously, we
identified that high expression of FGL1, pathologic-M and
pathologic-N can serve as independent prognostic risk factors in
GC.
In order to investigate the biological effect of
FGL1 in GC cell lines, we performed siRNA knockdown of FGL1 in
SGC-7901 cells. By colony formation assay and CCK8 assay, we found
that silencing FGL1 significantly suppressed SGC-7901 cell
proliferation (P<0.01). Furthermore, the results of wound
healing assay and Transwell invasion and migration assay indicated
that knockdown of FGL1 obviously decreased SGC-7901 cell invasion
and migration (P<0.01) in vitro. These observations
indicated that FGL1 was probably an oncogene which play a promoting
role in GC cell proliferation, invasion and migration. Furthermore,
these results confirmed that high expression of FGL1 was correlated
with poor prognosis in GC patients.
EMT has been widely recognized as an indispensable
member in tumor invasion and metastasis (15,16).
E-cadherin, N-cadherin and Vimentin are important markers of EMT
(17–19). Loss of E-cadherin, an important
feature of EMT, has been identified to relate to invasive and
undifferentiated phenotype in many types of tumors (19–21).
Upregulated expression of N-cadherin and Vimentin was also a key
characterization of EMT (22,23).
In the present study, we found that the expression of E-cadherin
was significantly upregulated and the levels of N-cadherin and
Vimentin were downregulated obviously in SGC-7901 cells after
knocking down of FGL1. This result indicated that FGL1 played a
promoting role in tumor invasion and metastasis and further
confirmed the results we obtained in cell migration and invasion
assays. Moreover, this is the first time to demonstrate that FGL1
could regulate EMT.
In summary, our results demonstrated that the
expression of FGL1 was upregulated in GC tissues as well as GC cell
lines, and high expression of FGL1 can serve as an independent
predictor of poor prognosis for GC patients. Silencing FGL1 lead to
an inhibitory effect on GC cell proliferation, migration and
invasion. Our results suggested that FGL1 has the potential to be a
predictor of prognosis in GC patients as well as a target for the
treatment of GC.
Acknowledgements
The authors would like to thank Zhengzhou Central
Hospital Affiliated to Zhengzhou University (Henan, China) for
providing the experimental platform.
Funding
No funding was received.
Availability of data and materials
All data generated or analyzed during this study are
included in this published article.
Authors' contributions
YZ and JHC contributed to the conception and design
of the present study. YZ and HXQ conducted the experiments, and
analyzed and interpreted the data. YTZ and LH assisted with data
collection and bioinformatics analysis. YZ was responsible for
drafting the manuscript. HXQ, YTZ and LH revised the manuscript.
JHC critically revised the manuscript for important intellectual
content and gave final approval of the version to be published.
Ethics approval and consent to
participate
The present study was approved by the Ethics
Committee of Zhengzhou Central Hospital Affiliated to Zhengzhou
University (Henan, China). Written informed consent was obtained
from all patients.
Consent for publication
Not applicable.
Competing interests
The authors declare that they have no competing
interests.
References
|
1
|
Sjoquist KM and Zalcberg JR: Gastric
cancer: Past progress and present challenges. Gastric Cancer.
18:205–209. 2015. View Article : Google Scholar : PubMed/NCBI
|
|
2
|
Torre LA, Bray F, Siegel RL, Ferlay J,
Lortet-Tieulent J and Jemal A: Global cancer statistics, 2012. CA
Cancer J Clin. 65:87–108. 2015. View Article : Google Scholar : PubMed/NCBI
|
|
3
|
Siegel R, Ma J, Zou Z and Jemal A: Cancer
statistics, 2014. CA Cancer J Clin. 64:9–29. 2014. View Article : Google Scholar : PubMed/NCBI
|
|
4
|
Lin MT, Lin BR, Chang CC, Chu CY, Su HJ,
Chen ST, Jeng YM and Kuo ML: IL-6 induces AGS gastric cancer cell
invasion via activation of the c-Src/RhoA/ROCK signaling pathway.
Int J Cancer. 120:2600–2608. 2007. View Article : Google Scholar : PubMed/NCBI
|
|
5
|
Dassen AE, Lemmens VE, van de Poll-Franse
LV, Creemers GJ, Brenninkmeijer SJ, Lips DJ, Wurff Vd AA, Bosscha K
and Coebergh JW: Trends in incidence, treatment and survival of
gastric adenocarcinoma between 1990 and 2007: A population-based
study in The Netherlands. Eur J Cancer. 46:1101–1110. 2010.
View Article : Google Scholar : PubMed/NCBI
|
|
6
|
Szász AM, Lánczky A, Nagy Á, Förster S,
Hark K, Green JE, Boussioutas A, Busuttil R, Szabó A and Győrffy B:
Cross-validation of survival associated biomarkers in gastric
cancer using transcriptomic data of 1,065 patients. Oncotarget.
7:49322–49333. 2016. View Article : Google Scholar : PubMed/NCBI
|
|
7
|
Yamamoto T, Gotoh M, Sasaki H, Terada M,
Kitajima M and Hirohashi S: Molecular cloning and initial
characterization of a novel fibrinogen-related gene, HFREP-1.
Biochem Biophys Res Commun. 193:681–687. 1993. View Article : Google Scholar : PubMed/NCBI
|
|
8
|
Demchev V, Malana G, Vangala D, Stoll J,
Desai A, Kang HW, Li Y, Nayeb-Hashemi H, Niepel M, Cohen DE and
Ukomadu C: Targeted deletion of fibrinogen like protein 1 reveals a
novel role in energy substrate utilization. PLoS One. 8:e580842013.
View Article : Google Scholar : PubMed/NCBI
|
|
9
|
Hara H, Yoshimura H, Uchida S, Toyoda Y,
Aoki M, Sakai Y, Morimoto S and Shiokawa K: Molecular cloning and
functional expression analysis of a cDNA for human hepassocin, a
liver-specific protein with hepatocyte mitogenic activity. Biochim
Biophys Acta. 1520:45–53. 2001. View Article : Google Scholar : PubMed/NCBI
|
|
10
|
Li CY, Cao CZ, Xu WX, Cao MM, Yang F, Dong
L, Yu M, Zhan YQ, Gao YB, Li W, et al: Recombinant human hepassocin
stimulates proliferation of hepatocytes in vivo and improves
survival in rats with fulminant hepatic failure. Gut. 59:817–826.
2010. View Article : Google Scholar : PubMed/NCBI
|
|
11
|
Livak KJ and Schmittgen TD: Analysis of
relative gene expression data using real-time quantitative PCR and
the 2(-Delta Delta C(T)) method. Methods. 25:402–408. 2001.
View Article : Google Scholar : PubMed/NCBI
|
|
12
|
Liu Z and Ukomadu C: Fibrinogen-like
protein 1, a hepatocyte derived protein is an acute phase reactant.
Biochem Biophys Res Commun. 365:729–734. 2008. View Article : Google Scholar : PubMed/NCBI
|
|
13
|
Nayeb-Hashemi H, Desai A, Demchev V,
Bronson RT, Hornick JL, Cohen DE and Ukomadu C: Targeted disruption
of fibrinogen like protein-1 accelerates hepatocellular carcinoma
development. Biochem Biophys Res Commun. 465:167–173. 2015.
View Article : Google Scholar : PubMed/NCBI
|
|
14
|
Yan J, Yu Y, Wang N, Chang Y, Ying H, Liu
W, He J, Li S, Jiang W, Li Y, et al: LFIRE-1/HFREP-1, a
liver-specific gene, is frequently downregulated and has growth
suppressor activity in hepatocellular carcinoma. Oncogene.
23:1939–1949. 2004. View Article : Google Scholar : PubMed/NCBI
|
|
15
|
Grunert S, Jechlinger M and Beug H:
Diverse cellular and molecular mechanisms contribute to epithelial
plasticity and metastasis. Nat Rev Mol Cell Biol. 4:657–665. 2003.
View Article : Google Scholar : PubMed/NCBI
|
|
16
|
Giannelli G, Koudelkova P, Dituri F and
Mikulits W: Role of epithelial to mesenchymal transition in
hepatocellular carcinoma. J Hepatol. 65:798–808. 2016. View Article : Google Scholar : PubMed/NCBI
|
|
17
|
Prasad CP, Rath G, Mathur S, Bhatnagar D,
Parshad R and Ralhan R: Expression analysis of E-cadherin, Slug and
GSK3beta in invasive ductal carcinoma of breast. BMC Cancer.
9:3252009. View Article : Google Scholar : PubMed/NCBI
|
|
18
|
Zhang W, Altholland A, Margulis A, Shamis
Y, Fusenig NE, Rodeck U and Garlick JA: E-cadherin loss promotes
the initiation of squamous cell carcinoma invasion through
modulation of integrin-mediated adhesion. J Cell Sci. 119:283–291.
2006. View Article : Google Scholar : PubMed/NCBI
|
|
19
|
Nakajima S, Doi R, Toyoda E, Tsuji S, Wada
M, Koizumi M, Tulachan SS, Ito D, Kami K, Mori T, et al: N-cadherin
expression and epithelial-mesenchymal transition in pancreatic
carcinoma. Clin Cancer Res. 10:4125–4133. 2004. View Article : Google Scholar : PubMed/NCBI
|
|
20
|
Zhou J, Tao D, Xu Q, Gao Z and Tang D:
Expression of E-cadherin and vimentin in oral squamous cell
carcinoma. Int J Clin Exp Pathol. 8:3150–3154. 2015.PubMed/NCBI
|
|
21
|
Xie X, Zheng X, Wang J and Chen L:
Clinical significance of Twist, E-cadherin, and N-cadherin protein
expression in endometrioid adenocarcinoma. J Cancer Res Ther.
13:817–822. 2017. View Article : Google Scholar : PubMed/NCBI
|
|
22
|
Avila D: N-cadherin and vimentin
expression in small rounded-shaped cells of non-functioning human
pituitary adenomas. Int J Clin Exp. 9:7854–7866. 2016.
|
|
23
|
Satelli A and Li S: Vimentin in cancer and
its potential as a molecular target for cancer therapy. Cell Mol
Life Sci. 68:3033–3046. 2011. View Article : Google Scholar : PubMed/NCBI
|