Introduction
Power frequency electromagnetic field (PFEMF) of
50–60-Hz, a type of non-ionizing radiation generated by household
appliances, transmission lines, and transformers, belongs to the
category of extreme-low frequency electromagnetic fields (ELF-EMF)
(3–300 Hz). Although PFEMF differs from radiofrequency, which was
suggested to be possibly carcinogenic to humans by the World Health
Organization (WHO) in 2014, concerns regarding the potential
effects of PFEMF on human health have been widely debated in the
past decades. This debate has been stimulated by epidemiological
studies indicating a relationship between ELF-EMF and various types
of cancer (1–4). Additionally, arguments supporting
both no significant (5) and
significant (6,7) health risks have led to increased
apprehension owing to the lack of sufficient mechanistic
understanding regarding the biological effects of PFEMF (8).
The only endpoint studied in sufficient detail with
respect to the relationship between PFEMF and cancer concerns
childhood leukemia, which is the most frequent childhood malignancy
and peaks in the age group of 2- to 5-year-olds. Most cases consist
of acute lymphocytic leukemia or acute myeloid leukemia;
conversely, chronic leukemias are rare in children. Evidence also
suggests that childhood leukemia is tightly associated with PFEMF
exposure during pregnancy or early life and risk estimates reach
statistical significance at exposure levels of 0.3–0.4 µT (9–12).
Notably, childhood cancers aside from leukemia such as brain and
nervous system tumors have not been studied in sufficient detail to
draw conclusions regarding the existence and magnitude of the
potential risks associated with PFEMF (13). Furthermore, to date, no mechanism
by which ELF-EMFs or other types of radiofrequency radiation might
cause cancer has been identified.
Chemokines belong to a family of small cytokines,
8–10 kDa in mass, that are secreted by cells. Chemokines function
as chemotactic cytokines to induce the directed migration of
leukocytes after interacting with their corresponding receptors, a
process termed chemotaxis (2).
Based on their structure, chemokines can be classified into four
highly conserved groups: CC, CXC, C, and CX3C. More than
50 chemokines and at least 18 chemokine receptors have been
identified (14). In addition,
many chemokines are pro-inflammatory and can be induced during an
immune response to recruit cells of the immune system to a site of
infection. Strong evidences have indicated that complex networks of
chemokines and their receptors play diverse roles and influence the
development of primary cancers and metastases (14–20).
In particular, the levels of a CC chemokine, CCL18, have been shown
to be correlated with the incidence of childhood leukemia, and thus
this chemokine has been proposed to act as a diagnostic marker
(19,21). In adult leukemia, higher expression
levels of the chemokine receptor CCR4 have also been found to
indicate poor prognosis (15).
CCL2-triggered chemokine cascade in macrophages promotes metastatic
seeding of breast cancer cells thereby amplifying the extant
pathology (17). Furthermore,
chemokines are not only associated with the occurrence of cancer
but also determine the metastatic capabilities of primary cancer
together with integrin molecules (18,20).
The purpose of this study was to investigate whether
exposure to PFEMF might dysregulate the circulating chemokine
levels in serum, which we considered might serve as a prerequisite
for establishing a relationship between the occurrence of
malignancy and PFEMF exposure. We divided mice into groups and
treated them with different doses of a magnetic field (0.1 mT to
represent public exposure, 0.5 mT for occupational exposure, and
2.5 mT for unusually strong exposure) for 8 h every day. The serum
of the treated animals was collected at different time points (0,
1, 10, 30, and 90 days) and subjected to chemokine assays using the
Luminex technique (22) to
determine the presence of chemokine induction by PFEMF. Evidence
supporting the potential pro-inflammatory nature of power frequency
may shed light on the mechanisms of PMEMF-induced diseases,
including cancer.
Materials and methods
Animals
The present study was approved by the Institutional
Animal Care and Use Committee (IACUC) of Southern Medical
University (Approval code: L2016103; 13 September 2016). They are
in accordance with the guidelines of the Asian Federation of
Laboratory Animal Science Associations (AFLAS) and the National
Regulations for the Administration of Affairs Concerning
Experimental Animals (8 January 2011). All animals were purchased
from the experimental animal center of Southern Medical University
and treated in accordance with standard guidelines for the care and
use of laboratory animals. Male Balb/c mice weighing 17.05±0.2 g at
the time of the experiments were housed at 25°C and 50–60% relative
humidity in cages under a 12–12 h light/dark cycle, with free
access to food and water. The mice were divided into groups and
exposed to different dosages of magnetic field (0.1, 0.5, and 2.5
mT with 50 Hz, 8 h/day) for different numbers of consecutive days
(0, 1, 10, 30, and 90 days). Out of 100 animals in each group, 20
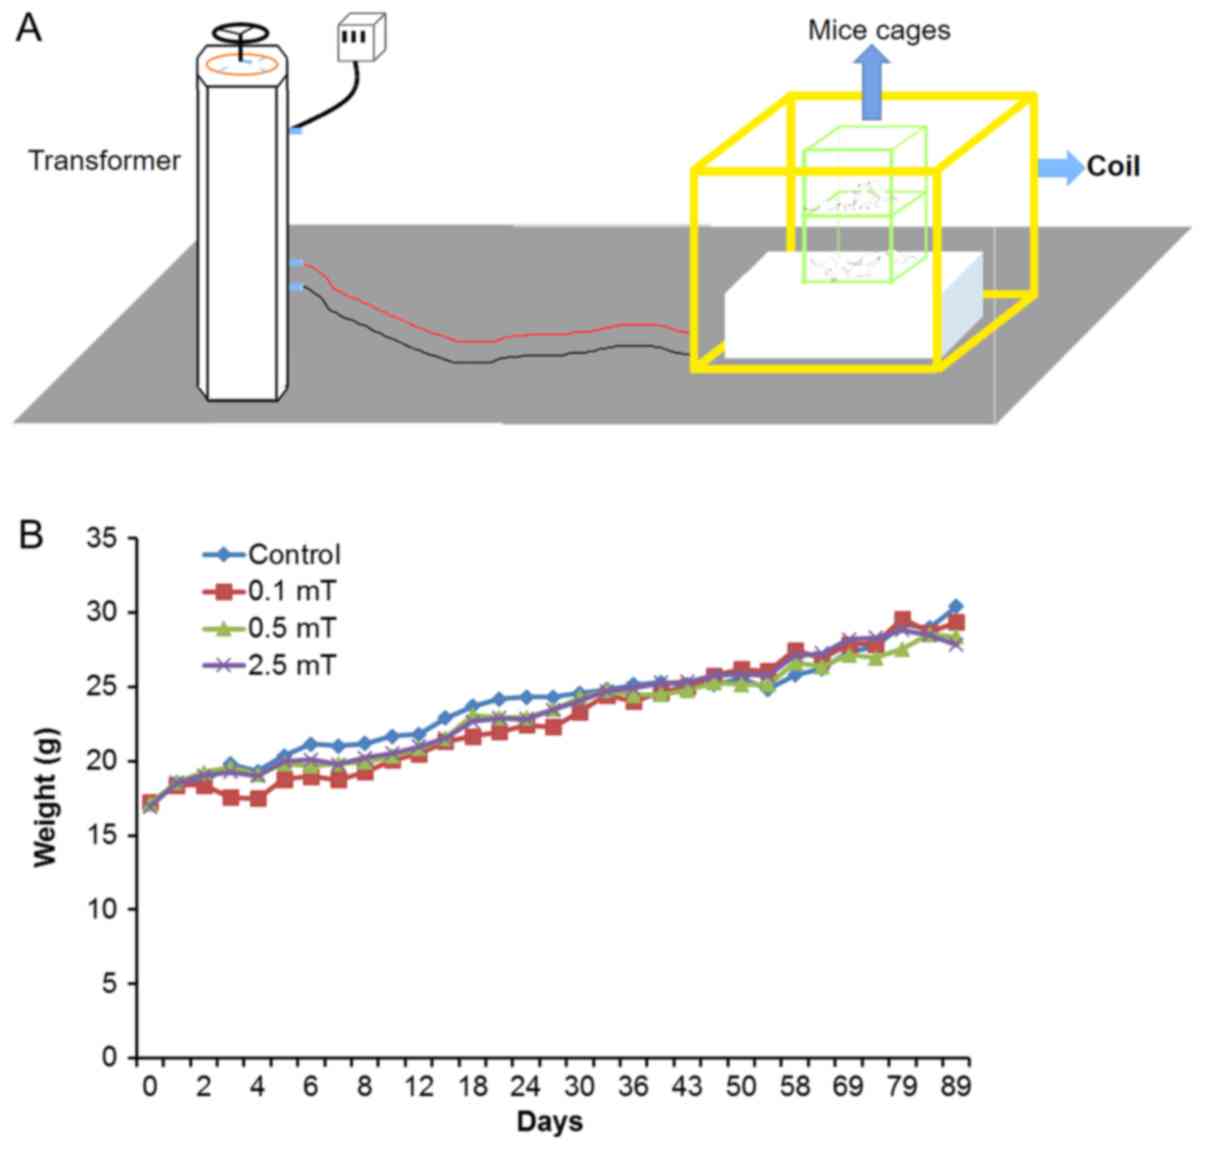
were randomly chosen and weighed every other day.
Exposure system
The exposure system was assembled by Lioncel
(Shanghai, China) and was composed of a TSGC2J-60KVA contact type
voltage regulator (Goodyi, Shanghai, China) and a model MFA-201C
magnetic antenna (Lioncel). The transformer was used to provide
electric current to the Helmholtz-type coils for generating the
magnetic field, and the homogenous region of which was 0.4×0.4×0.4
(m) with harmonics below 1.0%. The PFEMF was measured inside the
cage and kept constant, independent of the position. As ‘on-off’
switching operations induce high-frequency transient EMFs that may
lead to biological effects, we always switched on the system,
waited for at least 1 min to ensure the absence of transients, and
then placed the cages in the coils with mechanical assistance. The
whole equipment assembly and cage placement was depicted in
Fig. 1A.
Exposure procedure
The exposed groups (n=100 for each dosage of 0.1,
0.5, and 2.5 mT) and equal number mice of control group were housed
in standardized cages (10 mice per cage); all cages were placed in
the same room. In order to simulate the working and living
environmental conditions, the PFEMF exposure group was exposed to
EMF of 50 Hz at 0.1, 0.5, or 2.5 mT (rms), as determined by a
gaussmeter (PMM 8053B; NARDA Safety Test Solutions, Italy), for 8 h
per day for 0, 1, 10, 30, and 90 consecutive days. Exposed animals
were compared with sham-exposed controls derived from the same
source and simultaneously handled and assessed in the same manner,
except for the presence of the EMFs. The animals were weighed every
other day using an electronic balance.
Serum collection
At the planned time points, blood was harvested from
the retro-orbital plexus after the mice were anesthetized using
diethyl ether. The serum samples were collected as described
previously (23). The blood
samples were incubated at 4°C for 3–4 h to allow clotting and then
centrifuged at 2,500 g at 4°C for 10 min. Isolated serum
(approximately 300 µl) was preserved at −80°C for further analysis.
For each dosage-time point, at least 20 serum samples were
collected. The mice were euthanized by cervical dislocation to
prevent suffering after blood sampling. The Southern Medical
University Animal Care and Use Committee approved all procedures
involving the mice.
Chemokine assay
The concentrations of chemokines were detected using
a ProcartaPlex® Multiplex Immunoassay Chemokine Panel 1
[(eBioscience; Thermo Fisher Scientific, Inc., Waltham, MA, USA), 9
plex, including EOTAXIN-1 (CCL11), GROα (CXCL1), IP-10 (CXCL10),
MCP-1 (CCL2), MCP-3 (CCL7), MIP-1α (CCL3), MIP-1β (CCL4), MIP-2
(CXCL2), and RANTES (CCL5)] via the Luminex technique. For each
dosage-time point, 4 serum samples were used for the Luminex assay,
and their chemokine concentrations were averaged as the final
concentration of that dosage-time point. This assay was performed
following the manufacturer's instructions. The evaluation of the
inter-assay coefficients of variation is described in Table I.
 | Table I.Coefficients of variation for low and
high value controls of the measured variables. |
Table I.
Coefficients of variation for low and
high value controls of the measured variables.
|
|
| Control I (low
values) | Control II (high
values) |
|
|---|
|
|
|
|
|
|
|---|
| Variables | Units | Range | Mean | CV (%) | Range | Mean | CV (%) | Inter-assay CV
(n=4; %) |
|---|
| MCP-1 | pg/ml | 53.18–89.20 | 68.62 | 28.06 | 95.33–114.90 | 107.72 | 6.27 | 17.17 |
| MCP-3 | pg/ml | 128.04–215.75 | 174.31 | 19.63 | 63.76–102.75 | 83.85 | 16.95 | 18.29 |
| MIP-1α | pg/ml | 2.55–3.58 | 3.11 | 16.71 | 4.40–6.15 | 5.25 | 10.16 | 13.43 |
| MIP-1β | pg/ml | 2.34–7.27 | 4.91 | 28.64 | 7.90–11.46 | 9.58 | 14.72 | 21.68 |
| MIP-2 | pg/ml | 14.14–30.00 | 20.25 | 29.26 | 10.19–13.67 | 11.91 | 9.35 | 19.31 |
| EOTAXIN-1 | pg/ml | 87.26–176.76 | 127.06 | 27.25 | 388.54–551.62 | 473.70 | 11.12 | 19.18 |
| IP-10 | pg/ml | 57.91–124.51 | 84.58 | 29.67 | 62.33–134.47 | 97.72 | 25.34 | 27.51 |
| GRO-α | pg/ml | 16.63–29.24 | 22.14 | 30.97 | 12.29–35.16 | 25.43 | 27.11 | 29.04 |
| RANTES | pg/ml | 7.04–14.31 | 10.90 | 33.51 | 19.39–36.03 | 26.02 | 20.64 | 27.08 |
Enzyme-linked immunosorbent assay
(ELISA)
The concentrations of EOTAXIN-1 and MCP-1 were
measured using mouse CCL2/MCP-1 and CCL11/Eotaxin ELISA kits
(MultiSciences, Shanghai, China), respectively, to verify the
levels of the two chemokines in serum. The tests were performed
according to the manufacturer's instructions for each kit. Density
values for unknown samples were assessed using the standard curve
for each analyte to calculate actual values in pg/ml. The minimum
detectable dose of CCL2 was 20.54 pg/ml and that of CCL11 was 0.73
pg/ml.
Statistical analysis
IBM SPSS statistics v.20 software (IBM Corp.,
Armonk, NY, USA) was used for data analysis. All observations were
tested for normality using the Kolmogorov-Smirnov test and for
homogeneity of variance using Levene's test. Factorial analysis of
variance followed by Dunnett's post hoc test was used for
comparisons between experimental and controls groups for mouse
weight and chemokine levels (all statistical tests performed were
two-sided). The results are expressed as the mean ± standard error
(SE). P<0.05 was considered to indicate a statistically
significant difference.
Results
PFEMF exposure does not lead to
significant change of body weight
In order to simulate the working and living
environmental conditions, the animals were exposed to EMF of 50 Hz
at 0.1, 0.5, or 2.5 mT, for 8 h per day for 0, 1, 10, 30, and 90
consecutive days. For the control group, the initial and final body
weight averages were 17.1±0.6 and 30.4±0.2 g, respectively; for the
0.1 mT group, the respective values were 17.2±0.4 and 29.4±0.6 g;
for the 0.5 mT group, the respective values were 17.1±0.5 and
29.4±0.4 g; and for the 2.5 mT group, the respective values were
16.9±0.4 and 27.8±0.2 g. N=20 for each group. Although the treated
groups show slight decreases compared with the control group
overall, no significant difference was detected. From these
results, we concluded that PFEMF exposure did not cause a
significant alteration in body weight (Fig. 1B).
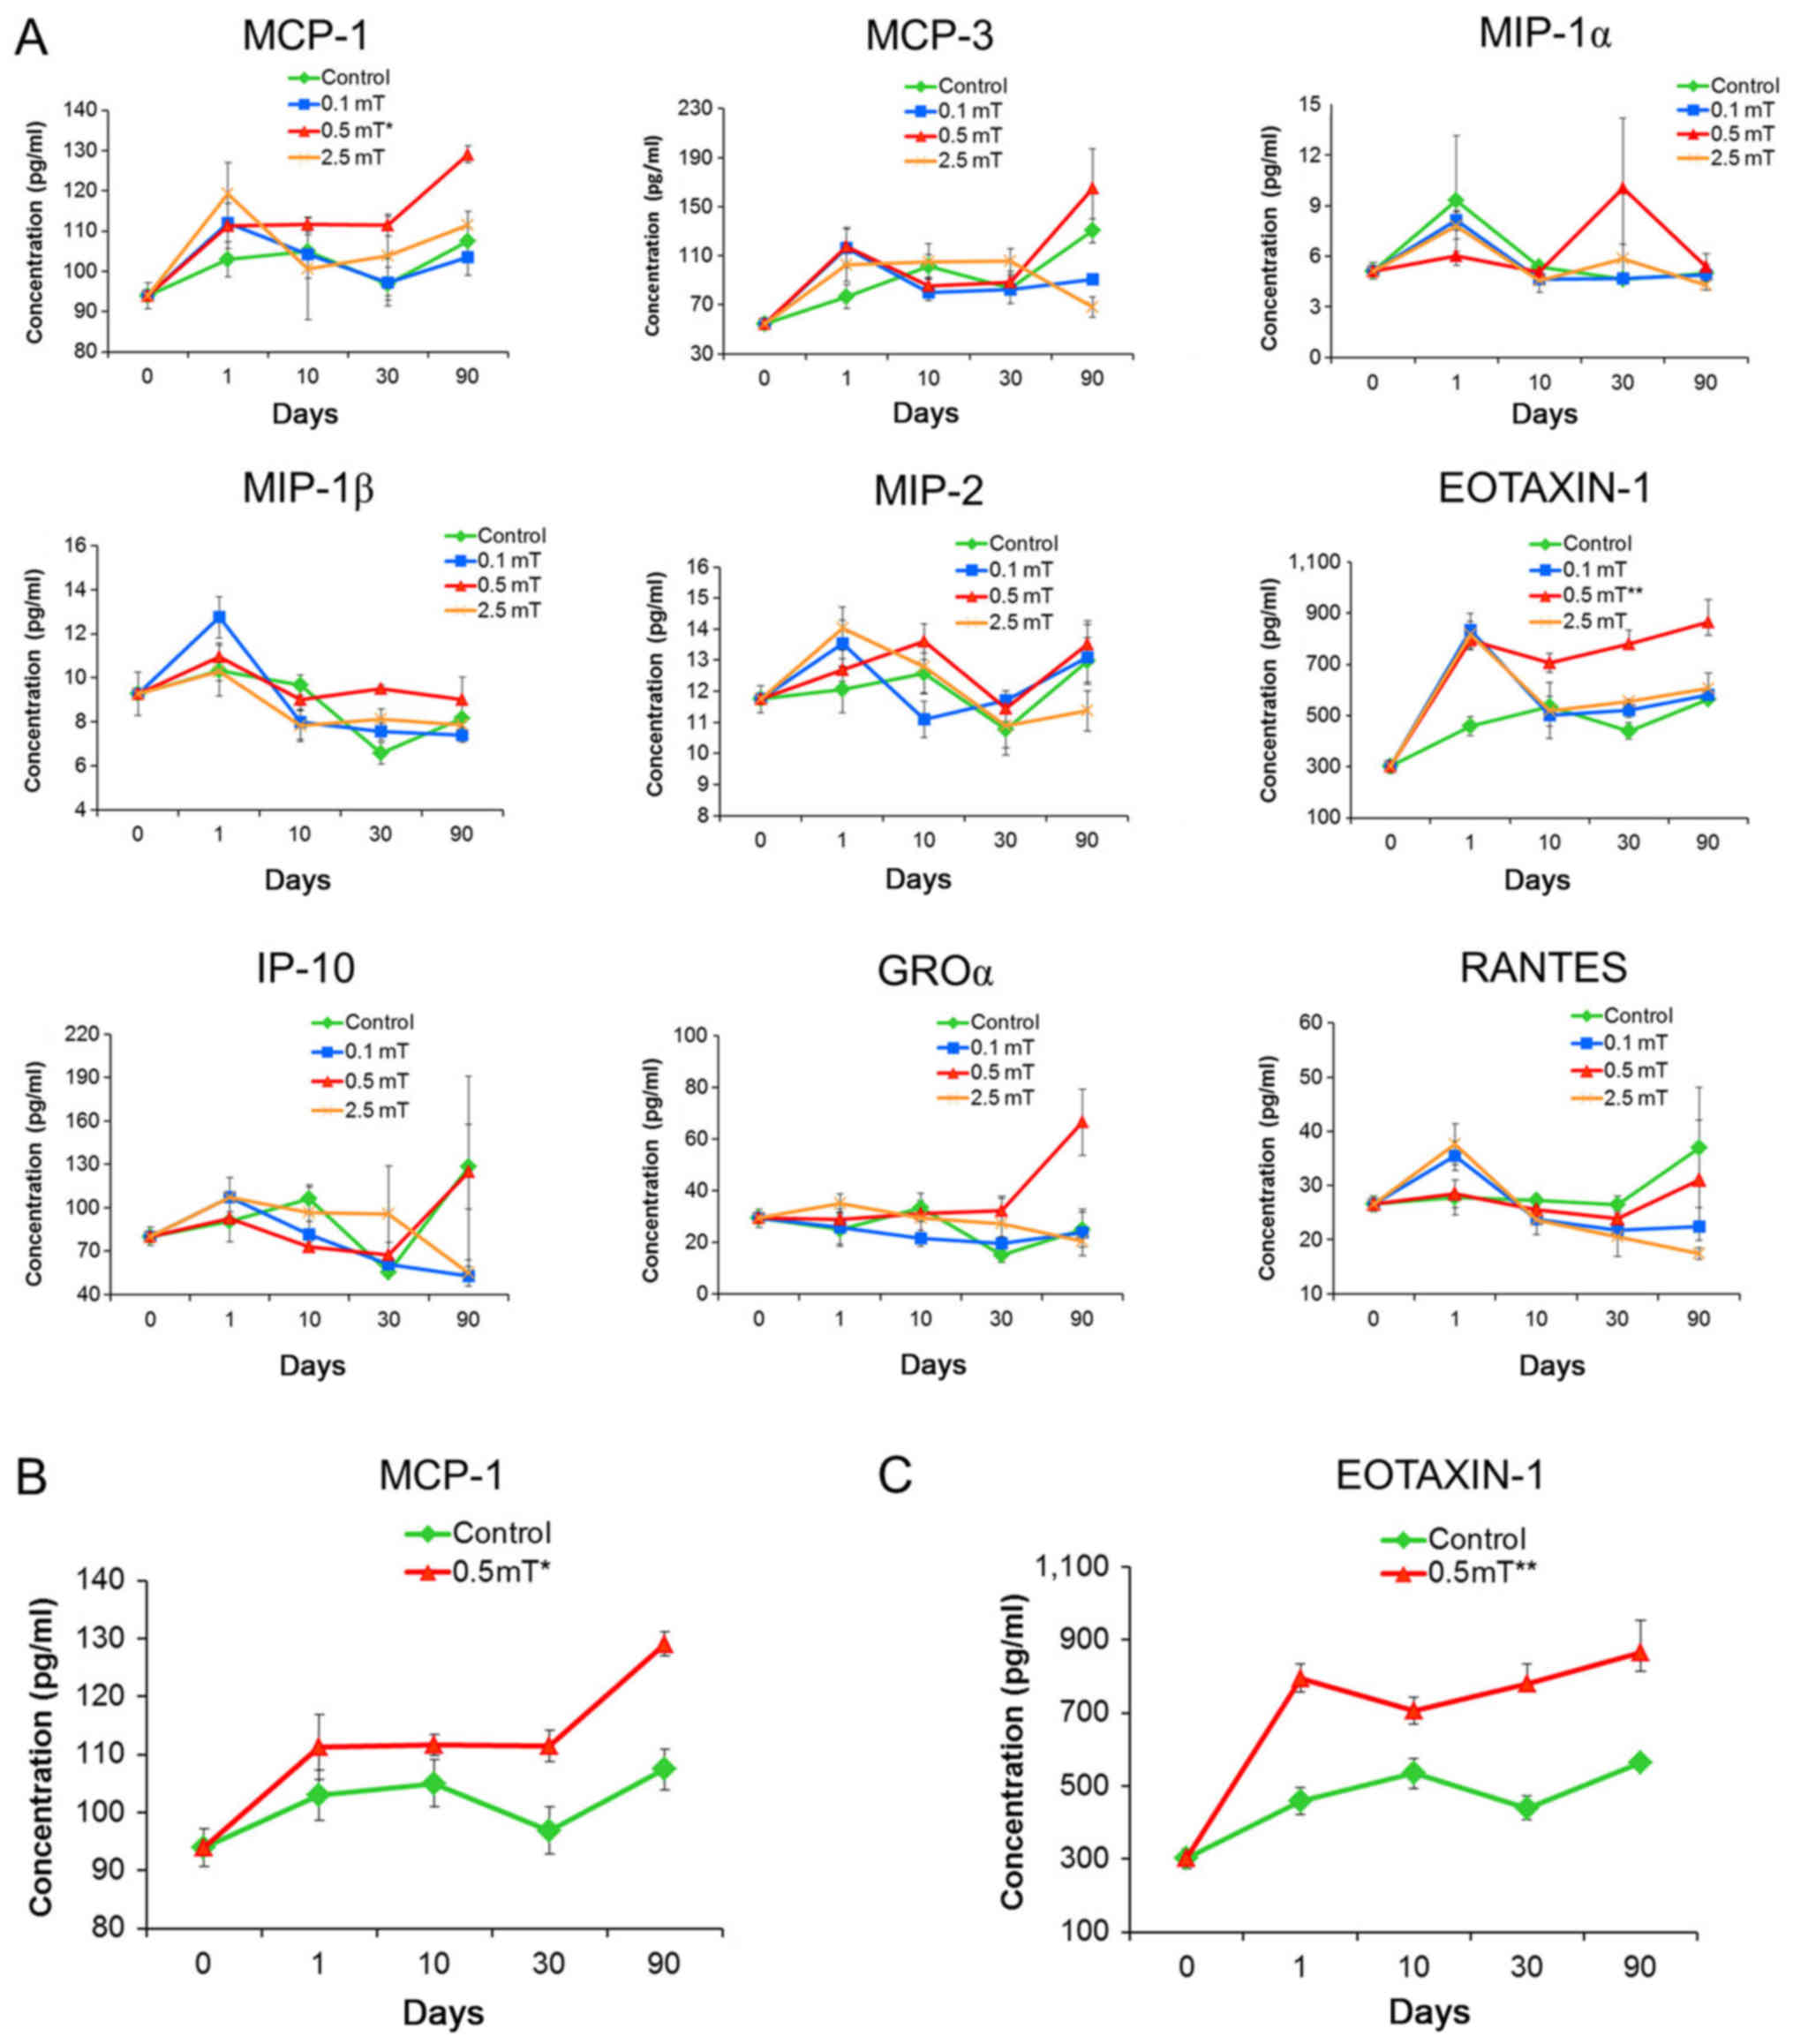
PFEMF exposure induces specific
circulating chemokines in mice
To investigate the relationship between alteration
of chemokine concentration in serum and exposure to PFEMF, we
determined the circulating chemokine concentration in serum using
the Luminex technique after 0, 1, 10, 30, and 90 days of PFEMF
exposure. The levels of some of the assayed chemokines, e.g.,
MCP-3, MIP-1α, MIP-1β, and MIP-2, in the serum were not
significantly influenced by PFEMF exposure (Table II; Fig. 2A). Conversely, statistical analysis
showed that different dosages of PFEMF treatment may have caused
significant variations in the levels of several chemokines
including IP-10, GROα, RANTES, EOTAXIN-1, and MCP-1. Among them,
IP-10, GROα, and RANTES showed a response to only one of three
doses, whereas levels of EOTAXIN-1 and MCP-1 were significantly
increased by PFEMF exposure of 0.5 mT alone (Table II; Fig. 2A). Beyond the initial induction
response during the first 10 days of exposure, the medium and high
dose (0.5 and 2.5 mT) led to the upregulation of MCP-1 and this
trend was maintained for three months (Day 30 to Day 90) (Table II; Fig. 2B). For EOTAXIN-1, all of the three
tested doses caused a drastic induction of EOTAXIN-1 levels in the
serum at the beginning of treatment, whereas EOTAXIN-1 levels
returned to normal at day 10 for both the 0.1 and 2.5 mT
treatments. However, 0.5 mT exposure led to consistent upregulation
of EOTAXIN-1 following the initial induction response (Table II; Fig. 2C).
| Table II.Levels of chemokines in response to
PFEMF exposure were determined by the Luminex assay. |
Table II.
Levels of chemokines in response to
PFEMF exposure were determined by the Luminex assay.
|
|
|
|
|
|
|
|
| Variable
comparisons (P-values) |
|---|
|
|
|
|
|
|
|
|
|
|
|---|
| Chemokine | Dose (mT) | Day 0 | Day 1 | Day 10 | Day 30 | Day 90 | Dose | Time | Dose*Time |
|---|
| MCP-1 | 0 | 93.91±3.23 | 102.98±4.30 | 104.98±4.07 | 96.91±3.56 | 107.43±6.99 | – | – | – |
|
| 0.1 | 93.91±3.23 | 111.98±0.97 | 104.3±6.08 | 97.23±4.52 | 103.59±3.37 |
P=0.046a |
P<0.001b | P=0.510 |
|
| 0.5 | 93.91±3.23 | 111.29±5.60 | 111.64±1.74 | 111.47±2.07 | 129.02±11.14 |
|
|
|
|
| 2.5 | 93.91±3.23 | 119.2±7.88 | 100.55±12.65 | 103.8±3.31 | 111.51±3.43 |
|
|
|
| MCP-3 | 0 | 54.45±4.46 | 76.70±9.78 | 101.57±9.14 | 83.57±5.57 | 130.42±9.75 | – | – | – |
|
| 0.1 | 54.45±4.46 | 116.53±16.28 | 80.00±6.38 | 82.24±10.99 | 90.70±3.05 | P=0.108 |
P<0.001b |
P=0.001b |
|
| 0.5 | 54.45±4.46 | 117.32±14.17 | 85.28±5.85 | 88.59±8.37 | 165.26±31.98 |
|
|
|
|
| 2.5 | 54.45±4.46 | 102.51±13.84 | 105.16±14.55 | 105.30±10.57 | 68.19±8.43 |
|
|
|
| MIP-1α | 0 | 5.12±0.50 | 9.32±3.84 | 5.37±0.26 | 4.65±0.28 | 5.00±0.50 | – | – | – |
|
| 0.1 | 5.12±0.50 | 8.13±0.59 | 4.65±0.31 | 4.69±0.22 | 4.91±0.24 | P=0.919 |
P=0.017a | P=0.577 |
|
| 0.5 | 5.12±0.50 | 6.03±0.25 | 5.06±0.25 | 10.03±4.18 | 5.35±0.78 |
|
|
|
|
| 2.5 | 5.12±0.50 | 7.82±0.81 | 4.54±0.69 | 5.84±0.88 | 4.30±0.32 |
|
|
|
| MIP-1β | 0 | 9.26±0.99 | 10.32±1.16 | 9.66±0.45 | 6.57±0.48 | 8.15±0.74 | – | – | – |
|
| 0.1 | 9.26±0.99 | 12.74±0.92 | 7.98±0.79 | 7.54±0.36 | 7.40±0.32 | P=0.501 |
P<0.001b | P=0.294 |
|
| 0.5 | 9.26±0.99 | 10.96±0.59 | 9.01±0.49 | 9.49±0.16 | 9.00±1.01 |
|
|
|
|
| 2.5 | 9.26±0.99 | 10.27±0.40 | 7.82±0.73 | 8.12±0.45 | 7.84±0.36 |
|
|
|
| MIP-2 | 0 | 11.74±0.43 | 12.06±0.74 | 12.58±0.66 | 10.76±0.80 | 12.97±0.74 | – | – | – |
|
| 0.1 | 11.74±0.43 | 13.53±0.74 | 11.09±0.57 | 11.70±0.31 | 13.08±1.17 | P=0.702 |
P<0.001b | P=0.115 |
|
| 0.5 | 11.74±0.43 | 12.68±0.36 | 13.60±0.57 | 11.44±0.41 | 13.51±0.62 |
|
|
|
|
| 2.5 | 11.74±0.43 | 14.02±0.68 | 12.79±0.84 | 10.88±0.68 | 11.36±0.64 |
|
|
|
| EOTAXI-1 | 0 | 301.59±27.19 | 458.30±37.01 | 535.10±41.28 | 440.42±15.25 | 564.53±46.36 | – | – | – |
|
| 0.1 | 301.59±27.19 | 835.48±63.25 | 500.92±40.91 | 520.94±15.48 | 580.08±23.52 |
P<0.001b |
P<0.001b |
P<0.001b |
|
| 0.5 | 301.59±27.19 | 795.80±37.84 | 706.19±36.55 | 781.46±51.89 | 866.86±88.29 |
|
|
|
|
| 2.5 | 301.59±27.19 | 816.31±52.48 | 519.00±109.82 | 556.09±58.65 | 607.92±56.25 |
|
|
|
| IP-10 | 0 | 80.09±6.34 | 90.36±14.09 | 106.35±9.59 | 55.36±2.27 | 128.58±29.29 | – | – | – |
|
| 0.1 | 80.09±6.34 | 107.41±13.47 | 81.67±9.15 | 60.79±7.52 | 53.00±1.13 | P=0.734 | P=0.277 | P=0.232 |
|
| 0.5 | 80.09±6.34 | 92.66±4.41 | 72.81±3.88 | 67.44±8.46 | 125.02±65.92 |
|
|
|
|
| 2.5 | 80.09±6.34 | 107.26±1.98 | 96.44±17.87 | 95.49±33.54 | 54.84±8.92 |
|
|
|
| GRO-α | 0 | 29.37±3.56 | 24.95±5.66 | 33.52±5.50 | 15.08±2.67 | 25.10±6.71 | – | – | – |
|
| 0.1 | 29.37±3.56 | 25.78±7.17 | 21.55±3.12 | 19.52±2.76 | 23.84±9.06 | P=0.056 | P=0.229 | P=0.070 |
|
| 0.5 | 29.37±3.56 | 28.84±2.81 | 31.12±1.99 | 32.41±5.56 | 66.54±12.84 |
|
|
|
|
| 2.5 | 29.37±3.56 | 35.11±3.64 | 29.46±6.88 | 27.16±9.83 | 20.61±2.37 |
|
|
|
| RANTES | 0 | 26.59±1.52 | 27.75±3.23 | 27.23±1.14 | 26.43±1.64 | 37.01±11.16 | – | – | – |
|
| 0.1 | 26.59±1.52 | 35.44±2.64 | 23.80±1.11 | 21.79±0.93 | 22.36±0.43 | P=0.338 | P=0.159 | P=0.300 |
|
| 0.5 | 26.59±1.52 | 28.44±2.56 | 25.45±1.02 | 23.93±1.31 | 30.97±11.14 |
|
|
|
|
| 2.5 | 26.59±1.52 | 37.58±3.76 | 23.56±2.62 | 20.48±3.64 | 17.45±1.09 |
|
|
|
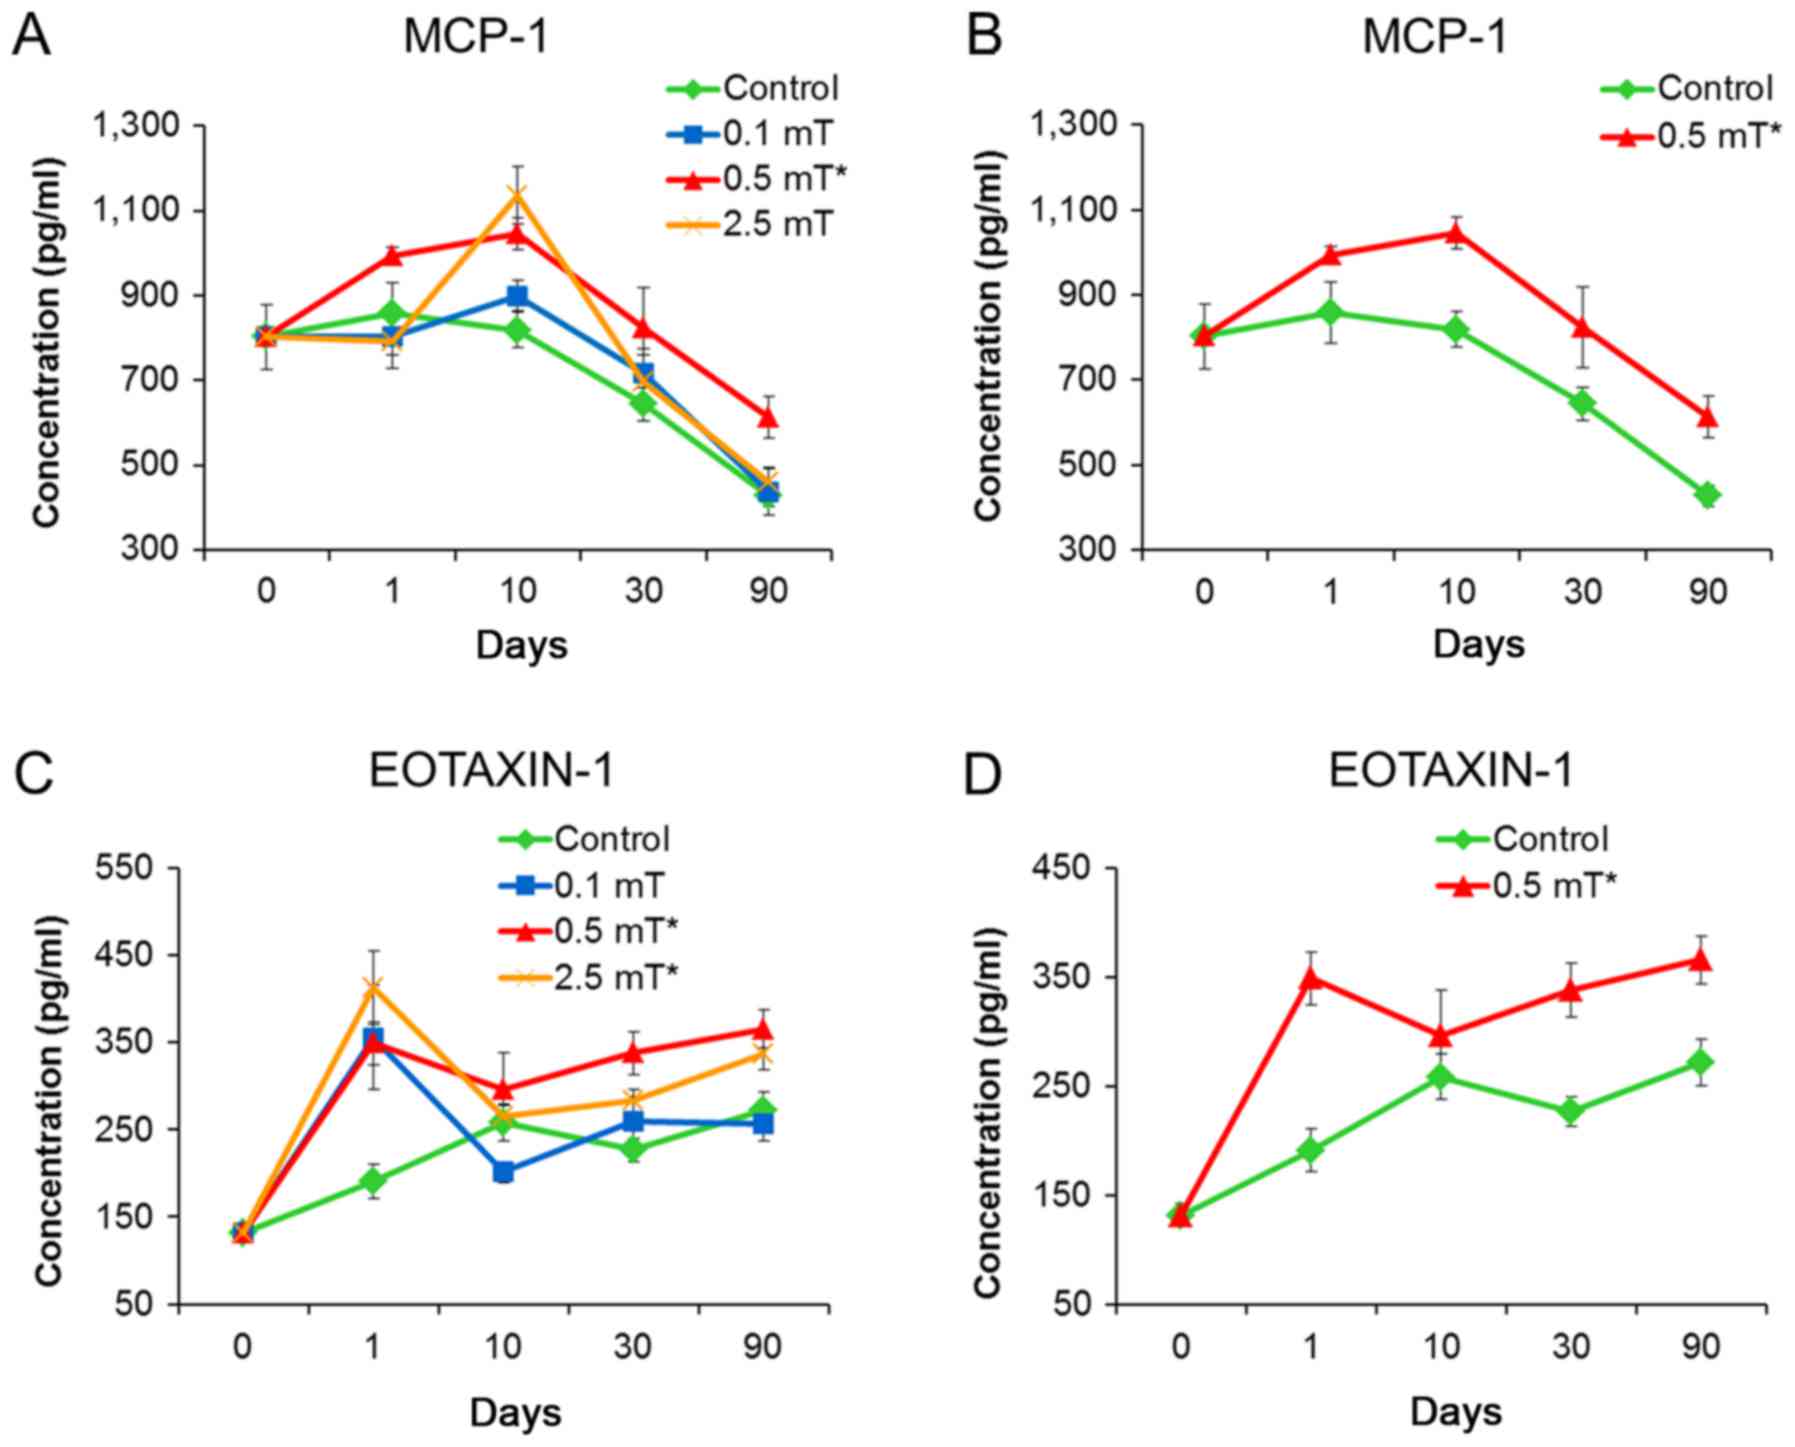
ELISA verification indicates that
MCP-1 and EXTAXIN-1 may be used as indicators of PFEMF
exposure
To confirm the results from the Luminex assay, we
subjected the same samples to ELISA detection. Treatments using the
three PFEMF doses (0.1, 0.5, and 2.5 mT) led to a significant
increase in the concentration of EOTAXIN-1. Generally, the serum
concentrations of MCP-1 and EOTAXIN-1 from animals treated with 0.5
mT showed the highest increase at all time points relative to the
control group. For the 2.5 mT treatment, only EOTAXIN-1 showed a
statistically significant difference compared with the control
group (Table III; Fig. 3). Notably, the variation curves of
EOTAXIN-1 concentration as detected by ELISA were approximately the
same as those determined using Luminex technology.
| Table III.Serum levels of Eotaxin-1 and MCP-1
in response to PFEMF exposure were determined by ELISA. |
Table III.
Serum levels of Eotaxin-1 and MCP-1
in response to PFEMF exposure were determined by ELISA.
|
|
|
|
|
|
|
| Variable comparison
(P-value) |
|---|
|
|
|
|
|
|
|
|
|
|---|
| Chemokine | Dose (mT) | Day 0 | Day 1 | Day 10 | Day 30 | Day 90 | Dose | Time | Dose *Time |
|---|
| MCP-1 | 0 | 801.91±76.76 | 857.85±121.86 | 818.89±109.78 | 643.38±39.74 | 427.40±24.61 | – | – | – |
|
| 0.1 |
| 802.37±73.86 | 899.27±35.51 | 715.48±58.79 | 436.86±55.14 |
P=0.009b |
P<0.001c | P=0.332 |
|
| 0.5 |
| 992.97±19.94 |
1,044.79±103.01 | 824.73±95.11 | 613.14±48.74 |
|
|
|
|
| 2.5 |
| 791.99±31.84 |
1,136.17±155.02 | 696.64±118.31 | 461.29±33.72 |
|
|
|
| EOTAXIN-1 | 0 | 131.39±10.38 | 190.76±19.67 | 258.10±20.82 | 226.52±13.65 | 271.67±21.75 | – | – | – |
|
| 0.1 |
| 355.55±59.87 | 201.31±12.35 | 260.01±27.04 | 257.04±20.73 |
P=0.001c |
P<0.001c |
P=0.014a |
|
| 0.5 |
| 348.72±24.51 | 295.96±41.65 | 337.90±24.35 | 365.52±21.95 |
|
|
|
|
| 2.5 |
| 412.75±42.38 | 264.84±13.42 | 283.29±12.38 | 336.10±17.53 |
|
|
|
Discussion
In this study, to investigate the circulating
chemokine indicators and eatablish a solid base for solving the
increasing public concern regarding the potential health risks from
PFEMF, mice were exposed to different doses (0, 0.1, 0.5, and 2.5
mT) of PFEMF for as long as 90 days. Among the 9 chemokines,
EOTAXIN-1 and MCP-1 were constantly induced by 0.5 mT of PFEMF
treatment and may serve as dose-specific PFEMF exposure
indicators.
Our previous study utilized computer-based
neurobehavioral evaluation methods to investigate the
neurobehavioral influences on employees working with electric power
systems and who thus were exposed to relatively strong PFEMFs
(24). This investigation
demonstrated that no significant variation could be found among
different age or seniority groups after short- or long-term
exposure in response to strong PFEMF (24). Considering the large differences
within many variables observed in that study, we simplified the
study in the present study by using a homogeneous mouse model to
examine the influences of the electromagnetic field generated by
PFEMF. Furthermore, to facilitate the reflection of normal human
life circumstances and occupational environments, we selected the
magnetic flux density of 0.1 mT to represent public exposure and
0.5 mT for occupational exposure, which are the levels adopted by
the Chinese National Standards for the electricity industry and are
also more stringent than those used in the current criteria of the
International Commission on Non-Ionizing Radiation Protection
(ICNIRP). In addition, the relatively higher dose of 2.5 mT was
also included to represent unusually strong PFEMF exposure. These
values allowed us to explore the variations in chemokine levels
associated with cancer or inflammation and to begin to elucidate
the indicators of exposure and associated disease to address
current concerns regarding the effects of PFEMF in surrounding
environments. In the present study, we did not observe any
measurable difference in body weight between the control and
treatment groups, which is in line with the findings of our
previous study (24) and indicates
that PFEMF is unlikely to cause apparent phenotypic differences in
the exposed population.
Chemokines are secreted by cells in response to
various types of in vivo and in vitro stimuli and
have been shown to play important roles in carcinogenesis (14,15,19,20,25,26).
Specifically, chronic inflammation, a well-known risk factor for
cancer, is tightly associated with the dysregulation of chemokines,
which can directly regulate tumor cell growth and migration. We
found that certain chemokines exhibited differential responses to
PFEMF exposure. Levels of some chemokines in the serum were not
significantly changed following 3-month exposure, such as MCP-3,
MIP-1α, MIP-1β, and MIP-2, whereas levels of others including
IP-10, GROα, RANTES, EOTAXIN-1, and MCP-1 demonstrated significant
changes upon treatment. Among them, we observed that IP-10, GROα,
and RANTES were responsive to only one of the three dosages,
whereas EOTAXIN-1 and MCP-1 were significantly increased by at
least two doses of PFEMF treatment. Furthermore, we determined that
MCP-1 was constantly induced following 0.5 mT exposure but not by
2.5 mT, although both doses also caused significant changes in
EOTAXIN-1 levels.
MCP-1 (CCL2) can regulate the migration and
infiltration of many leukocytes including T cells, natural killer
cells, and monocytes, and has been shown to be induced and involved
in various diseases, especially cancers (27,28).
MCP-1 is a mediator of acute and chronic inflammation and can be
secreted from the microenvironment to promote tumorigenesis and
cancer progression (29,30). MCP-1 has also been demonstrated to
be induced upon overnight exposure to 1 mT-50 Hz ELF-EMF treatment
in human peripheral adherent mononuclear cells (31). In contrast, results from other
studies using cultured cell lines including HaCaT, SH-SY5Y, THP-1,
and K562 cells suggested that the expression of MCP-1 was repressed
or unaffected after similar treatments, possibly as a result of
inhibition of the NF-κB pathway (32,33).
However, the anti-inflammatory potency of EMFs detected in cell
lines in vitro may not reflect the in vivo situation.
The induction of MCP-1 by PFEMF in an animal model as illustrated
by our work highlights the critical importance of using animal
models for health-related investigations in this area.
EOTAXIN-1 (CCL11) is one of the CC family chemokines
and is characterized by a pair of adjacent cysteine residues.
EOTAXIN-1 serves as a potent chemoattractant for eosinophils and
plays critical pro-inflammatory roles in phenomena such as
eosinophilia, which is a prominent feature of several allergic
conditions. EOTAXIN-1 promotes cell proliferation, invasion, and
angiogenesis in ovarian cancer, prostate cancer, and Hodgkin's
lymphoma, as demonstrated by the activation of the CCR3-ERK pathway
or the upregulation of MMP-3 expression or CCR3+
endothelial cells (24–36). In particular, as EOTAXIN-1 is
highly induced upon carcinogenesis, the serum levels of EOTAXIN-1
can be used as a biomarker for an enhanced risk of gastric cancer
and ovarian cancer and as a prognostic factor for the prediction of
relapse-free survival (34,37).
However, few reports to date have studied the relationship between
EOTAXIN and PFEMF (38). The
induction of EOTAXIN-1 by PFEMF in an animal model as shown by our
work therefore constitutes a novel finding that suggests a
pro-inflammatory effect of PFEMF exposure.
The non-dose-dependent responses of chemokine is out
of our expectation. This phenomenon may reflect the body has an
unknown mechanism to respond to different electromagnetic field
strength which is worth to further explore. We also noticed that
some of the cytokines are fluctuated during PFEMF treatment and do
not follow a linear augmenting pattern (Table II). To our knowledge and
understanding, our finding of MCP-1 and EOTAXIN-1 as stable
dose-specific indicators is valuable and lays a solid foundation
for establishing a systemic diagnostic procedure of PFEMF exposure.
The induction of the two circulating chemokines, EOTAXIN-1 and
MCP-1, upon PFEMF treatment strongly supports their potential
application as indicators for exposure to PFEMF, which may be
especially useful for convenient public health monitoring and thus
contribute to the final goal of establishing a healthy living
environment. Also, our study asked an open question, why MCP-1 and
EOTAXIN-1 is responsive to 0.5 mT ELF-EMF exposure, but not the
other doses? Any further mechanistic study for this question may
have profound impact in clinical diagnosis. We note, however, that
the exact concentrations of EOTAXIN-1 and MCP-1 as determined by
the Luminex and ELISA assays differed somewhat, which may be due to
the influences of differential sensitivity or detection limitations
of the two techniques. Further, owing to the limited energy
conveyed by power frequency, it is difficult to directly observe
the potential pro-oncogenic role of PFEMF exposure in normal mice.
Future studies using spontaneous tumor-forming animal models
generated by knocking out tumor suppressors such as p53 will likely
be required for validation of the potential pro-oncogenic role and
mechanism of PFEMFs.
In the present study, we identified differentially
responsive circulating chemokines following exposure to PFEMF using
a mouse model. The novel finding of the induction of EOTAXIN-1 and
MCP-1 during this process supports that these two chemokines could
be used as circulating indicators for PFEMF exposure and highlights
the potential pro-inflammatory nature of PFEMF, which deepens the
current understanding of the biological effects of PFEMF
exposure.
Acknowledgements
Not applicable.
Funding
The present study was financially supported by The
Science and Technology Program of China Southern Power Grid Company
(grant nos. K-GD2014-0618 and K-GD2011-415).
Availability of data and materials
The datasets used and/or analyzed during the present
study are available from the corresponding author on reasonable
request.
Authors' contributions
HL, LZ and ZD conceived and designed the
experiments. HL, LnL, LL, LZ, SH and YZ performed the experiments,
and HL, LZ and SH analyzed the data. HL, LnL, LZ and ZD wrote the
manuscript.
Ethics approval and consent to
participate
The present study was approved by the Institutional
Animal Care and Use Committee of Southern Medical University
(Guangdong, China; approval code, L2016103; 13th September
2016).
Patient consent for publication
Not applicable.
Competing interests
The authors declare that they have no competing
interests.
References
|
1
|
Kheifets LI, Afifi AA, Buffler PA and
Zhang ZW: Occupational electric and magnetic field exposure and
brain cancer: A meta-analysis. J Occup Environ Med. 37:1327–1341.
1995. View Article : Google Scholar : PubMed/NCBI
|
|
2
|
Ross CL and Harrison BS: An introduction
to electromagnetic field therapy and immune function: A brief
history and current status. J Sci Appl: BioMed. 3:18–29. 2015.
|
|
3
|
Singh S and Kapoor N: Health implications
of electromagnetic fields, mechanisms of action, and research
needs. Adv Biol 2014. Article ID 198609. 2014.http://dx.doi.org/10.1155/2014/198609
|
|
4
|
Wertheimer N and Leeper EM: Electrical
wiring configurations and childhood cancer. Am J Epidemiol.
109:273–284. 1979. View Article : Google Scholar : PubMed/NCBI
|
|
5
|
Ikeda K, Shinmura Y, Mizoe H, Yoshizawa H,
Yoshida A, Kanao S, Sumitani H, Hasebe S, Motomura T, Yamakawa T,
et al: No effects of extremely low frequency magnetic fields found
on cytotoxic activities and cytokine production of human peripheral
blood mononuclear cells in vitro. Bioelectromagnetics. 24:21–31.
2003. View Article : Google Scholar : PubMed/NCBI
|
|
6
|
Håkansson N, Gustavsson P, Sastre A and
Floderus B: Occupational exposure to extremely low frequency
magnetic fields and mortality from cardiovascular disease. Am J
Epidemiol. 158:534–542. 2003. View Article : Google Scholar : PubMed/NCBI
|
|
7
|
Röösli M, Egger M, Pfluger D and Minder C:
Cardiovascular mortality and exposure to extremely low frequency
magnetic fields: A cohort study of Swiss railway workers. Environ
Health. 7:352008. View Article : Google Scholar : PubMed/NCBI
|
|
8
|
Genuis SJ and Lipp CT: Electromagnetic
hypersensitivity: Fact or fiction? Sci Total Environ. 414:103–112.
2012. View Article : Google Scholar : PubMed/NCBI
|
|
9
|
Ahlbom A, Day N, Feychting M, Roman E,
Skinner J, Dockerty J, Linet M, McBride M, Michaelis J, Olsen JH,
et al: A pooled analysis of magnetic fields and childhood
leukaemia. Br J Cancer. 83:692–698. 2000. View Article : Google Scholar : PubMed/NCBI
|
|
10
|
Greenland S, Sheppard AR, Kaune WT, Poole
C and Kelsh MA: A pooled analysis of magnetic fields, wire codes,
and childhood leukemia. Childhood Leukemia-EMF Study Group.
Epidemiology. 11:624–634. 2000. View Article : Google Scholar : PubMed/NCBI
|
|
11
|
Kheifets L, Afifi AA and Shimkhada R:
Public health impact of extremely low-frequency electromagnetic
fields. Environ Health Perspect. 114:1532–1537. 2006. View Article : Google Scholar : PubMed/NCBI
|
|
12
|
Kheifets L, Ahlbom A, Crespi CM, Draper G,
Hagihara J, Lowenthal RM, Mezei G, Oksuzyan S, Schüz J, Swanson J,
et al: Pooled analysis of recent studies on magnetic fields and
childhood leukaemia. Br J Cancer. 103:1128–1135. 2010. View Article : Google Scholar : PubMed/NCBI
|
|
13
|
Hardell L and Sage C: Biological effects
from electromagnetic field exposure and public exposure standards.
Biomed Pharmacother. 62:104–109. 2008. View Article : Google Scholar : PubMed/NCBI
|
|
14
|
Balkwill F: Cancer and the chemokine
network. Nat Rev Cancer. 4:540–550. 2004. View Article : Google Scholar : PubMed/NCBI
|
|
15
|
Ishida T, Utsunomiya A, Iida S, Inagaki H,
Takatsuka Y, Kusumoto S, Takeuchi G, Shimizu S, Ito M, Komatsu H,
et al: Clinical significance of CCR4 expression in adult T-cell
leukemia/lymphoma: Its close association with skin involvement and
unfavorable outcome. Clin Cancer Res. 9:3625–3634. 2003.PubMed/NCBI
|
|
16
|
Itatani Y, Kawada K, Inamoto S, Yamamoto
T, Ogawa R, Taketo MM and Sakai Y: The role of chemokines in
promoting colorectal cancer invasion/metastasis. Int J Mol Sci.
17:6432016. View Article : Google Scholar :
|
|
17
|
Kitamura T, Qian BZ, Soong D, Cassetta L,
Noy R, Sugano G, Kato Y, Li J and Pollard JW: CCL2-induced
chemokine cascade promotes breast cancer metastasis by enhancing
retention of metastasis-associated macrophages. J Exp Med.
212:1043–1059. 2015. View Article : Google Scholar : PubMed/NCBI
|
|
18
|
Roy I, McAllister DM, Gorse E, Dixon K,
Piper CT, Zimmerman NP, Getschman AE, Tsai S, Engle DD, Evans DB,
et al: Pancreatic cancer cell migration and metastasis is regulated
by chemokine-biased agonism and bioenergetic signaling. Cancer Res.
75:3529–3542. 2015. View Article : Google Scholar : PubMed/NCBI
|
|
19
|
Struyf S, Schutyser E, Gouwy M, Gijsbers
K, Proost P, Benoit Y, Opdenakker G, Van Damme J and Laureys G:
PARC/CCL18 is a plasma CC chemokine with increased levels in
childhood acute lymphoblastic leukemia. Am J Pathol. 163:2065–2075.
2003. View Article : Google Scholar : PubMed/NCBI
|
|
20
|
Till KJ, Lin K, Zuzel M and Cawley JC: The
chemokine receptor CCR7 and alpha4 integrin are important for
migration of chronic lymphocytic leukemia cells into lymph nodes.
Blood. 99:2977–2984. 2002. View Article : Google Scholar : PubMed/NCBI
|
|
21
|
Schröttner P, Wollner S, Catusse J and
Burger M: Detection of elevated serum levels of the chemokine CCL18
in B-cell chronic lymphocytic leukaemia: Identification of a novel
biomarker. Acta Haematol. 124:110–114. 2010. View Article : Google Scholar : PubMed/NCBI
|
|
22
|
Lynch HE, Sanchez AM, D'Souza MP, Rountree
W, Denny TN, Kalos M and Sempowski GD: Development and
implementation of a proficiency testing program for Luminex
bead-based cytokine assays. J Immunol Methods. 409:62–71. 2014.
View Article : Google Scholar : PubMed/NCBI
|
|
23
|
Cardona AE, Sasse ME, Liu L, Cardona SM,
Mizutani M, Savarin C, Hu T and Ransohoff RM: Scavenging roles of
chemokine receptors: Chemokine receptor deficiency is associated
with increased levels of ligand in circulation and tissues. Blood.
112:256–263. 2008. View Article : Google Scholar : PubMed/NCBI
|
|
24
|
Li L, Xiong DF, Liu JW, Li ZX, Zeng GC and
Li HL: No effects of power line frequency extremely low frequency
electromagnetic field exposure on selected neurobehavior tests of
workers inspecting transformers and distribution line stations
versus controls. Australas Phys Eng Sci Med. 37:37–44. 2014.
View Article : Google Scholar : PubMed/NCBI
|
|
25
|
He S, He S, Chen CH, Deborde S, Bakst RL,
Chernichenko N, McNamara WF, Lee SY, Barajas F, Yu Z, et al: The
chemokine (CCL2-CCR2) signaling axis mediates perineural invasion.
Mol Cancer Res. 13:380–390. 2015. View Article : Google Scholar : PubMed/NCBI
|
|
26
|
Zsiros E, Duttagupta P, Dangaj D, Li H,
Frank R, Garrabrant T, Hagemann IS, Levine BL, June CH, Zhang L, et
al: The ovarian cancer chemokine landscape is conducive to homing
of vaccine-primed and CD3/CD28 costimulated T cells prepared for
adoptive therapy. Clin Cancer Res. 21:2840–2850. 2015. View Article : Google Scholar : PubMed/NCBI
|
|
27
|
Brown CE, Vishwanath RP, Aguilar B, Starr
R, Najbauer J, Aboody KS and Jensen MC: Tumor-derived chemokine
MCP-1/CCL2 is sufficient for mediating tumor tropism of adoptively
transferred T cells. J Immunol. 179:3332–3341. 2007. View Article : Google Scholar : PubMed/NCBI
|
|
28
|
Lu Y, Chen Q, Corey E, Xie W, Fan J,
Mizokami A and Zhang J: Activation of MCP-1/CCR2 axis promotes
prostate cancer growth in bone. Clin Exp Metastasis. 26:161–169.
2009. View Article : Google Scholar : PubMed/NCBI
|
|
29
|
Conti P and DiGioacchino M: MCP-1 and
RANTES are mediators of acute and chronic inflammation. Allerg
Asthm Proc. 22:133–137. 2001. View Article : Google Scholar
|
|
30
|
Fujimoto H, Sangai T, Ishii G, Ikehara A,
Nagashima T, Miyazaki M and Ochiai A: Stromal MCP-1 in mammary
tumors induces tumor-associated macrophage infiltration and
contributes to tumor progression. Int J Cancer. 125:1276–1284.
2009. View Article : Google Scholar : PubMed/NCBI
|
|
31
|
Reale M, De Lutiis MA, Patruno A, Speranza
L, Felaco M, Grilli A, Macrì MA, Comani S, Conti P and Di Luzio S:
Modulation of MCP-1 and iNOS by 50-Hz sinusoidal electromagnetic
field. Nitric Oxide. 15:50–57. 2006. View Article : Google Scholar : PubMed/NCBI
|
|
32
|
D'Angelo C, Costantini E, Kamal MA and
Reale M: Experimental model for ELF-EMF exposure: Concern for human
health. Saudi J Biol Sci. 22:75–84. 2015. View Article : Google Scholar : PubMed/NCBI
|
|
33
|
Vianale G, Reale M, Amerio P, Stefanachi
M, Di Luzio S and Muraro R: Extremely low frequency electromagnetic
field enhances human keratinocyte cell growth and decreases
proinflammatory chemokine production. Br J Dermatol. 158:1189–1196.
2008. View Article : Google Scholar : PubMed/NCBI
|
|
34
|
Levina V, Nolen BM, Marrangoni AM, Cheng
P, Marks JR, Szczepanski MJ, Szajnik ME, Gorelik E and Lokshin AE:
Role of eotaxin-1 signaling in ovarian cancer. Clin Cancer Res.
15:2647–2656. 2009. View Article : Google Scholar : PubMed/NCBI
|
|
35
|
Salcedo R, Young HA, Ponce ML, Ward JM,
Kleinman HK, Murphy WJ and Oppenheim JJ: Eotaxin (CCL11) induces in
vivo angiogenic responses by human CCR3+ endothelial cells. J
Immunol. 166:7571–7578. 2001. View Article : Google Scholar : PubMed/NCBI
|
|
36
|
Zhu F, Liu P, Li J and Zhang Y: Eotaxin-1
promotes prostate cancer cell invasion via activation of the
CCR3-ERK pathway and upregulation of MMP-3 expression. Oncol Rep.
31:2049–2054. 2014. View Article : Google Scholar : PubMed/NCBI
|
|
37
|
Koç Ü, Çetinkaya E, Bostanci EB, Kemık AS,
Tez M, Gömceli İ and Akoğlu M: Diagnostic significance of serum
eotaxin-1 level in gastric cancer patients. Dis Markers.
35:363–367. 2013. View Article : Google Scholar : PubMed/NCBI
|
|
38
|
Nguyen AH, Lee J, Il Choi H, Kwak Seok H
and Sim Jun S: Fabrication of plasmon length-based surface enhanced
Raman scattering for multiplex detection on microfluidic device.
Biosens Bioelectron. 70:358–365. 2015. View Article : Google Scholar : PubMed/NCBI
|