Introduction
Crohn's disease (CD) is a type of inflammatory bowel
disease (IBD) that can affect any part of the gastrointestinal
tract (1). This disease is caused
by immune, bacterial and environmental factors in individuals with
genetic susceptibility (2–4). Patients with CD usually suffer from
weight loss, abdominal pain, fever and diarrhea (5); other complications associated with CD
include arthritis, anemia, inflammation of the eye, fatigue and
skin problems (6). CD is a common
disease in the developed world, with increasing incidence and
prevalence in developing countries (7,8). At
present, there are no medical treatments or operative interventions
that can fully cure CD, and in some cases surgery may even result
in recurrence of the disease (9).
Therefore, the underlying mechanisms of CD need to be explored in
order to develop novel treatment strategies.
So far, some progress has been made with
understanding the pathogenesis of CD. For example, it was
demonstrated that mutation of the autophagy-related 16-like 1 gene
is associated with CD, and may possibly support the role of
autophagy in the development and progression of IBD (10). T helper (Th) 17 cells are a unique
Th cell lineage that serve an important role in inflammatory
diseases by secreting proinflammatory cytokines, including
interleukin 17 (IL-17) and IL-23, and may mediate the Th1/Th17
imbalance seen in CD and ulcerative colitis (11,12).
A previous study reported that signal transducer and activator of
transcription 3 (STAT3) and Janus kinase 2 (JAK2),
which are involved in the STAT-JAK pathway, can increase the risk
of CD (13). Nucleotide-binding
oligomerization domain-containing 2 (NOD2) is expressed
throughout the small intestine, with highest expression in the
terminal ileum where there is an abundance of Paneth cells, and is
also closely associated with pathogenesis of CD (14,15).
Despite these profound findings, pathogenesis of CD has not been
fully elucidated.
Bioinformatics analysis is a useful tool for
exploring disease pathogenesis and screening novel therapeutic
targets (16). Kenny et al
performed a genome-wide association study in an Ashkenazi Jewish
population with CD and revealed that 16 replicated and novel loci
made up 11.2% of the total genetic variations associated with CD
risk (17). Fransen et al
employed expression quantitative trait loci to select single
nucleotide polymorphisms (SNPs) for follow-up and identified two
CD-associated SNPs in the ubiquitin-conjugating enzyme E2L 3 and
B-cell chronic lymphocytic leukemia/lymphoma 3 genes (18). These findings provide some
information on the etiology of CD; however, to the best of our
knowledge the mechanisms of CD pathogenesis have not yet been
investigated by comprehensive bioinformatics analysis.
In the present study, comprehensive bioinformatics
analysis was carried out to understand the pathogenesis of CD and
identify novel therapeutic targets. The gene expression profiles of
patients with CD were downloaded from a public database, and
subsequently a series of bioinformatics analyses were performed,
including weighted gene co-expression network analysis (WGCNA),
meta-analysis, protein-protein interaction (PPI) network analysis
and enrichment analysis for key genes associated with CD. This
study contributes towards the further understanding of the
mechanisms underlying human CD.
Materials and methods
Data source
The key words ‘Crohn's disease’ and ‘Homo
sapiens’ were used to search relevant gene expression profile
data on the Gene Expression Omnibus (GEO) database (http://www.ncbi.nlm.nih.gov/geo/). The inclusion
criteria were as follows: i) Gene expression profiles; ii)
intestinal tissues from patients with CD (not cells); iii)
availability of both CD and normal samples; iv) human samples and
v) number of total samples ≥18. Based on these criteria, two
microarray datasets were selected: GSE36807 (Platform GPL570; 13 CD
and 7 normal samples) (19) and
GSE59071 (Platform GPL6244; 8 CD and 11 normal samples) (20).
Data pre-processing
The raw data (CEL files) were downloaded from GEO.
Subsequently, the oligo package version 1.41.1 from R (http://www.bioconductor.org/packages/release/bioc/html/oligo.html)
(21) was utilized to perform
pre-treatments, including conversion of data format, summarization
using median-polish, background correction using the MAS method and
data normalization by quantile method.
WGCNA analysis
WGCNA is a popular systems biology tool used to
construct gene co-expression networks, which can be used to detect
disease-associated gene clusters and identify therapeutic targets
(22). GSE36807 and GSE59071 were
used as the training and validation sets, respectively. Stable gene
modules associated with CD were screened using the R WGCNA package
version 1.61 (https://cran.r-project.org/web/packages/WGCNA/index.html)
(22), with the following
parameters; cutHeight=0.95 and ≥30 genes/module; the correlation
coefficients (CC) were also calculated.
Meta-analysis
Using the MetaDE.ES function in the R MetaDE package
(https://cran.r-project.org/src/contrib/Archive/MetaDE/)
(23), differentially expressed
genes (DEGs) between CD and normal samples that were common to the
two datasets were identified. To ensure homogeneity of genes,
tau2=0, Qpval >0.05 and false discovery rate <0.05
were used as the cut-off criteria.
Construction of the PPI network
Genes in the stable modules and DEGs were compared,
and overlapping genes were used as candidate genes for construction
of the PPI network. An integrated PPI network was generated from
the candidate genes by merging numerous PPI databases, including
BioGRID version 3.4.153 (http://thebiogrid.org/) (24), Human Protein Reference Database
release 9 (http://www.hprd.org/) (25) and STRING version 10.5 (https://string-db.org/) (26). The PPI network was visualized using
the Cytoscape software version 3.3.0 (http://www.cytoscape.org/) (27).
Functional and pathway enrichment
analyses
The Database for Annotation, Visualization and
Integrated Discovery (DAVID) version 6.8 (https://david.ncifcrf.gov/) is an easy-to-use web tool
in which genes are annotated and summarized according to shared
categorical data (28). Based on
DAVID analysis, Gene Ontology (GO) (29) functional enrichment analysis and
Kyoto Encyclopedia of Genes and Genomes (KEGG) (30) pathway enrichment analysis were
conducted for the nodes (a node represents a gene) identified in
the PPI network, with the criterion of P<0.05.
Results
WGCNA analysis
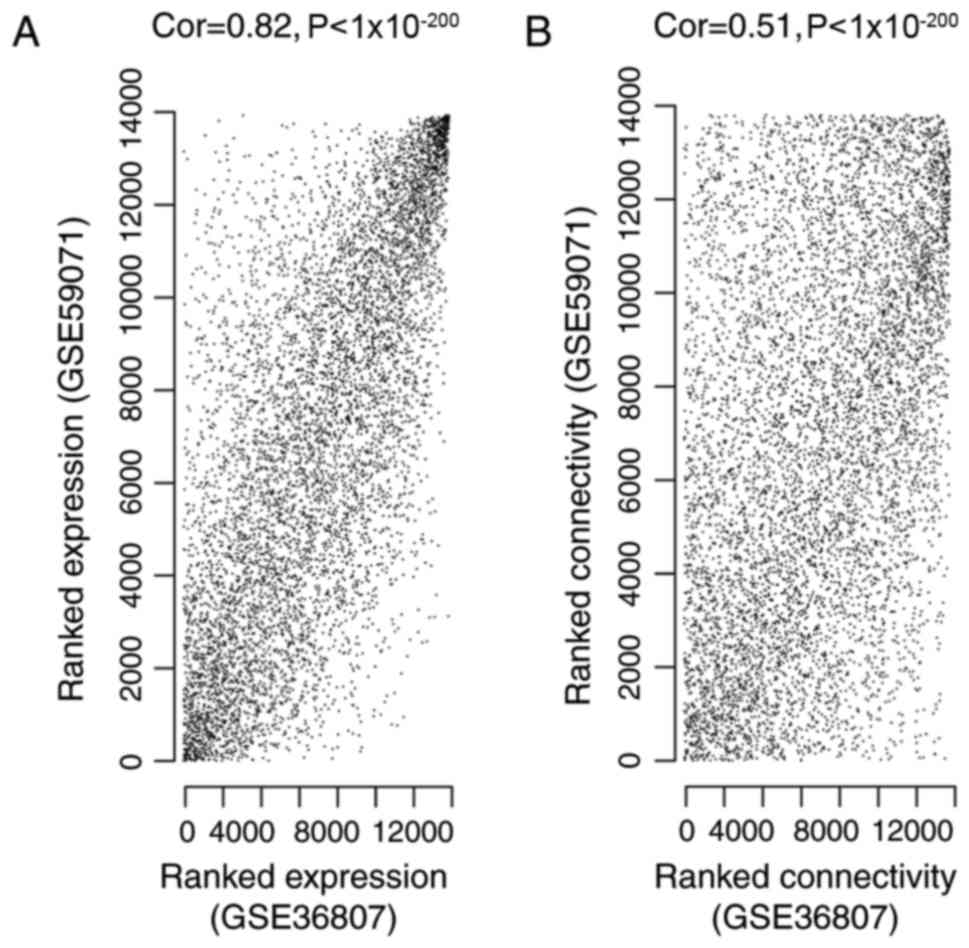
To ensure the GSE36807 and GSE59071 datasets were
comparable, correlation of gene expression and connectivity of
common genes was analyzed. The results revealed that the CC for
gene expression and connectivity between the two datasets were 0.82
(P<1×10−200; Fig.
1A) and 0.51 (P<1×10−200; Fig. 1B), respectively. Therefore, it was
deduced that the GSE36807 and GSE59071 datasets were
comparable.
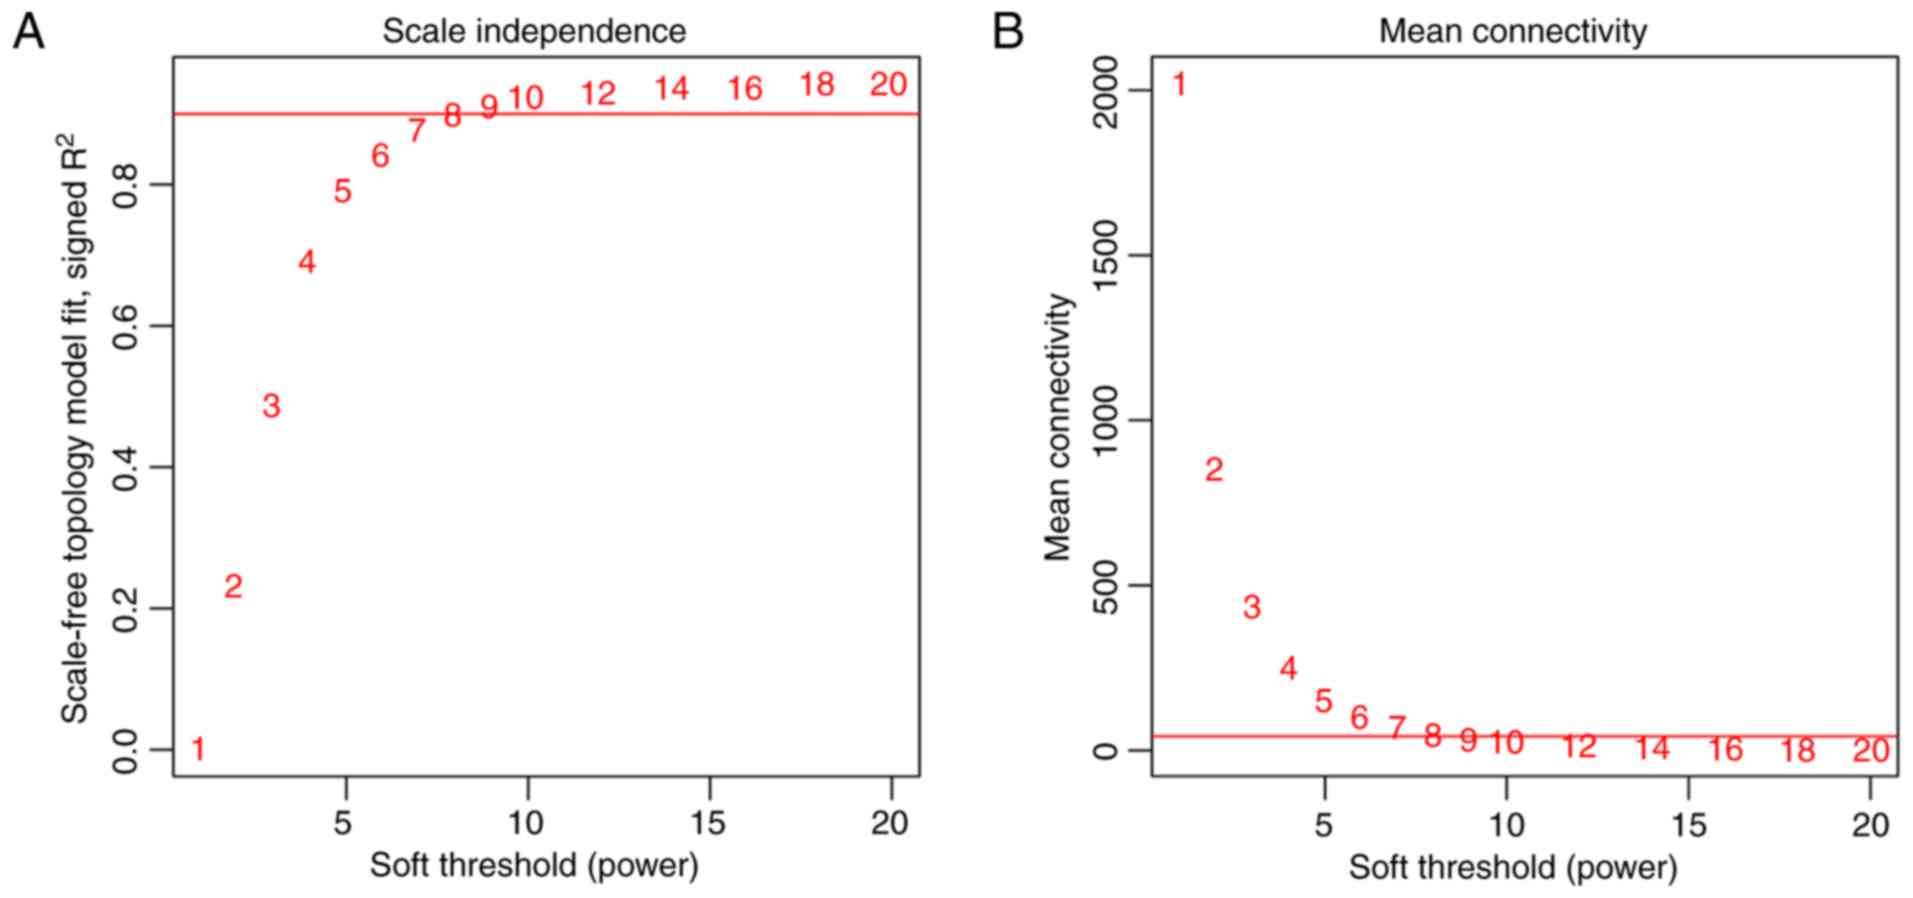
To meet the prerequisite of scale-free network
distribution, the value of the adjacency matrix weighting parameter
‘power’ was explored. After setting the ranges of parameters for
the network, the scale-free topology matrix was calculated. Using
GSE36807 as the essential data, the scale-free topology model fit
was calculated and statistics were selected for graphing (Fig. 2A). The greater the value of
CC2, the closer the network was to scale-free
distribution. Based on this theory, the mean connectivity of genes
was calculated using power=8 as this was the minimum power value to
achieve R2=0.9. The results demonstrated that the mean
connectivity was 16, which conforms to the node connection
properties of a scale-free network (Fig. 2B).
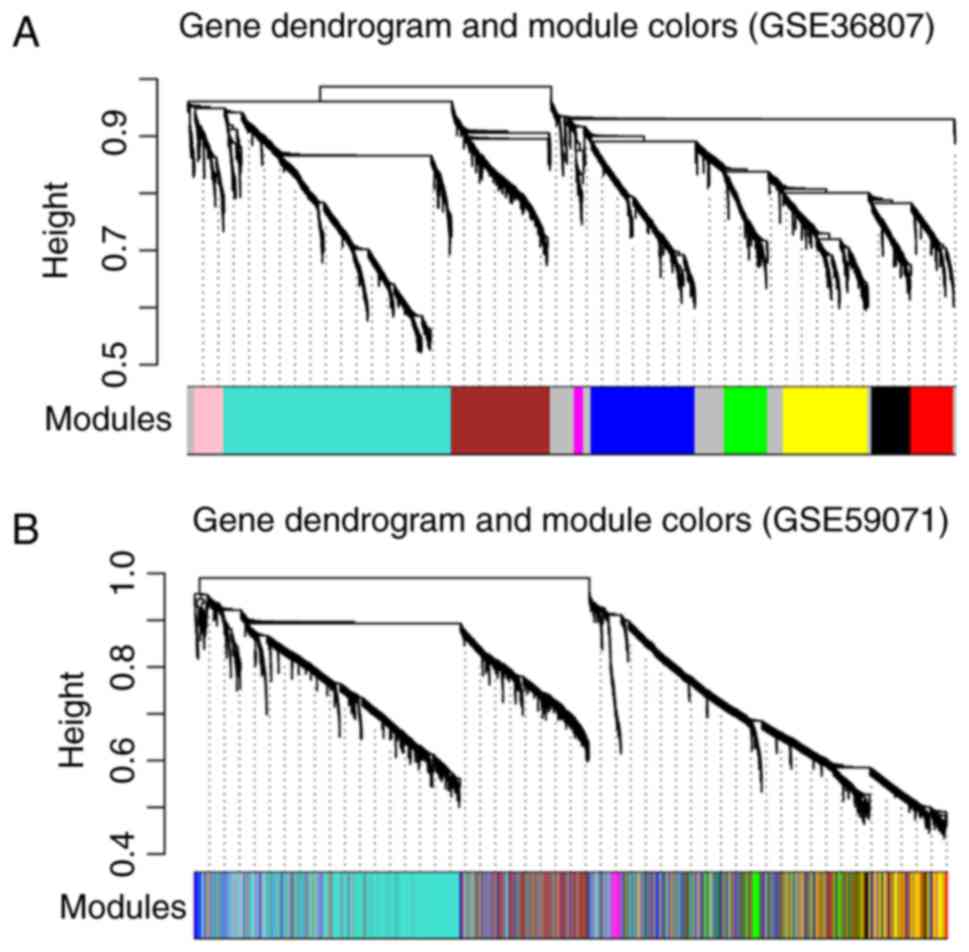
Using GSE36807 as the training set,
disease-associated modules were screened. Variation in gene
expression in the samples was calculated, and the genes with
variation coefficients >0.1 were selected. Subsequently, the
community dissimilarities among the genes were calculated, and a
clustering tree was obtained. A total of 10 modules (D1M1, D1M2,
D1M3, D1M4, D1M5, D1M6, D1M7, D1M8, D1M9 and D1M10) were identified
using cutHeight=0.95 (Fig. 3A).
Similarly, module division was performed for GSE59071 (Fig. 3B) and the modules in this dataset
were used to evaluate the stability of those identified in the
training set.
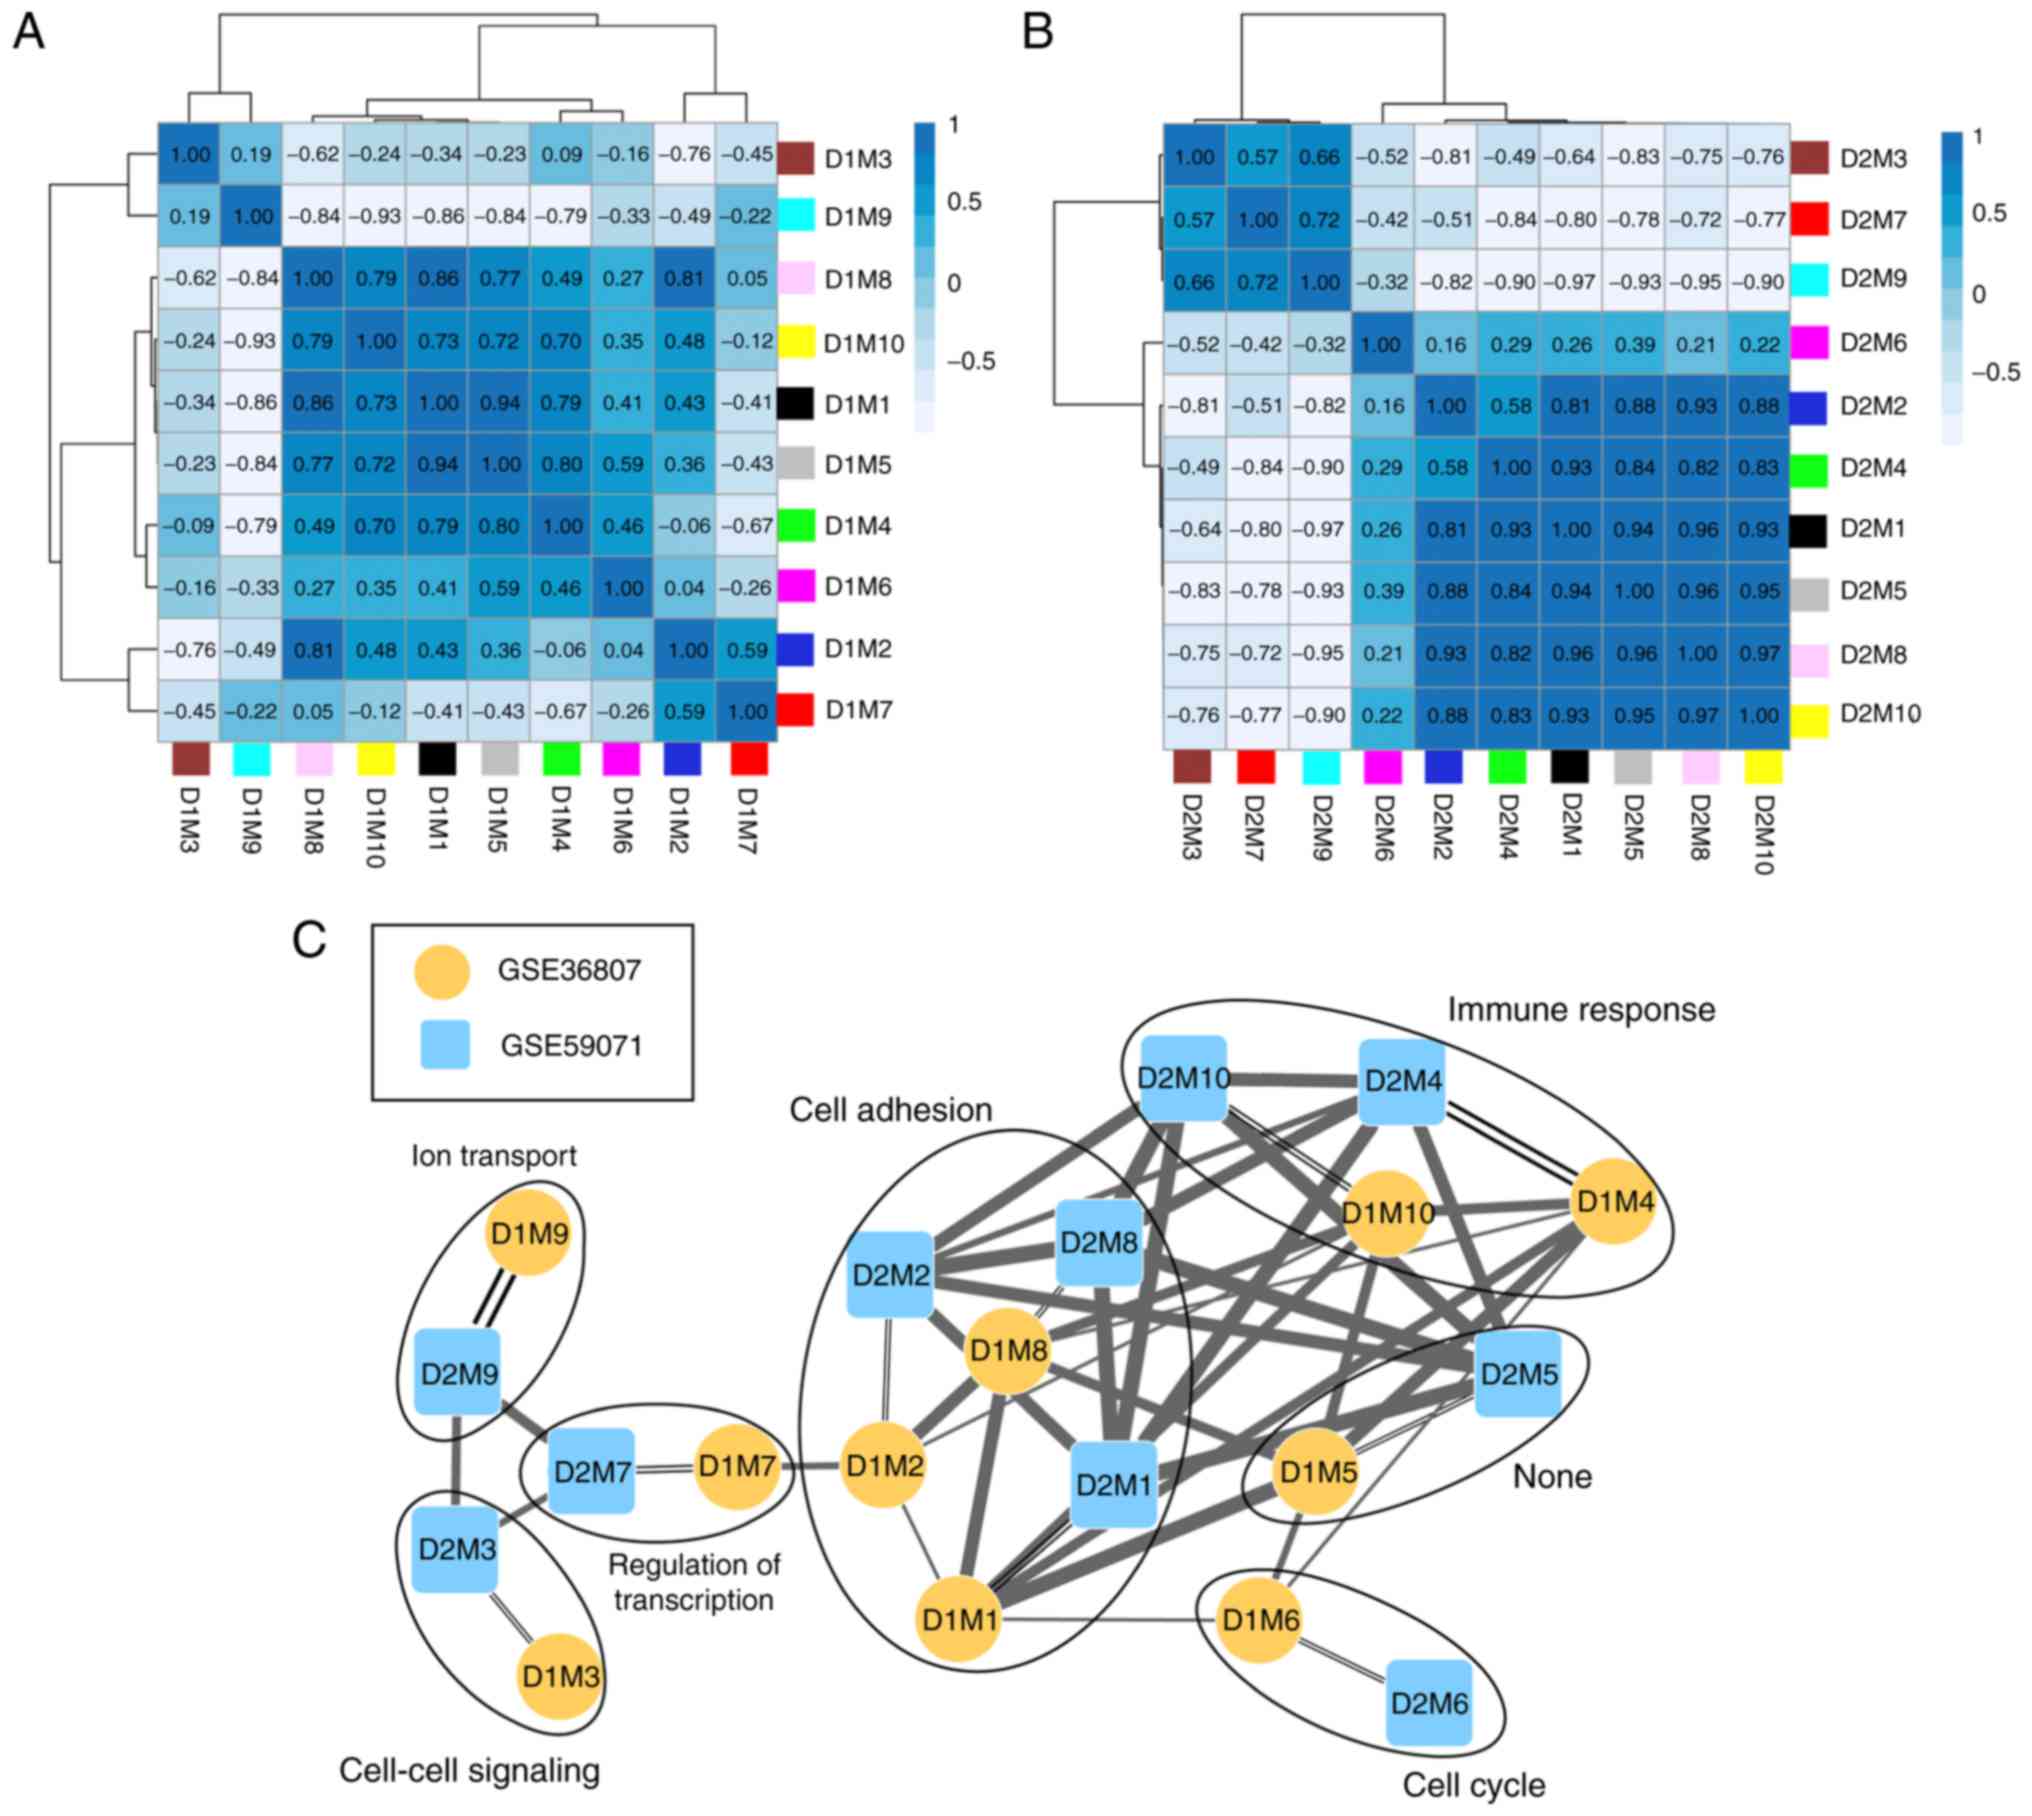
The correlation of gene expression was analyzed for
the same color modules in the two datasets, and the results
demonstrated that 10 modules were stable (Table I; preservation Z-score >5;
P≤0.05). According to the expression similarities of the module
genes, the correlation of the modules in GSE36807 (Fig. 4A) and GSE59071 (Fig. 4B) were analyzed (Table I). By combining the correlations
among the modules with the GO categories for genes in the stable
modules (Table I), a network for
the modules was constructed (Fig.
4C). This revealed that genes in three stable modules (M1, M2
and M8) were significantly associated with cell adhesion and genes
in two stable modules (M4 and M10) were significantly associated
with immune response.
 | Table I.Correlation of gene expression for
the same color modules in GSE36807 and GSE59071. |
Table I.
Correlation of gene expression for
the same color modules in GSE36807 and GSE59071.
| Modules |
|
| Module
preservation |
|
|---|
|
|
|
|
|
|---|
| GSE36807 | GSE59071 | Color | Size | Correlation | P-value | Z-score | Module
characterization |
|---|
| D1M1 | D2M1 | Black | 163 | 0.40 |
1.2×10⁻⁷ | 20.34 | Cell adhesion |
| D1M2 | D2M2 | Blue | 431 | 0.37 |
2.0×10⁻¹⁵ | 10.05 | Cell adhesion |
| D1M3 | D2M3 | Brown | 412 | 0.30 |
5.1×10⁻¹⁰ | 15.88 | Cell-cell
signaling |
| D1M4 | D2M4 | Green | 180 | 0.50 |
8.9×10⁻¹³ | 16.73 | Immune
response |
| D1M5 | D2M5 | Grey | 368 | 0.35 |
4.8×10⁻¹² | 4.12 | – |
| D1M6 | D2M6 | Magenta | 38 | 0.32 |
5.0×10⁻² | 11.74 | Cell cycle |
| D1M7 | D2M7 | Pink | 123 | 0.41 |
2.5×10⁻⁶ | 5.53 | Regulation of
transcription |
| D1M8 | D2M8 | Red | 177 | 0.35 |
1.8×10⁻⁶ | 21.44 | Cell adhesion |
| D1M9 | D2M9 | Turquoise | 944 | 0.68 |
4.2×10−129 | 17.93 | Ion transport |
| D1M10 | D2M10 | Yellow | 352 | 0.42 |
1.8×10⁻¹⁶ | 29.51 | Immune
response |
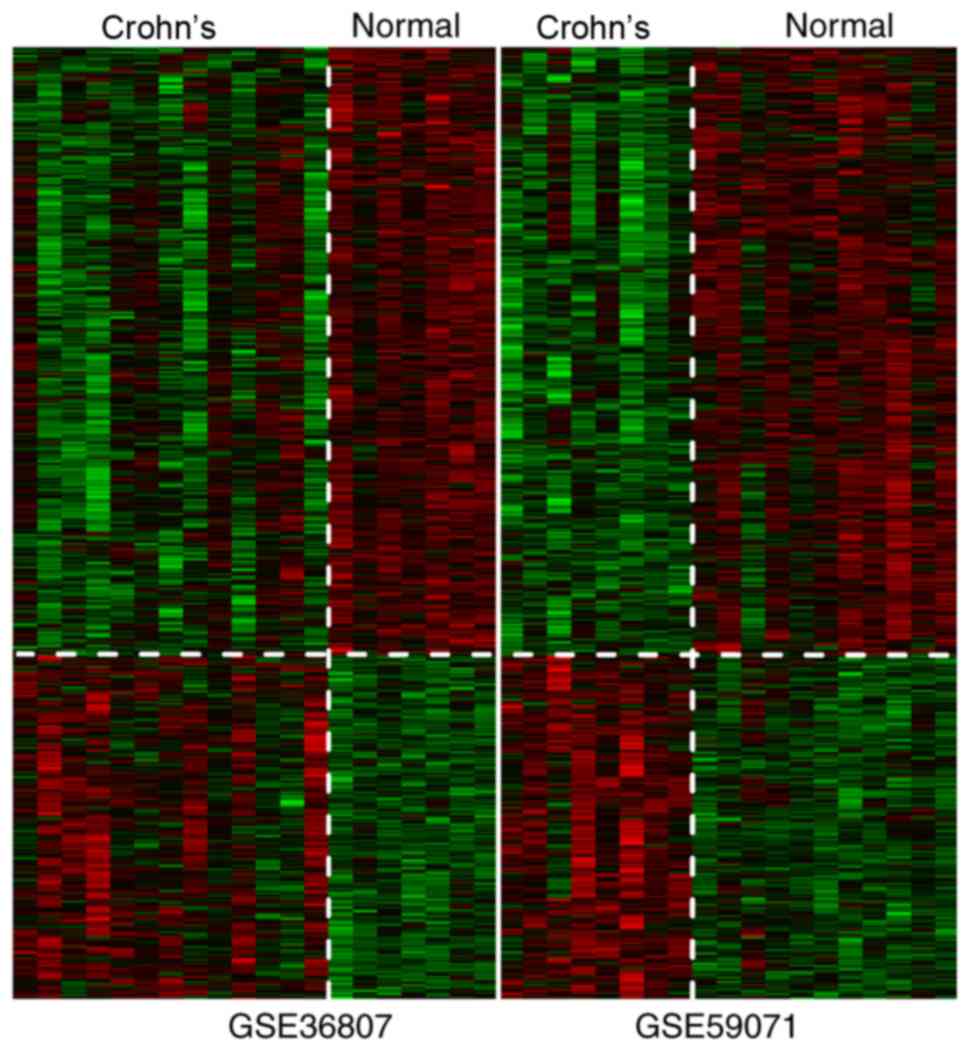
Meta-analysis
After calculation of the parameter values of each
gene, a total of 927 DEGs were screened according to the
aforementioned thresholds. The heatmap revealed that changes in
expression of the DEGs were similar for GSE36807 and GSE59071
(Fig. 5).
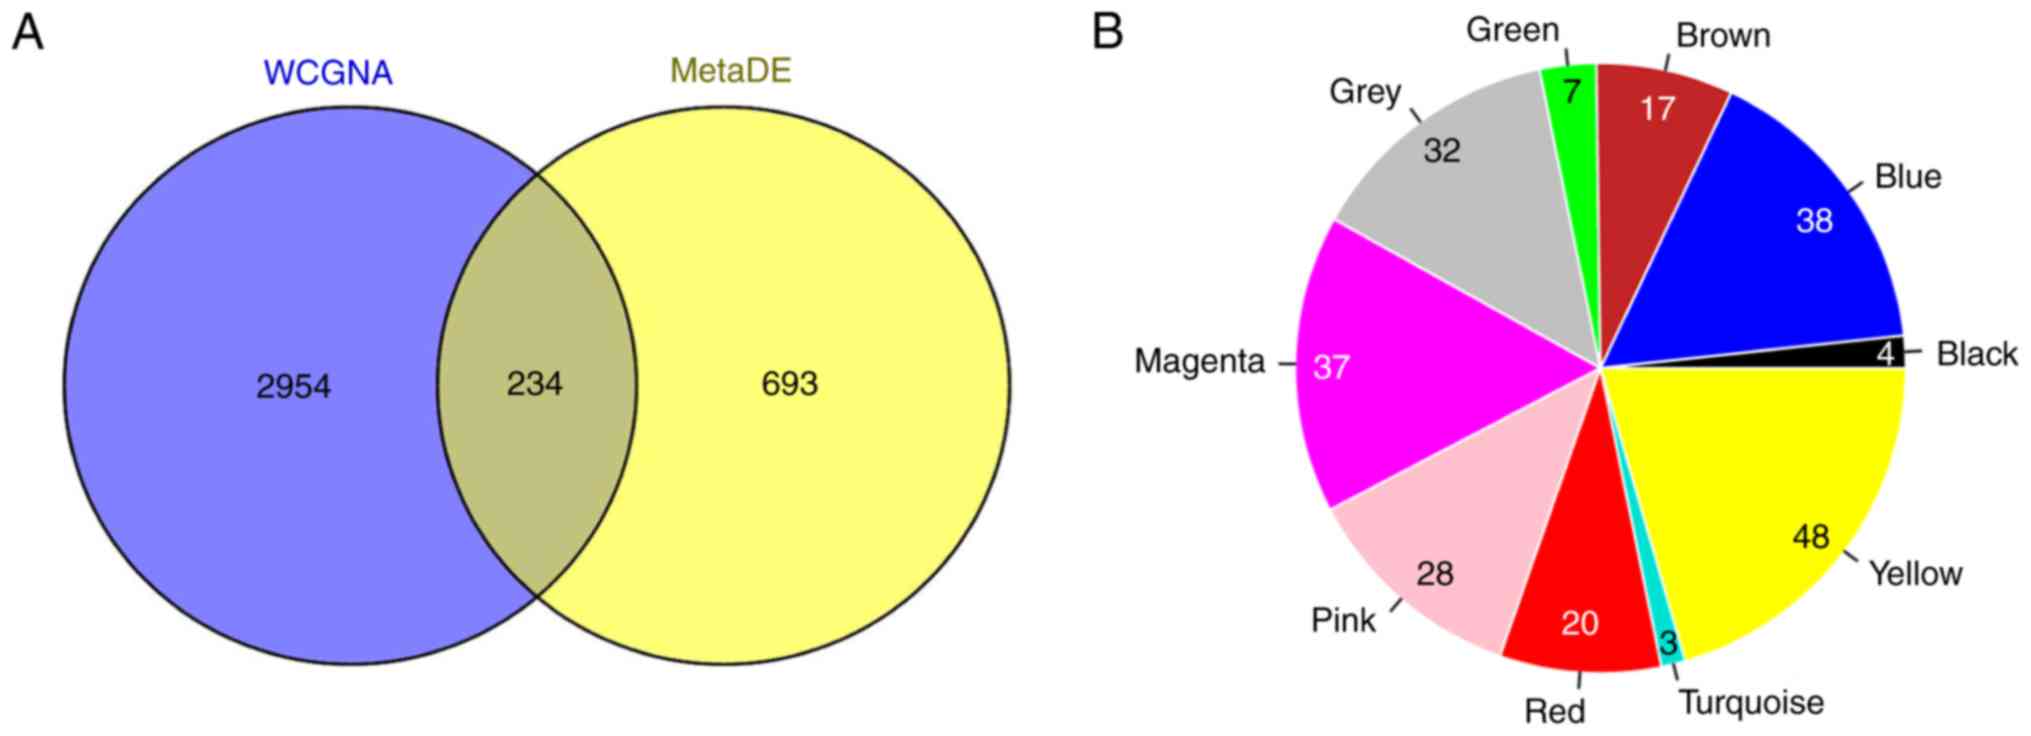
Construction of the PPI network
A total of 234 overlapping genes from genes in the
stable modules (3,188 genes) and the 927 DEGs were identified and
used as candidate genes (Fig. 6A).
The number and proportion of these genes in different modules are
shown in Fig. 6B. A total of 32
uncharacterized genes in the grey module were removed from
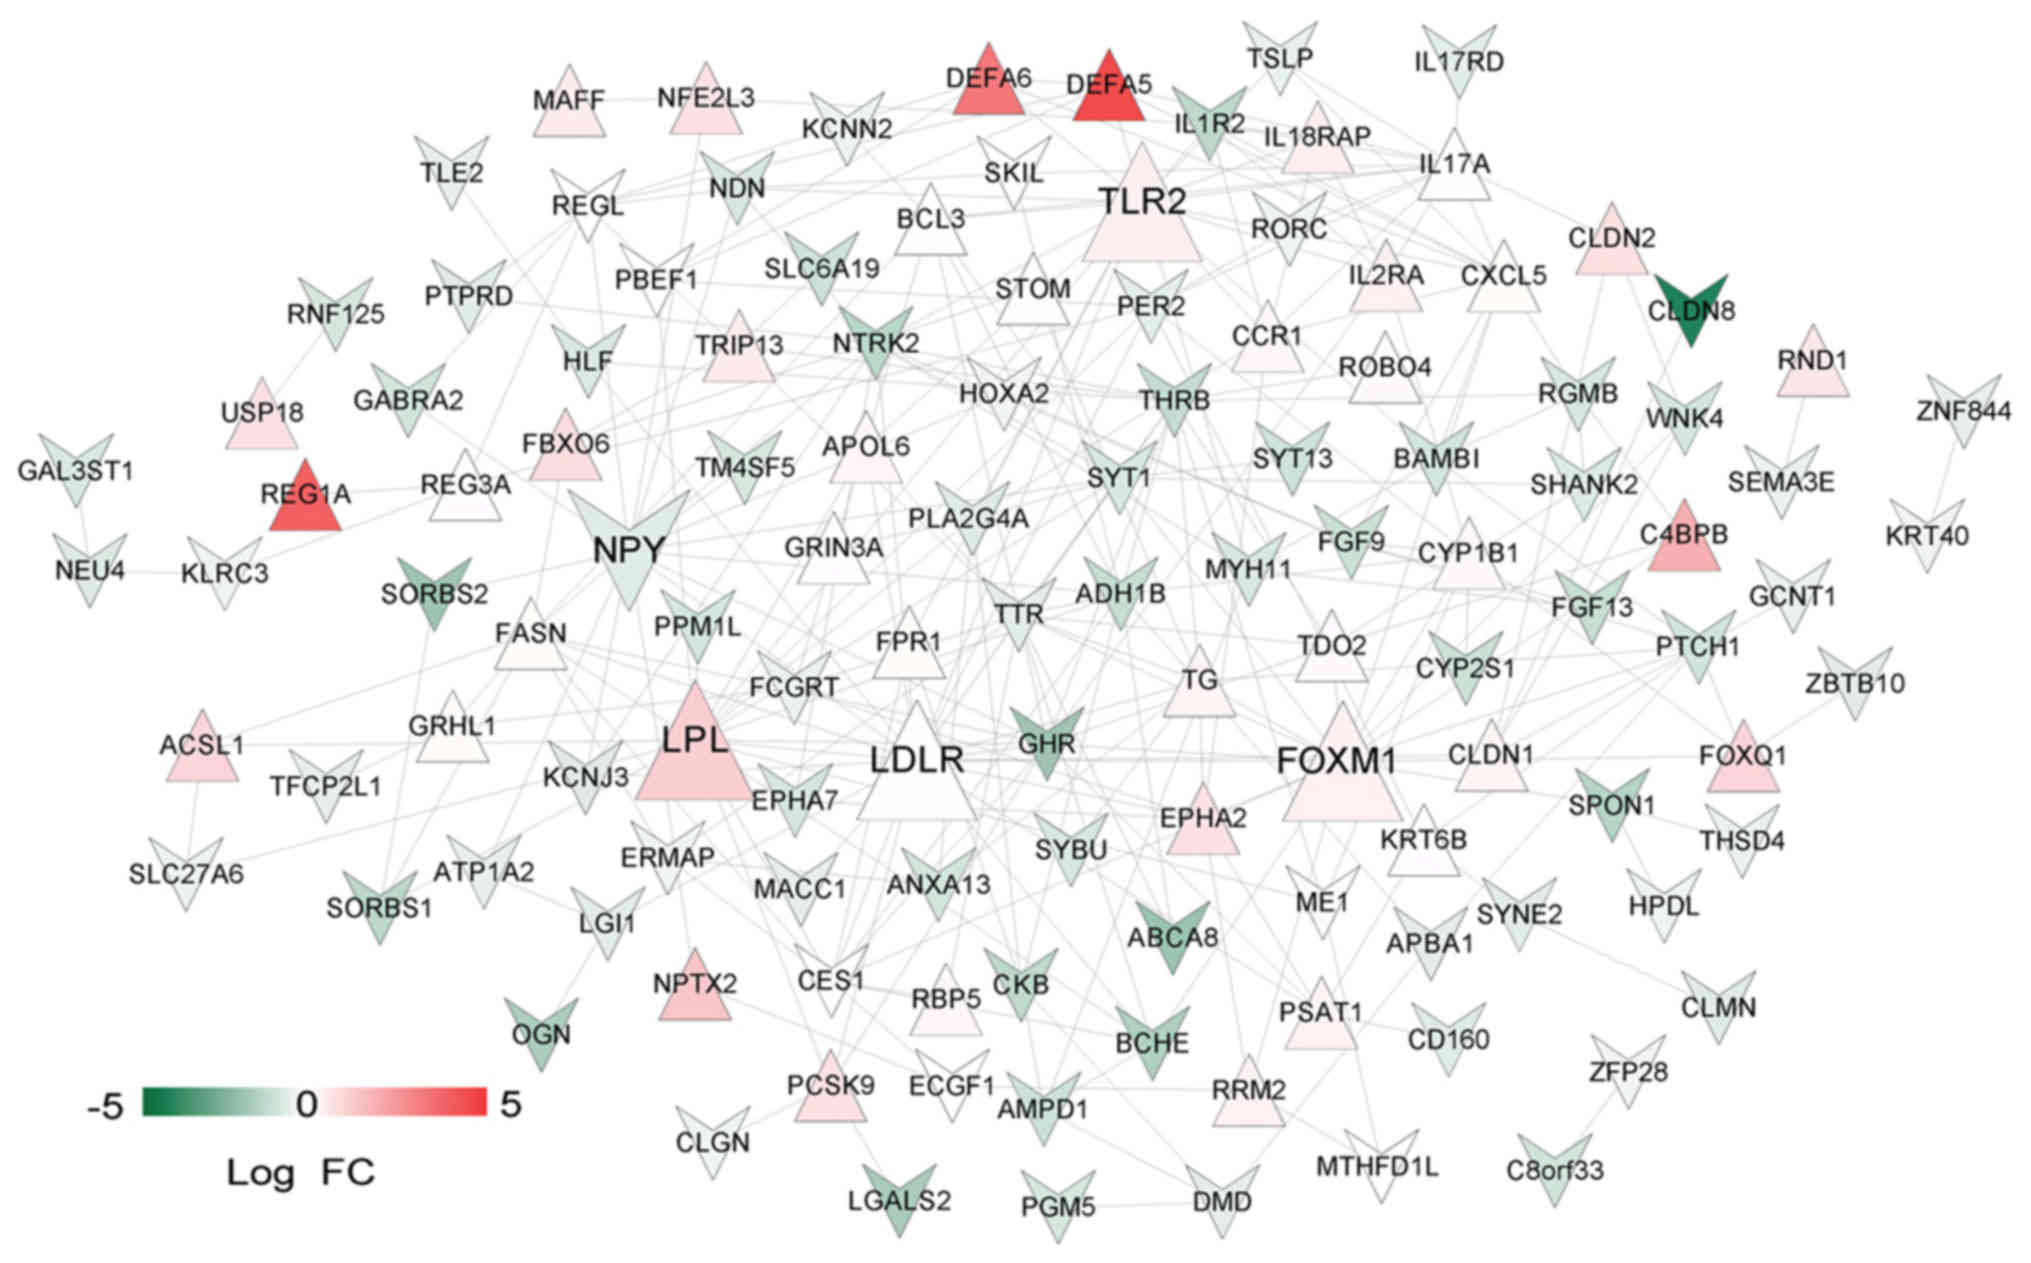
subsequent analyses. PPIs were predicted for the remaining 202
genes and a PPI network (123 nodes and 270 edges) was constructed
(Fig. 7). Notably, low density
lipoprotein receptor (LDLR; node degree=22), toll-like receptor 2
(TLR2; node degree=19), lipoprotein lipase (LPL; node degree=18),
forkhead box M1 (FOXM1; node degree=17) and neuropeptide Y (NPY;
node degree=16) were the top five nodes with high degrees in the
PPI network.
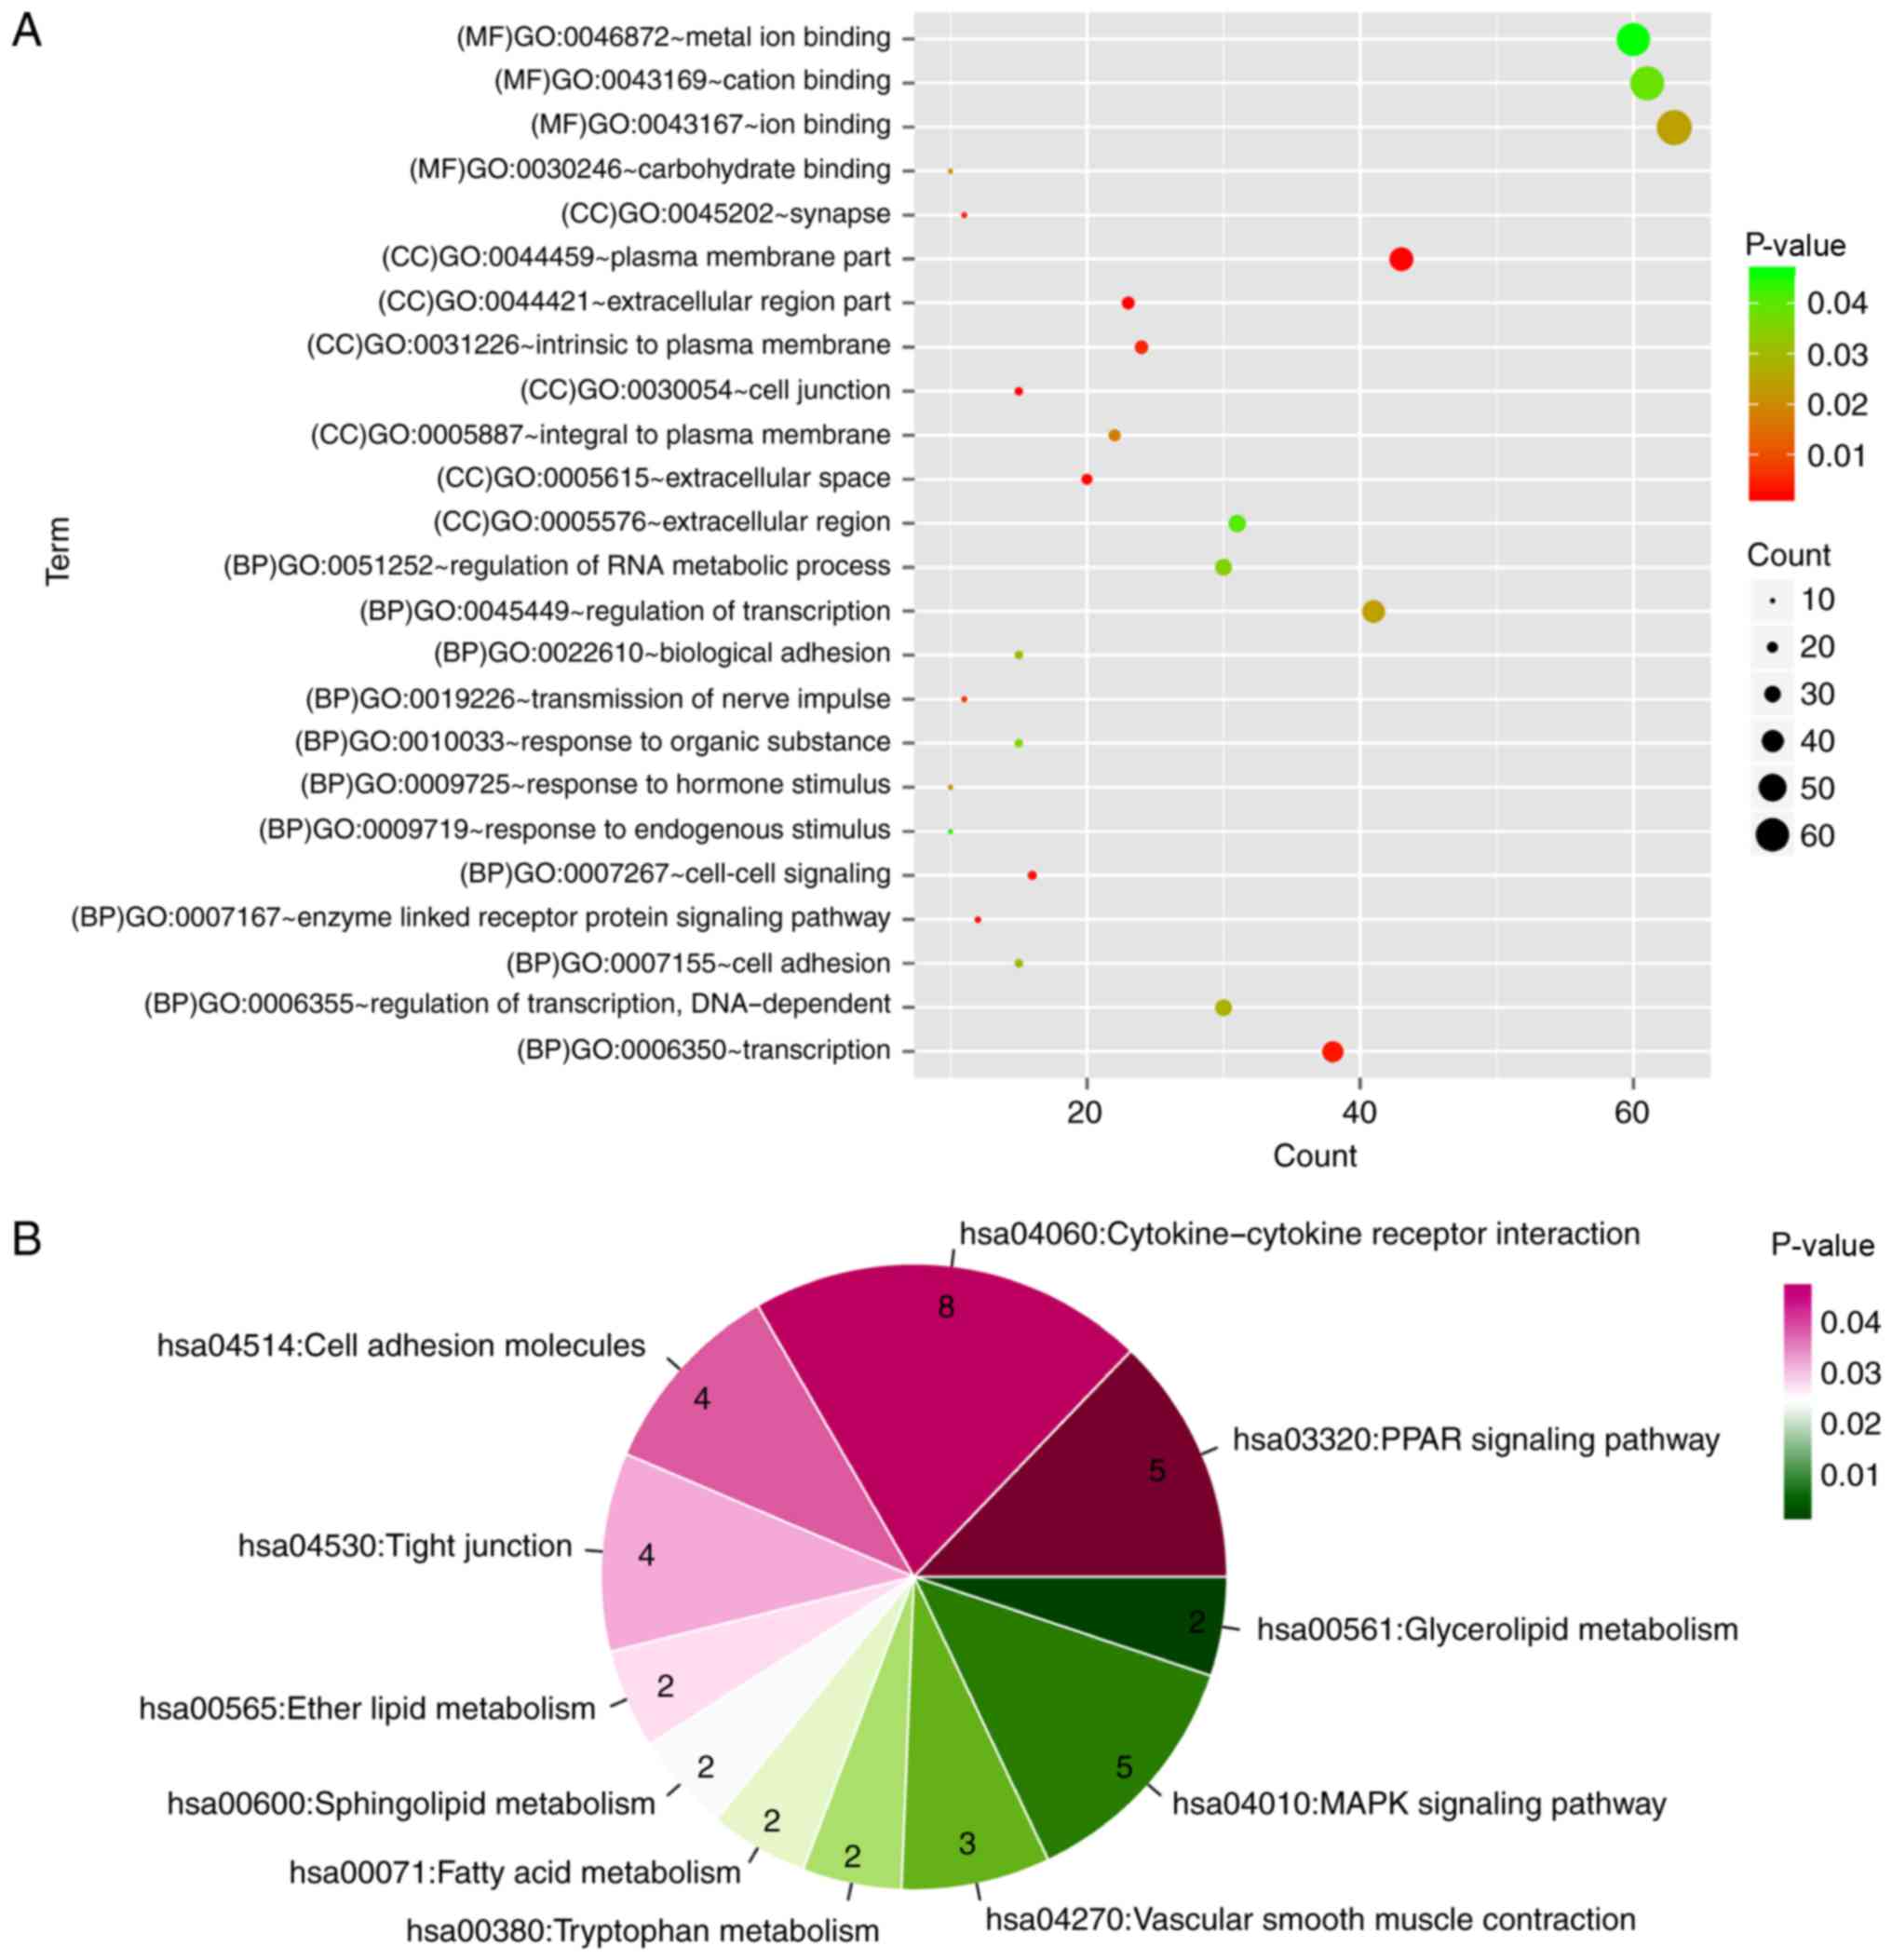
Functional and pathway enrichment
analyses
A total of 24 GO categories and 12 KEGG pathways
were enriched for the PPI network nodes. Notably, the network nodes
were mainly implicated in the enzyme-linked receptor protein
signaling pathway (GO category; P=0.00185), cell-cell signaling (GO
category; P=0.003505), peroxisome proliferator-activated receptor
(PPAR) signaling pathway (KEGG pathway; P=0.001014) and
cytokine-cytokine receptor interaction (KEGG pathway; P=0.004187)
(Fig. 8).
Discussion
In the present study, a total of 10 stable
CD-associated modules were identified using WGCCA; of which three
stable modules (M1, M2 and M8) and two stable modules (M4 and M10)
were significantly associated with cell adhesion and immune
response, respectively. In addition, 927 overlapping DEGs in the
GSE36807 and GSE59071 datasets were screened. In the PPI network,
five important nodes with relatively high node degrees were
identified as LDLR, TLR2, LPL, FOXM1 and NPY.
Previous studies have investigated the relationship
between inflammatory cytokines and LDLR (31,32),
and demonstrated that the inflammatory cytokines IL-1β and tumor
necrosis factor (TNF)-α can regulate LDLR expression leading
to accumulation of high concentrations of low-density lipoprotein
(33). FOXM1 belongs to the
forkhead box (FOX) family of transcription factors, and regulates
key genes involved in goblet cell metaplasia and lung inflammation
(34,35). FOXM1 is an important mediator of
cell proliferation, and its expression is enhanced during gastric
carcinogenesis induced by Helicobacter pylori infection
(36). Overexpression of
triglyceride-rich lipoproteins can induce lipid accumulation and
early inflammatory responses, and LPL serves an anti-inflammatory
role by hydrolyzing triglyceride-rich lipoproteins (37). PPARs can regulate lipid
metabolism-associated genes and control inflammation, and PPARα and
-γ activators contribute to macrophage secretion of LPL (38,39).
At present, there is no direct evidence for the involvement of
LDLR, FOXM1 and LPL in CD development. However, their expression
levels may be linked to disease progression. A study demonstrated
that polymorphisms of LIGHT (a TNF superfamily member) are
associated with CD, and inhibiting LIGHT reduces
dyslypidemia in mice lacking LDLR (40). This suggests a possible association
between LDLR and CD. In IBD, the susceptibility genes
include FYN proto-oncogene and HCK proto-oncogene, which are
involved in the phosphoinositide 3-kinase signaling network, which
also contains FOXM1 (41).
Since CD is a major subtype of IBD, FOXM1 may also be
associated with CD. With regards to the LPL gene, decreased
expression is observed in CD adipose-derived stem cells (ASCs)
independent of clinical stage, compared with in healthy ASCs,
indicating that CD modifies the plasticity of mesenteric ASCs
(42). In the present study, LPL
was upregulated in CD PPI network, indicating a potential role of
LPL in the progression of CD; pathway enrichment analysis
revealed that LPL was enriched in the PPAR signaling
pathway. Interestingly, the alterations in LPL expression levels of
ASC cells and CD tissues revealed different trends, suggesting that
the creeping fat tissue may be associated with the immunomodulatory
properties in patients with CD. Overall, the results demonstrated
that increases in LDLR, FOXM1 and LPL may be highly
relevant to the development of CD.
TLRs initiate immune responses to microbial
infection, with TLR2 recognizing bacterial lipoproteins, zymosan,
peptidoglycan and lipoteichoic acids (43,44).
TLR2, TLR4, and their transmembrane co-receptor cluster of
differentiation 14, are all upregulated in the terminal ileum of
patients with IBD, and their dysregulation may serve critical roles
in the pathogenesis of IBD (45).
NOD2 mediates the anti-inflammatory cytokine bias induced by TLR2
ligands; therefore, defective NOD2 function may promote
inflammation and increase the disease risk of CD (46). TLR2 and TLR4 have
been reported to be overexpressed in the inflamed colonic mucosa of
children with IBD, indicating that innate immunity is associated
with the pathogenesis of IBD (47). A previous study discovered that
TLR2 and TLR4 are highly expressed on inflammation-associated
intestinal macrophages (IMACs), leading to a higher reactivity to
lipopolysaccharide and possibly CD (48). In addition, the role of Gp96, an
endoplasmic reticulum chaperone for multiple protein substrates, in
CD has been investigated. The results demonstrated that the lack of
Gp96 in CD IMACs is associated with loss of tolerance against the
host gut flora, and that the Gp96 knockdown cell line has decreased
TLR2 and TLR4 expression (49). Therefore, it may be hypothesized
that TLR2 has an important role in the pathogenesis of CD.
Neurogenic inflammation is critical for the development of IBD, and
NPY induces oxidative stress and colitis by regulating the
expression of neuronal nitric oxide synthase (50). NPY and the NPY receptor Y1 (NPY1R)
are associated with intestinal inflammation and suppression of
NPY1R signaling may represent a potential therapeutic strategy for
colonic inflammation (51,52). NPY peptides have been implicated in
various gastrointestinal disorders, including IBD, malabsorption
and short gut; and NPY receptor agonists and antagonists can be
used for preventing diarrhea and intestinal inflammation (53). Gut neurohormones, including NPY,
can affect inflammation by interacting with the immune system, and
NPY represents a promising target for treating IBD (54). In the present study, NPY was
reported as an important node with a high degree in the CD PPI
network; however, the expression levels of NPY were lower in the CD
samples of patients compared with in the healthy control, which is
inconsistent to the reports (50,52).
Considering the important role of NPY in CD and that its expression
levels varies from that of previous reports, further validation of
NPY mRNA and protein expression in clinical samples is
required.
Nevertheless, there are some limitations to the
present study. Firstly, the results are solely based on
bioinformatics analysis and although various important genes for CD
etiology were identified, experimental validation is required.
Secondly, only two CD microarray datasets were selected with
relatively small sample sizes; therefore, this could affect the
robustness of the results. Further experiments will be designed and
conducted to validate these findings in follow-up studies.
In conclusion, a total of 10 stable modules and 927
DEGs associated with CD were identified. Notably, LDLR, TLR2,
FOXM1, NPY and LPL may be the key genes involved in
pathogenesis of the disease. LPL may exert its effects
through the PPAR signaling pathway.
Acknowledgements
Not applicable.
Funding
No funding was received.
Availability of data and materials
The datasets analyzed during the current study are
available from the corresponding author on reasonable request.
Authors' contributions
LB performed data analyses and wrote the manuscript.
HF made substantial contributions to data analyses. JY conceived
and designed the present study. All authors read and approved the
final manuscript.
Ethics approval and consent to
participate
Not applicable.
Patient consent for publication
Not applicable.
Competing interests
The authors declare that they have no competing
interests.
References
|
1
|
Baumgart DC and Sandborn WJ: Crohn's
disease. Lancet. 380:1590–1605. 2012. View Article : Google Scholar : PubMed/NCBI
|
|
2
|
Cho JH and Brant SR: Recent insights into
the genetics of inflammatory bowel disease. Gastroenterology.
140:1704–1712. 2011. View Article : Google Scholar : PubMed/NCBI
|
|
3
|
Dessein R, Chamaillard M and Danese S:
Innate immunity in Crohn's disease: The reverse side of the medal.
J Clin Gastroenterol. 42 Suppl 3:S144–S147. 2008. View Article : Google Scholar : PubMed/NCBI
|
|
4
|
Stefanelli T, Malesci A, Repici A, Vetrano
S and Danese S: New insights into inflammatory bowel disease
pathophysiology: Paving the way for novel therapeutic targets.
Current Drug Targets. 9:413–418. 2008. View Article : Google Scholar : PubMed/NCBI
|
|
5
|
Hashash JG, Proksell S and Regueiro MD:
Crohn's disease with worsening symptoms. Gastroenterology.
145:e5–e6. 2013. View Article : Google Scholar : PubMed/NCBI
|
|
6
|
Mazor Y, Maza I, Kaufman E, Ben-Horin S,
Karban A, Chowers Y and Eliakim R: Prediction of disease
complication occurrence in Crohn's disease using phenotype and
genotype parameters at diagnosis. J Crohns Colitis. 5:592–597.
2011. View Article : Google Scholar : PubMed/NCBI
|
|
7
|
Hovde Ø and Moum BR: Epidemiology and
clinical course of Crohn's disease: Results from observational
studies. World J Gastroenterol. 18:1723–1731. 2012. View Article : Google Scholar : PubMed/NCBI
|
|
8
|
Burisch J and Munkholm P: Inflammatory
bowel disease epidemiology. Curr Opin Gastroenterol. 29:357–362.
2013. View Article : Google Scholar : PubMed/NCBI
|
|
9
|
Hut'an M and Hut'an Mm: The role of
surgery in Crohn's disease treatment. Rozhl Chir. 88:185–188.
2009.(In Slovak). PubMed/NCBI
|
|
10
|
Prescott NJ, Fisher SA, Franke A, Hampe J,
Onnie CM, Soars D, Bagnall R, Mirza MM, Sanderson J, Forbes A, et
al: A nonsynonymous SNP in ATG16L1 predisposes to ileal Crohn's
disease and is independent of CARD15 and IBD5. Gastroenterology.
132:1665–1671. 2007. View Article : Google Scholar : PubMed/NCBI
|
|
11
|
Kobayashi T, Okamoto S, Hisamatsu T,
Kamada N, Chinen H, Saito R, Kitazume MT, Nakazawa A, Sugita A,
Koganei K, et al: IL23 differentially regulates the Th1/Th17
balance in ulcerative colitis and Crohn's disease. Gut.
57:1682–1689. 2008. View Article : Google Scholar : PubMed/NCBI
|
|
12
|
Siakavellas SI and Bamias G: Role of the
IL-23/IL-17 axis in Crohn's disease. Discov Med. 14:253–262.
2012.PubMed/NCBI
|
|
13
|
Ferguson LR, Han DY, Fraser AG, Huebner C,
Lam WJ, Morgan AR, Duan H and Karunasinghe N: Genetic factors in
chronic inflammation: Single nucleotide polymorphisms in the
STAT-JAK pathway, susceptibility to DNA damage and Crohn's disease
in a New Zealand population. Mutat Res. 690:108–115. 2010.
View Article : Google Scholar : PubMed/NCBI
|
|
14
|
Nabatov AA: The vesicle-associated
function of NOD2 as a link between Crohn's disease and
mycobacterial infection. Gut Pathog. 7:12015. View Article : Google Scholar : PubMed/NCBI
|
|
15
|
Balasubramanian I and Gao N: From sensing
to shaping microbiota: Insights into the role of NOD2 in intestinal
homeostasis and progression of Crohn's Disease. Am J Physiol
Gastrointest Liver Physiol. 313:G7–G13. 2017. View Article : Google Scholar : PubMed/NCBI
|
|
16
|
Zhang Y, Szustakowski J and Schinke M:
Bioinformatics analysis of microarray data. Methods Mol Biol.
573:259–284. 2009. View Article : Google Scholar : PubMed/NCBI
|
|
17
|
Kenny EE, Pe'er I, Karban A, Ozelius L,
Mitchell AA, Ng SM, Erazo M, Ostrer H, Abraham C, Abreu MT, et al:
A genome-wide scan of Ashkenazi jewish Crohn's disease suggests
novel susceptibility loci. PLoS Genet. 8:e10025592012. View Article : Google Scholar : PubMed/NCBI
|
|
18
|
Fransen K, Visschedijk MC, van Sommeren S,
Fu JY, Franke L, Festen EA, Stokkers PC, van Bodegraven AA, Crusius
JB, Hommes DW, et al: Analysis of SNPs with an effect on gene
expression identifies UBE2L3 and BCL3 as potential new risk genes
for Crohn's disease. Hum Mol Genet. 19:3482–3488. 2010. View Article : Google Scholar : PubMed/NCBI
|
|
19
|
Montero-Melendez T, Llor X,
Garcia-Planella E, Perretti M and Suárez A: Identification of novel
predictor classifiers for inflammatory bowel disease by gene
expression profiling. PLoS One. 8:e762352013. View Article : Google Scholar : PubMed/NCBI
|
|
20
|
Vanhove W, Peeters PM, Staelens D,
Schraenen A, Van der Goten J, Cleynen I, De Schepper S, Van Lommel
L, Reynaert NL, Schuit F, et al: Strong upregulation of AIM2 and
IFI16 inflammasomes in the mucosa of patients with active
inflammatory bowel disease. Inflamm Bowel Dis. 21:2673–2682. 2015.
View Article : Google Scholar : PubMed/NCBI
|
|
21
|
Parrish RS and Spencer HJ III: Effect of
normalization on significance testing for oligonucleotide
microarrays. J Biopharm Stat. 14:575–589. 2004. View Article : Google Scholar : PubMed/NCBI
|
|
22
|
Langfelder P and Horvath S: WGCNA: An R
package for weighted correlation network analysis. BMC
Bioinformatics. 9:5592008. View Article : Google Scholar : PubMed/NCBI
|
|
23
|
Wang X, Kang DD, Shen K, Song C, Lu S,
Chang LC, Liao SG, Huo Z, Tang S, Ding Y, et al: An R package suite
for microarray meta-analysis in quality control, differentially
expressed gene analysis and pathway enrichment detection.
Bioinformatics. 28:2534–2536. 2012. View Article : Google Scholar : PubMed/NCBI
|
|
24
|
Oughtred R, Chatraryamontri A, Breitkreutz
BJ, Chang CS, Rust JM, Theesfeld CL, Heinicke S, Breitkreutz A,
Chen D, Hirschman J, et al: BioGRID: A resource for studying
biological interactions in yeast. Cold Spring Harb Protoc.
2016:pdb.top080754. 2016. View Article : Google Scholar
|
|
25
|
Liu B and Hu B: HPRD: A high performance
RDF database. Int J Parallel Emergent Distributed Systems.
25:123–133. 2010. View Article : Google Scholar
|
|
26
|
Szklarczyk D, Franceschini A, Wyder S,
Forslund K, Heller D, Huerta-Cepas J, Simonovic M, Roth A, Santos
A, Tsafou KP, et al: STRING v10: Protein-protein interaction
networks, integrated over the tree of life. Nucleic Acids Res.
43:(Database Issue). D447–D452. 2015. View Article : Google Scholar : PubMed/NCBI
|
|
27
|
Kohl M, Wiese S and Warscheid B:
Cytoscape: Software for visualization and analysis of biological
networks. Methods Mol Biol. 696:291–303. 2011. View Article : Google Scholar : PubMed/NCBI
|
|
28
|
Dennis G Jr, Sherman BT, Hosack DA, Yang
J, Gao W, Lane HC and Lempicki RA: DAVID: Database for annotation,
visualization, and integrated discovery. Genome Biol. 4:P32003.
View Article : Google Scholar : PubMed/NCBI
|
|
29
|
Gene Ontology Consortium: Gene ontology
consortium: Going forward. Nucleic Acids Res. 43:(Database Issue).
D1049–D1056. 2015. View Article : Google Scholar : PubMed/NCBI
|
|
30
|
Kanehisa M, Sato Y, Kawashima M, Furumichi
M and Tanabe M: KEGG as a reference resource for gene and protein
annotation. Nucleic Acids Res. 44:D457–D462. 2015. View Article : Google Scholar : PubMed/NCBI
|
|
31
|
Strickland DK, Au DT, Cunfer P and
Muratoglu SC: Low-density lipoprotein receptor-related protein-1:
Role in the regulation of vascular integrity. Arterioscler Thromb
Vasc Biol. 34:487–498. 2014. View Article : Google Scholar : PubMed/NCBI
|
|
32
|
Fantus D, Awan Z, Seidah NG and Genest J:
Aortic calcification: Novel insights from familial
hypercholesterolemia and potential role for the low-density
lipoprotein receptor. Atherosclerosis. 226:9–15. 2013. View Article : Google Scholar : PubMed/NCBI
|
|
33
|
Ruan XZ, Varghese Z, Powis SH and Moorhead
JF: Dysregulation of LDL receptor under the influence of
inflammatory cytokines: A new pathway for foam cell formation.
Kidney Int. 60:1716–1725. 2001. View Article : Google Scholar : PubMed/NCBI
|
|
34
|
Ren X, Shah TA, Ustiyan V, Zhang Y, Shinn
J, Chen G, Whitsett JA, Kalin TV and Kalinichenko VV: FOXM1
promotes allergen-induced goblet cell metaplasia and pulmonary
inflammation. Mol Cell Biol. 33:371–386. 2013. View Article : Google Scholar : PubMed/NCBI
|
|
35
|
Kim IM, Zhou Y, Ramakrishna S, Hughes DE,
Solway J, Costa RH and Kalinichenko VV: Functional characterization
of evolutionarily conserved DNA regions in forkhead box f1 gene
locus. J Biol Chem. 280:37908–37916. 2005. View Article : Google Scholar : PubMed/NCBI
|
|
36
|
Feng Y, Wang L, Zeng J, Shen L, Liang X,
Yu H, Liu S, Liu Z, Sun Y, Li W, et al: FoxM1 is Overexpressed in
Helicobacter pylori-induced gastric carcinogenesis and is
negatively regulated by miR-370. Mol Cancer Res. 11:834–844. 2013.
View Article : Google Scholar : PubMed/NCBI
|
|
37
|
Ziouzenkova O, Perrey S, Asatryan L, Hwang
J, MacNaul KL, Moller DE, Rader DJ, Sevanian A, Zechner R, Hoefler
G and Plutzky J: Lipolysis of triglyceride-rich lipoproteins
generates PPAR ligands: Evidence for an antiinflammatory role for
lipoprotein lipase. Proc Natl Acad Sci USA. 100:2730–2735. 2003.
View Article : Google Scholar : PubMed/NCBI
|
|
38
|
Tyagi S, Gupta P, Saini AS, Kaushal C and
Sharma S: The peroxisome proliferator-activated receptor: A family
of nuclear receptors role in various diseases. J Adv Pharm Technol
Res. 2:236–240. 2011. View Article : Google Scholar : PubMed/NCBI
|
|
39
|
Ooi EM, Watts GF, Sprecher DL, Chan DC and
Barrett PH: Mechanism of action of a peroxisome
proliferator-activated receptor (PPAR)-delta agonist on lipoprotein
metabolism in dyslipidemic subjects with central obesity. J Clin
Endocrinol Metab. 96:E1568–E1576. 2011. View Article : Google Scholar : PubMed/NCBI
|
|
40
|
Herro R and Croft M: The control of tissue
fibrosis by the inflammatory molecule LIGHT (TNF Superfamily member
14). Pharmacol Res. 104:151–155. 2016. View Article : Google Scholar : PubMed/NCBI
|
|
41
|
Liu TC, Naito T, Liu Z, VanDussen KL,
Haritunians T, Li D, Endo K, Kawai Y, Nagasaki M, Kinouchi Y, et
al: LRRK2 but not ATG16L1 is associated with Paneth cell defect in
Japanese Crohn's disease patients. JCI Insight. 2:e919172017.
View Article : Google Scholar : PubMed/NCBI
|
|
42
|
Serena C, Keiran N, Madeira A, Maymó-Masip
E, Ejarque M, Terrón-Puig M, Espin E, Martí M, Borruel N, Guarner
F, et al: Crohn's disease disturbs the immune properties of human
Adipose-derived stem cells related to inflammasome activation. Stem
Cell Reports. 9:1109–1123. 2017. View Article : Google Scholar : PubMed/NCBI
|
|
43
|
Kawai T and Akira S: Toll-like receptors
and their crosstalk with other innate receptors in infection and
immunity. Immunity. 34:637–650. 2011. View Article : Google Scholar : PubMed/NCBI
|
|
44
|
Yuk JM and Jo EK: Toll-like receptors and
innate immunity. J Bacteriol Virol. 41:225–235. 2011. View Article : Google Scholar
|
|
45
|
Frolova L, Drastich P, Rossmann P,
Klimesova K and Tlaskalova-Hogenova H: Expression of Toll-like
receptor 2 (TLR2), TLR4, and CD14 in biopsy samples of patients
with inflammatory bowel diseases: Upregulated expression of TLR2 in
terminal ileum of patients with ulcerative colitis. J Histochem
Cytochem. 56:267–274. 2008. View Article : Google Scholar : PubMed/NCBI
|
|
46
|
Netea MG, Kullberg BJ, de Jong DJ, Franke
B, Sprong T, Naber TH, Drenth JP and Van der Meer JW: NOD2 mediates
anti-inflammatory signals induced by TLR2 ligands: Implications for
Crohn's disease. Eur J Immunol. 34:2052–2059. 2004. View Article : Google Scholar : PubMed/NCBI
|
|
47
|
Szebeni B, Mraz M, Veres G, Dezsofi A,
Vannay A, Vasarhelyi B, Majorova E and Arato A: Increased
expression of toll-like receptor (Tlr) 2 and Tlr4 in the colonic
mucosa of children with active inflammatory bowel disease. J Pediat
Gastroenterol Nutrition. 42:34–41. 2006.
|
|
48
|
Hausmann M, Kiessling S, Mestermann S,
Webb G, Spöttl T, Andus T, Schölmerich J, Herfarth H, Ray K, Falk W
and Rogler G: Toll-like receptors 2 and 4 are up-regulated during
intestinal inflammation. Gastroenterology. 122:1987–2000. 2002.
View Article : Google Scholar : PubMed/NCBI
|
|
49
|
Cosin-Roger J, Spalinger MR, Ruiz PA,
Stanzel C, Terhalle A, Wolfram L, Melhem H, Atrott K, Lang S,
Frey-Wagner I, et al: Gp96 deficiency affects TLR4 functionality
and impairs ERK and p38 phosphorylation. PLoS One. 13:e01930032018.
View Article : Google Scholar : PubMed/NCBI
|
|
50
|
Chandrasekharan B, Bala V, Kolachala VL,
Vijay-Kumar M, Jones D, Gewirtz AT, Sitaraman SV and Srinivasan S:
Targeted deletion of neuropeptide Y (NPY) modulates experimental
colitis. PLoS One. 3:e33042008. View Article : Google Scholar : PubMed/NCBI
|
|
51
|
Hassani H, Lucas G, Rozell B and Ernfors
P: Attenuation of acute experimental colitis by preventing NPY Y1
receptor signaling. Am J Physiol Gastrointest Liver Physiol.
288:G550–G556. 2005. View Article : Google Scholar : PubMed/NCBI
|
|
52
|
Chandrasekharan B, Nezami BG and
Srinivasan S: Emerging neuropeptide targets in inflammation: NPY
and VIP. Am J Physiol Gastrointest Liver Physiol. 304:G949–G957.
2013. View Article : Google Scholar : PubMed/NCBI
|
|
53
|
Vona-Davis LC and McFadden DW: NPY family
of hormones: Clinical relevance and potential use in
gastrointestinal disease. Curr Top Med Chem. 7:1710–1720. 2007.
View Article : Google Scholar : PubMed/NCBI
|
|
54
|
El-Salhy M and Hausken T: The role of the
neuropeptide Y (NPY) family in the pathophysiology of inflammatory
bowel disease (IBD). Neuropeptides. 55:137–144. 2016. View Article : Google Scholar : PubMed/NCBI
|