Introduction
Gastric cancer is the third leading cause of
cancer-related mortality worldwide (1). Adenocarcinoma constitutes the
majority, approximately 90%, of gastric cancer cases (2). Adenocarcinoma is a malignant
epithelial tumor that invades the gastric wall, and infiltrates the
muscularis mucosae, submucosa, and muscularis propria. Since early
gastric cancer yields few symptoms, gastric cancer is usually
advanced at diagnosis, which is difficult to cure (3). Advanced-stage gastric adenocarcinoma
has a poor prognosis and the spontaneous median survival ranges
from 3 to 6 months (4). Achieving
a detailed understanding of the genetics and molecular pathogenesis
of gastric adenocarcinoma may help improve patient outcomes.
Altered regulation of gene expression programs is
important for tumors to express different cancer biomarkers
(5,6). A Recent study has achieved
considerable progress in identifying the key molecular mediators of
gastric cancer. For instance, gene changes in Cadherin 1
expression, AT-rich interaction domain 1A, and ras homolog family
member A, as well as some deregulated pathways including
AMPK/HNF4a/Wnt5a pathways are associated with gastric malignancy
and progression (7–10). Although several genes have been
reported, a large proportion of gastric cancer patients have none
of these genes in their cancer genome. Therefore, further detailed
genomic characterization of gastric cancer patients is
required.
Transcriptome sequencing is a rapidly developing
approach to provide an unprecedented global view of the
transcriptome, thereby revealing the entire transcriptional
landscape (11,12). In this study, we used transcriptome
sequencing to compare gene expression changes in five pairs of
gastric adenocarcinoma tissue and normal tumor-adjacent tissue.
Transcriptome sequencing data were then analyzed in silico. The
present study aimed to further explore genetic and biochemical
markers associated with gastric adenocarcinoma.
Materials and methods
Samples
Five pairs of gastric adenocarcinoma tissue and
normal tumor-adjacent tissue were obtained from five gastric
adenocarcinoma patients (Table I).
The tissue samples were snap-frozen and stored in liquid nitrogen.
All patients provided informed consent before the study. In
addition, all procedures in this study were approved by our
hospital's protection of human ethics committee.
 | Table I.Characteristics of patients. |
Table I.
Characteristics of patients.
| Samples | Sex | Age | Height (cm) | Weight (kg) | Stage |
|---|
| G1 | Male | 64 | 170 | 55 | T1N0M0 |
| G2 | Female | 78 | 149 | 60 | T2N2M1 |
| G3 | Male | 63 | 172 | 65 | T4aN2M0 |
| G4 | Female | 84 | 155 | 55 | T1N0M0 |
| G5 | Male | 74 | 171 | 65 | T1N0M0 |
RNA isolation, library preparation,
and sequencing
Total RNAs were isolated from tumor and paired
normal tumor-adjacent tissues using TRIzol reagent (Invitrogen;
Thermo Fisher Scientific, Inc., Waltham, MA, USA). RNA integrity
was detected using the RNA Nano 6000 Assay kit (Agilent
Technologies, Inc., Santa Clara, CA, USA). RNA concentration and
purity were assessed using Qubit®RNA Assay kit in
Qubit®2.0 Flurometer (Thermo Fisher Scientific, Inc.),
and NanoPhotometer® spectrophotometer (Implen, Inc.,
Westlake Village, CA), respectively. mRNA was then purified using
oligo (dT) magnetic beads, and the high-quality mRNA were pooled to
generate a cDNA library, using the NEBNext® Ultra™ RNA
Library Prep kit for Illumina®. Briefly, mRNA was
fragmented into small pieces, followed with first-strand cDNA
synthesis with random hexamer-primers. Thereafter, double-stranded
cDNA was synthesized and purified with AMPure XP beads. Purified
double stranded cDNA was then subjected to end repair, dA tailing,
and adaptor ligation. After size selection using AMPure XP beads,
cDNA libraries were constructed and sequenced using the Illumina
HiSeq 4000 platform.
The data are deposited at National Center for
Biotechnology Information (NCBI) Sequence Read Archive (SRA)
database (accession no. SRP119102).
Raw read quality control and reference
genome alignment
Raw reads were quality-filtered to obtain clear data
via removal of adaptor sequences, ambiguous or low-quality reads
and reads with more than 5% N, using Fastx toolkit version 0.0.13
and Prinseq-lite version 0.20.4 (13). The clear reads were aligned with
the human reference genome GRCh38 using Tophat (version 2.0.8,
http://htseq.readthedocs.io/) (14). The default parameters were the
following: read-mismatches, 2; read-gap-length, 2; and min-anchor,
8. Thereafter, the clear reads were annotated using HTseq (version
0.6.1, http://www-huber.embl.de/HTSeq)
(15) on the basis of the GRCh38
gene annotation information in gene code.
Identification of differentially
expressed genes (DEGs) analysis
The mRNA read counts were transformed into
log-counts per million (logCPM) using edger (version 3.4,
http://www.bioconductor.org/packages/release/bioc/html/edgeR.html)
in R (16,17). Genes with low expression values
were excluded. The obtained genes were normalized using trimmed
mean of M-values (TMM) algorithm. Thereafter, the normalized data
were transformed into a gene expression matrix, using the voom
method (18) in limma (version
3.32.5, http://bioconductor.org/packages/release/bioc/html/limma.html)
package (19). DEGs were
determined using empirical Bayes linear model and the P-value for
the expression of all genes was obtained. A P-value <0.05
and|log2 (fold-change)|≥1 were set as the cut-off
values. The heatmap of DEGs was clustered using pheatmap (version
1.0.8, http://cran.r-project.org/web/packages/pheatmap)
package in R (20).
Functional and pathway enrichment
analyses
We used clusterProfiler (version 3.4.4, http://bioconductor.org/packages/release/bioc/html/clusterProfiler.html)
to implement Gene Ontology (GO) (21) and Kyoto Encyclopedia of Genes and
Genomes (KEGG) (22) analyses for
up- and down-regulated DEGs. The Benjamini and Hochberg (BH)
method-adjusted P-value <0.05 was used as cut-off criteria.
Gene clustering analysis
On the basis of the gene expression valuesin cancer
and control groups, we applied clustering analysis for DEGs using
ConsensusClusterPlus (version 1.40.0, http://www.bioconductor.org/packages/release/bioc/html/ConsensusClusterPlus.html)
in R (23). The clustering method
was K-means algorithm with the Euclidean distance. The number of
clusters was identified through cumulative distribution function
(24).
PPI network and pathway analyses of
clustering module
Based on the clustering modules obtained, we
utilized the Search Tool for the Retrieval of Interacting Genes
(STRING, Version 10.0, http://www.string-db.org/) (25) database to analyze protein-protein
interactions among DEGs. The Cytoscape (version 3.4.0, http://www.cytoscape.org/) (26) software was used to visualize the
PPI network. The topological characteristics of nodes in the
network were analyzed using CytoNCA (version 2.1.6, http://apps.cytoscape.org/apps/cytonca)
(27). Based on the topological
propertyscores of nodes, hub proteins (28) were selected. Additionally, we
performed KEGG pathway enrichment analysis for genes in clustering
modules.
Prognostic analysis
The effect of DEGs on patient prognosis was analyzed
using the stomach adenocarcinoma (STAD) survival data in The Cancer
Genome Atlas (TCGA) database. In TCGA database, we downloaded the
mRNA-Seq and clinical data. In total, 371 samples displayed both
gene expression values and clinical data, which were selected for
prognostic analysis. Briefly, each DEG was divided into two groups
in accordance with its expression level (relative to the median of
expression value) in patients, followed by analysis using
Kaplan-Meier (KM) survival curves. Significant differences between
high- and low-expression groups were analyzed using the log-rank
test.
Reverse transcription-quantitative
polymerase chain reaction (RT-qPCR) verification of the expression
of key genes
The expression levels of several genes were detected
using RT-qPCR based on the five pairs of gastric adenocarcinoma
tissue and normal tumor-adjacent tissue. Briefly, total RNAs were
isolated using a TRIzol reagent (Invitrogen; Thermo Fisher
Scientific, Inc.). RNA concentration and quality were determined on
a TECAN infinite M100 PRO Biotek microplate reader (Tecan, San
Jose, CA, USA). Then 0.5 µg of the total RNA was used from cDNA
synthesis using the PrimeScript RT Master Mix (RR036A; Takara
Biotechnology Co., Ltd., Dalian, China). RT-qPCR was performed
using the SYBR-Green kit (4367659; Thermo Fisher Scientific, Inc.)
in the Viia7 Real-Time PCR System (Applied Biosystems; Thermo
Fisher Scientific, Inc.). The primers used in this study are listed
in Table II.
| Table II.Primers used in qPCR. |
Table II.
Primers used in qPCR.
| Primer name | Sequences
(5′-3′) |
|---|
| GAPDH-hF |
TGACAACTTTGGTATCGTGGAAGG |
| GAPDH-hR |
AGGCAGGGATGATGTTCTGGAGAG |
| CYP2B6-hF |
TCCAGTCCATTACCGCCAAC |
| CYP2B6-hR |
GTAAACTTGCCTGTGTGCCC |
| MAPK13-hF |
CGTCAACAAGACAGCCTGGGA |
| MAPK13-hR |
TGAAGACATCCAGGAGCCCAA |
| F2R-hF |
CCGCCTGCTTCAGTCTGTG |
| F2R-hR |
TGACCGGGGATCTAAGGTGG |
| CTHRC1-hF |
CCGCCAGGTAGGAGCATCAC |
| CTHRC1-hR |
TTTCCCTCAGACATTCCCCCT |
| RASGRP3-hF |
TCAGTTTCTGACCTCCTGGCA |
| RASGRP3-hR |
TGCATGGAAGAAGCAGTCTGT |
| PYGM-hF |
AGAAGAGGCGGGAGAGGAAA |
| PYGM-hR |
TGTTTGGGGGAGAAGAAGCC |
Statistical analysis
Data are presented as mean ± standard deviation.
Statistical analysis was performed using SPSS 22.0 (IBM Corp.,
Armonk, NY, USA). Differences in gene expression levels among
different groups were analyzed by one-way analysis of variance. The
least square difference test was used for post hoc analyses.
P<0.05 was considered significant.
Results
Reference genome alignment
The reads mapped to the human reference genome
(GRCh38). The alignment rates of ten samples ranged from 76.58% to
82.83% (data not shown).
Analysis of DEGs
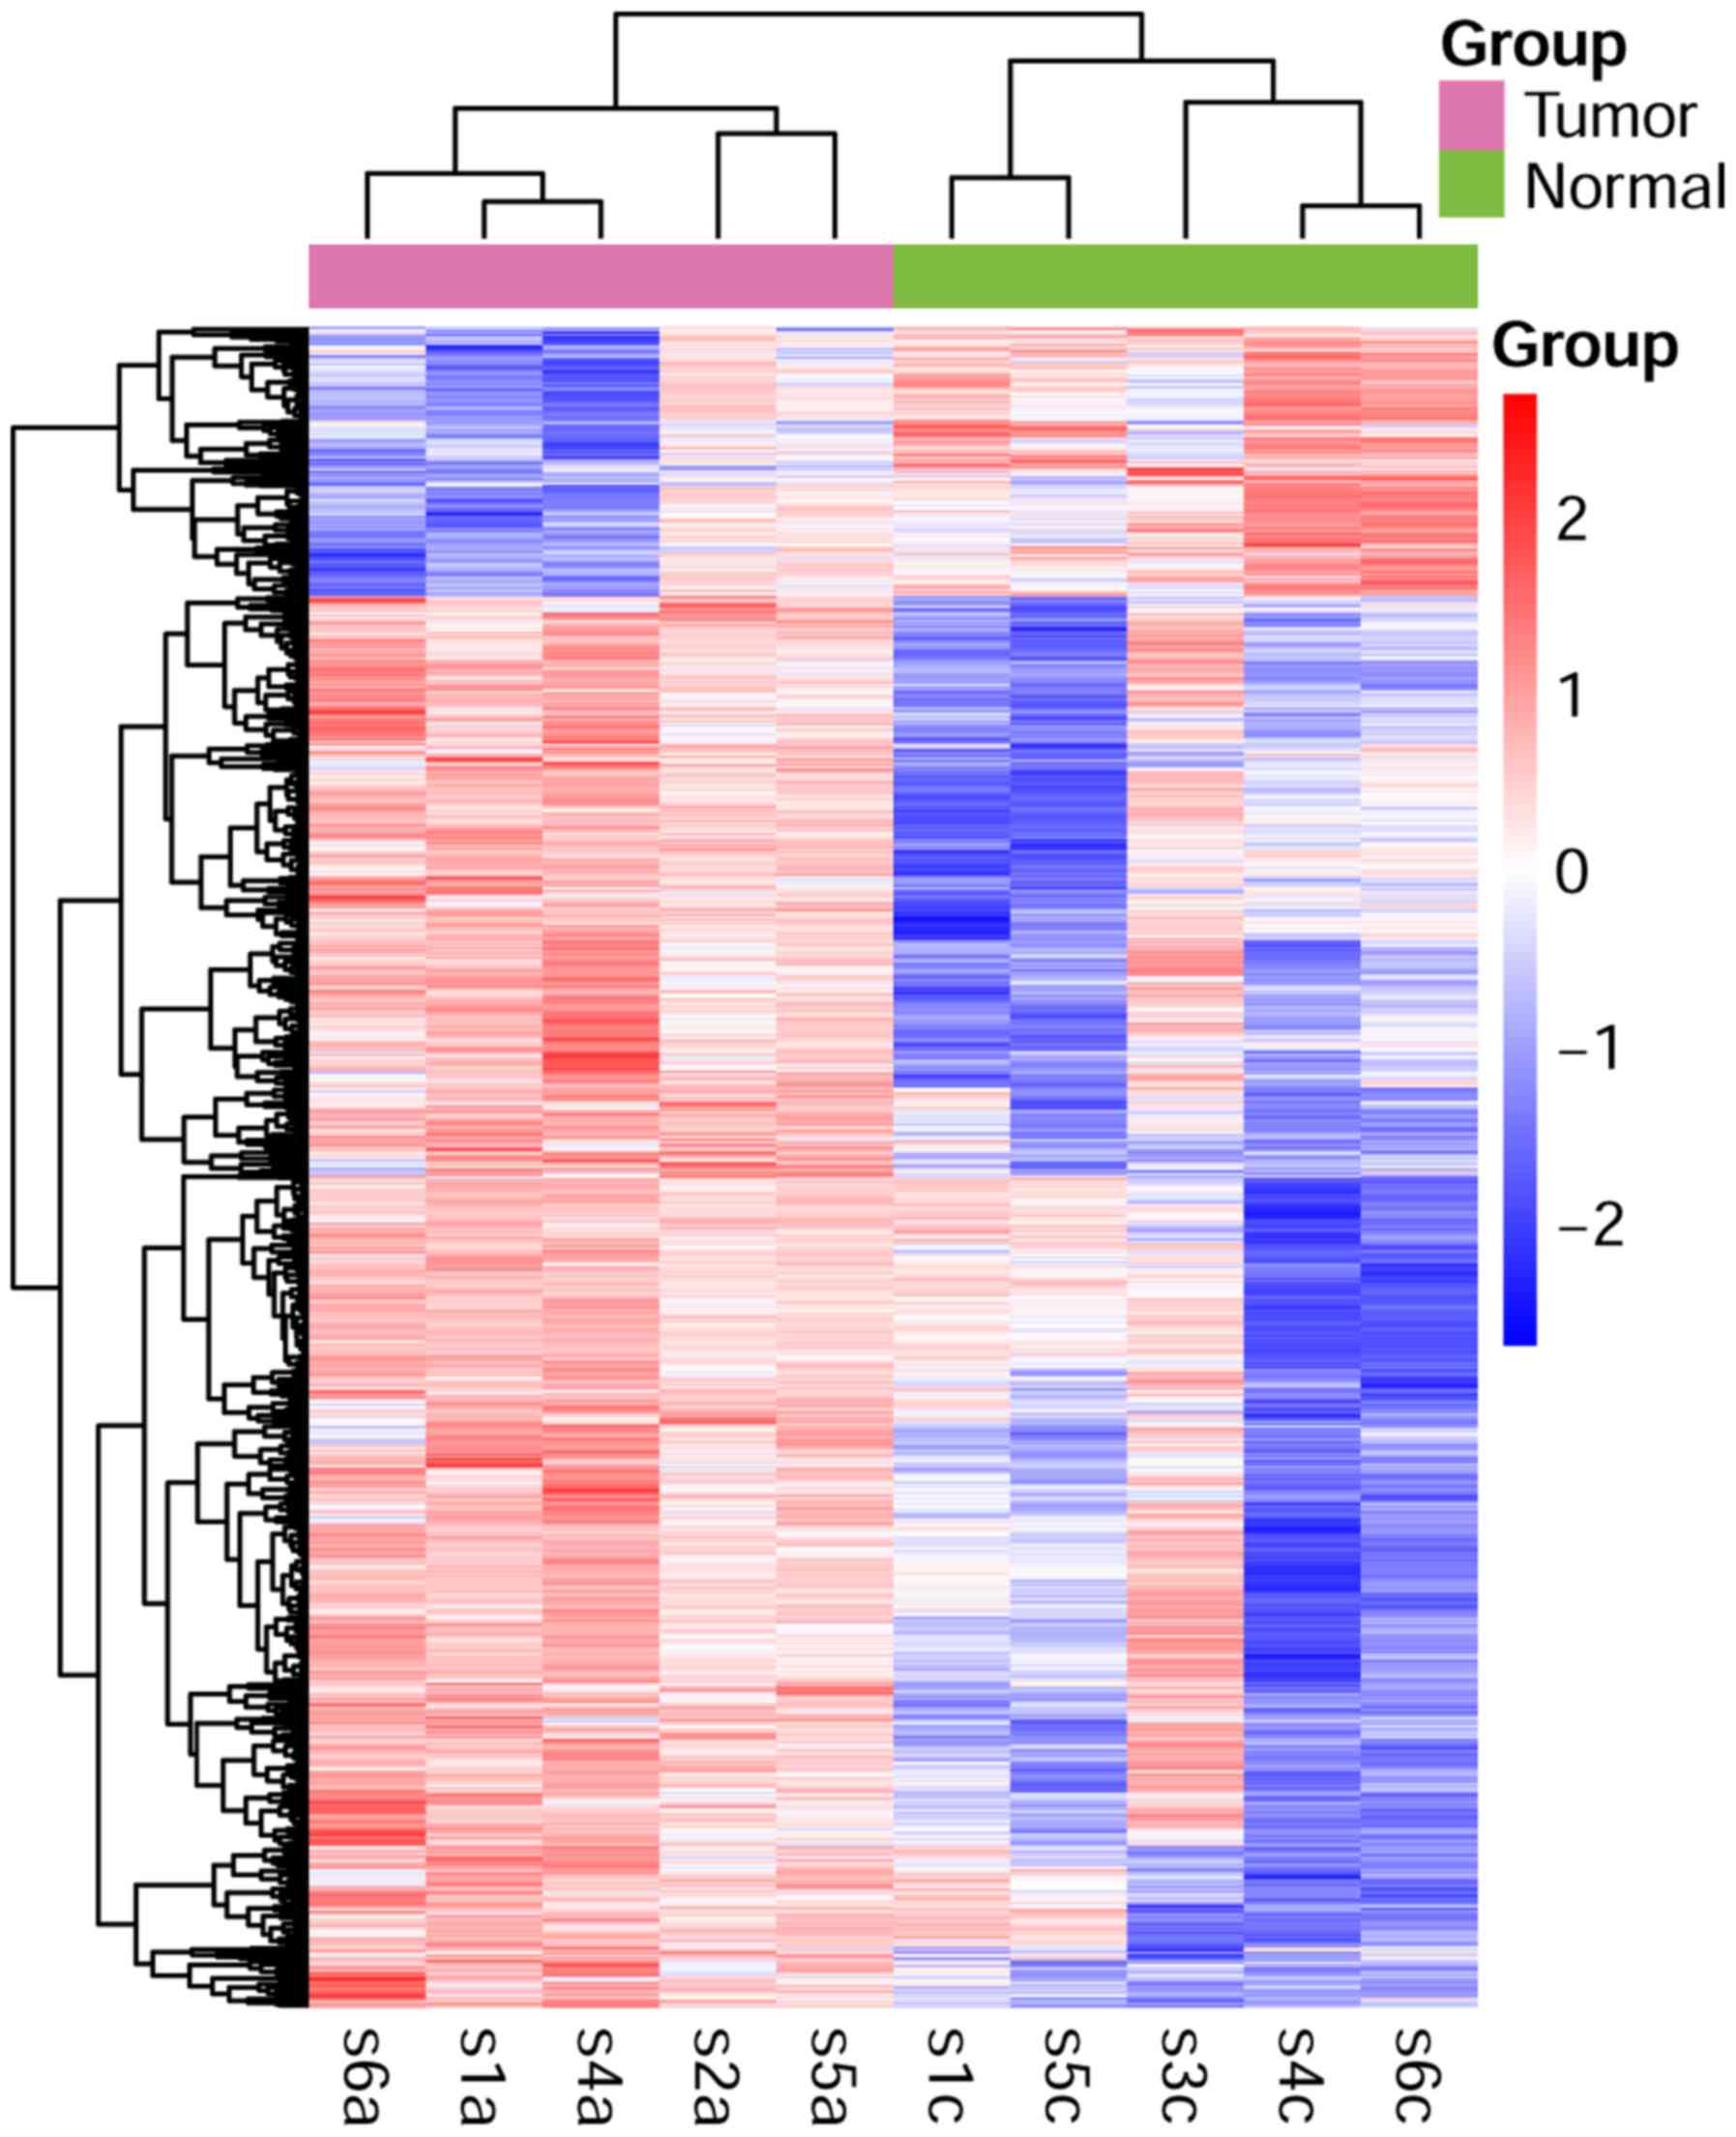
In total, 1477 upregulated and 282 downregulated
DEGs were screened out in tumor groups compared with the control.
Clustering analysis revealed that DEGs could clearly distinguish
between tumor and control groups, as shown in the heatmap (Fig. 1).
Functional enrichment analysis
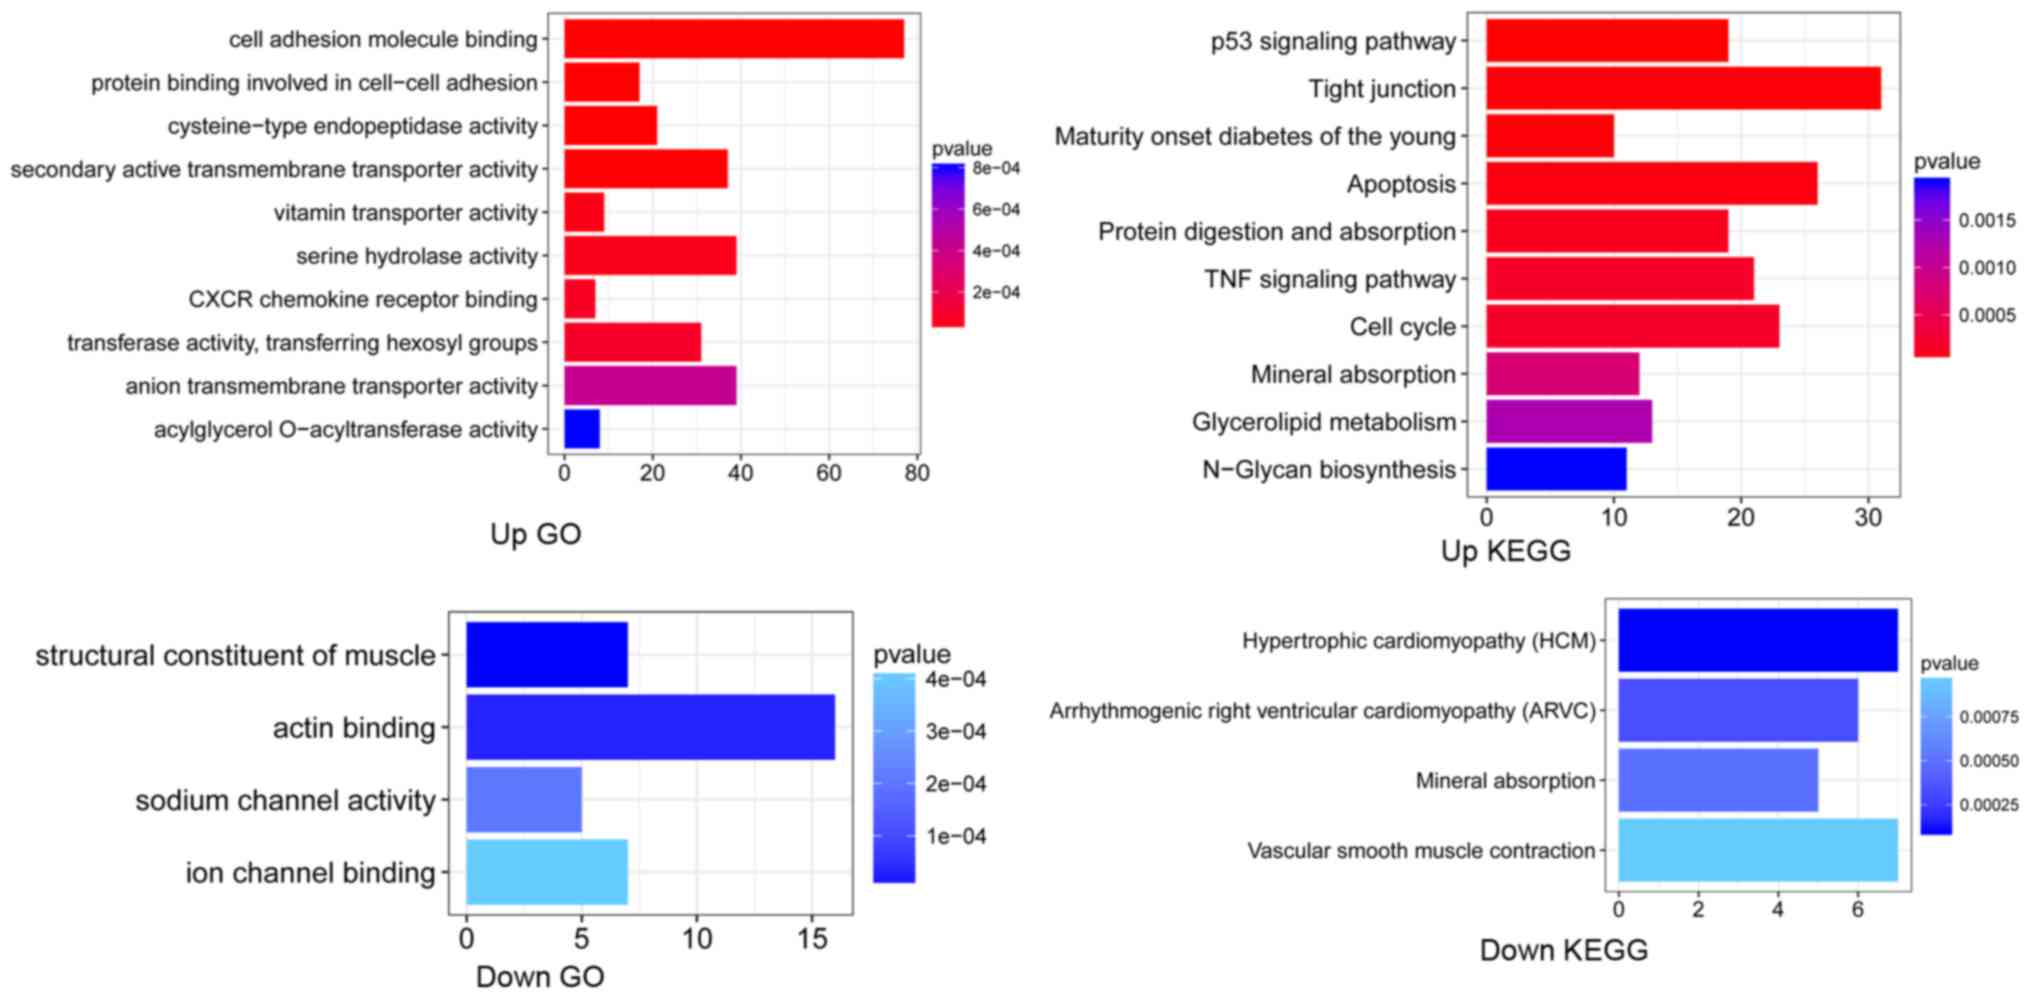
Results of functional enrichment analysis are shown
in Fig. 2. Upregulated DEGs were
significantly associated with the binding of cell adhesion
molecules, and cysteine-type endopeptidase activity, as well as the
p53 signaling pathway, and TNF signaling pathway. Downregulated
DEGs were significantly associated with the GO term ‘ion channel
binding’, and pathway of ‘Vascular smooth muscle contraction’.
Gene clustering analysis
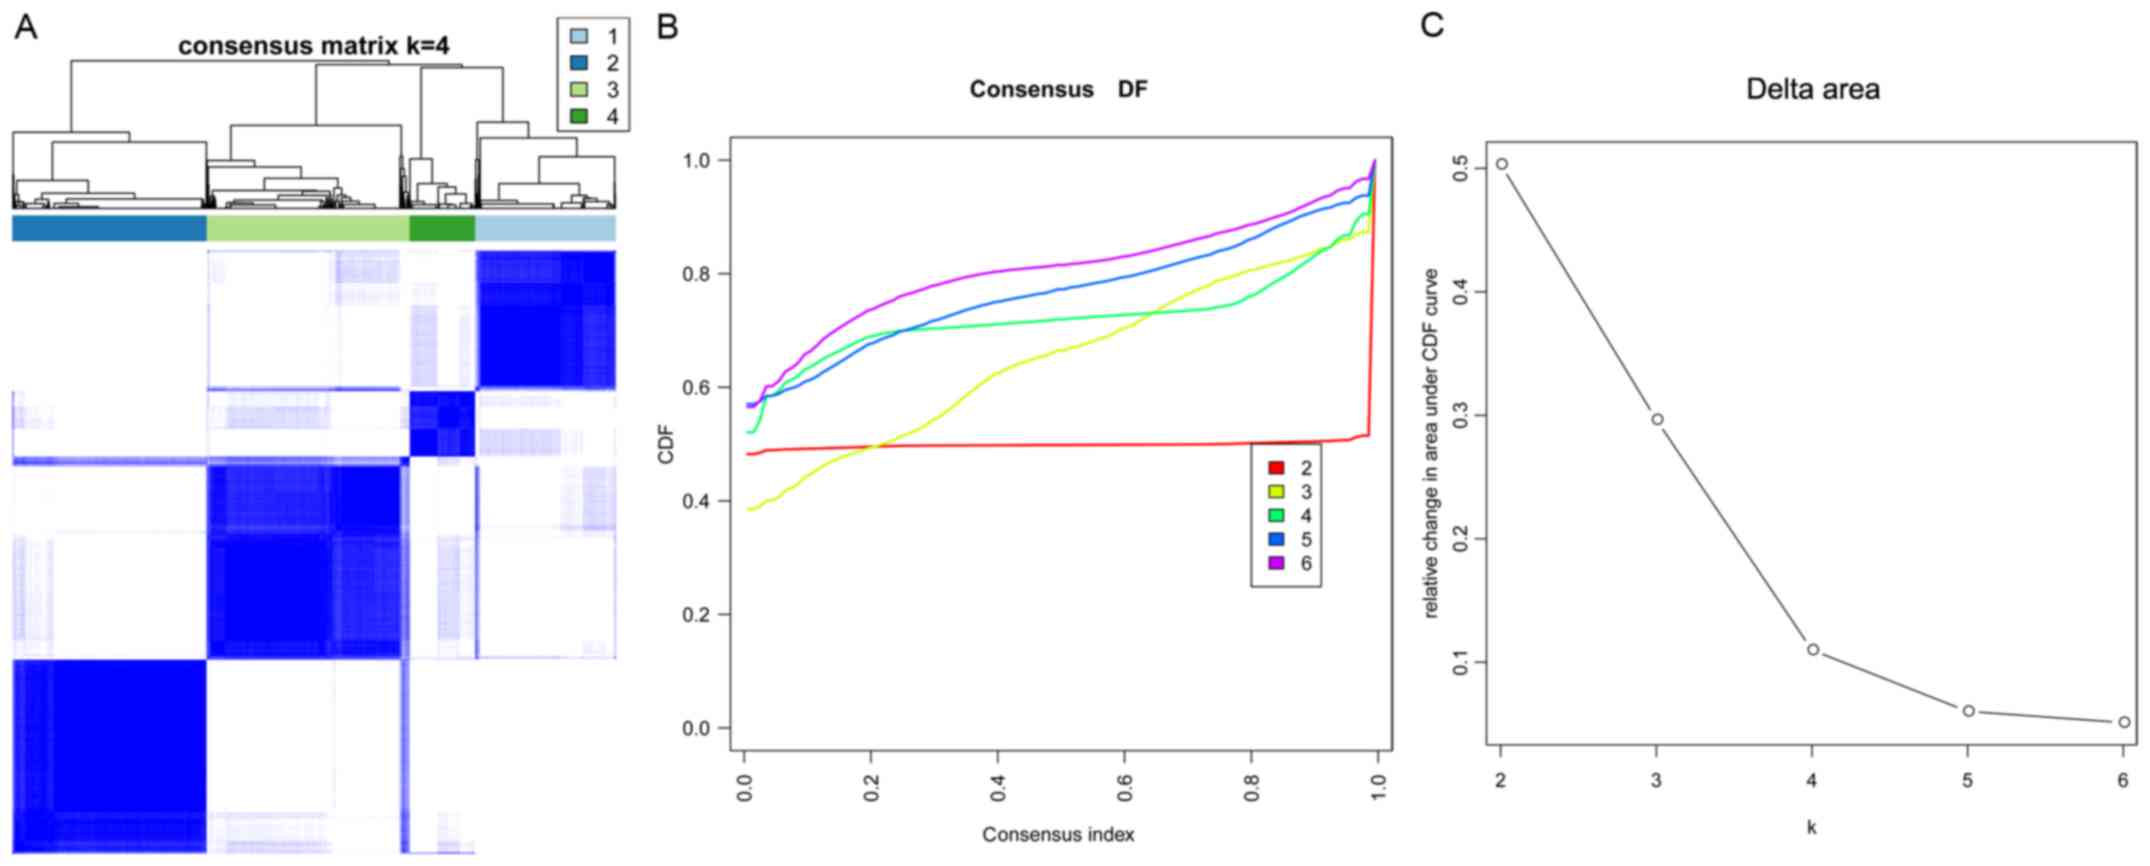
Using the consensus cluster algorithm, when k=4, the
consensus matrix plot (Fig. 3A)
presented a clear distribution of high consistency and low
consistency in classification. Moreover, the classification
achieved the maximum stability when k=4 (Fig. 3B). Furthermore, k=4 was the largest
k with an appreciable increase in consensus (Fig. 3C). Therefore, k=4 was considered
the optimal clustering number. Based on k=4, four clusters were
obtained. The number of genes in clusters 1–4 was 410
(upregulated), 567 (479 upregulated and 88 downregulated), 591 (588
upregulated and 3 downregulated), and 191 (downregulated),
respectively.
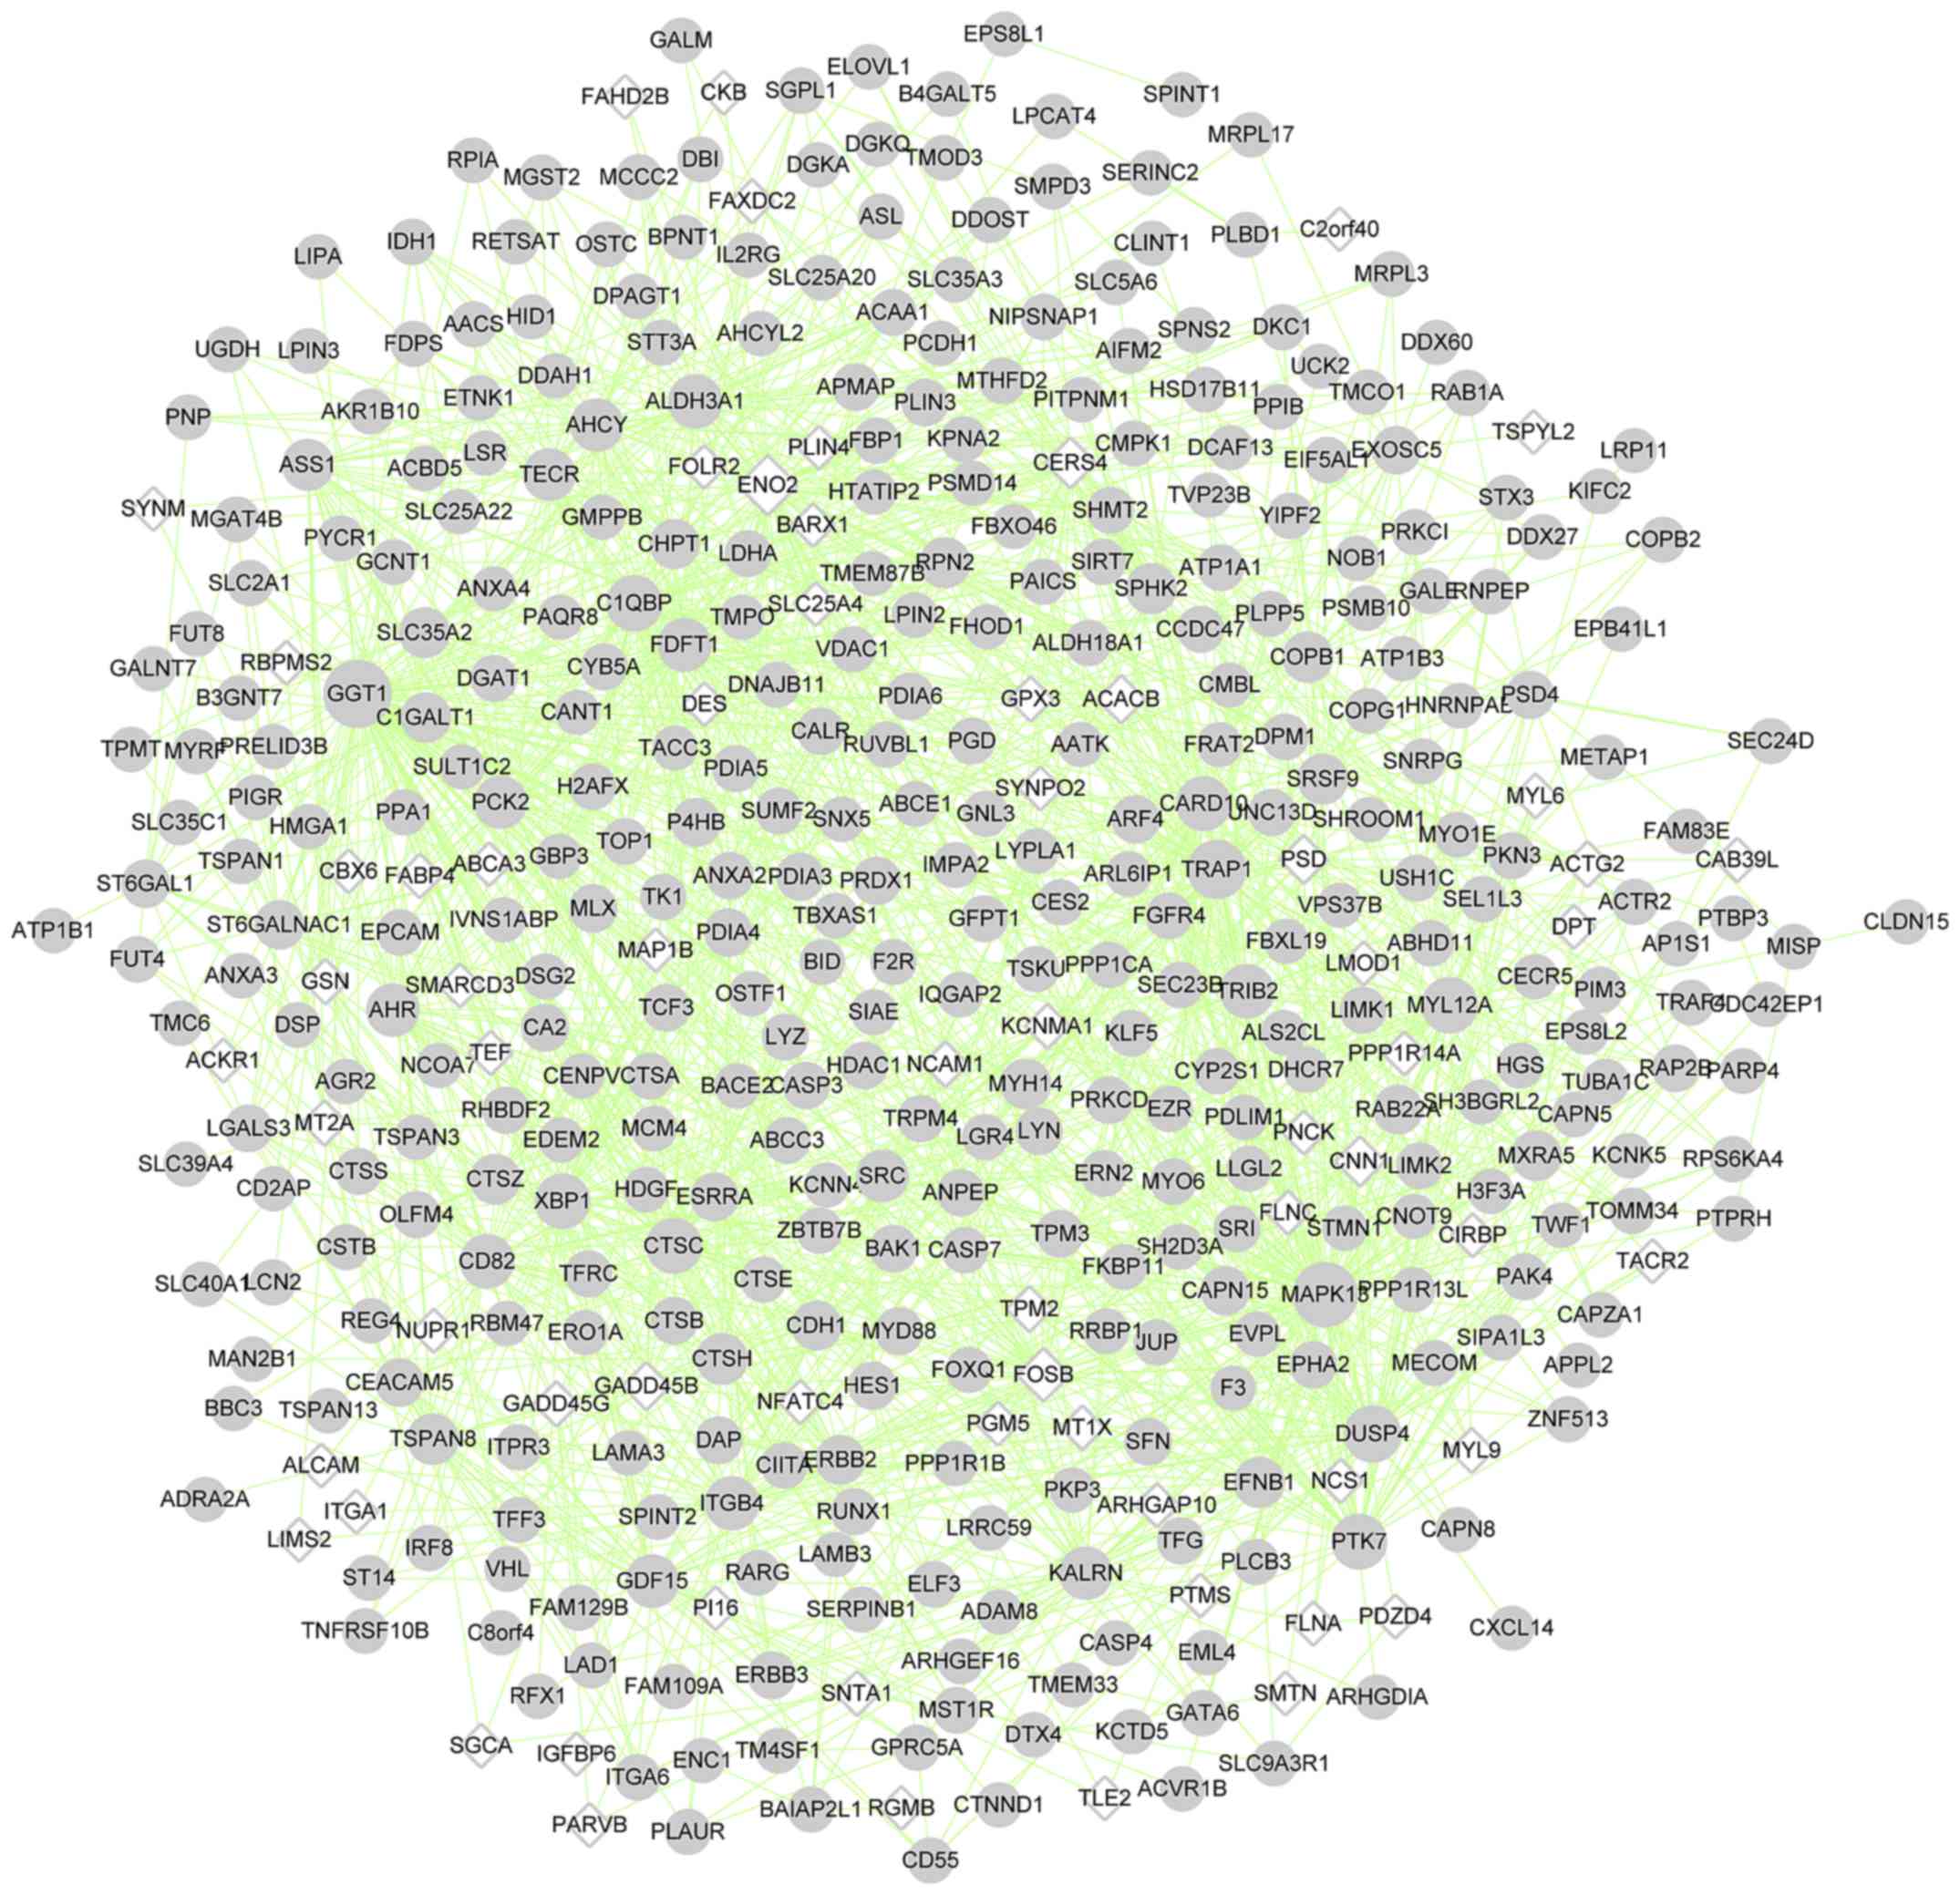
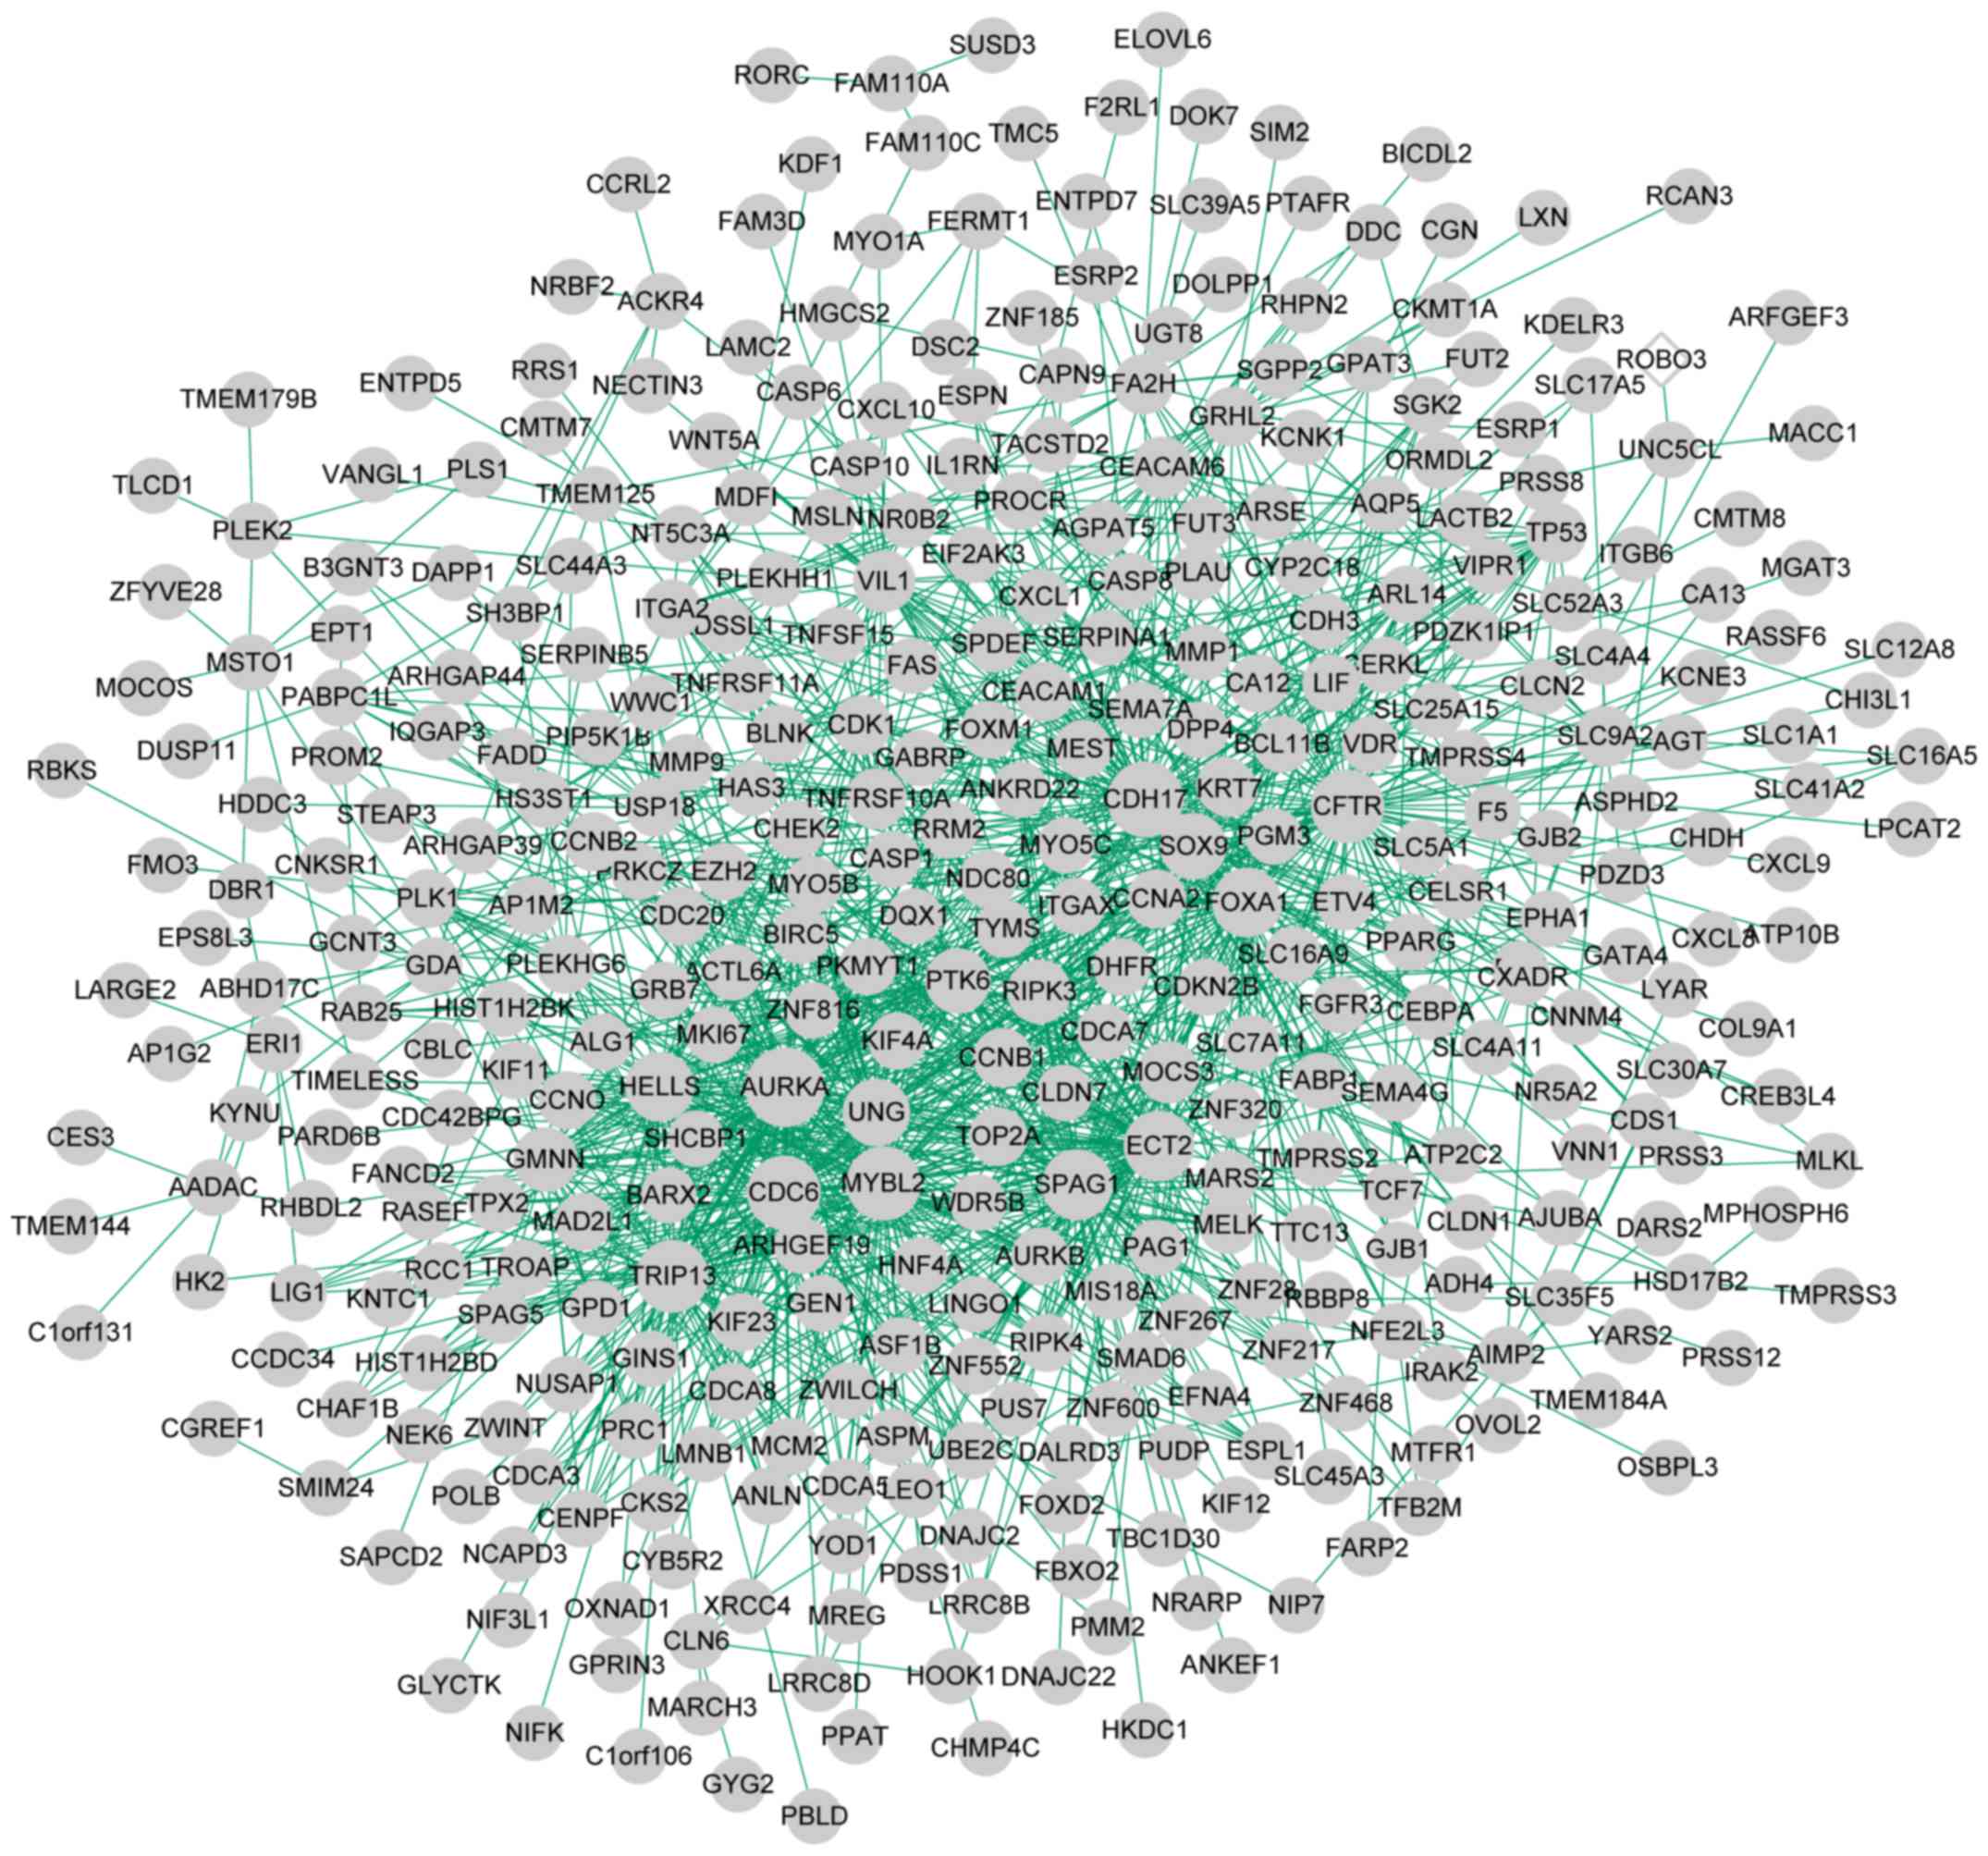
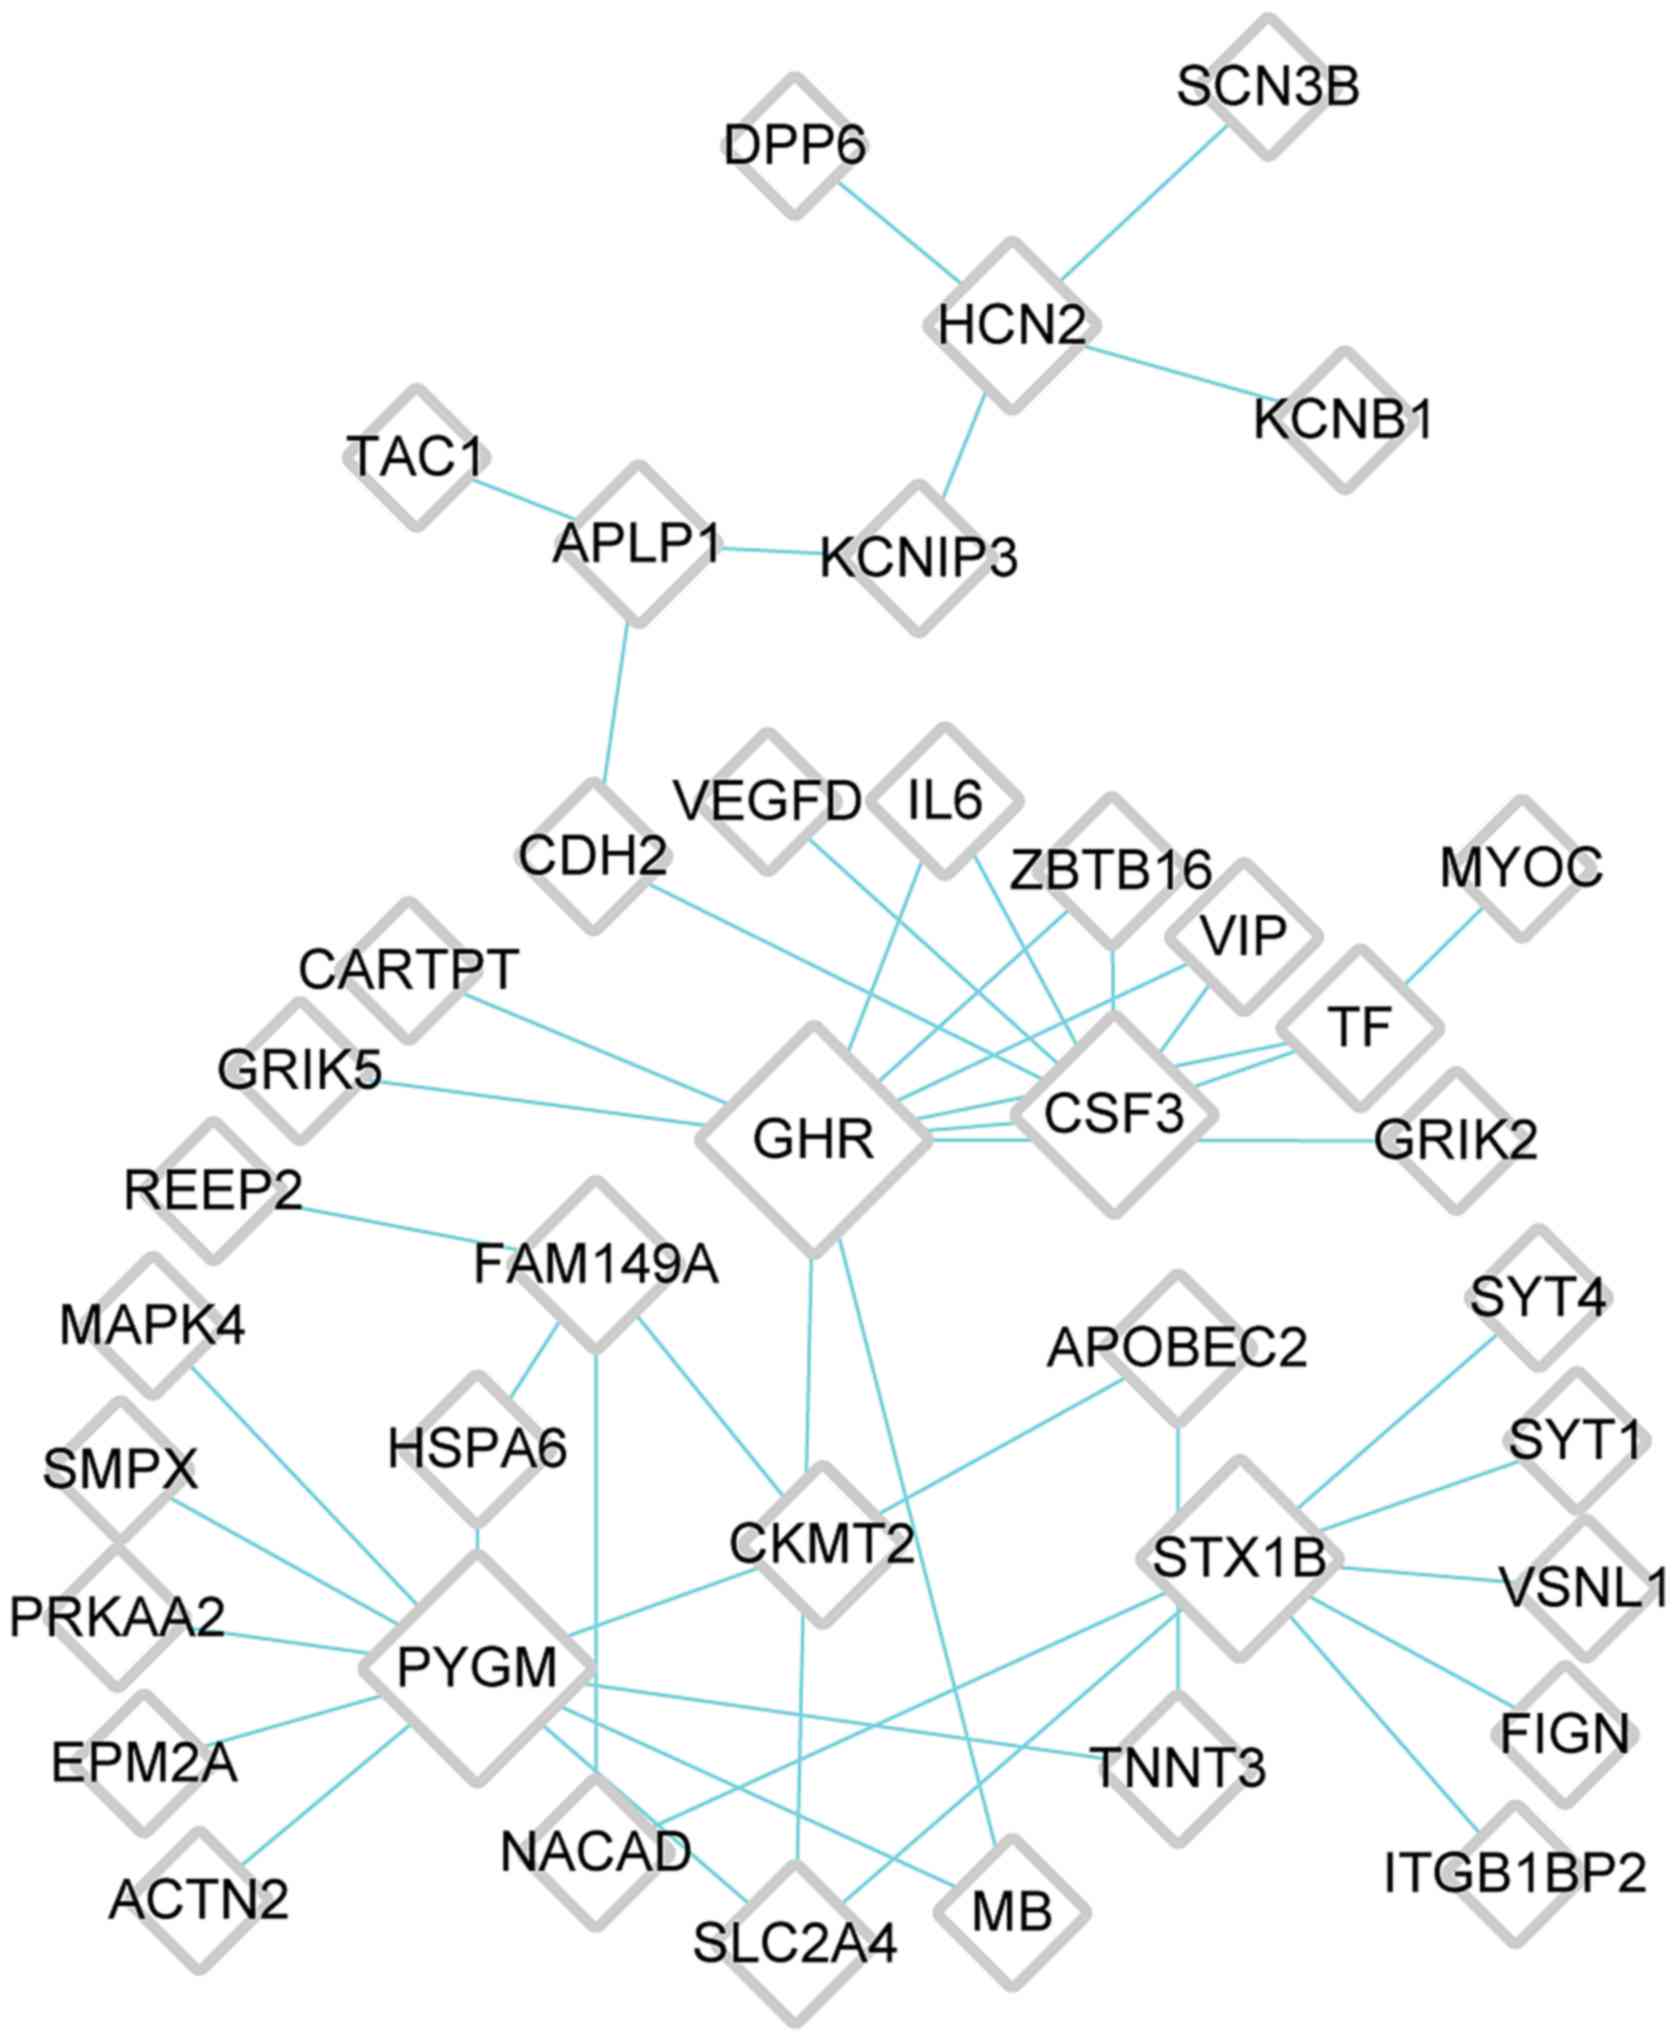
PPI network and pathway analyses of
clustering module
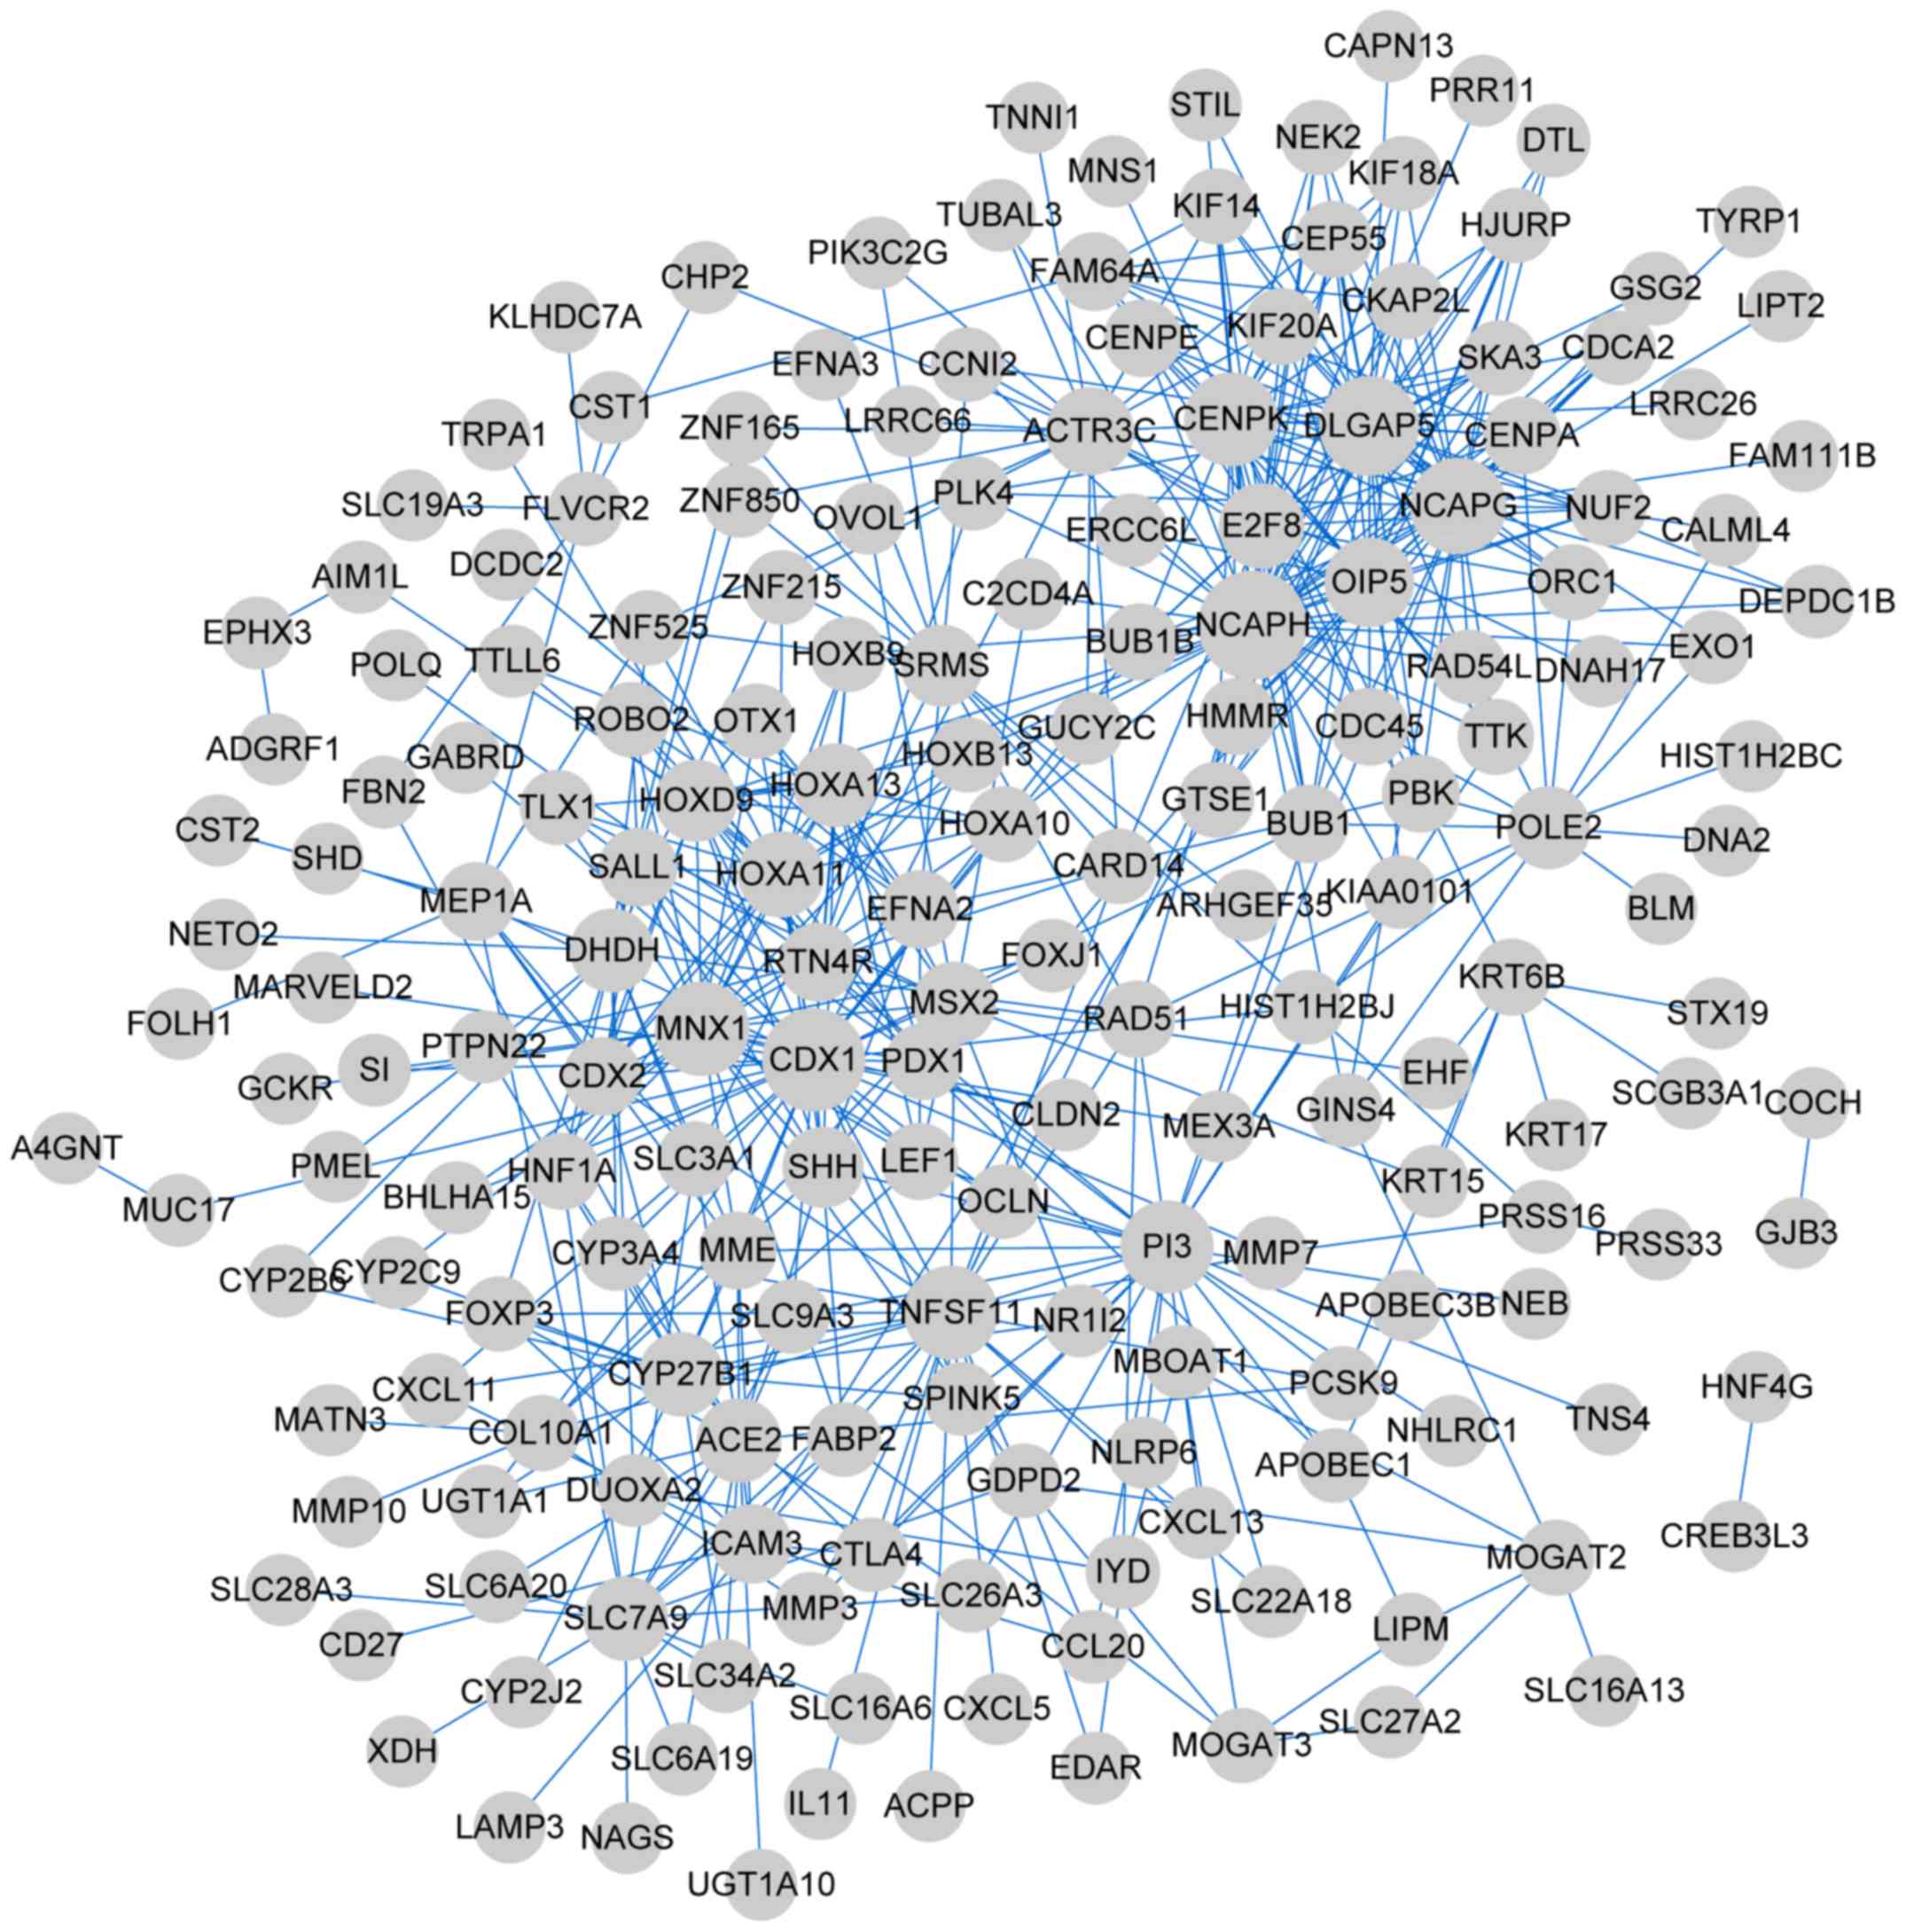
The genes in the four clusters were subjected to PPI
network analysis. The PPI network of cluster 1 comprised 192 nodes
(such as non-SMC condensin I complex subunit H) and 511 edges
(Fig. 4); cluster 2, 440 nodes
(such as mitogen-activated protein kinase 13 (MAPK13)) and
1,745 edges (Fig. 5); cluster 3,
385 nodes and 1,260 edges (Fig.
6); cluster 4, 40 nodes [glycogen phosphorylase, muscle
associated (PYGM)] and 47 edges (Fig. 7). The top five genes with high
degrees (hub genes) in the four networks are enlisted in Table III.
| Table III.Top five differentially expressed
genes with high degrees (hub genes) in four networks. |
Table III.
Top five differentially expressed
genes with high degrees (hub genes) in four networks.
| Cluster | Node number | Up DEGs | Down DEGs | Edge number | Degree top 5
gene |
|---|
| Cluster 1 | 192 | 192 | 0 | 511 | NCAPH, CDX1,
DLGAP5, NCAPG, MNX1 |
| Cluster 2 | 440 | 375 | 65 | 1,745 | GGT1, MAPK13, ENO2,
TRAP1, DUSP4 |
| Cluster 3 | 385 | 384 | 1 | 1,260 | AURKA, CDH17,
MYBL2, CDC6, CFTR |
| Cluster 4 | 40 | 0 | 47 | 47 | GHR, PYGM, CSF3,
STX1B, FAM149A |
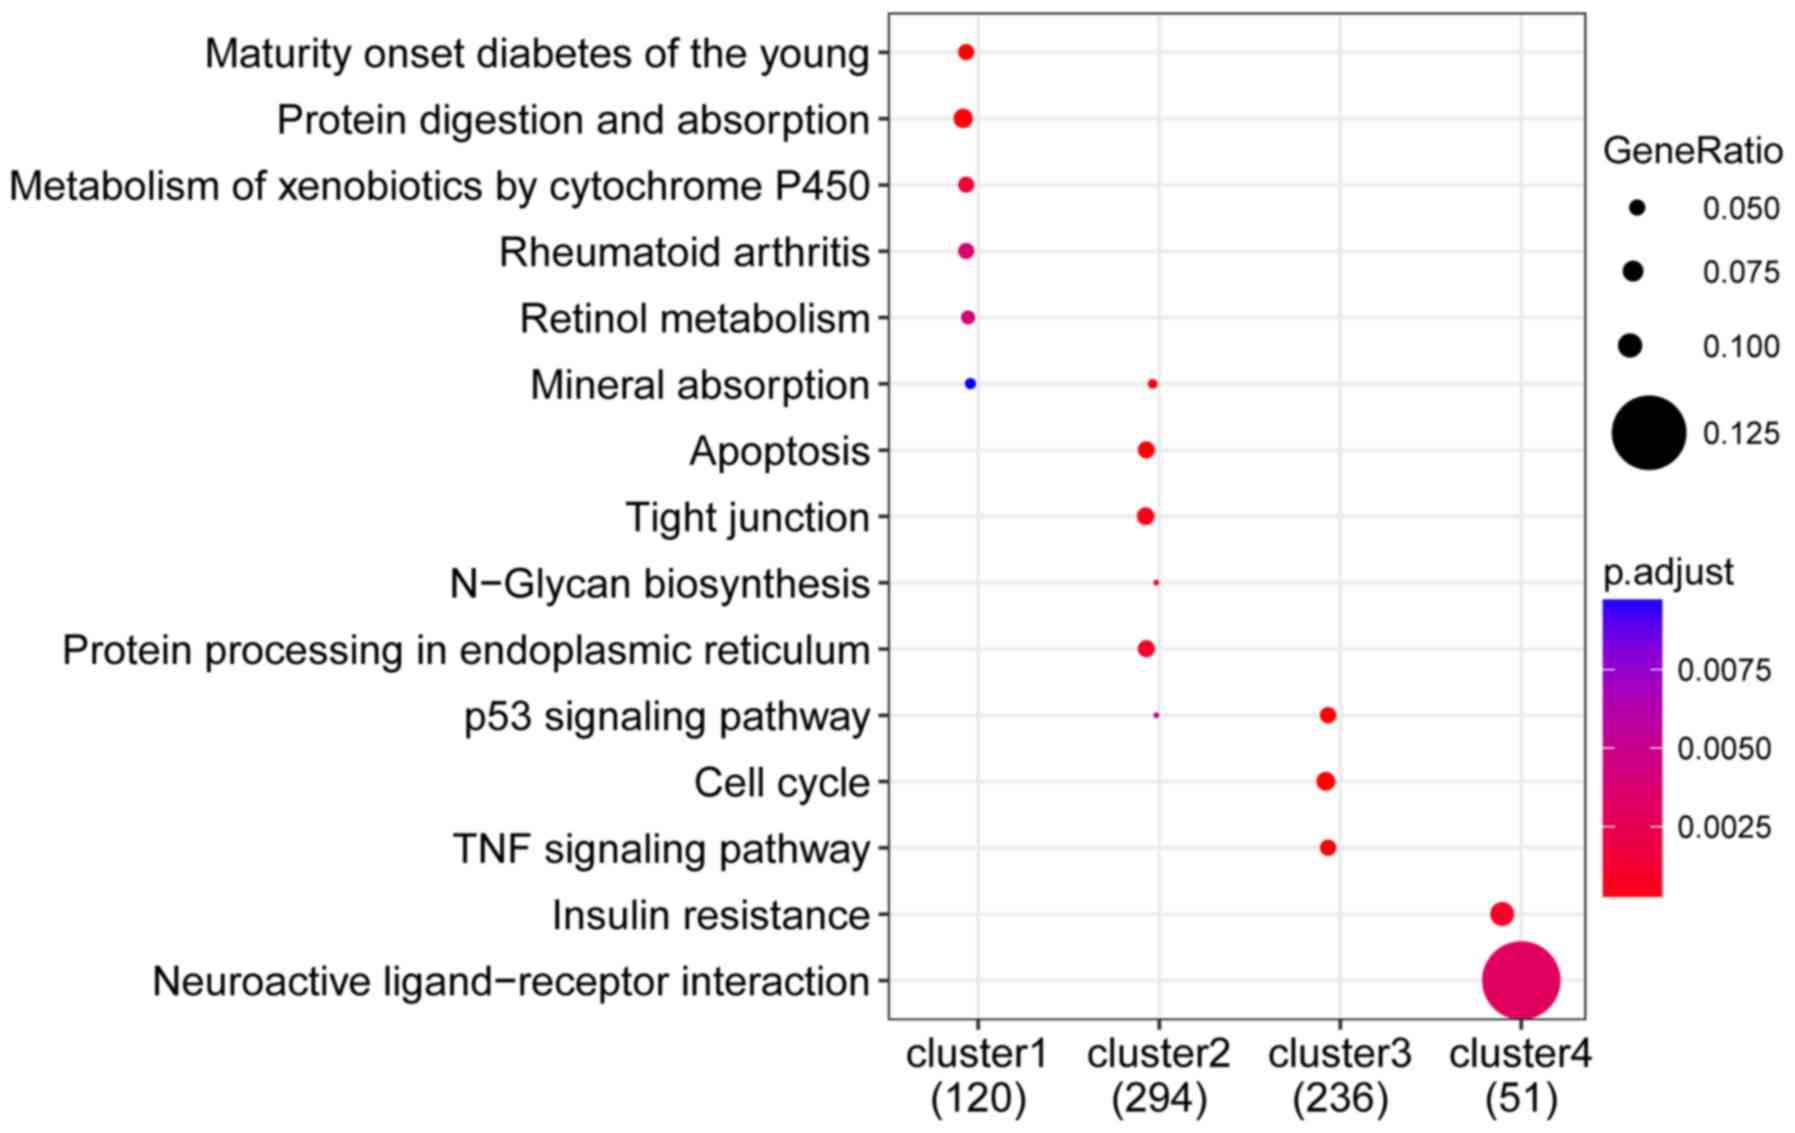
KEGG pathway enrichment analysis revealed that genes
in cluster 1 were significantly involved in Maturity-onset diabetes
among younger individuals, protein digestion and absorption, and
xenobiotic metabolism via cytochrome P450; cluster 2, majorly
involved in apoptosis, tight junction formation, and platelet
activation; cluster 3, primarily enriched in the p53 signaling
pathway, cell cycle, and TNF signaling pathway; cluster 4,
significantly enriched in insulin resistance and neuroactive
ligand-receptor interactions (Fig.
8).
Prognostic analysis
A total of 15 DEGs were identified to significantly
influence patient prognosis (Table
IV), including cystatin SA (CST2), coagulation factor II
thrombin receptor (F2R), Collagen triple helix repeat
containing 1 (CTHRC1), and RAS guanylreleasing protein 3
(RASGRP3). Furthermore, 9 genes were identified in cluster
3.
| Table IV.Differentially expressed genes that
significantly affect patient prognosis. |
Table IV.
Differentially expressed genes that
significantly affect patient prognosis.
| Names | p | High.median | Low.median | Regulated | Cluster |
|---|
| CST2 | 0.042178 | 22.17 | 46.22 | Up | 1 |
| CTSV | 0.03481 | 25.59 | 57.39 | Up | 1 |
| MATN3 | 0.000184 | 21.98 | 68.99 | Up | 1 |
| SYT12 | 0.040832 | 25.59 | 46.22 | Up | 1 |
| F2R | 0.013663 | 25.59 | 55.39 | Up | 2 |
| AADAC | 0.047637 | 25.69 | 55.39 | Up | 3 |
| AGT | 0.025573 | 26.02 | 55.39 | Up | 3 |
| TMEM243 | 0.031481 | 22.17 | 55.39 | Up | 3 |
| CTHRC1 | 0.001409 | 23.39 | 59.49 | Up | 3 |
| F5 | 0.001542 | 21.42 | 55.39 | Up | 3 |
| KYNU | 0.011683 | 25.03 | 59.49 | Up | 3 |
| MSC | 0.028155 | 25.16 | 46.22 | Up | 3 |
| RASGRP3 | 0.035342 | 25.59 | 42.51 | Up | 3 |
| SLC7A7 | 0.025332 | 22.17 | 42.51 | Up | 3 |
| ADPRHL1 | 0.043589 | 42.51 | 26.08 | Down | 4 |
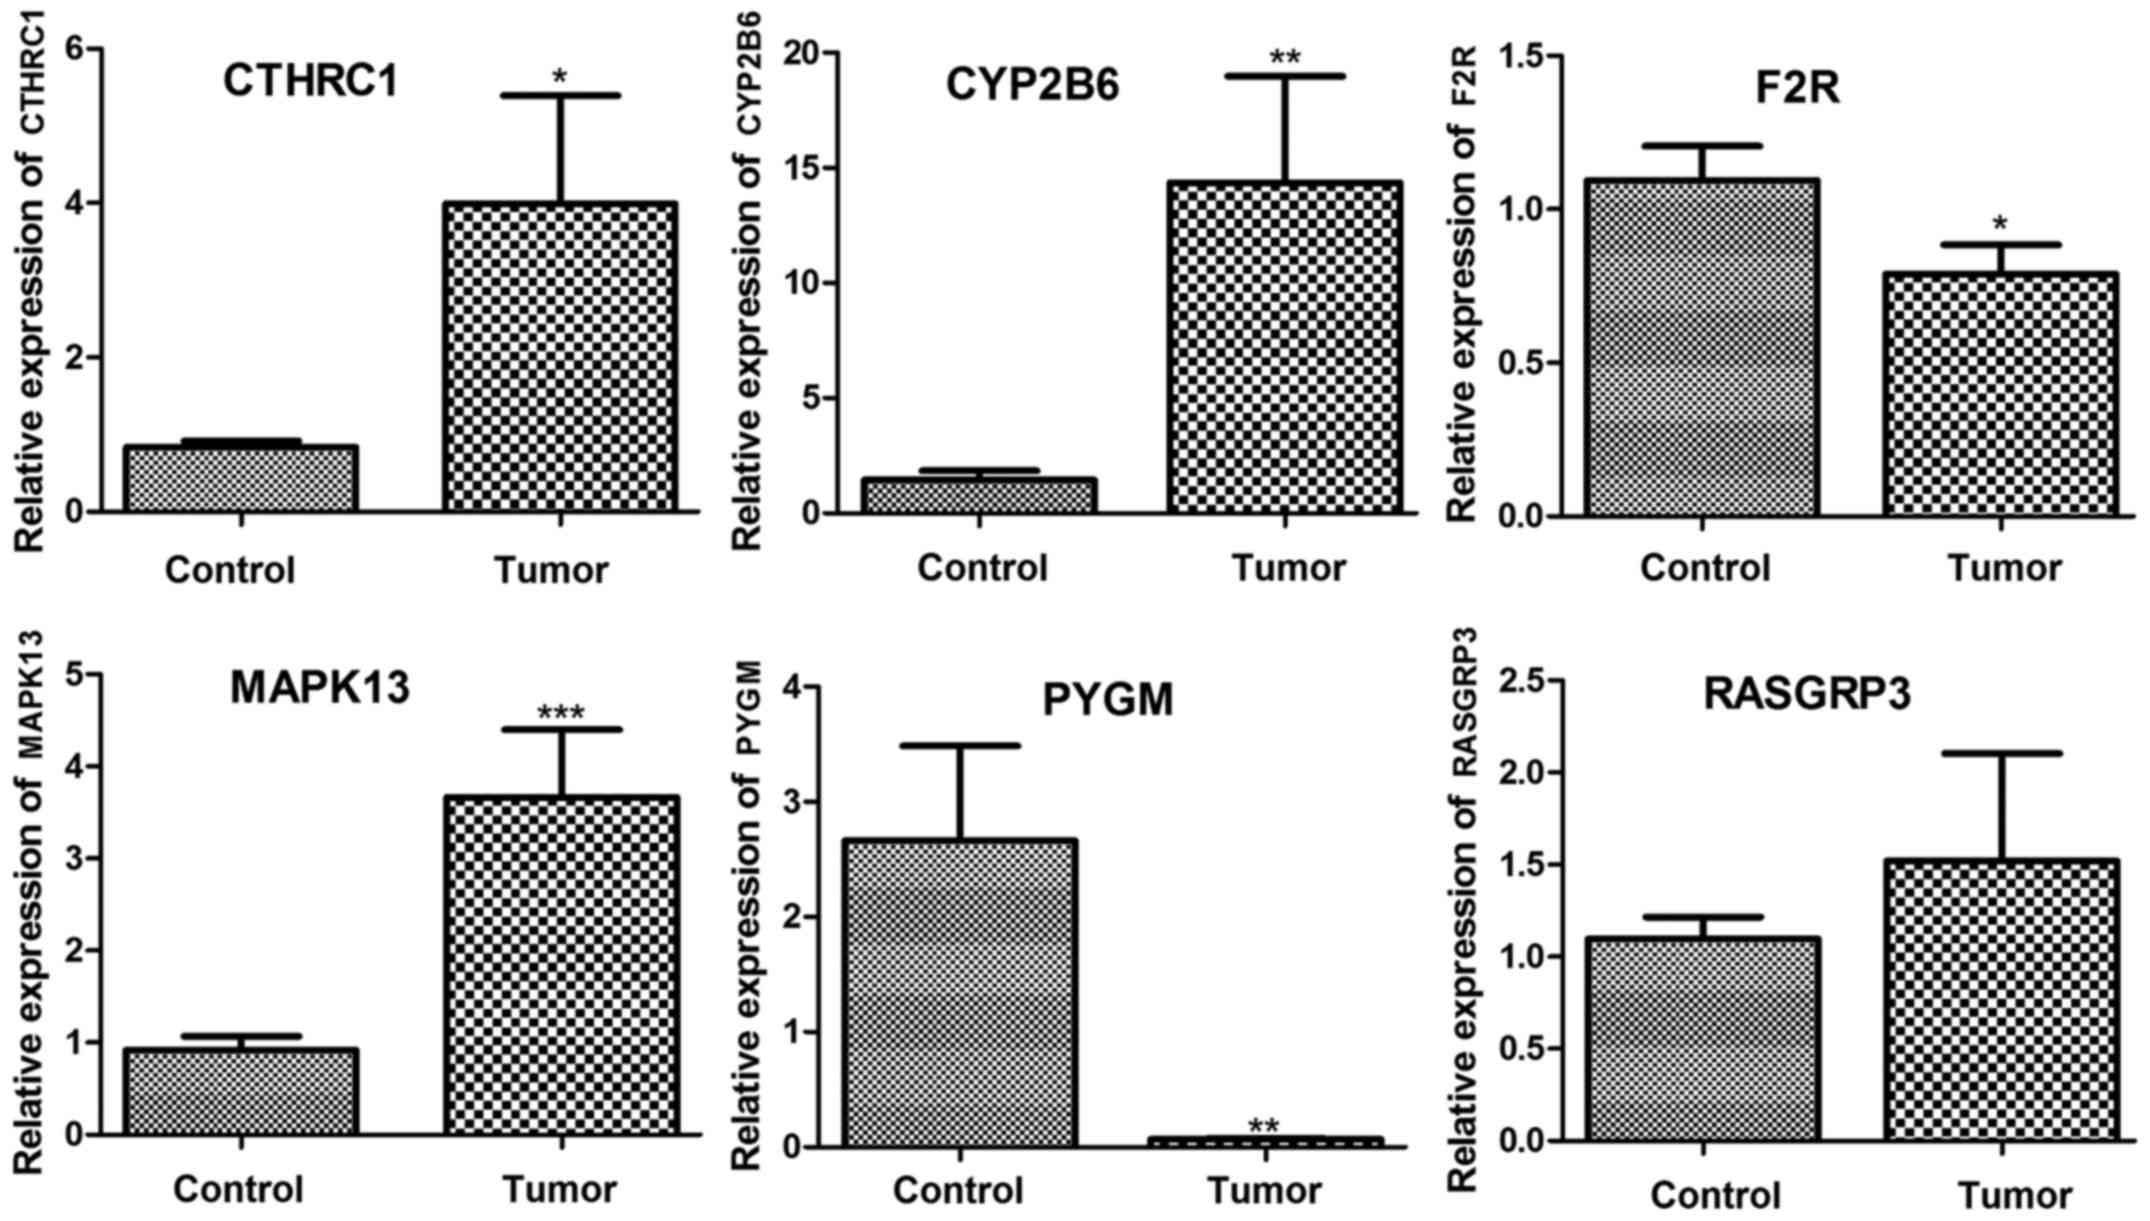
RT-qPCR verification of the expression
of key genes
Expression levels of CYP2B6, MAPK13, F2R, CTHRC,
RASGRP3, and PYGM were determined using RT-qPCR. As
shown in Fig. 9, CYP2B6,
MAPK13, and CTHRC were significantly upregulated in
tumor samples compared with that in control samples (P<0.05).
RASGRP3 was also upregulated in tumor tissue but the
difference was not significant. Additionally, F2R and
PYGM were significantly downregulated in tumor samples
compared with control (P<0.05). Taken together, the expression
levels of CYP2B6, MAPK13, CTHRC, RASGRP3 and PYGM
were consistent with our analysis results.
Discussion
In total, 1,477 upregulated and 282 downregulated
DEGs were screened out in tumor groups compared with the control.
These genes were segregated into 4 clusters. Genes in cluster 1
were significantly involved metabolism of xenobiotics via
cytochrome P450. Genes in cluster 2 were majorly involved in
apoptosis, tight junction formation, and platelet activation. Genes
in cluster 3 were primarily enriched in the p53 signaling pathway.
Genes in cluster 4 were significantly enriched in the insulin
resistance pathway. Furthermore, 15 DEGs were identified to
significantly influence patient prognosis, including F2R,
CTHRC1, and RASGRP3.
Cytochrome P450 enzymes are predominantly hepatic
enzymes involved in drug and xenobiotic metabolism (29). However, reactive intermediates are
formed during the conversion of the parent compound to the
hydrophilic conjugated product that is cleared via excretion. These
intermediates could cause genotoxicity and affect the
checkpoint-signaling and stress-signaling pathways to cause
aberrant cell growth and alter the cell cycle, thereby leading to
tumor initiation (30).
Interestingly, some cytochrome P450 family genes are correlated
with the progression of gastric adenocarcinoma (31). The present study shows that three
differentially expressed cytochrome P450 family genes (CYP2B6,
CYP2C9, and CYP3A4) of cluster 1 were significantly
enriched in xenobiotic metabolism via cytochrome P450 (hsa00980),
suggesting that these DEGs may be involved in the development of
gastric adenocarcinoma through xenobiotic metabolism via the
cytochrome P450 pathway.
DEGs in cluster 2 were significantly enriched in
apoptosis (hsa04210) and tight junction formation (hsa04530). These
two pathways are associated with gastric tumorigenesis (32,33).
Additionally, platelet activation (hsa04611) was also a significant
pathway among genes of cluster 2, which was enriched by
MAPK13 (a hub gene) and F2R (prognosis associated
gene). MAPK13 encodes the p38d isoform, which plays a role
in the tumor initiation (34).
Platelets are multifaceted cells, and circulating platelets can
influence various pathophysiologic events (35). Platelets exacerbate tumor
progression and metastasis (36,37).
In 1968, Gasic et al (38)
reported that thrombocytopenic mice are protected against
metastasis, supporting the relevance of platelets in cancer
progression. Together, pathways of apoptosis, tight junction
formation, and platelet activation, as well as MAPK13 and
F2R may play important roles in gastric adenocarcinoma.
Nevertheless, the F2R expression detected in RT-qPCR was
inconsistent with the analysis results. Therefore, further study
are needed to investigate the role of F2R in gastric
adenocarcinoma. Prognostic analysis revealed that most of the
obtained prognosis-associated genes were present in cluster 3,
including CTHRC1 and RASGRP3. CTHRC1 was first
identified during screening of differentially expressed sequences
between balloon-injured and normal rat arteries (39). It is overexpressed in several types
of malignant tumors, including gastric cancer (40). Tang et al (41) reported that CTHRC1 plays key
functional roles in cancer progression by increasing cancer cell
invasion and metastasis. RASGRP3 is a member of the RASGRP family
that was initially reported to be present in the screen of genes
whose overexpression induce fibroblast transformation (42). The involvement of the RasGRP family
in cancer progression and development is proving to be extensive
(43,44). RASGRP3 could mediate the activation
of the Ras signaling pathway, which plays a key role in
carcinogenesis (45). Considering
the critical roles of CTHRC1 and RASGRP3 in
carcinogenesis and the present results, we considered the two genes
as important prognostic markers in gastric adenocarcinoma.
PYGM, a hub gene in the PPI network of
cluster 4, was involved in the insulin resistance pathway
(hsa04931). Insulin resistance is a pathological condition
characterized by a decline in the efficiency of insulin signaling
for the regulation of blood sugar (46). Insulin is a potent mitogenic agent,
which can inhibit apoptosis and promote cell proliferation
(47). Trevisan et al
(48) reported that the variables
related to an increase in insulin resistance are related to an
increased risk of death from colorectal cancer. Furthermore, Mu
et al (49) reported that
insulin resistance was a risk factor for endometrial cancer.
Therefore, we speculated that PYGM may be implicated in
gastric adenocarcinoma via the insulin resistance pathway.
In conclusion, the present study suggested that
pathways of xenobiotic metabolism via cytochrome P450, apoptosis,
tight junction formation, platelet activation, and insulin
resistance as well as the enriched genes including CYP2B6,
MAPK13, and PYGM may play important roles in the
progression of gastric adenocarcinoma. Furthermore, CTHRC1
and RASGRP3 may serve as key prognostic markers for gastric
adenocarcinoma patients.
Acknowledgements
Not applicable.
Funding
This work was supported by The National Natural
Science Foundation of China (grant no. 81370496/H0308) and The
Fundamental Research Funds of Shandong University (grant no.
2014QLKY22).
Availability of data and materials
All data generated or analyzed during this study are
included in this published article.
Authors' contributions
WHZ and SZL contributed to the study design,
conducting the study, data analysis, and writing of the manuscript.
HXZ and ZBY contributed to the data collection and in conducting
the study. GYZ contributed to data interpretation and discussion.
All authors read and approved the final manuscript.
Ethics approval and consent to
participate
All procedures in this study were in accordance with
the Declaration of Helsinki and approved by the protection of human
ethics committee of Qilu Hospital of Shandong University.
Patient consent for publication
All patients provided informed consent for the
study.
Competing interests
The authors declare that they have no competing
interests.
References
|
1
|
Stewart B and Wild CP: World Cancer Report
2014. IARC press; Lyon: 2015
|
|
2
|
Lauren P: The two histological main types
of gastric carcinoma: Diffuse and so-called intestinal-type
carcinoma. An attempt at a histo-clinical classification. Acta
Pathol Microbiol Scand. 64:31–49. 1965. View Article : Google Scholar : PubMed/NCBI
|
|
3
|
Wadhwa R, Taketa T, Sudo K, Blum MA and
Ajani JA: Modern oncological approaches to gastric adenocarcinoma.
Gastroenterol Clin North Am. 42:359–369. 2013. View Article : Google Scholar : PubMed/NCBI
|
|
4
|
Wagner AD, Grothe W, Haerting J, Kleber G,
Grothey A and Fleig WE: Chemotherapy in advanced gastric cancer: A
systematic review and meta-analysis based on aggregate data. J Clin
Oncol. 24:2903–2909. 2006. View Article : Google Scholar : PubMed/NCBI
|
|
5
|
Chen X, Leung SY, Yuen ST, Chu KM, Ji J,
Li R, Chan AS, Law S, Troyanskaya OG, Wong J, et al: Variation in
gene expression patterns in human gastric cancers. Mol Biol Cell.
14:3208–3215. 2003. View Article : Google Scholar : PubMed/NCBI
|
|
6
|
Boussioutas A, Li H, Liu J, Waring P, Lade
S, Holloway AJ, Taupin D, Gorringe K, Haviv I, Desmond PV and
Bowtell DD: Distinctive patterns of gene expression in premalignant
gastric mucosa and gastric cancer. Cancer Res. 63:2569–2577.
2003.PubMed/NCBI
|
|
7
|
Tan P and Yeoh KG: Genetics and molecular
pathogenesis of gastric adenocarcinoma. Gastroenterology.
149:1153–1162.e3. 2015. View Article : Google Scholar : PubMed/NCBI
|
|
8
|
Pharoah PD, Guilford P and Caldas C;
International Gastric Cancer Linkage Consortium, : Incidence of
gastric cancer and breast cancer in CDH1 (E-cadherin) mutation
carriers from hereditary diffuse gastric cancer families.
Gastroenterology. 121:1348–1353. 2001. View Article : Google Scholar : PubMed/NCBI
|
|
9
|
Chang HR, Nam S, Kook MC, Kim KT, Liu X,
Yao H, Jung HR, Lemos R Jr, Seo HH, Park HS, et al: HNF4α is a
therapeutic target that links AMPK to WNT signalling in early-stage
gastric cancer. Gut. 1–32. 2014.
|
|
10
|
Kim YH, Liang H, Liu X, Lee JS, Cho JY,
Cheong JH, Kim H, Li M, Downey TJ, Dyer MD, et al: AMPKα modulation
in cancer progression: Multilayer integrative analysis of the whole
transcriptome in Asian gastric cancer. Cancer Res. 72:2512–2521.
2012. View Article : Google Scholar : PubMed/NCBI
|
|
11
|
Mäder U, Nicolas P, Richard H, Bessières P
and Aymerich S: Comprehensive identification and quantification of
microbial transcriptomes by genome-wide unbiased methods. Curr Opin
Biotechnol. 22:32–41. 2011. View Article : Google Scholar : PubMed/NCBI
|
|
12
|
Zhang P, Li C, Zhu L, Su X, Li Y, Jin C
and Li T: De novo assembly of the sea cucumber Apostichopus
japonicus hemocytes transcriptome to identify miRNA targets
associated with skin ulceration syndrome. PLoS One. 8:1254–1256.
2013.
|
|
13
|
Schmieder R and Edwards R: Quality control
and preprocessing of metagenomic datasets. Bioinformatics.
27:863–864. 2011. View Article : Google Scholar : PubMed/NCBI
|
|
14
|
Kim D, Pertea G, Trapnell C, Pimentel H,
Kelley R and Salzberg SL: TopHat2: Accurate alignment of
transcriptomes in the presence of insertions, deletions and gene
fusions. Genome Biol. 14:R362013. View Article : Google Scholar : PubMed/NCBI
|
|
15
|
Anders S, Pyl PT and Huber W: HTSeq-a
Python framework to work with high-throughput sequencing data.
Bioinformatics. 31:166–169. 2015. View Article : Google Scholar : PubMed/NCBI
|
|
16
|
Robinson MD, McCarthy DJ and Smyth GK:
edgeR: A Bioconductor package for differential expression analysis
of digital gene expression data. Bioinformatics. 26:139–140. 2010.
View Article : Google Scholar : PubMed/NCBI
|
|
17
|
McCarthy DJ, Chen Y and Smyth GK:
Differential expression analysis of multifactor RNA-Seq experiments
with respect to biological variation. Nucleic Acids Res.
40:4288–4297. 2012. View Article : Google Scholar : PubMed/NCBI
|
|
18
|
Law CW, Chen Y, Shi W and Smyth GK: voom:
Precision weights unlock linear model analysis tools for RNA-seq
read counts. Genome biol. 15:R292014. View Article : Google Scholar : PubMed/NCBI
|
|
19
|
Smyth GK: Limma: Linear models for
microarray dataBioinformatics and computational biology solutions
using R and Bioconductor. Springer; New York, NY: pp. 397–420.
2005, View Article : Google Scholar
|
|
20
|
Kolde R: pheatmap: Pretty heatmaps. R
package version 1.0. 8. 2015.
|
|
21
|
Ashburner M, Ball CA, Blake JA, Botstein
D, Butler H, Cherry JM, Davis AP, Dolinski K, Dwight SS, Eppig JT,
et al: Gene ontology: Tool for the unification of biology. The gene
ontology consortium. Nat Genet. 25:25–29. 2000. View Article : Google Scholar : PubMed/NCBI
|
|
22
|
Kanehisa M and Goto S: KEGG: Kyoto
encyclopedia of genes and genomes. Nucleic Res. 28:27–30. 2000.
View Article : Google Scholar
|
|
23
|
Wilkerson MD and Hayes DN:
ConsensusClusterPlus: A class discovery tool with confidence
assessments and item tracking. Bioinformatics. 26:1572–1573. 2010.
View Article : Google Scholar : PubMed/NCBI
|
|
24
|
Xue B, Oldfield CJ, Dunker AK and Uversky
VN: CDF it all: Consensus prediction of intrinsically disordered
proteins based on various cumulative distribution functions. FEBS
Lett. 583:1469–1474. 2009. View Article : Google Scholar : PubMed/NCBI
|
|
25
|
Szklarczyk D, Franceschini A, Wyder S,
Forslund K, Heller D, Huerta-Cepas J, Simonovic M, Roth A, Santos
A, Tsafou KP, et al: STRING v10: Protein-protein interaction
networks, integrated over the tree of life. Nucleic Acids Res.
43:D447–D452. 2015. View Article : Google Scholar : PubMed/NCBI
|
|
26
|
Shannon P, Markiel A, Ozier O, Baliga NS,
Wang JT, Ramage D, Amin N, Schwikowski B and Ideker T: Cytoscape: A
software environment for integrated models of biomolecular
interaction networks. Genome Res. 13:2498–2504. 2003. View Article : Google Scholar : PubMed/NCBI
|
|
27
|
Yu Tang ML, Jianxin, Wang Yi and Pan
Fang-Xiang Wu: CytoNCA: A cytoscape plugin for centrality analysis
and evaluation of biological networks. Biosystems. 127:67–72. 2015.
View Article : Google Scholar : PubMed/NCBI
|
|
28
|
He X and Zhang J: Why do hubs tend to be
essential in protein networks? PLoS Genet. 2:e882006. View Article : Google Scholar : PubMed/NCBI
|
|
29
|
Nebert DW and Dalton TP: The role of
cytochrome P450 enzymes in endogenous signalling pathways and
environmental carcinogenesis. Nat Rev Cancer. 6:9472006. View Article : Google Scholar : PubMed/NCBI
|
|
30
|
Nebert DW and Russell DW: Clinical
importance of the cytochromes P450. Lancet. 360:1155–1162. 2002.
View Article : Google Scholar : PubMed/NCBI
|
|
31
|
Tsukino H, Kuroda Y, Qiu D, Nakao H, Imai
H and Katoh T: Effects of cytochrome P450 (CYP) 2A6 gene deletion
and CYP2E1 genotypes on gastric adenocarcinoma. Int J Cancer.
100:425–428. 2002. View Article : Google Scholar : PubMed/NCBI
|
|
32
|
Lee SK, Moon J, Park SW, Song SY, Chung JB
and Kang JK: Loss of the tight junction protein claudin 4
correlates with histological growth-pattern and differentiation in
advanced gastric adenocarcinoma. Oncol Rep. 13:193–199.
2005.PubMed/NCBI
|
|
33
|
Johnson AH, Frierson HF, Zaika A, Powell
SM, Roche J, Crowe S, Moskaluk CA and El-Rifai W: Expression of
tight-junction protein claudin-7 is an early event in gastric
tumorigenesis. Am J Pathol. 167:577–584. 2005. View Article : Google Scholar : PubMed/NCBI
|
|
34
|
Yasuda K, Hirohashi Y, Kuroda T, Takaya A,
Kubo T, Kanaseki T, Tsukahara T, Hasegawa T, Saito T, Sato N and
Torigoe T: MAPK13 is preferentially expressed in gynecological
cancer stem cells and has a role in the tumor-initiation. Biochem
Biophys Res Commun. 472:643–647. 2016. View Article : Google Scholar : PubMed/NCBI
|
|
35
|
Franco AT, Corken A and Ware J: Platelets
at the interface of thrombosis, inflammation and cancer. Blood.
126:582–588. 2015. View Article : Google Scholar : PubMed/NCBI
|
|
36
|
Nash GF, Turner LF, Scully MF and Kakkar
AK: Platelets and cancer. Lancet Oncol. 3:4252002. View Article : Google Scholar : PubMed/NCBI
|
|
37
|
Taucher S, Salat A, Gnant M, Kwasny W,
Mlineritsch B, Menzel RC, Schmid M, Smola MG, Stierer M, Tausch C,
et al: Impact of pretreatment thrombocytosis on survival in primary
breast cancer. Thromb Haemost. 89:1098–1106. 2003. View Article : Google Scholar : PubMed/NCBI
|
|
38
|
Gasic GJ, Gasic TB and Stewart CC:
Antimetastatic effects associated with platelet reduction. Proc
Natl Acad Sci USA. 61:pp. 46–52. 1968; View Article : Google Scholar : PubMed/NCBI
|
|
39
|
Pyagay P, Heroult M, Wang Q, Lehnert W,
Belden J, Liaw L, Friesel RE and Lindner V: Collagen triple helix
repeat containing 1, a novel secreted protein in injured and
diseased arteries, inhibits collagen expression and promotes cell
migration. Circ Res. 96:261–268. 2005. View Article : Google Scholar : PubMed/NCBI
|
|
40
|
Wang P, Wang YC, Chen XY, Shen ZY, Cao H,
Zhang YJ, Yu J, Zhu JD, Lu YY and Fang JY: CTHRC1 is upregulated by
promoter demethylation and transforming growth factor-β1 and may be
associated with metastasis in human gastric cancer. Cancer Sci.
103:1327–1333. 2012. View Article : Google Scholar : PubMed/NCBI
|
|
41
|
Tang L, Dai DL, Su M, Martinka M, Li G and
Zhou Y: Aberrant expression of collagen triple helix repeat
containing 1 in human solid cancers. Clin Cancer Res. 12:3716–3722.
2006. View Article : Google Scholar : PubMed/NCBI
|
|
42
|
Ebinu JO, Bottorff DA, Chan EY, Stang SL,
Dunn RJ and Stone JC: RasGRP, a Ras guanyl nucleotide-releasing
protein with calcium-and diacylglycerol-binding motifs. Science.
280:1082–1086. 1998. View Article : Google Scholar : PubMed/NCBI
|
|
43
|
Lauchle JO, Kim D, Le DT, Akagi K, Crone
M, Krisman K, Warner K, Bonifas JM, Li Q, Coakley KM, et al:
Response and resistance to MEK inhibition in leukaemias initiated
by hyperactive Ras. Nature. 461:411–414. 2009. View Article : Google Scholar : PubMed/NCBI
|
|
44
|
Oki-Idouchi CE and Lorenzo PS: Transgenic
overexpression of RasGRP1 in mouse epidermis results in spontaneous
tumors of the skin. Cancer Res. 67:276–280. 2007. View Article : Google Scholar : PubMed/NCBI
|
|
45
|
Yang D, Kedei N, Li L, Tao J, Velasquez
JF, Michalowski AM, Tóth BI, Marincsák R, Varga A, Bíró T, et al:
RasGRP3 contributes to formation and maintenance of the prostate
cancer phenotype. Cancer Res. 70:7905–7917. 2010. View Article : Google Scholar : PubMed/NCBI
|
|
46
|
Djiogue S, Kamdje AH, Vecchio L, Kipanyula
MJ, Farahna M, Aldebasi Y and Seke Etet PF: Insulin resistance and
cancer: the role of insulin and IGFs. Endocr Relat Cancer.
20:R1–R17. 2013. View Article : Google Scholar : PubMed/NCBI
|
|
47
|
Bruce W and Corpet D: The colonic protein
fermentation and insulin resistance hypotheses for colon cancer
etiology: Experimental tests using precursor lesions. Eur J Cancer
Prev. 5:41–47. 1996. View Article : Google Scholar : PubMed/NCBI
|
|
48
|
Trevisan M, Liu J, Muti P, Misciagna G and
Menotti A; Risk Factors and Life Expectancy Research Group, :
Markers of insulin resistance and colorectal cancer mortality.
Cancer Epidemiol Biomarkers Prev. 10:937–941. 2001.PubMed/NCBI
|
|
49
|
Mu N, Zhu Y, Wang Y, Zhang H and Xue F:
Insulin resistance: A significant risk factor of endometrial
cancer. Gynecol Oncol. 125:751–757. 2012. View Article : Google Scholar : PubMed/NCBI
|