Introduction
Colorectal cancer (CRC) is the third most common
malignancy and one of the leading causes of cancer-associated
mortality worldwide (1). For tumor
molecular profiling of CRC, several organizations have completed
large-scale sequencing projects, including The Cancer Genome Atlas
(TCGA) (2), Dana-Farber Cancer
Institute (DFCI) (3), Memorial
Sloan Kettering Cancer Center (4)
and Genentech, Inc. (5).
Exome-wide sequencing has identified recurrent gene mutations and
dysregulated signaling pathways that may contribute to
carcinogenesis, including APC, WNT signaling pathway
regulator (APC), tumor protein p53 (TP53),
KRAS proto-oncogene, GTPase (KRAS) and titin
(TTN) genes, and the WNT, tumor growth factor-β,
phosphoinositide 3-kinase and P53 signaling pathways (2). TCGA has detailed subgroups of tumors
characterized by hypermutation (16%), or by a high degree of
microsatellite instability (MSI-H) and non-hypermutated (84%).
Together with clinical annotations, these molecular profiling
methods can be used to identify potentially actionable tumor
biomarkers that may be useful for clinical practice.
Over the past decades, the 5-year relative survival
rate of patients with CRC has increased markedly (6). In China, ~376,000 people are
diagnosed with CRC per year, which is 2.5 times higher than in the
United States (7,8). Additionally, 5-year relative survival
is substantially lower in China (~47.2%) compared with in the
United States (~66%) (9). In
China, survival of patients with CRC in urban areas, including
Shanghai, is markedly higher than in rural areas, due to
differences in socioeconomics and healthcare standards (9). Next-generation sequencing enables
precision medicine, the tailoring of treatments based on unique
genomic variations of each patient's tumor. Sequencing a panel of
CRC-associated genes may identify actionable genomic driver
mutations and further determine mutational burden in CRC, which is
more cost effective, efficient and achieves higher sequencing depth
than whole-exome sequencing. CRC panel design is mainly based on
the TCGA database. Sequencing data generated from TCGA (2) or previous studies (3–5) are
essential sources, but tumors from Asian populations have not been
the subject of comprehensive evaluation. Furthermore, in the
previous studies (10–13) almost all exome-wide sequencing in
CRC, including whole-exome sequencing and target sequencing, were
limited to the detection of single nucleotide variations (SNVs) and
small insertion and deletions (InDels) in genes. While structure
variations, including copy number variation (CNV) and chromosomal
rearrangement, are also key factors in the process of cancer
development.
In the present study, 10 CRC patients were recruited
at the Shanghai Tenth People's Hospital (Shanghai, China) as a
representative sample of CRC patients in the Shanghai Han
population and Chinese urban population. The whole genomes of the
10 CRC patient tumors and matched normal tissues were sequenced. A
comprehensive analysis was performed, including identification of
SNVs, InDels, CNVs and chromosomal rearrangement, which not only
validated results from TCGA to a certain extent, but also resulted
in novel findings.
Patients and methods
Patients and samples
Fresh primary colorectal tumor tissues and matched
adjacent normal tissues were collected from 10 patients with
pathologically confirmed CRC at the Shanghai Tenth People's
Hospital Affiliated to Tongji University between March and May
2015. Patient clinical characteristics are presented in Table I. Patients were numbered CRC-1 to
10. The median age was 62 years (range, 43–82 years), 6 cases were
female, 8 cases exhibited colon cancer and 2 were rectal cancer. No
patients had received therapeutic procedures, including
chemotherapy or radiotherapy. Samples were frozen immediately in
liquid nitrogen and stored at −80°C prior to analysis.
 | Table I.Clinical characteristics of ten
colorectal cancer patients. |
Table I.
Clinical characteristics of ten
colorectal cancer patients.
| Patients | Sex | Age | Clinical
diagnosis | MSI | TNM stage |
Differentiation | Location | Size (cm) | Lymphatic
metastasis | Distant
metastasis |
|---|
| CRC-1 | Female | 62 | Colon cancer | MSS | T3N0M0 | Moderately | Sigmoid colon | 6×4×1 | 0/12 | No |
| CRC-2 | Female | 68 | Colon cancer | MSS | T3N1M0 | Moderately | Right colon | 7×4.5×4 | 1/9 | No |
| CRC-3 | Female | 58 | Rectal cancer | MSS | T4N1M0 | Moderately | Rectum | 4.5×3×3 | 1/5 | No |
| CRC-4 | Male | 80 | Colon cancer | MSS | T3N1M0 |
Poorly-moderately | Ascending
colon | 4×3×1.5 | 3/13 | No |
| CRC-5 | Male | 57 | Colon cancer | MSS | T1N0M0 |
Moderately-well | Colon | 1×1.5×1 | 0/5 | No |
| CRC-6 | Female | 75 | Colon cancer | MSS | T4aN1M1 | Moderately | Ascending
colon | 9.5×7×2.5 | 1/14 | Yes |
| CRC-7 | Male | 82 | Rectal cancer | MSI-L | T4bN0M0 | Moderately | Rectum | 6×5.5×1.5 | 0/15 | No |
| CRC-8 | Male | 62 | Colon cancer | MSS | T3N0M0 | Moderately | Transverse
colon | 4×3.5×2 | 0/12 | No |
| CRC-9 | Female | 60 | Colon cancer | MSI-H | T4bN0M0 |
Poorly-moderately | Transverse
colon | 6×4.5×4 | 0/17 | No |
| CRC-10 | Female | 43 | Colon cancer | MSS | T1N1M0 |
Moderately-well | Colon | 5.5×5×4 | 1/15 | No |
DNA extraction
DNA was extracted from fresh frozen tissue using
QIAamp DNA Minikit (Qiagen GmbH, Hilden, Germany) according to the
manufacturers' protocol. DNA was quantified using the Qubit
Fluorometer (Invitrogen; Thermo Fisher Scientific, Inc., Waltham,
MA, USA).
Library preparation
A total of 0.5 µg DNA per sample was used as input
material for the DNA library preparations. A sequencing library was
generated using Truseq Nano DNA HT Sample Prep kit (Illumina, Inc.,
San Diego, CA, USA) following the manufacturer's recommendations
and index codes were added to each sample. Briefly, genomic DNA
samples were fragmented by sonication to a size of ~350 bp (duty
factor 10%, peak incident power 175, cycles per burst 200,
treatment time 180 seconds, bath temperature 4–8°C). Then, DNA
fragments were end polished, A-tailed and ligated with the
full-length adapter for Illumina sequencing, followed by further
polymerase chain reaction (PCR) amplification using KAPA HiFi
HotStart ReadyMix (Kapa Biosystems, Inc., Wilmington, MA, USA).
Primers are based on the P5 and P7 Illumina flow cell sequences,
and are suitable for the amplification of libraries prepared with
full-length adapters (P5: 5′-AATGATACGGCGACCACCGAGATC-3′, P7:
5′-CAAGCAGAAGACGGCATACGA-3′). Thermocycling conditions: Initial
denaturation 98°C for 45 sec, denaturation 98°C for 15 sec,
annealing 60°C for 30 sec, extension 72°C for 30 sec, library
amplification with 3 cycles and final extension 72°C for 1 min,
hold at 4°C. Subsequently, PCR products were purified by the AMPure
XP system (Beckman Coulter, Inc., Brea, CA, USA), libraries were
analyzed for size distribution by Agilent2100 Bioanalyzer (Agilent
Technologies, Inc., Santa Clara, CA, USA) and quantified by
quantitative PCR (3 nM) using KAPA Library Quantification kits
(Kapa Biosystems, Inc.) according to the manufacturer's protocol.
The primers were the same as for the amplification procedure (P5:
5′-AATGATACGGCGACCACCGAGATC-3′, P7: 5′-CAAGCAGAAGACGGCATACGA-3′).
qPCR protocol for library quantification consists of an initial
denaturation step at 95°C for 5 min followed by 35 cycles of
denaturation at 95°C for 30 sec and combined annealing/extension at
60°C for 45 sec. A total of 6 pre-diluted DNA Standards and
appropriately diluted NGS libraries are amplified at the same time.
The average Cq value for each DNA standard was plotted against its
known concentration to generate a standard curve. The standard
curve is used to convert the average Cq values for diluted
libraries to concentration, from which the working concentration of
each library is calculated.
Clustering and sequencing
The clustering of the index-coded samples was
performed on a cBot Cluster Generation System using HiseqX PE
Cluster kit V2.5 (Illumina, Inc.) according to the manufacturer's
protocol. Following cluster generation, the DNA libraries were
sequenced using the IlluminaHiseq platform and 150 bp paired-end
reads were generated.
Bioinformatics analysis
For whole-genome sequencing, clean data was obtained
following filtering adapter, low quality reads and reads with
proportion of N>10%. Reads were aligned to the reference human
genome (UCSC hg19; http://genome.ucsc.edu/) (14) using the Burrows-Wheeler Aligner v.
0.7.12 (15). Next, the Picard and
Genome Analysis Toolkit (GATK v.3.2) (16) method was adopted for duplicate
removal, local realignment and Base Quality Score Recalibration,
and generated quality statistics, including mapped reads, mean
mapping quality and mean coverage. Finally, the GATK
HaplotypeCaller was used for SNV and InDel identification.
Variants were annotated using the ANNOVAR software
tool (17). Annotations for
mutation function (including frameshift insertion/deletion,
non-frameshift insertion/deletion, synonymous SNV, nonsynonymous
SNV and stopgain stoploss), mutation location [including exonic,
intronic, splicing, upstream, downstream, 3′untranslated region
(UTR) and 5′UTR], amino acid changes, 1000 Genomes Project data and
dbSNP reference number were performed.
Somatic SNVs and InDels of tumors compared with
matched normal tissue were named and functionally annotated using
MuTect v. 1.1.4 (16) and Varscan2
v. 2.3.9 (18) software. Somatic
mutations in coding regions were filtered (Frame_Shift_Del,
Frame_Shift_Ins, In_Frame_Del, In_Frame_Ins, Missense_Mutation,
Nonsense_Mutation and Nonstop_Mutation) along with challenging
regions (3′Flank, 3′UTR, 5′Flank, 5′UTR, intergenic region,
Splice_Site, Translation_Start_Site, RNA, Splice_Site,
Translation_Start_Site). The mutations with variant allele
frequency >5% were defined as high confidence mutations.
MutSigCV v.0.9 (19) was used to
identify significantly mutated genes (q≤0.1). Then, gene mutation
data were downloaded from TCGA database (https://tcga-data.nci.nih.gov/docs/publications/coadread_2012/)
(2) and comparative analysis was
performed using the sequencing data produced in the present
study.
Control-FREEC v.8.7 (20) software was used for identifying and
annotating CNVs, including gain, loss or copy neutral loss of
heterozygosity. Structural variations, including inversion,
intra-chromosomal translocation and inter-chromosomal
translocation, were identified using Factera (21) software.
The mutation landscape across a cohort, including
SNVs, InDels and mutational burden, were created by Genomic
Visualizations in R (GenVisR) (22). The custom mutation lists of
proteins were visualized by MutationMapper tool from cBioPortal
(http://www.cbioportal.org/mutation_mapper.jsp) and
structural variants, and copy number data were visualized using
CIRCOS version 0.69 (http://www.circos.ca/) (23). Gene ontology (GO: http://www.geneontology.org/) and Kyoto Encyclopedia
of Genes and Genomes (KEGG: http://www.kegg.jp/) enrichment analysis was performed
to investigate the biological importance of the somatic mutated
genes using the ClusterProfiler in R software
(10.18129/B9.bioc.clusterProfiler).
Results
Clinical and sequencing data
The 10 CRC samples were analyzed (Table I). The microsatellite instability
status of the CRC-9 tumor was high (MSI-H), the CRC-7 tumor was low
(MSI-L) and others were microsatellite stable.
Whole-genome sequencing achieved an average of 27.8×
coverage of the tumor genomes and 27.9× coverage of the germline
genome (Table II). Somatic DNA
alterations were analyzed, including SNVs, InDels, CNVs and
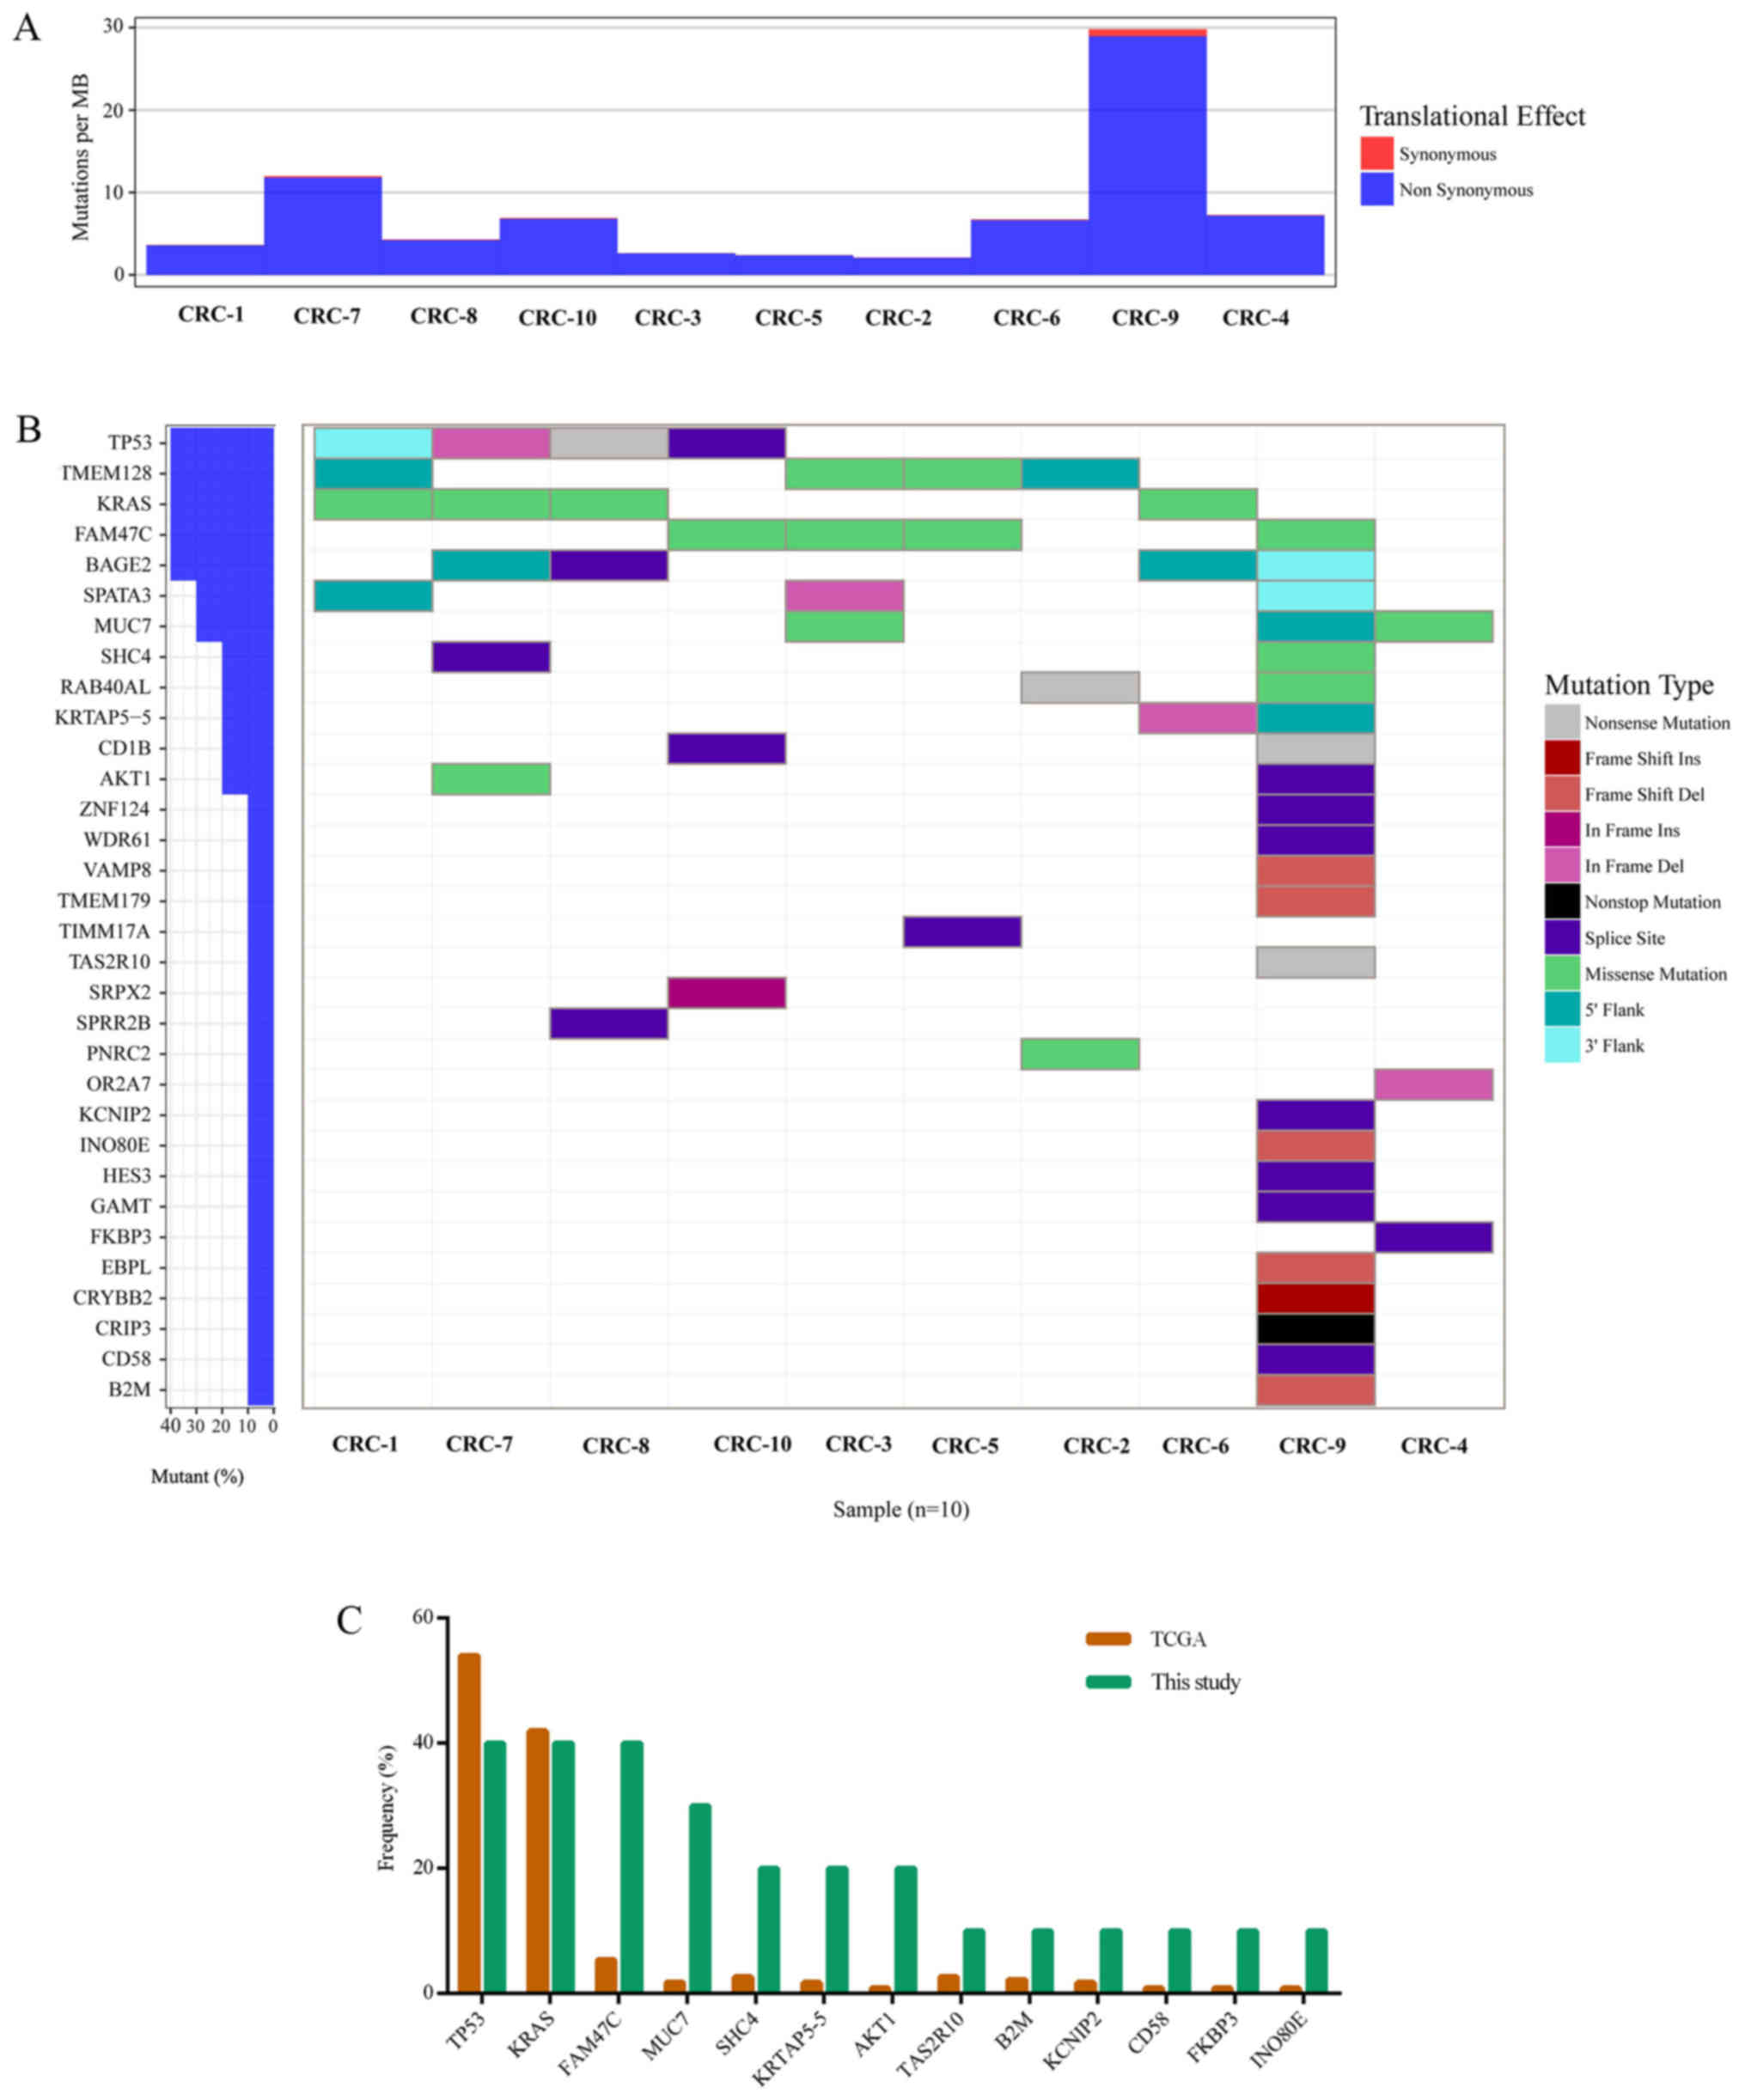
chromosomal rearrangements. An overall mutation rate of ~7.78 per
Mb with a range of 2.11–29.79 mutations per Mb was calculated
(Table II; Fig. 1A). In study of TCGA (2), cases with mutation rates >12 per
Mb were designated as hypermutated. The mutation rate of CRC-9 was
29.79 per Mb in the present study, which was the only hypermutated
case (Fig. 1A).
| Table II.Summary of whole-genome sequencing
results from each patients' tissues. |
Table II.
Summary of whole-genome sequencing
results from each patients' tissues.
| Patients | Tumor coverage | Normal
coverage | Mutations | Mutations per
Mb |
|---|
| CRC-1 | 29.9 | 29.4 | 1092 | 3.64 |
| CRC-2 | 27.9 | 29.0 | 634 | 2.11 |
| CRC-3 | 26.9 | 28.2 | 790 | 2.63 |
| CRC-4 | 25.7 | 27.0 | 2180 | 7.27 |
| CRC-5 | 26.6 | 28.8 | 716 | 2.39 |
| CRC-6 | 26.7 | 27.2 | 2021 | 6.74 |
| CRC-7 | 29.0 | 25.7 | 3597 | 11.99 |
| CRC-8 | 29.9 | 29.1 | 1288 | 4.29 |
| CRC-9 | 27.8 | 27.6 | 8937 | 29.79 |
| CRC-10 | 28.1 | 26.6 | 2071 | 6.90 |
| Average | 27.8 | 27.9 | 2332 | 7.78 |
Significantly mutated somatic
genes
The MutSigCV tool was used to define significantly
mutated genes and identified 32 significantly mutated genes
(Fig. 1B). Fig. 1 presents the significantly mutated
genes (Fig. 1B), mutation type
(Fig. 1B), frequency and tumor
mutation burden (Fig. 1A). The
five most frequently mutated genes were TP53 (4/10),
transmembrane protein 128 (TMEM128; 4/10), KRAS
(4/10), FAM47C (4/10) and BAGE family member 2
(BAGE2; 4/10).
The mutation frequency of the 32 significantly
mutated genes was compared with TCGA data (Fig. 1C). Of these 32 genes, 13 were
detected by TCGA, including TP53, KRAS, FAM47C, MUC7, SHC
adaptor protein 4, keratin associated protein 5–5 (KRTAP5-5), AKT
serine/threonine kinase 1, taste 2 receptor member 10
(TAS2R10), β-2-microglobulin (B2M),
potassium voltage-gated channel interacting protein 2
(KCNIP2), cluster of differentiation (CD)58, FK506
binding protein 3 (FKBP3) and INO80 complex subunit E
(INO80E; Fig. 1C). Among
these 13 genes, the top three genes with the highest mutation
frequency in the present study and TCGA data were TP53, KRAS
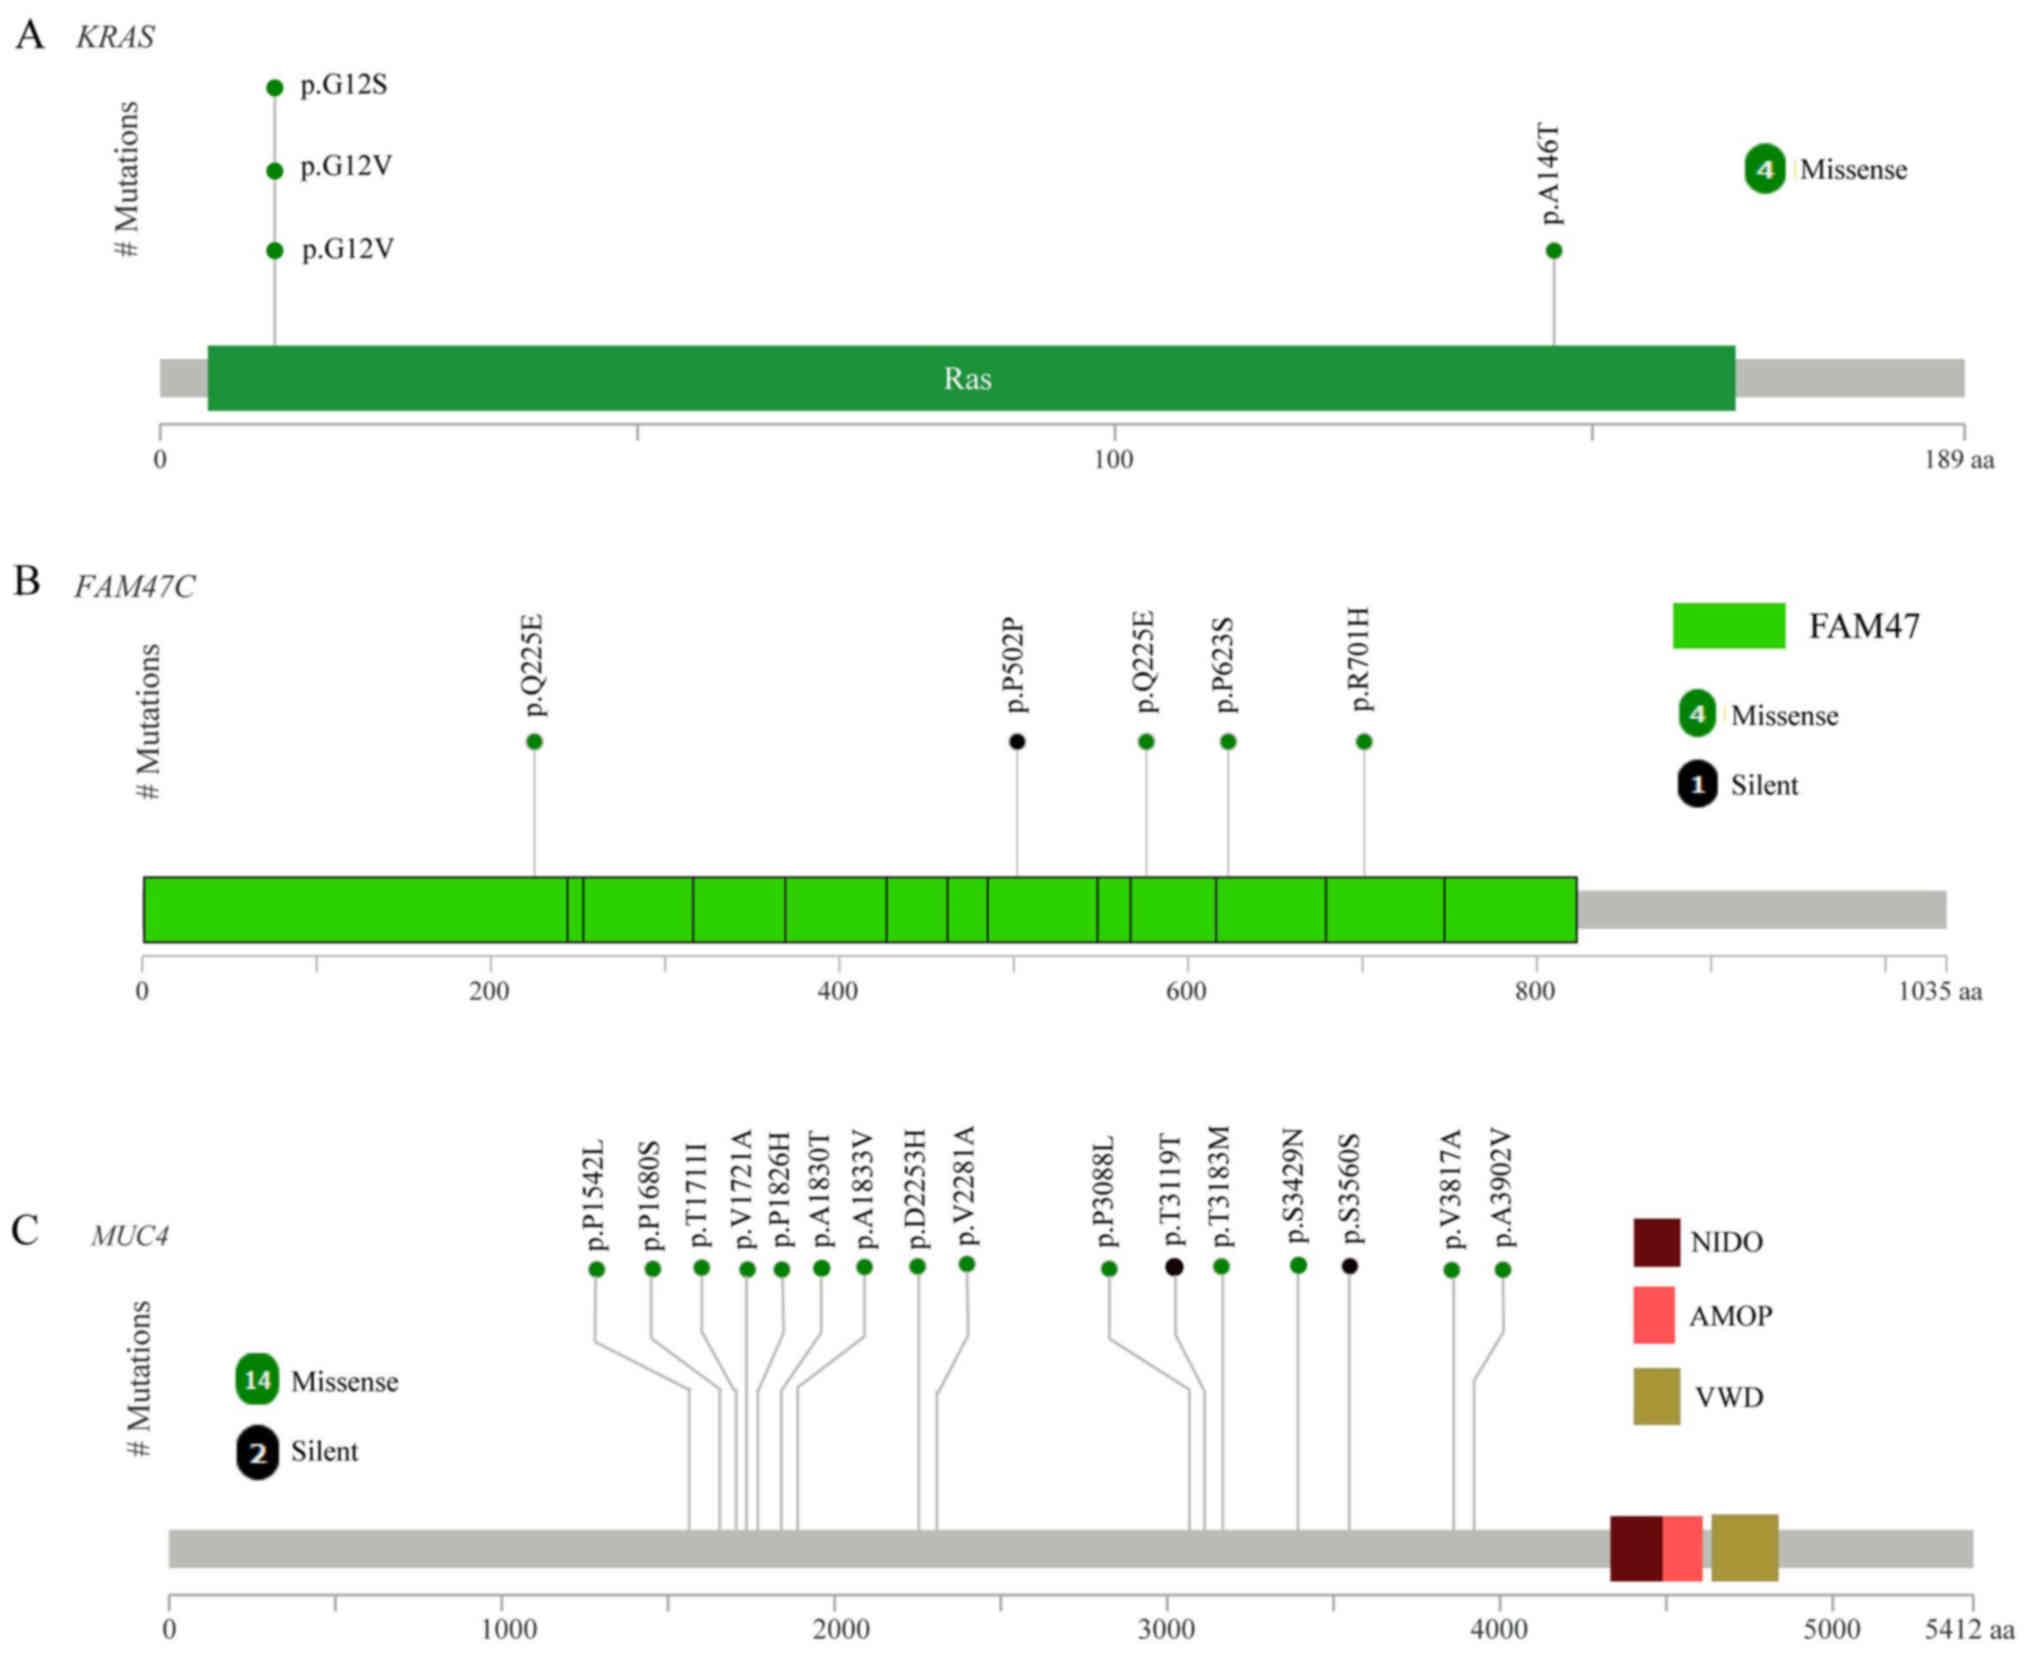
and FAM47C (4/10). As expected, the mutated KRAS gene
had oncogenic codon 12 mutations (3/10 samples; Fig. 2A) and another mutation was in codon
146 of KRAS (1/10 samples; Fig.
2A), which was in accordance with a previous study of CRC in
the Chinese population (24).
FAM47C was mutated in 4 out of 10 tumor samples including 4
missense mutations (p.Q225E, p.P502P, p.Q225E and p.R701H), 1
silent mutation (p.P502P) and 1 mutation in the 3′flank region, as
presented in Fig. 2B. The mutation
frequency of FAM47C in the COSMIC and TCGA databases was
5.71 and 5.41%, respectively (2).
FAM47C encodes a product belonging to a family of proteins
with unknown function. Additionally, FAM47C was mutated
exclusively in KRAS wild-type tumors. Specific ones out of
the 13 genes were mutated only in the tumor from patient CRC-9,
including TAS2R10, B2M, KCNIP2, CD58 and INO80E.
B2M had two mutations (a frame shift deletion and an
insertion in 3′flank region) in the CRC-9 tumor. Previous studies
reported B2M mutations in CRC and melanoma resulting in loss
of expression of HLA class 1 complexes (25), suggesting these mutations benefit
tumor growth by reducing antigen presentation to the immune system
(26). CD58 is reported to
be a surface marker that promotes self-renewal of tumor-initiating
cells in CRC (27).
Of the 32 significantly mutated genes, 19 were not
listed in TCGA data, including BAGE2, TMEM128, spermatogenesis
associated 3 (SPATA3), CD1B, RAB40A like, cysteine
rich protein 3 (CRIP3), crystallin β B2, EBP
like, guanidinoacetate N-methyltransferase, hes family bHLH
transcription factor 3, olfactory receptor family 2 subfamily A
member 7, proline rich nuclear receptor coactivator 2, small
proline rich protein 2B (SPRR2B), sushi repeat containing protein
X-linked 2 (SRPX2), translocase of inner mitochondrial membrane 17A
(TIMM17A), TMEM179, vesicle associated membrane protein 8 (VAMP8),
WD repeat domain 61 (WDR61) and zinc finger protein 124
(ZNF124). Notably, CRIP3 demonstrated a nonstop_mutation
(p.*205Rext*51) and CD1B had a nonsense_mutation (p.Q221*) in the
CRC-9 tumor, which was the hypermutated case (29.79 mutations per
Mb).
Considering all somatic mutations in coding regions,
the top 11 most frequently mutated genes were mucin 4
(MUC4; 8/10), immunoglobulin-like and fibronectin type
III domain containing 1 (IGFN1; 5/10), ALMS1,
centrosome and basal body associated protein (4/10), APC
(4/10), family with sequence similarity 47 member C
(FAM47C; 4/10), KRAS (4/10), mucin like 3
(DPCR1; 3/10), family with sequence similarity 186 member
A (FAM186A; 3/10), polycystin 1, transient receptor
potential channel interacting (3/10), and TTN (3/10).
The most frequent mutated gene was MUC4 (8/10), with a
mutation frequency that was higher compared with that reported in a
previous study (2). The mutation
frequency of MUC4 has been previously reported as 9.72%
(Genentech) (5), 5.33% (DFCI)
(3) and 2.23% (TCGA) (2). MUC4 is a major constituent of mucus
that has important roles in the protection of epithelial cells and
has been implicated in epithelial renewal and differentiation. The
mucin gene MUC4 is reported to be a transcriptional and
post-transcriptional target of the oncogene KRAS in
pancreatic cancer (28). However,
MUC4 was not defined as a driver gene by MutSigCV in the
current study, which may due to the positions of MUC4
mutations, which were not in functional regions (Fig. 2C).
Functional enrichment analysis of
mutated genes
To better understand the biological function of
mutated genes, GO and KEGG enrichment analysis were performed. All
mutated genes were categorized into 16 functional categories by GO
enrichment (adjusted P<0.05; Table III). Notably, 11 functional
categories were associated with transporter/channel activity. House
et al (29) reported that
voltage-gated Na+ channel activity increases colon
cancer transcriptional activity and invasion via persistent
mitogen-activated protein kinase signaling. All mutated genes were
categorized into three pathways by KEGG enrichment, including
‘neuroactive ligand-receptor interaction’, ‘alanine, aspartate and
glutamate metabolism’ and ‘nicotine addiction’ (adjusted
P<0.05).
| Table III.Functional enrichment of mutated
genes by GO. |
Table III.
Functional enrichment of mutated
genes by GO.
| ID | Description | P adjust | Gene count |
|---|
| GO:0022803 | Passive
transmembrane transporter activity | 0.0004191 | 209 |
| GO:0015267 | Channel
activity | 0.0004191 | 208 |
| GO:0022838 | Substrate-specific
channel activity | 0.0009566 | 193 |
| GO:0001227 | Transcriptional
repressor activity, RNA polymerase II transcription regulatory
region sequence-specific binding | 0.0013711 | 87 |
| GO:0005216 | Ion channel
activity | 0.0015965 | 185 |
| GO:0000987 | Core promoter
proximal region sequence-specific DNA binding | 0.0118789 | 159 |
| GO:0022836 | Gated channel
activity | 0.0118789 | 144 |
| GO:0000982 | Transcription
factor activity, RNA polymerase II core promoter proximal region
sequence-specific binding | 0.0150299 | 146 |
| GO:0001159 | Core promoter
proximal region DNA binding | 0.0150299 | 159 |
| GO:0005267 | Potassium channel
activity | 0.0186798 | 60 |
| GO:0046873 | Metal ion
transmembrane transporter activity | 0.0198865 | 176 |
| GO:0022843 | Voltage-gated
cation channel activity | 0.0198865 | 65 |
| GO:0000978 | RNA polymerase II
core promoter proximal region sequence-specific DNA binding | 0.0308052 | 148 |
| GO:0005261 | Cation channel
activity | 0.0330241 | 129 |
| GO:0005244 | Voltage-gated ion
channel activity | 0.0480344 | 85 |
| GO:0022832 | Voltage-gated
channel activity | 0.0480344 | 85 |
Chromosomal rearrangement
Chromosomal structural variation (SV) was also
analyzed using whole-genome sequencing of 10 tumors with matched
normal samples. There were 21 candidate-chromosomal rearrangements
detected by filtering criterion of above 20 supporting reads,
including 2 inversions and 19 translocations (Table IV). Among these, the fusion sites
of 4 SVs were in gene regions, which were termed fusion genes,
including, EF-hand domain family member B-mannosidase α
class 1A member 1, phosphorylase kinase regulatory subunit β
(PHKB)-NOTCH2 (2 samples) and polyamine modulated
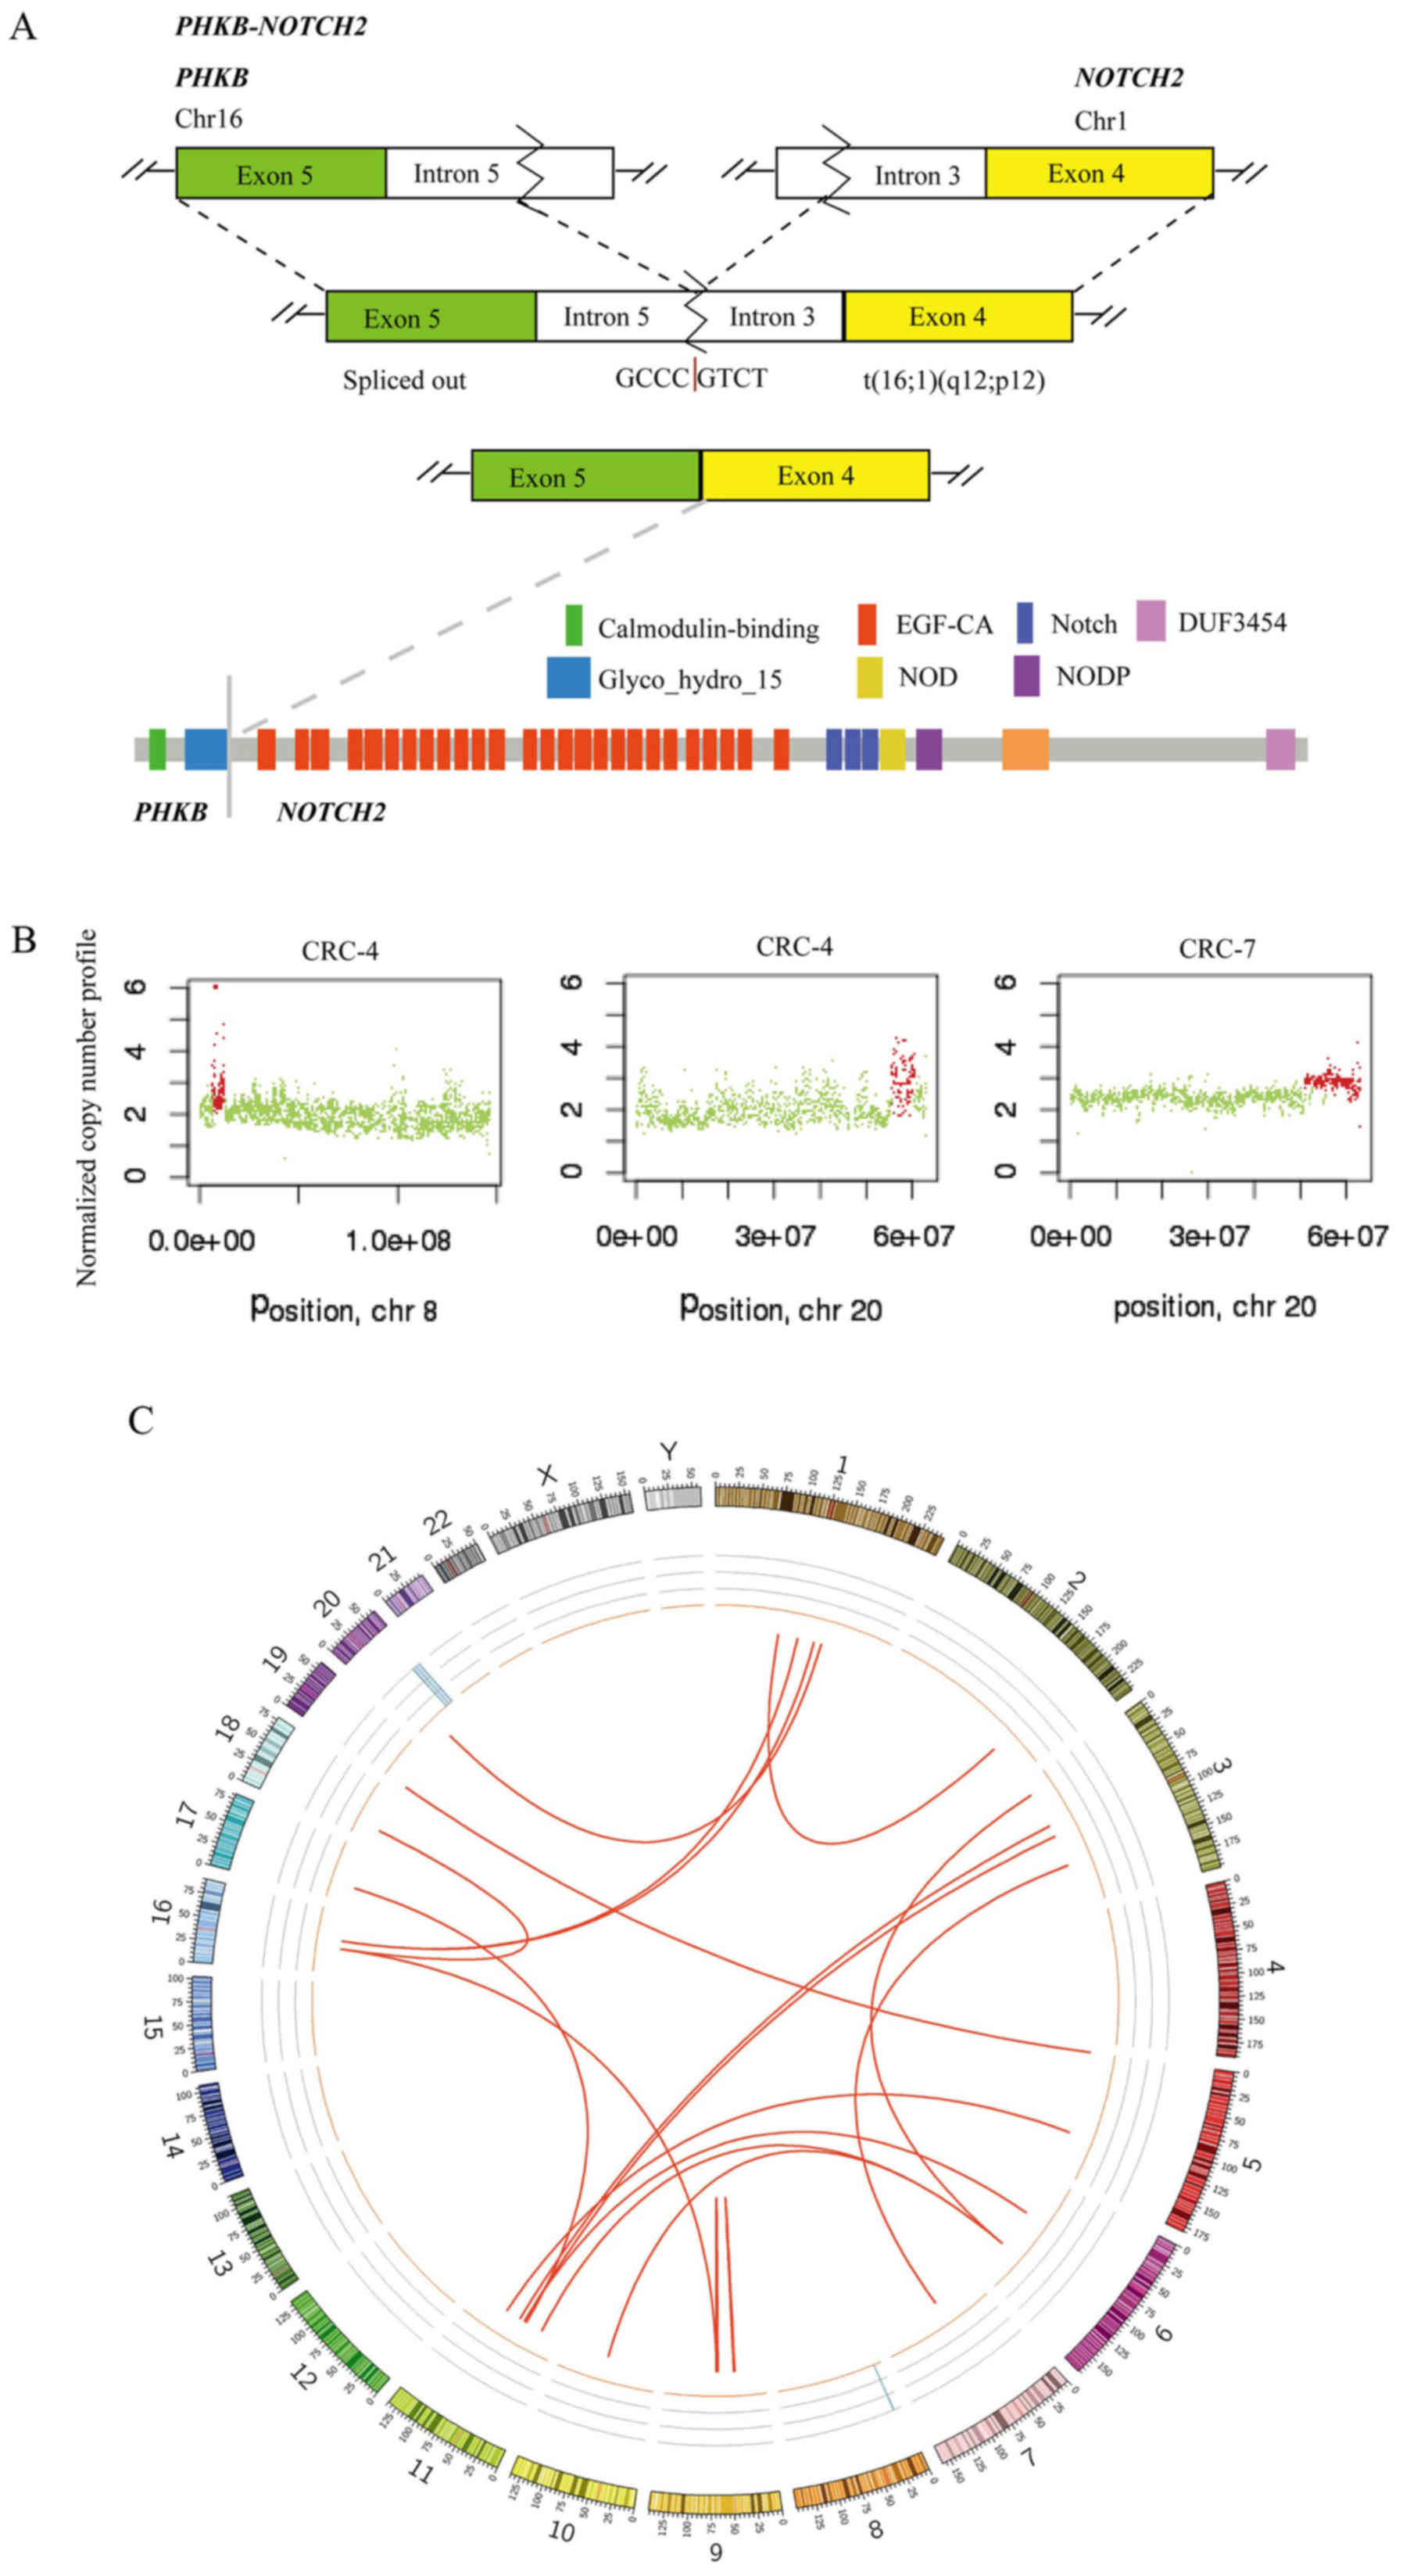
factor 1-FAM182B. A fusion of PHKB and NOTCH2 was
identified in 2 out of 10 CRCs and the fusion occurred downstream
of PHKB exon 5 and upstream of NOTCH2 exon 4
(Fig. 3A). This appears likely to
enable translation of the fusion protein (the glycosyl hydrolases
family 15 domain of PHKβ linked with the calcium-binding epidermal
growth factor-like domain of Notch2; Fig. 3A). PHKB encodes a member of
the PHKβ regulatory subunit family. PHKB was reported to
promote glycogen breakdown and cancer cell survival by interacting
with cell migration inducing hyaluronidase 1 (30). NOTCH2 encodes a member of
the Notch family with a role in a variety of developmental
processes by controlling cell fate decisions. Previous studies
reported that Notch2 is a crucial regulator of self-renewal and
tumorigenicity in human hepatocellular carcinoma cells (31,32)
and contributes to cell growth, invasion and migration in salivary
adenoid cystic carcinoma (33).
| Table IV.Predicted chromosomal rearrangement
detected by Factera. |
Table IV.
Predicted chromosomal rearrangement
detected by Factera.
| Sample | Type | Region1 (gene,
position) | Region2 (gene,
position) | Fusion sites |
|---|
| CRC-1 | TRA | TMEM194B | Intergenic | HFM1 | Intronic | chr2:191402786 to
chr1:91852783 |
| CRC-1 | TRA | ROCK1 | Intergenic | CTD-2144E22.5 | Intergenic | chr18:18519930 to
chr16:35239604 |
| CRC-1 | TRA | TRIM48 | Intergenic | MTRNR2L9 | Intergenic | chr11:55021850 to
chr6:61902202 |
| CRC-2 | INV | FAM27E3 | Intergenic | AL445665.1 | Intergenic | chr9:66971068 to
chr9:69710933 |
| CRC-2 | TRA | UNC5B | Intergenic | MAN1A1 | Intronic | chr10:72814597 to
chr6:119558701 |
| CRC-2 | TRA | ANO3 | Intergenic | MAN1A1 | Intronic | chr11:26173964 to
chr6:119558701 |
| CRC-2 | TRA | AL445665.1 | Intergenic | CTD-2144E22.5 | Intergenic | chr9:69711250 to
chr16:35239606 |
| CRC-2 | TRA | PPAP2C | Intergenic | PLEKHG4B | Intergenic | chr19:249186 to
chr5:15867 |
| CRC-3 | TRA | EFHB | Intronic | MAN1A1 | Intronic | chr3:19950145 to
chr6:119558701 |
| CRC-3 | TRA | TRIM48 | Intergenic | MTRNR2L9 | Intergenic | chr11:55021850 to
chr6:61902202 |
| CRC-3 | TRA | SOX14 | Intergenic | ZNF92 | Intergenic | chr3:137265780 to
chr7:64879411 |
| CRC-3 | TRA | PHKB | Intronic | NOTCH2 | Intronic | chr16:47538780 to
chr1:120544074 |
| CRC-4 | INV | RP11-146D12.2 | Intergenic | CNTNAP3B | Intergenic | chr9:42416106 to
chr9:44070790 |
| CRC-4 | TRA | CSNK1G3 | Intergenic | DLG2 | Intronic | chr5:122990837 to
chr11:85195011 |
| CRC-4 | TRA | PHKB | Intronic | NOTCH2 | Intronic | chr16:47538780 to
chr1:120544074 |
| CRC-8 | TRA | MTRNR2L1 | Intergenic | OR4C46 | Intergenic | chr17:22253139 to
chr11:51568509 |
| CRC-8 | TRA | SOX14 | Intergenic | ZNF92 | Intergenic | chr3:137265780 to
chr7:64879411 |
| CRC-8 | TRA | TRIM48 | Intergenic | MTRNR2L9 | Intergenic | chr11:55021850 to
chr6:61902202 |
| CRC-9 | TRA | PMF1 | Intronic | FAM182B | Upstream | chr1:156186653 to
chr20:26190511 |
| CRC-9 | TRA | WDR74 | Intergenic | PPP4R2 | Intergenic | chr11:62609281 to
chr3:73160133 |
| CRC-9 | TRA | SOX14 | Intergenic | ZNF92 | Intergenic | chr3:137265780 to
chr7:64879411 |
Copy number variations
Somatic CNVs in the 10 tumor tissues were analyzed
using Control-FREEC software. Chromosomes 8 and 20 were amplified
in CRC-4, and chromosome 20 was amplified in CRC-7 (Fig. 3B). GNAScomplex locus
(GNAS) was detected in 2 out of 10 tumors (CRC-4 and CRC-7)
and the GNAS copy number was 3. GNAS is located at
20q13.32. A previous study reported that amplification of the
GNAS locus may contribute to the pathogenesis of breast
cancer (34). In TCGA, GNAS
was amplified in 8.17% tumor samples (2). In the CRC-7 tumor, a subset of genes
located at chromosome 20 was amplified (copy number 3), including
teashirt zinc finger homeobox 2, aurora kinase A, GNAS, SS18L1 nBAF
chromatin remodeling complex subunit, regulator of telomere
elongation helicase 1 and ADP ribosylation factor related protein
1. SVs of 10 tumors are presented in Fig. 3C, including chromosomal
rearrangements and CNVs, displayed as CIRCOS plots.
Discussion
In the present study, whole-genome sequencing was
performed on tumor and matched adjacent normal tissues from 10
patients with CRC in Shanghai. A comprehensive analysis including
SNVs, InDels, CNVs and chromosomal rearrangements was performed,
which identified certain recurrent and novel variations in CRC
patients from the Han population in Shanghai, eastern China.
Among the significantly mutated genes, certain
previously reported driver genes in CRC were identified, including
TP53, KRAS, FAM47C and MUC7. Additionally, a group of
driver genes were identified that have rarely been reported in CRC,
including BAGE2, TMEM128, SPATA3 and CD1B. Certain
well-established mutated genes, including APC and
TTN, which were defined as driver genes in a previous study
(2), were not significantly
mutated genes in the present study. Signaling pathway analysis
indicated that the mutated genes may alter pathways associated with
channel activity. Notably, PHKB-NOTCH2 fusion was detected
in 2 out of 10 tumors, which has not been previously reported in
CRC, to the best of our knowledge. The structure of fusion proteins
was also predicted. Although, further study will be required to
fully understand the role of PHKB-NOTCH2 fusion.
The tumor mutation burden of the tumor of CRC-9 was
29.79 per Mb, which indicates hypermutation according to TCGA
(2). TCGA identified 16% of CRCs
to be hypermutated, three quarters of which are due to a mismatch
repair defect phenotype, otherwise known as MSI-H. In CRC-9, 23
significantly mutated genes were identified, while the other 9
cases harbored a mean of 3.3 significantly mutated genes (range,
3–4). Somatic mutations have the potential to encode ‘non-self’
immunogenic antigens. Evidence demonstrated improved responses to
programmed cell death protein 1 (PD-1) blockade in CRC with MSI-H
(35,36). The tumor of patient CRC-9 was a
locally advanced colon cancer (T4bN0M0) with poor-moderate
differentiation and MSI-H. Cancer antigen (CA)12-5 and CA15-3 were
at high levels following surgery, which indicated a high risk of
recurrence. CRC-9 may benefit from PD-1 blockade to treat
recurrence.
There are large differences in diet, living
conditions and genetic background between the Han population and
ethnic minorities, which are associated with CRC risk. For example,
the Uyghur population in Xinjiang is predominantly Caucasian, while
the Han population is mainly Mongoloid. Uyghur CRC patients have a
lower age of onset, larger tumor size, more advanced stage and
higher proportion of signet-ring cell carcinoma and mucinous
adenocarcinoma compared with Han patients (37). A previous study reported that CRC
patients in the Uyghur population exhibited a higher rate of
KRAS mutation compared with the Han population (46.2% vs.
28.8%) and the mutation rate in KRAS codon 12 is higher in
the Uygur population than in the Han population (38.5% vs. 17.3%)
(38). In the present study, the
KRAS mutation rate was 4/10 and 3/10 of mutations were in
codon 12, which was at a comparable level to the Uyghur population
(38).
There are limitations in this study. Firstly, the
sample size was small, which lead to low statistical power to
identify significantly mutated genes and could not well represent
Chinese Han population. Secondly, the sequencing depth was not high
enough to detect mutations with low variant allele frequency.
Thirdly, further validation in samples and functional studies were
not performed. Finally, due to the short time from patient
enrollment, survival analysis was not performed. In future studies
of a panel of CRC-associated genes, including reported recurrent
genes and novel mutated genes in the present study, will be
analyzed in a cohort of patients with CRC. In addition, survival
analysis with genomic variations should be performed following long
term follow-up for CRC patients.
In conclusion, in the present study, reported
mutated genes were validated to a certain extent and novel
mutations were identified, including fusion gene
PHKB-NOTCH2. In addition, mutated genes were enriched in
functions associated with channel activity, which has rarely been
reported by previous CRC studies (2,4). The
present study produced a CRC genomic mutation profile, which
provides a valuable resource for further insight into CRC within
the eastern Chinese Han population.
Acknowledgements
Not applicable.
Funding
No funding was received.
Availability of data and materials
The datasets generated during the current study are
available from the corresponding author on reasonable request.
Authors' contributions
HT and JZ wrote the manuscript; HT and HQ
contributed to the study design; HT collected and interpreted the
clinical data of patients; RG, NQ and XJ collected samples and
performed experiments; JZ, NL and SW developed the analysis methods
and provided the figures and tables. YW and MR analyzed the
sequencing data. NL and HQ contributed to manuscript revision.
Ethics approval and consent to
participate
Ethics approval for the recruitment of human
subjects was obtained from the Ethics Committee of Shanghai Tenth
People's Hospital, Tongji University School of Medicine and was
consistent with ethical guidelines provided by the Declaration of
Helsinki (1975). Written informed consent was obtained from each
patient.
Patient consent for publication
All individuals whose data were used provided
informed consent for publication.
Competing interests
The authors declare that they have no competing
interests.
References
|
1
|
Siegel RL, Miller KD, Fedewa SA, Ahnen DJ,
Meester RGS, Barzi A and Jemal A: Colorectal cancer statistics,
2017. CA Cancer J Clin. 67:177–193. 2017. View Article : Google Scholar : PubMed/NCBI
|
|
2
|
Cancer Genome Atlas Network: Comprehensive
molecular characterization of human colon and rectal cancer.
Nature. 487:330–337. 2012. View Article : Google Scholar : PubMed/NCBI
|
|
3
|
Giannakis M, Mu XJ, Shukla SA, Qian ZR,
Cohen O, Nishihara R, Bahl S, Cao Y, Amin-Mansour A, Yamauchi M, et
al: Genomic correlates of immune-cell infiltrates in colorectal
carcinoma. Cell Rep. 17:12062016. View Article : Google Scholar : PubMed/NCBI
|
|
4
|
Brannon AR, Vakiani E, Sylvester BE, Scott
SN, McDermott G, Shah RH, Kania K, Viale A, Oschwald DM, Vacic V,
et al: Comparative sequencing analysis reveals high genomic
concordance between matched primary and metastatic colorectal
cancer lesions. Genome Biol. 15:4542014. View Article : Google Scholar : PubMed/NCBI
|
|
5
|
Seshagiri S, Stawiski EW, Durinck S,
Modrusan Z, Storm EE, Conboy CB, Chaudhuri S, Guan Y, Janakiraman
V, Jaiswal BS, et al: Recurrent R-spondin fusions in colon cancer.
Nature. 488:660–664. 2012. View Article : Google Scholar : PubMed/NCBI
|
|
6
|
Siegel RL, Miller KD and Jemal A: Cancer
statistics, 2018. CA Cancer J Clin. 68:7–30. 2018. View Article : Google Scholar : PubMed/NCBI
|
|
7
|
Chen W, Zheng R, Baade PD, Zhang S, Zeng
H, Bray F, Jemal A, Yu XQ and He J: Cancer statistics in China,
2015. CA Cancer J Clin. 66:115–132. 2016. View Article : Google Scholar : PubMed/NCBI
|
|
8
|
Siegel RL, Miller KD and Jemal A: Cancer
statistics, 2016. CA Cancer J Clin. 66:7–30. 2016. View Article : Google Scholar : PubMed/NCBI
|
|
9
|
Zeng H, Zheng R, Guo Y, Zhang S, Zou X,
Wang N, Zhang L, Tang J, Chen J, Wei K, et al: Cancer survival in
China, 2003–2003: A population-based study. Int J Cancer.
136:1921–1930. 2015. View Article : Google Scholar : PubMed/NCBI
|
|
10
|
Cajuso T, Hanninen UA, Kondelin J, Gylfe
AE, Tanskanen T, Katainen R, Pitkänen E, Ristolainen H, Kaasinen E,
Taipale M, et al: Exome sequencing reveals frequent inactivating
mutations in ARID1A, ARID1B, ARID2 and ARID4A in microsatellite
unstable colorectal cancer. Int J Cancer. 135:611–623. 2014.
View Article : Google Scholar : PubMed/NCBI
|
|
11
|
Ashktorab H, Daremipouran M, Devaney J,
Varma S, Rahi H, Lee E, Shokrani B, Schwartz R, Nickerson ML and
Brim H: Identification of novel mutations by exome sequencing in
African American colorectal cancer patients. Cancer. 121:34–42.
2015. View Article : Google Scholar : PubMed/NCBI
|
|
12
|
Oh BY, Cho J, Hong HK, Bae JS, Park WY,
Joung JG and Cho YB: Exome and transcriptome sequencing identifies
loss of PDLIM2 in metastatic colorectal cancers. Cancer Manag Res.
9:581–589. 2017. View Article : Google Scholar : PubMed/NCBI
|
|
13
|
Nagahashi M, Wakai T, Shimada Y, Ichikawa
H, Kameyama H, Kobayashi T, Sakata J, Yagi R, Sato N, Kitagawa Y,
et al: Genomic landscape of colorectal cancer in Japan: Clinical
implications of comprehensive genomic sequencing for precision
medicine. Genome Med. 8:1362016. View Article : Google Scholar : PubMed/NCBI
|
|
14
|
Lander ES, Linton LM, Birren B, Nusbaum C,
Zody MC, Baldwin J, Devon K, Dewar K, Doyle M, FitzHugh W, et al:
Initial sequencing and analysis of the human genome. Nature.
409:860–921. 2001. View Article : Google Scholar : PubMed/NCBI
|
|
15
|
Li H and Durbin R: Fast and accurate short
read alignment with burrows-wheeler transform. Bioinformatics.
25:1754–1760. 2009. View Article : Google Scholar : PubMed/NCBI
|
|
16
|
McKenna A, Hanna M, Banks E, Sivachenko A,
Cibulskis K, Kernytsky A, Garimella K, Altshuler D, Gabriel S, Daly
M and DePristo MA: The genome analysis toolkit: A mapreduce
framework for analyzing next-generation DNA sequencing data. Genome
Res. 20:1297–1303. 2010. View Article : Google Scholar : PubMed/NCBI
|
|
17
|
Wang K, Li M and Hakonarson H: ANNOVAR:
Functional annotation of genetic variants from high-throughput
sequencing data. Nucleic Acids Res. 38:e1642010. View Article : Google Scholar : PubMed/NCBI
|
|
18
|
Koboldt DC, Zhang Q, Larson DE, Shen D,
McLellan MD, Lin L, Miller CA, Mardis ER, Ding L and Wilson RK:
VarScan 2: Somatic mutation and copy number alteration discovery in
cancer by exome sequencing. Genome Res. 22:568–576. 2012.
View Article : Google Scholar : PubMed/NCBI
|
|
19
|
Lawrence MS, Stojanov P, Polak P, Kryukov
GV, Cibulskis K, Sivachenko A, Carter SL, Stewart C, Mermel CH,
Roberts SA, et al: Mutational heterogeneity in cancer and the
search for new cancer-associated genes. Nature. 499:214–218. 2013.
View Article : Google Scholar : PubMed/NCBI
|
|
20
|
Boeva V, Popova T, Bleakley K, Chiche P,
Cappo J, Schleiermacher G, Janoueix-Lerosey I, Delattre O and
Barillot E: Control-FREEC: A tool for assessing copy number and
allelic content using next-generation sequencing data.
Bioinformatics. 28:423–425. 2012. View Article : Google Scholar : PubMed/NCBI
|
|
21
|
Newman AM, Bratman SV, Stehr H, Lee LJ,
Liu CL, Diehn M and Alizadeh AA: FACTERA: A practical method for
the discovery of genomic rearrangements at breakpoint resolution.
Bioinformatics. 30:3390–3393. 2014. View Article : Google Scholar : PubMed/NCBI
|
|
22
|
Skidmore ZL, Wagner AH, Lesurf R, Campbell
KM, Kunisaki J, Griffith OL and Griffith M: GenVisR: Genomic
Visualizations in R. Bioinformatics. 32:3012–3014. 2016. View Article : Google Scholar : PubMed/NCBI
|
|
23
|
Krzywinski M, Schein J, Birol I, Connors
J, Gascoyne R, Horsman D, Jones SJ and Marra MA: Circos: An
information aesthetic for comparative genomics. Genome Res.
19:1639–1645. 2009. View Article : Google Scholar : PubMed/NCBI
|
|
24
|
Zhang J, Zheng J, Yang Y, Lu J, Gao J, Lu
T, Sun J, Jiang H, Zhu Y, Zheng Y, et al: Molecular spectrum of
KRAS, NRAS, BRAF and PIK3CA mutations in chinese colorectal cancer
patients: Analysis of 1,110 cases. Sci Rep. 5:186782015. View Article : Google Scholar : PubMed/NCBI
|
|
25
|
Bernal M, Ruiz-Cabello F, Concha A,
Paschen A and Garrido F: Implication of the β2-microglobulin gene
in the generation of tumor escape phenotypes. Cancer Immunol
Immunother. 61:1359–1371. 2012. View Article : Google Scholar : PubMed/NCBI
|
|
26
|
Cancer Genome Atlas Research Network:
Comprehensive molecular characterization of gastric adenocarcinoma.
Nature. 513:202–209. 2014. View Article : Google Scholar : PubMed/NCBI
|
|
27
|
Xu S, Wen Z, Jiang Q, Zhu L, Feng S, Zhao
Y, Wu J, Dong Q, Mao J and Zhu Y: CD58, a novel surface marker,
promotes self-renewal of tumor-initiating cells in colorectal
cancer. Oncogene. 34:1520–1531. 2015. View Article : Google Scholar : PubMed/NCBI
|
|
28
|
Vasseur R, Skrypek N, Duchêne B, Renaud F,
Martínez-Maqueda D, Vincent A, Porchet N, Van Seuningen I and
Jonckheere N: The mucin MUC4 is a transcriptional and
post-transcriptional target of K-ras oncogene in pancreatic cancer.
Implication of MAPK/AP-1, NF-κB and RalB signaling pathways.
Biochim Biophys Acta. 1849:1375–1384. 2015. View Article : Google Scholar : PubMed/NCBI
|
|
29
|
House CD, Wang BD, Ceniccola K, Williams
R, Simaan M, Olender J, Patel V, Baptista-Hon DT, Annunziata CM,
Gutkind JS, et al: Voltage-gated Na+ channel activity increases
colon cancer transcriptional activity and invasion via persistent
MAPK signaling. Sci Rep. 5:115412015. View Article : Google Scholar : PubMed/NCBI
|
|
30
|
Terashima M, Fujita Y, Togashi Y, Sakai K,
De Velasco MA, Tomida S and Nishio K: KIAA1199 interacts with
glycogen phosphorylase kinase beta-subunit (PHKB) to promote
glycogen breakdown and cancer cell survival. Oncotarget.
5:7040–7050. 2014. View Article : Google Scholar : PubMed/NCBI
|
|
31
|
Hayashi Y, Osanai M and Lee GH: NOTCH2
signaling confers immature morphology and aggressiveness in human
hepatocellular carcinoma cells. Oncol Rep. 34:1650–1658. 2015.
View Article : Google Scholar : PubMed/NCBI
|
|
32
|
Wu WR, Zhang R, Shi XD, Yi C, Xu LB and
Liu C: Notch2 is a crucial regulator of self-renewal and
tumorigenicity in human hepatocellular carcinoma cells. Oncol Rep.
36:181–188. 2016. View Article : Google Scholar : PubMed/NCBI
|
|
33
|
Qu J, Song M, Xie J, Huang XY, Hu XM, Gan
RH, Zhao Y, Lin LS, Chen J, Lin X, et al: Notch2 signaling
contributes to cell growth, invasion, and migration in salivary
adenoid cystic carcinoma. Mol Cell Biochem. 411:135–141. 2016.
View Article : Google Scholar : PubMed/NCBI
|
|
34
|
Garcia-Murillas I, Sharpe R, Pearson A,
Campbell J, Natrajan R, Ashworth A and Turner NC: An siRNA screen
identifies the GNAS locus as a driver in 20q amplified breast
cancer. Oncogene. 33:2478–2486. 2014. View Article : Google Scholar : PubMed/NCBI
|
|
35
|
Le DT, Uram JN, Wang H, Bartlett BR,
Kemberling H, Eyring AD, Skora AD, Luber BS, Azad NS, Laheru D, et
al: PD-1 blockade in tumors with mismatch-repair deficiency. N Engl
J Med. 372:2509–2520. 2015. View Article : Google Scholar : PubMed/NCBI
|
|
36
|
Le DT, Durham JN, Smith KN, Wang H,
Bartlett BR, Aulakh LK, Lu S, Kemberling H, Wilt C, Luber BS, et
al: Mismatch repair deficiency predicts response of solid tumors to
PD-1 blockade. Science. 357:409–413. 2017. View Article : Google Scholar : PubMed/NCBI
|
|
37
|
Roukeyan K, Yue N, Liang LP and Zhao F:
Clinicopathological features and expression of hMLH1 and hMSH2 in
Uygur and Han patients with colorectal carcinoma. Shijie Huaren
Xiaohua Zazhi. 23:2382–2388. 2015.(In Chinese).
|
|
38
|
Eli M, Mollayup A, Muattar, Liu C, Zheng C
and Bao YX: K-ras genetic mutation and influencing factor analysis
for Han and Uygur nationality colorectal cancer patients. Int J
Clin Exp Med. 8:10168–10177. 2015.PubMed/NCBI
|