Introduction
Osteoarthritis (OA) is one of the most common types
of arthritis worldwide and affects ~15% of the population (1). General symptoms of OA include pain
and stiffness in joints and physical disability (2). Although loss of articular cartilage
is considered to be the primary cause of OA, other joint tissues
including subchondral bone, synovium and acetabular labrum are also
involved in the development and progression of OA (2). Moreover, increasing evidence supports
a role for genetic factors in OA (1), which may provide clues for the
diagnosis and treatment of OA.
A series of genes have been identified to be
associated with OA, such as growth differentiation factor 5
(3), DOI2 (4,5) and
SMAD family member 3 (6).
Previously, bioinformatics methods have been increasingly used and
have facilitated the identification of genetic variations in OA
(7). Inflammatory genes such as
CD55, prostaglandin E synthase (PTGES) and TNF-α
induced protein 6 (TNFAIP6) have been shown to be
significantly upregulated in articular cartilage in a genome-wide
study, indicating that inflammation may be involved in OA
progression (7). Dysregulation of
genes related to anti-oxidative defense mechanism has also been
identified in OA. Another study using expression profiles from OA
and normal articular cartilage showed that superoxide dismutase 2
(SOD2), SOD3, and glutathione peroxidase 3 were
significantly downregulated in OA articular cartilage, suggesting a
close correlation between the dysregulation of anti-oxidative
defense and cartilage matrix damage (8).
Extensive studies have been performed to investigate
the molecular mechanisms of OA development and progression
(9–12). Studies have reported that
chitinases, including chitinase 3 like 1 and chitotriosidase, are
upregulated while lubricin is downregulated in OA cartilage and
they are considered to be potential markers to stage the severity
of OA (9,11). In addition, lubricin, as well as
collagen type I, collagen type II are found to be associated with
the formation of hyaline cartilage (10). Giunta et al (12) revealed that the expression of
pituitary adenylate cyclase-activating polypeptide is reduced in OA
and contributes to the inhibition of chondrocyte apoptosis induced
by interleukin 1β. However, much less is known about the
transcriptional alterations occurring in the acetabular labrum. Two
recent studies compared the expression profiles of OA acetabular
labrum cells and healthy cells (13,14).
One of the studies collected and deposited the expression data in
the Gene Expression Omnibus database under accession number
GSE60762 (14). The study focused
on small leucine rich repeat proteins (SLRPs) and indicated that
genes coding for osteomodulin, osteoglycin, and asporin
(ASPN) may be functionally important for OA (14). Another study using the same dataset
revealed several distinct OA related genes, including cadherin 2
(CDH2), Wnt family member 5A, kinase insert domain receptor
(KDR, also known as VEGFR2), Fms related tyrosine
kinase 1 (FLT1) and CDH5 (13). However, further studies are needed
to identify additional essential genes related to OA acetabular
labrum.
To get new insights into the molecular mechanisms
underlying the pathological changes in the OA acetabular labrum,
the GSE60762 dataset was reanalyzed using an optimized
bioinformatics strategy as diverse bioinformatics approaches may
lead to novel insights (15).
Following the screening of important differentially expressed genes
(DEGs), key genes associated with OA were identified using a
combination of co-expression analysis and protein-protein
interaction (PPI) analysis. Moreover, the functions of these key
genes as well as potential drugs targeting the proteins encoded by
these genes were investigated. Therefore, the present study may
advance the understanding of the underlying molecular mechanisms of
OA and may contribute to the diagnosis and treatment of OA.
Materials and methods
Data source and preprocessing
Expression profile data under the accession number
GSE60762 was downloaded from the Gene Expression Omnibus
(https://www.ncbi.nlm.nih.gov/geo/)
(16) database and used for the
present study. In total, 5 OA samples and 3 normal samples from
acetabular labrum cells were included in the present study. The
Series Matrix File(s) was downloaded and the probe names were
converted to gene symbols according to the annotation information
provided on the GPL6244 platform. The expression values of genes
were acquired by averaging the values of their corresponding probes
using the aggregate function in base R (version 3.3.3; http://cran.r-project.org/). The expression value of
probes with missing value was adjusted using the K-nearest neighbor
method (17) (nearest neighbor
average with the k value set as 10) from the impute package
(18) in R. The expression profile
data was normalized by quantile normalization using the
preprocessCore package (19) in
R.
Screening of significant DEGs
The significant DEGs obtained were screened using
the limma package (20) in R. The
differences of mean expression values between OA and normal samples
were compared using a t test from the package. P-value was adjusted
by the Benjamini-Hochberg method. Genes with |log2FC
(fold change)|>1 and P<0.05 were considered to be significant
DEGs.
Weighted gene co-expression network
analysis (WGCNA) of the significant DEGs
All the significant DEGs were analyzed using WGCNA
(https://labs.genetics.ucla.edu/horvath/CoexpressionNetwork/Rpackages/WGCNA/)
(21) package in R to reveal their
co-expression relationships. The DEGs were divided into different
WGCNA modules. The correlations between different WGCNA modules and
OA were assessed using one-way analysis of variance. P<0.05 was
set as the cut-off criteria.
Functional analysis of gene
modules
Gene Ontology (GO) (22) enrichment analysis were performed
for different WGCNA modules using clusterprofiler package (23) in R, with P<0.05 set as the
cut-off criteria.
Construction of PPI network. The interactions among
proteins encoded by all the DEGs were predicted using the STRING
database (24). The PPI network
was constructed and visualized with Cytoscape (version 3.2.0;
http://www.cytoscape.org) software (25). Furthermore, WGCNA-PPI common
subnetworks were constructed. The resulting common subnetworks
contained genes with both the weighted correlations as well as
PPIs.
Literature mining analysis of key
genes
Gene Cluster with Literature Profiles (GenCLiP;
version 2.0) is a software for clustering genes under functional
keywords based on literature mining (26). The functions of DEGs were analyzed
using the GenCLiP (version 2.0, http://ci.smu.edu.cn/GenCLiP2/analysis.php) (26) module ‘Gene Cluster With Literature
Profiles’. Previously studied functions of genes could therefore be
obtained. Functional keywords with P<1×10⁻⁴ and those
at least for 2 genes were selected.
Drug screening
Connectivity Map (CMAP; http://portals.broadinstitute.org/cmap) is a database
used to connect gene expression signatures with small molecules
(27). Potential small drug
molecules for arthritis treatment were screened using CMAP. The
significant DEGs were converted to probes under HG-U133A platform
by format conversion. Subsequently, the OA-related small drug
molecules were identified by comparing the expression profiles of
the DEGs with the gene expression profiles generated by small
molecules from the CMAP database. P<0.05 was set as the cut-off
criteria.
Results
DEGs between OA and normal labrum
cells
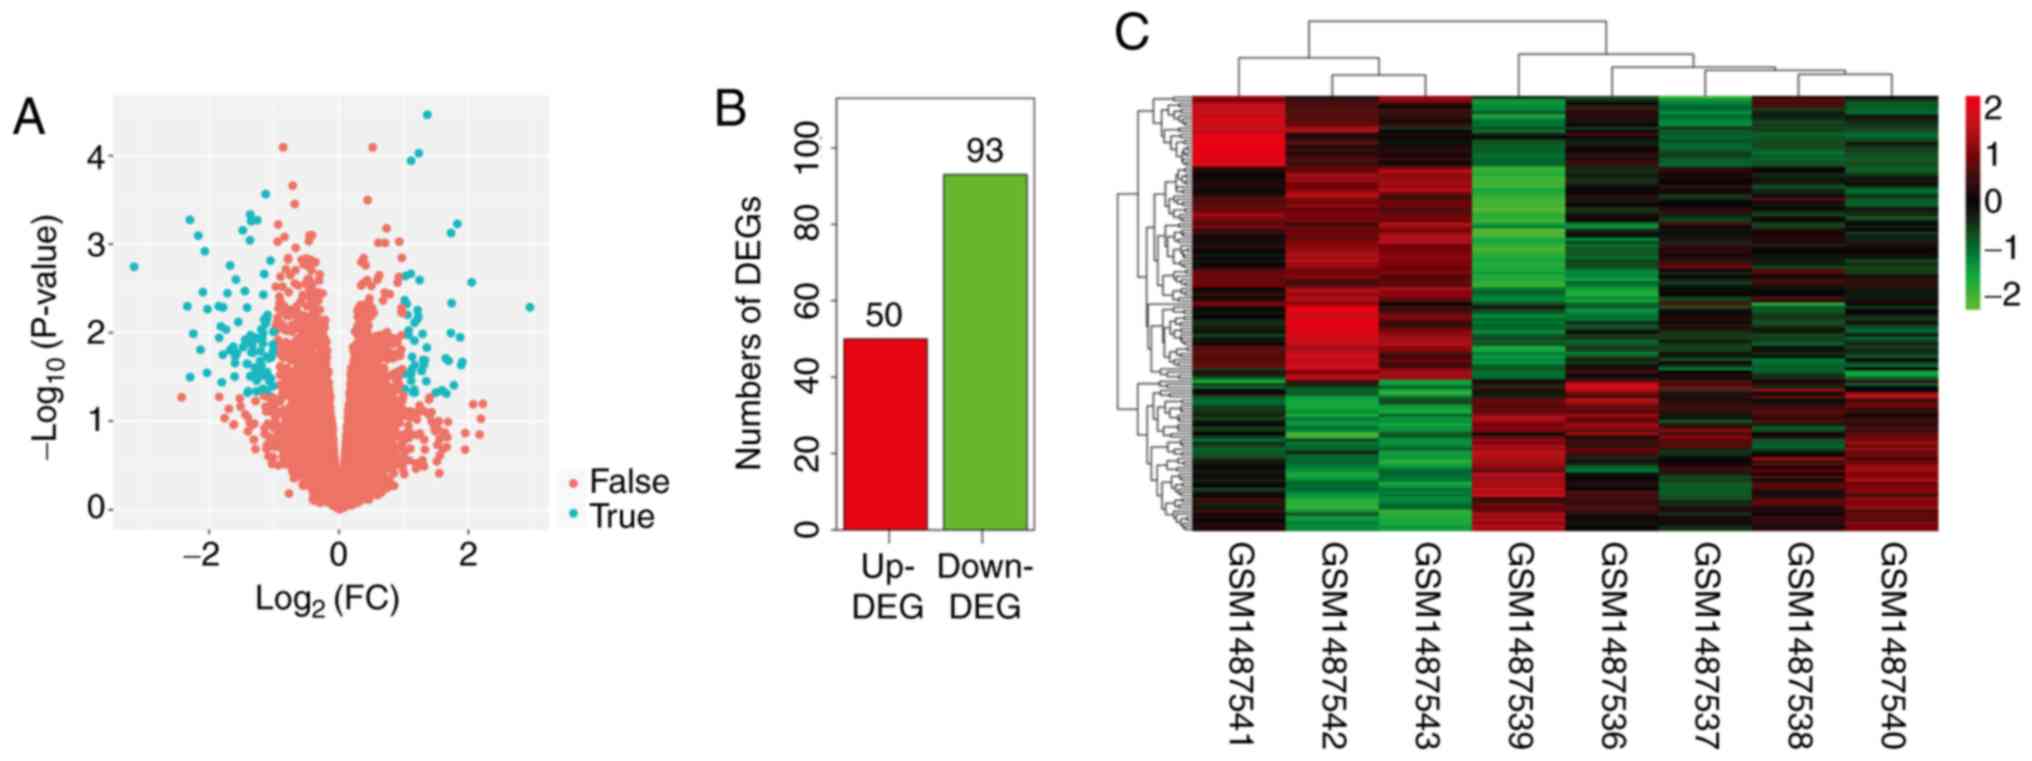
expression data for a total of 19,952 genes were
obtained after data preprocessing. Among these genes, 141 (50
upregulated and 93 downregulated genes) were identified to be
differentially expressed in OA samples compared with normal samples
(Fig. 1A and B). Hierarchical
cluster analysis based on the expression value of DEGs could
clearly classify OA and normal samples into two different clusters
(Fig. 1C).
Co-expression modules of DEGs
In order to identify OA-related co-expression
patterns, DEGs were analyzed using WGCNA, an R package for weighted
gene co-expression network analysis (21). In total, 5 significant WGCNA
modules were acquired and designated as brown, yellow, blue,
turquoise, and grey. Most of the modules contained >20 genes
except the grey module, which contained only 8 genes and therefore
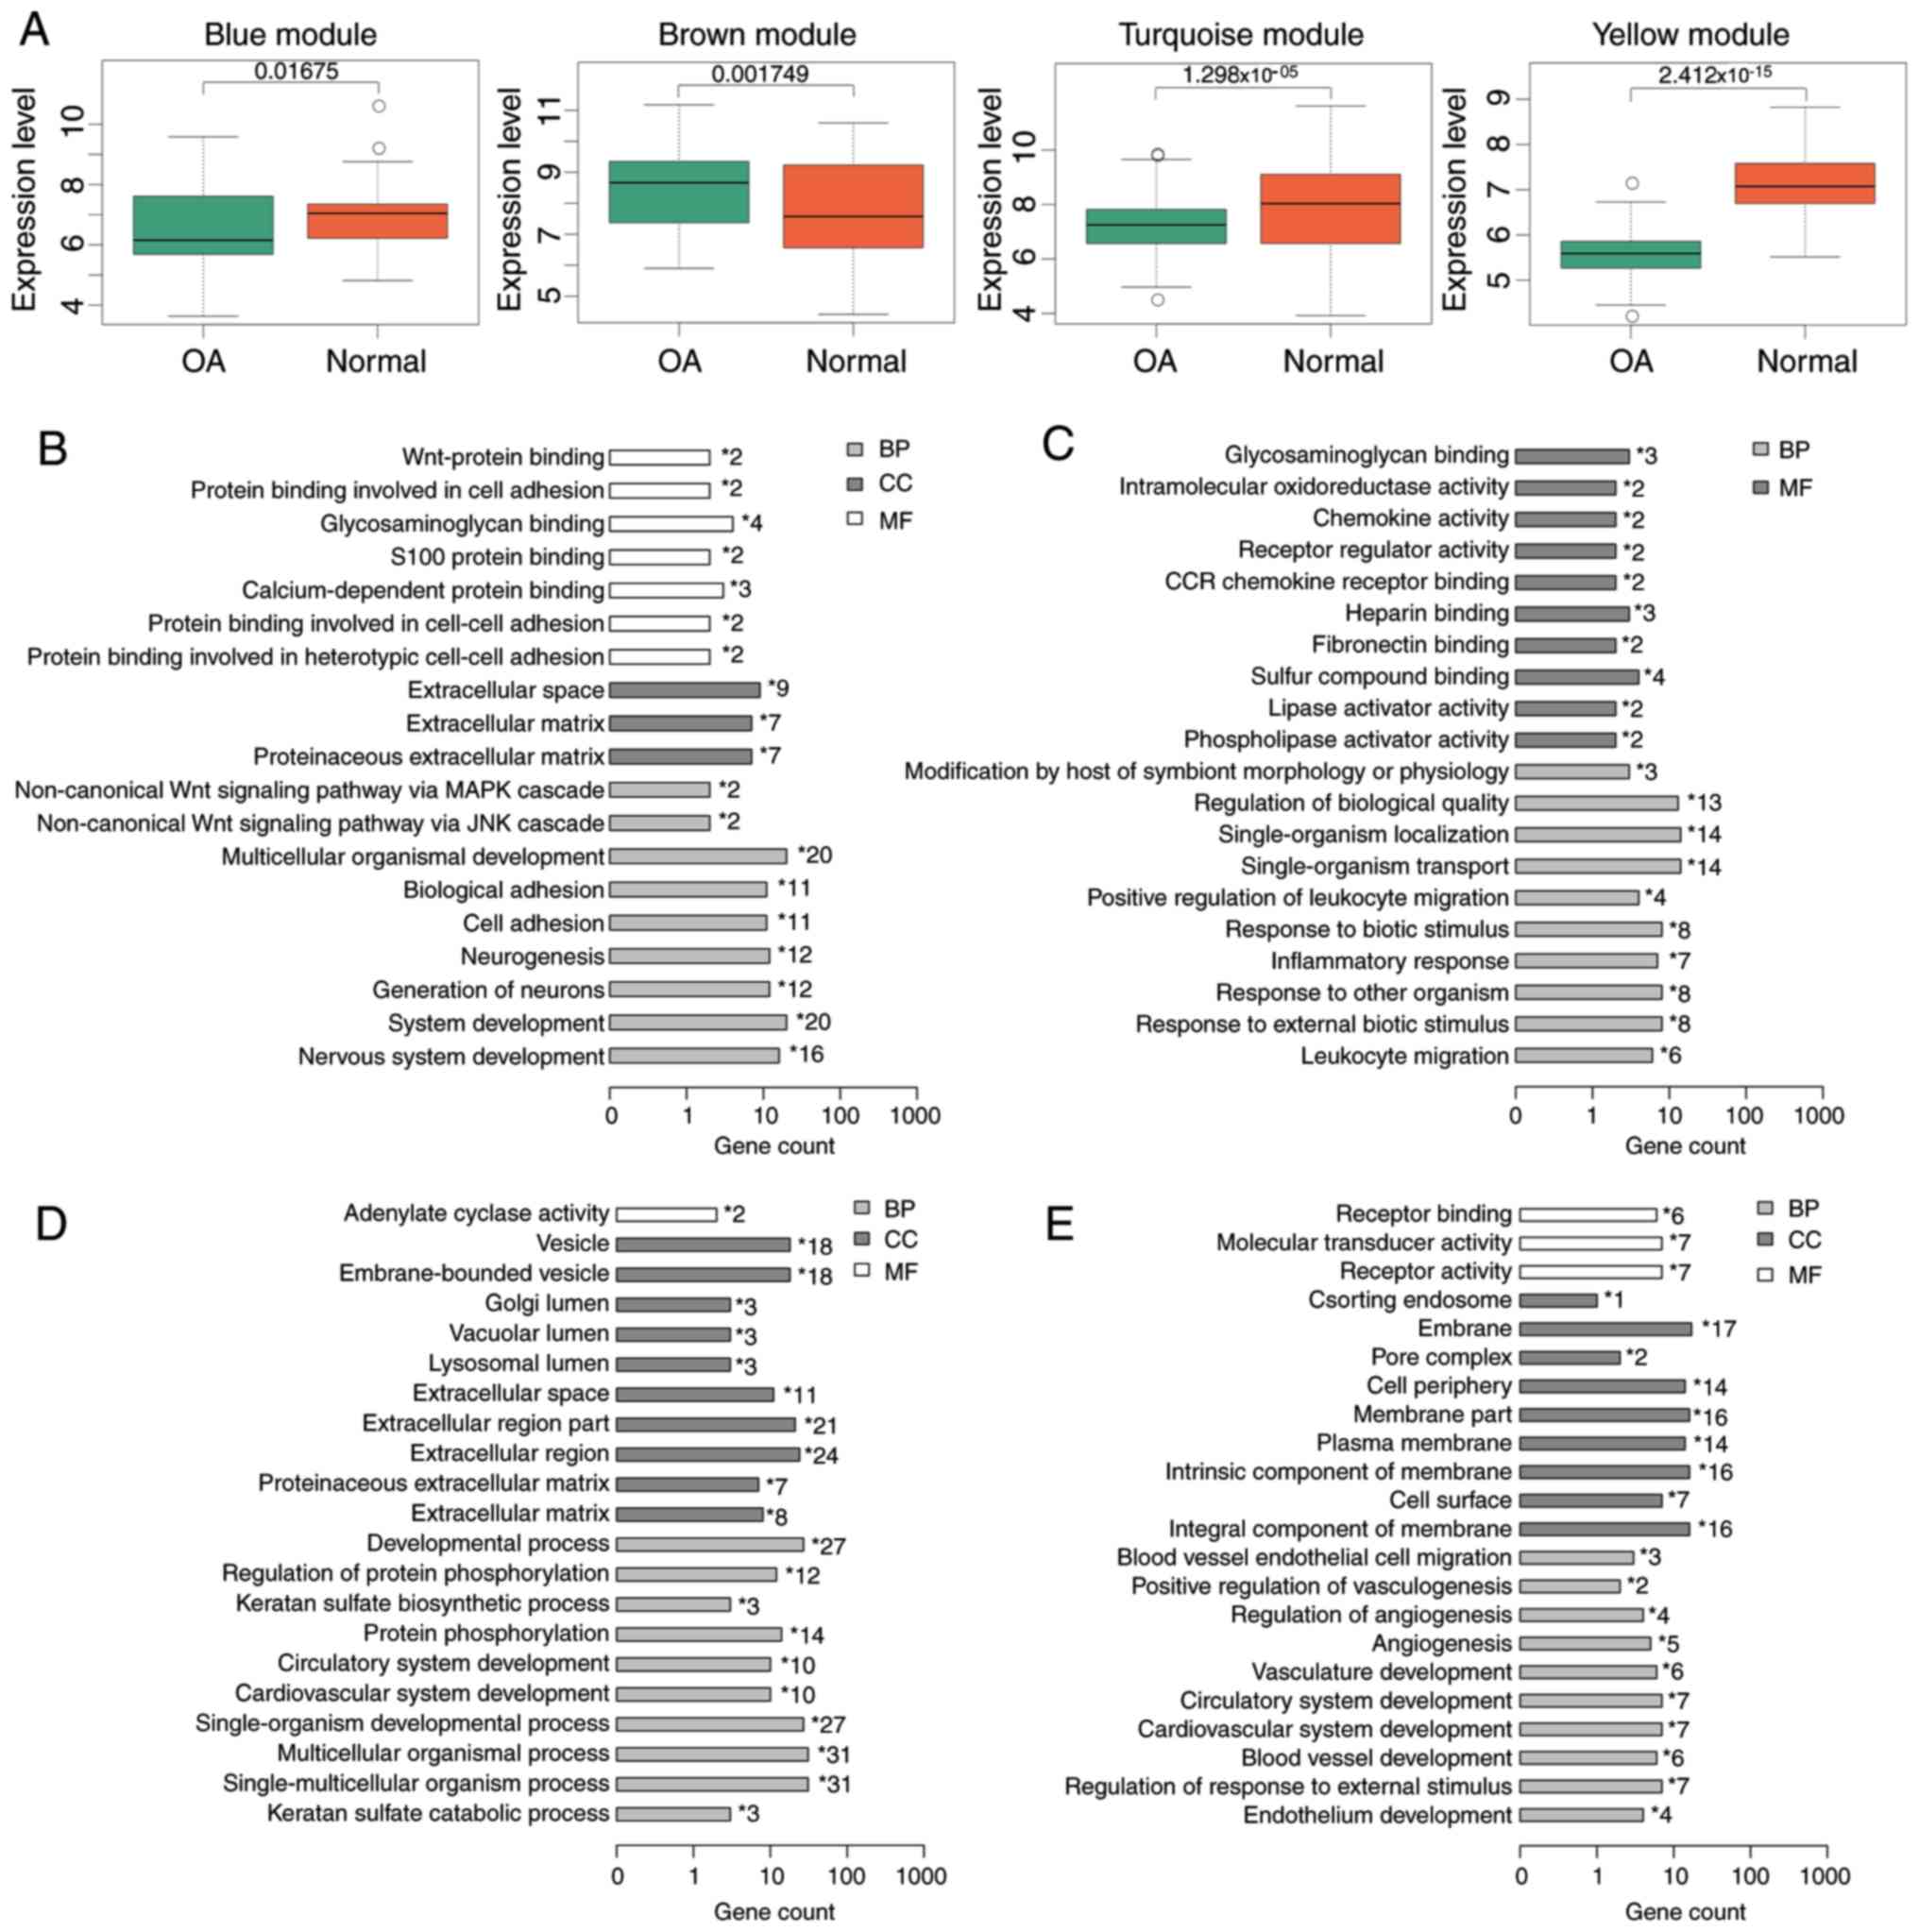
was not included in the subsequent analysis. The expression of
genes in the blue, yellow and turquoise modules correlated
negatively with OA, whereas that of genes in the other two modules
correlated positively with OA (Table
I). Consistent with this, the expression of genes in the blue,
yellow and turquoise modules was lower and the expression of genes
in the brown module was increased in OA samples compared with the
normal samples (Fig. 2A).
 | Table I.WGCNA modules. |
Table I.
WGCNA modules.
| Variable | Brown | Yellow | Blue | Turquoise | Grey |
|---|
|
Correlationa | 0.74 | −0.8 | −0.87 | −0.79 | 0.82 |
| P-value | 0.035237748 | 0.016851893 | 0.005226361 | 0.019352318 | 0.013654178 |
| Gene
numberb | 24 | 21 | 37 | 53 | 8 |
Furthermore, GO enrichment analysis was performed
for genes in each WGCNA module. The blue module was significantly
enriched in multicellular organismal development and system
development (P<0.05; Fig. 2B).
The brown module was significantly enriched in terms such as
regulation of biological quality, single-organism localization and
single-organism transport (P<0.01; Fig. 2C). The turquoise module was
significantly enriched in terms related to extracellular region,
extracellular region part, development process, single-organism
developmental process, multicellular organismal process and
single-multicellular organism process (P<0.001; Fig. 2D). The yellow module was
significantly enriched in terms such as membrane, membrane part,
intrinsic component of membrane and integral components of membrane
(P<0.001; Fig. 2E).
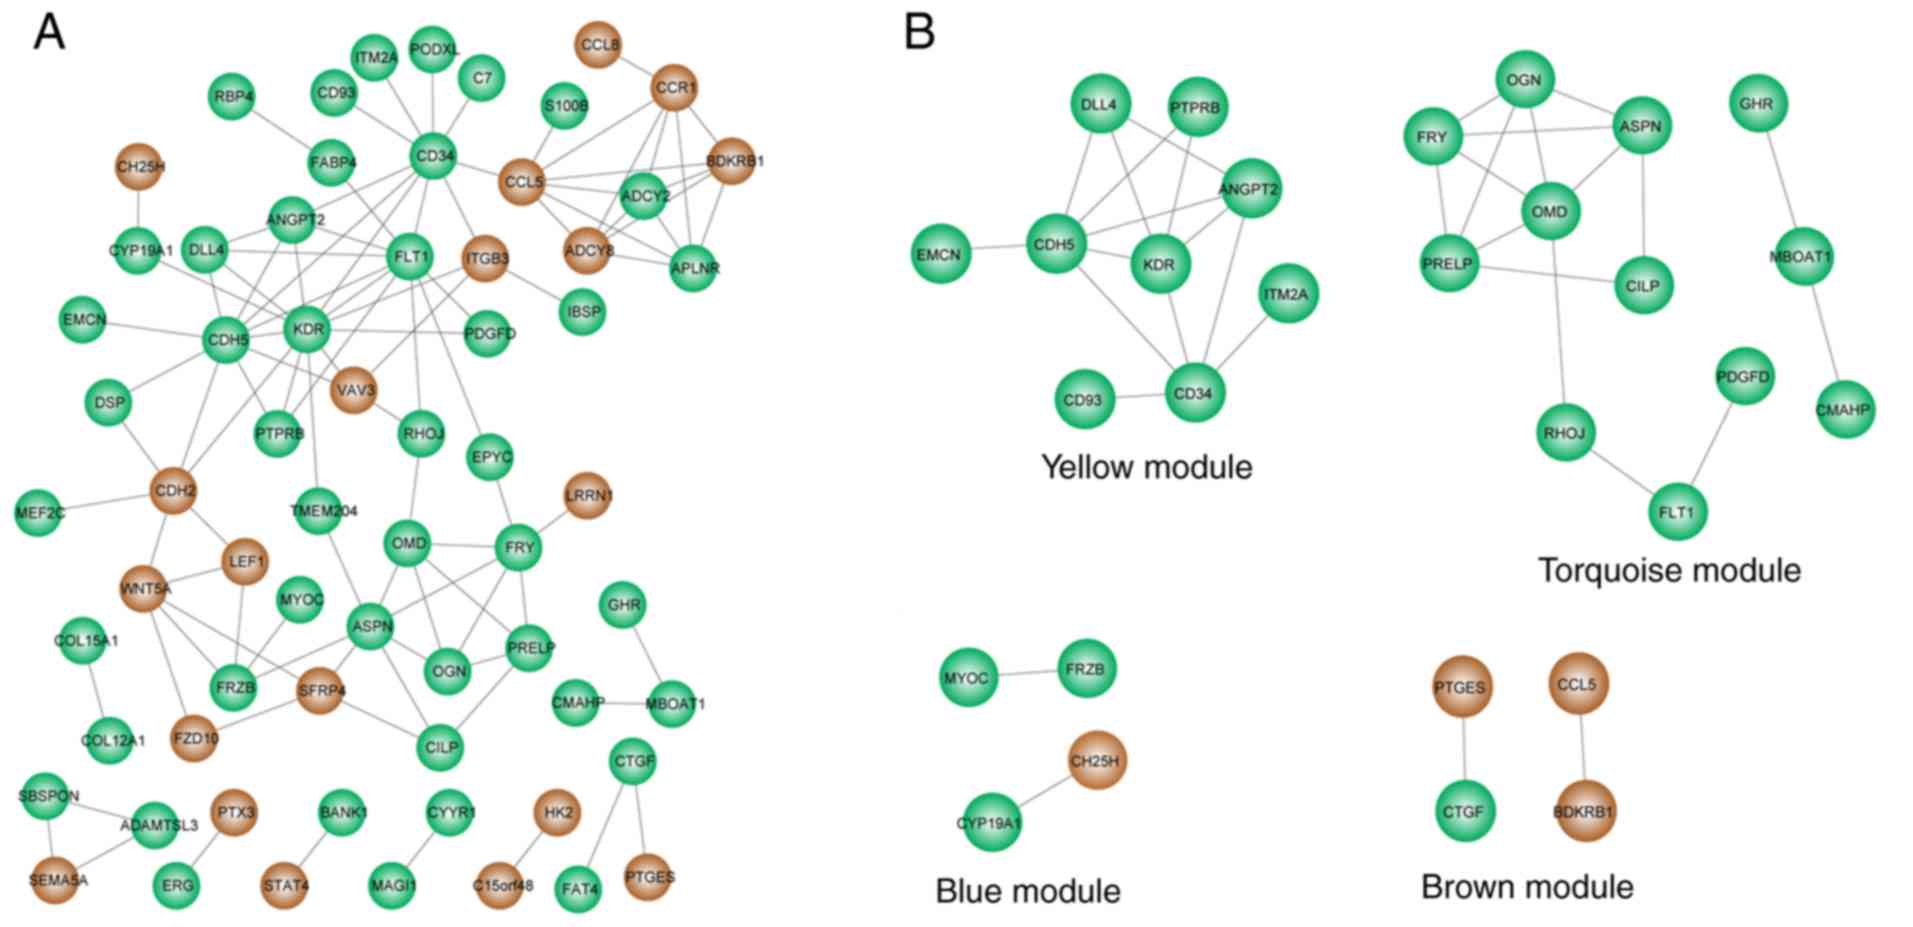
PPI network of DEGs
The PPIs between proteins encoded by DEGs were
analyzed using the STRING database. In total, 102 PPIs were
obtained for 66 DEGs (Fig. 3A).
KDR (degree=12, downregulated), CD34 (degree=10,
downregulated), CDH5 (degree=10, downregulated), FLT1
(degree=10, downregulated) and ASPN (degree=7,
downregulated) were considered to be hub nodes in the network, as
they had the highest connectivity degree.
The PPIs between proteins encoded by genes in each
WGCNA module could also be identified based on the PPI network.
Therefore, 4 WGCNA-PPI common subnetworks were constructed to
delineate the PPIs within each WGCNA module (Fig. 3B). Both the blue and brown
subnetwork consisted of only 4 nodes and 2 PPIs, whereas the yellow
and turquoise subnetwork consisted of several nodes and PPIs. In
total, 9 nodes and 14 PPIs were included in the yellow common
subnetwork, and 12 nodes and 16 PPIs were included in the turquoise
common subnetwork. All the downregulated DEGs in the yellow and
turquoise subnetwork are shown in OA (Fig. 3B; Table II). Moreover, all the 5 hub nodes
were present in either the yellow or turquoise subnetworks and the
blue and brown subnetworks did not contain any hub nodes.
Specifically, KDR, CD34 and CDH5 were present in the
yellow subnetwork, and FLT1 and ASPN were present in
the turquoise subnetwork. Consequently, the 23 downregulated genes
in yellow and turquoise subnetworks were considered to be key genes
associated with OA.
| Table II.Genes in the turquoise and yellow
WGCNA-PPI common subnetworks. |
Table II.
Genes in the turquoise and yellow
WGCNA-PPI common subnetworks.
| Module | Gene symbol | log2FC | P-value |
|---|
| Turquoise | ADCY2 | −1.231891879 | 0.02107479 |
|
| ASPN | −3.174936812 | 0.001813696 |
|
| BANK1 | −1.039158068 | 0.040643831 |
|
| CILP | −1.337322006 | 0.017005166 |
|
| CMAHP | −1.69454791 | 0.015905385 |
|
| FLT1 | −2.083203641 | 0.001212928 |
|
| FRY | −1.126732775 | 0.047399489 |
|
| GHR | −1.127449211 | 0.007123746 |
|
| MBOAT1 | −1.193125199 | 0.030776301 |
|
| OGN | −2.05075982 | 0.028726148 |
|
| OMD | −2.042591674 | 0.005478374 |
|
| PDGFD | −1.082416359 | 0.035278215 |
|
| PRELP | −1.07748275 | 0.018850184 |
|
| RHOJ | −1.586566225 | 0.01714161 |
| Yellow | ANGPT2 | −1.800427427 | 0.005234895 |
|
| CD34 | −1.734034415 | 0.003612027 |
|
| CD93 | −1.183506958 | 0.010186758 |
|
| CDH5 | −1.428997713 | 0.005249021 |
|
| DLL4 | −1.032847908 | 0.016503115 |
|
| EMCN | −2.351818405 | 0.005082473 |
|
| ITM2A | −1.377567348 | 0.010768885 |
|
| KDR | −2.312597602 | 0.000534604 |
|
| PTPRB | −1.028136925 | 0.009858035 |
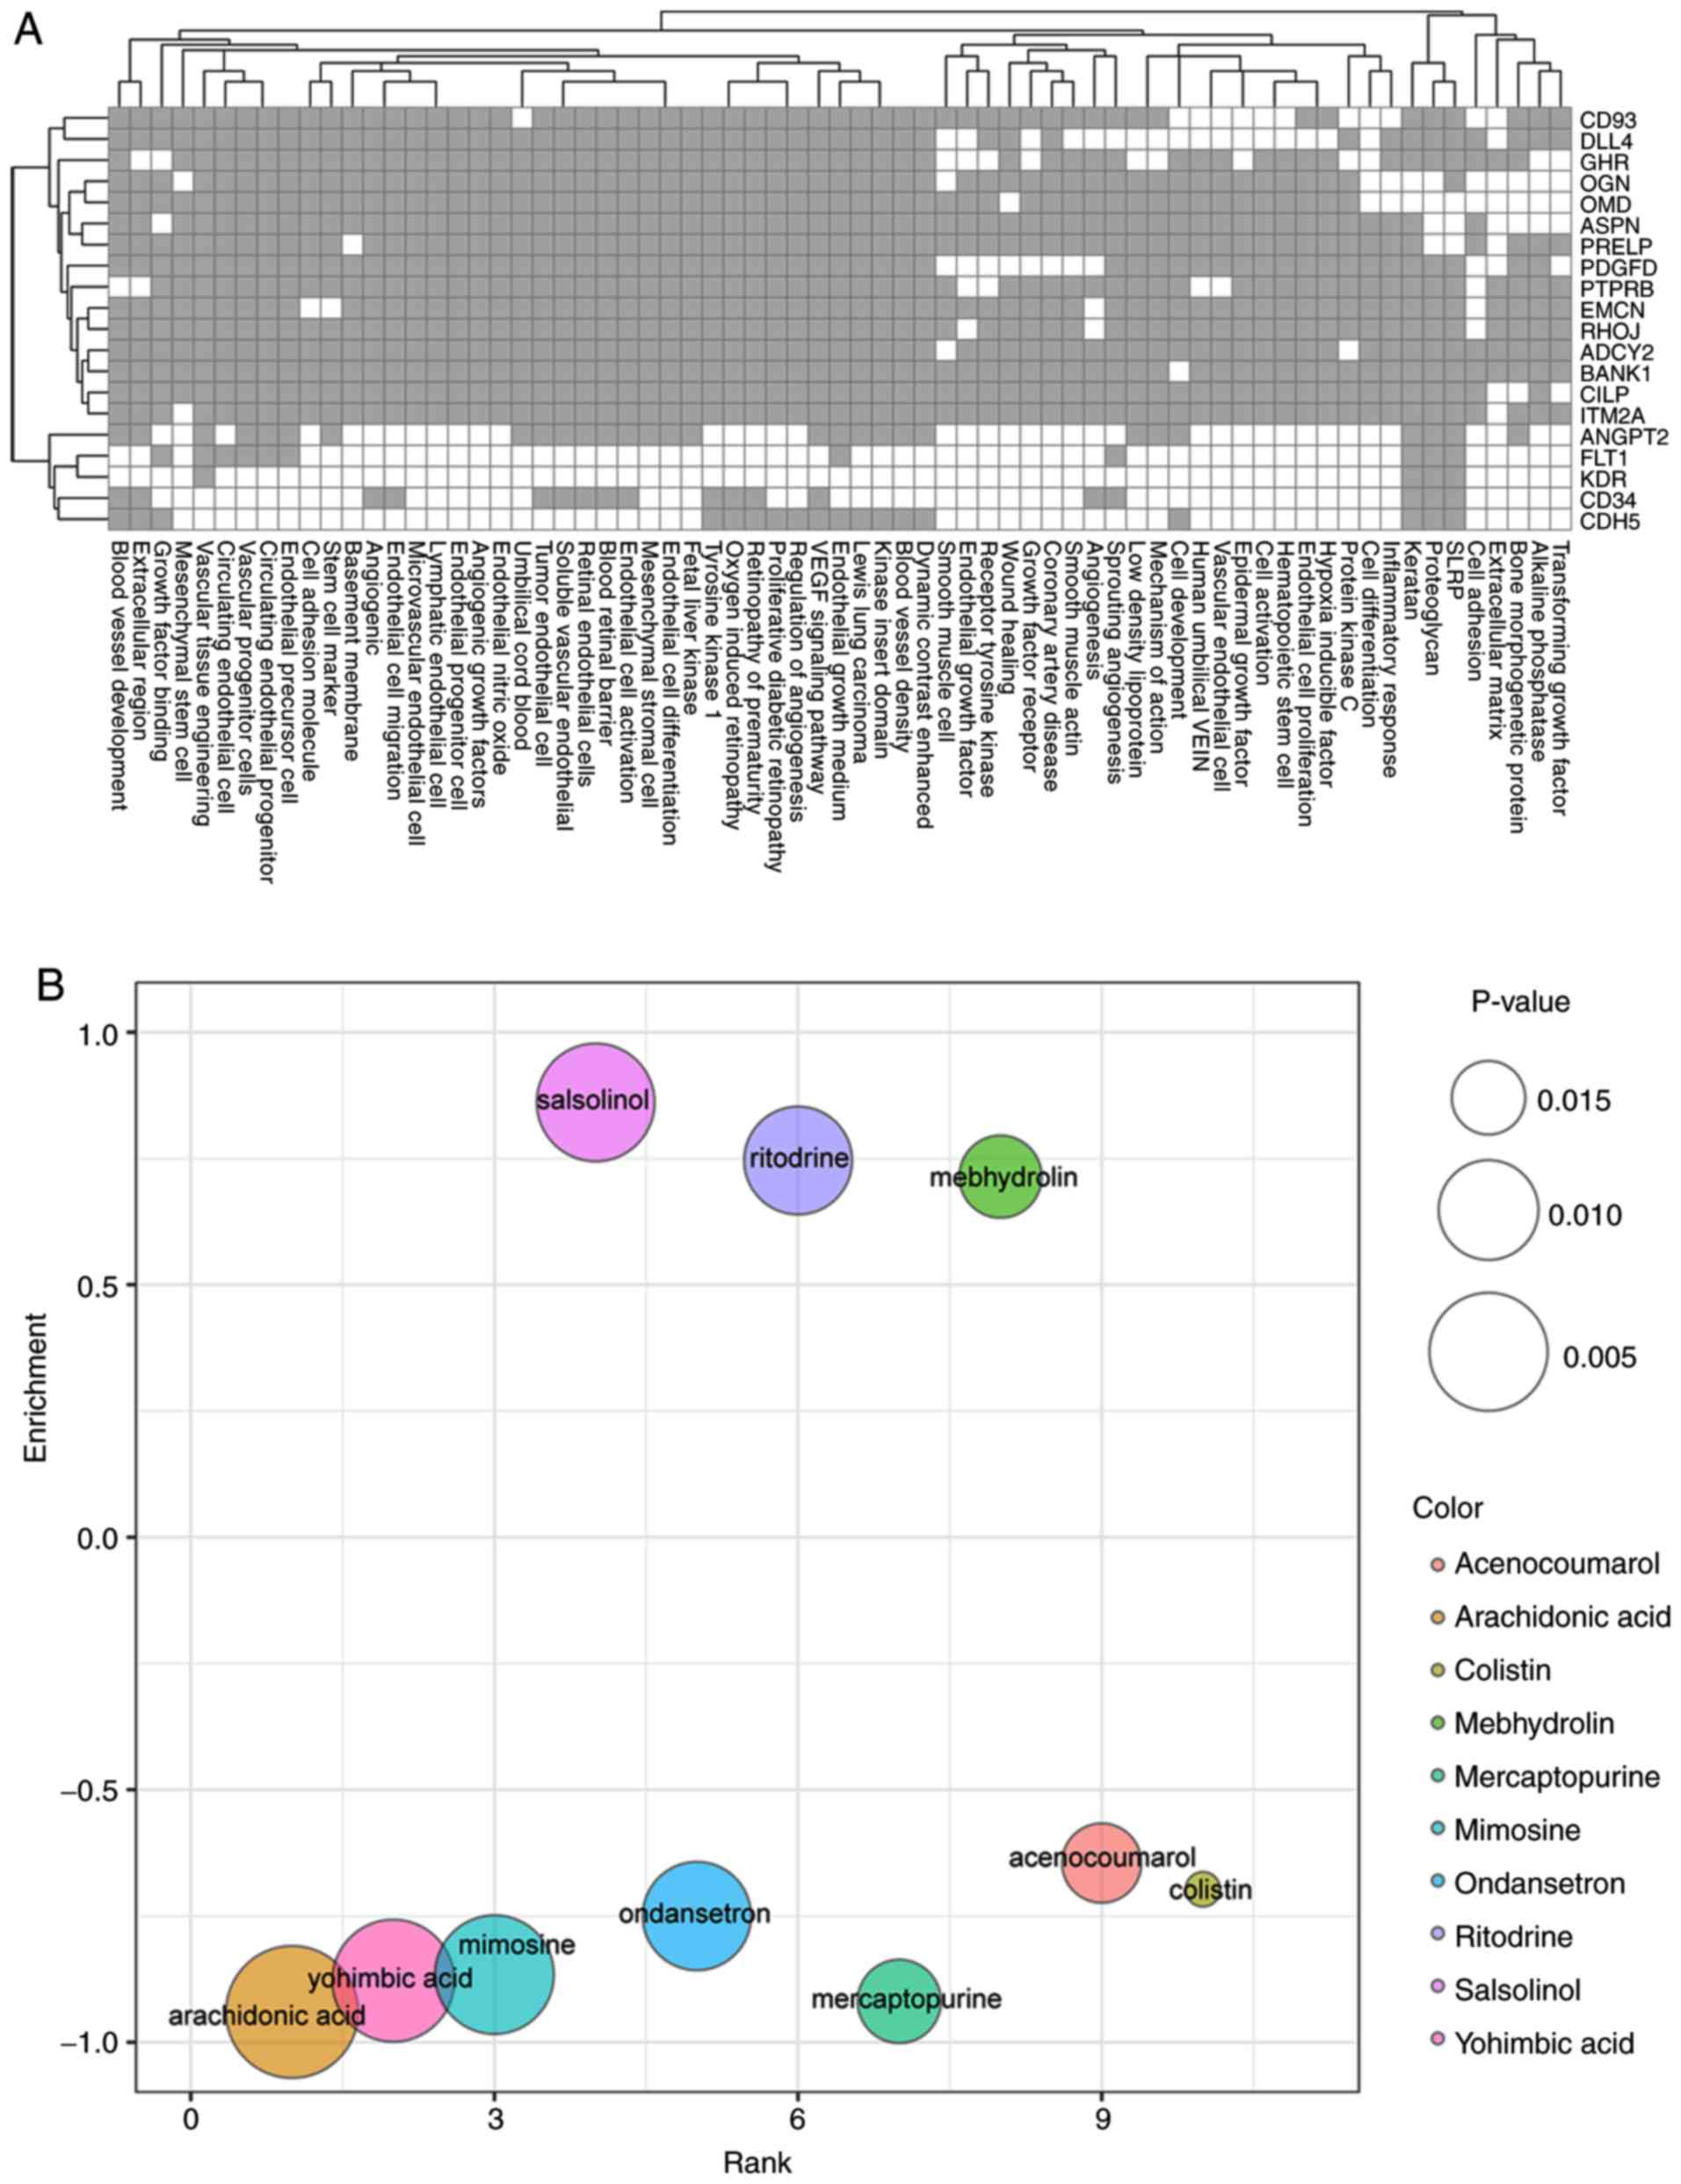
Literature mining analysis of key
genes
In order to study the roles of the 23 key genes in
the development and progression of OA, literature mining analysis
was performed. Using GenCLiP, abundant functional study results
were found for all the 23 genes in yellow and turquoise subnetwork
(Fig. 4A). FLT1, KDR, CD34
and CDH5 were the key genes associated with the most
abundant biological functions. The published literature and related
function of the FLT1, KDR, CD34, and CDH5 in OA are
shown in Table SI. Functional
clusters with the highest scores included transforming growth
factor (TGF), alkaline phosphatase, bone morphogenetic protein
(BMP) and extracellular matrix (ECM).
Small drug molecules targeting
proteins encoded by key genes
Potential small drug molecules targeting proteins
encoded by the key genes were also explored using CMAP. As a
result, 25 drug molecules were obtained associated with OA,
including 15 positively associated and 10 negatively associated
drug molecules (Fig. 4B; Table III). Among the top 10 associated
drug molecules, 3 were positively associated and 7 were negatively
associated with OA (Fig. 4B). The
top 3 drugs were arachidonic acid, yohimbic acid and mimosine.
| Table III.Small drug molecules screened by CMAP
analysis. |
Table III.
Small drug molecules screened by CMAP
analysis.
| Rank | Drug
moleculea | Mean
scoreb | P-value |
|---|
| 1 | Arachidonic
acid | −0.671 | 0.00032 |
| 2 | Yohimbic acid | −0.393 | 0.00373 |
| 3 | Mimosine | −0.392 | 0.00477 |
| 4 | Salsolinol | 0.505 | 0.00505 |
| 5 | Ondansetron | −0.332 | 0.00778 |
| 6 | Ritodrine | 0.394 | 0.0079 |
| 7 | Mercaptopurine | −0.513 | 0.0134 |
| 8 | Mebhydrolin | 0.623 | 0.01359 |
| 9 | Acenocoumarol | −0.339 | 0.0141 |
| 10 | Colistin | −0.421 | 0.01778 |
| 11 | Alimemazine | 0.327 | 0.01908 |
| 12 | Imatinib | 0.507 | 0.02058 |
| 13 | Econazole | 0.515 | 0.02109 |
| 14 | Bretylium
tosilate | −0.316 | 0.02532 |
| 15 | Clebopride | 0.449 | 0.0266 |
| 16 | Etifenin | −0.421 | 0.02672 |
| 17 | Oxybenzone | 0.511 | 0.02711 |
| 18 | Kanamycin | 0.323 | 0.02851 |
| 19 | Spaglumic acid | −0.439 | 0.02897 |
| 20 | Semustine | 0.469 | 0.03083 |
| 21 | Buflomedil | 0.311 | 0.03943 |
| 22 | Quercetin | 0.338 | 0.04007 |
| 23 |
11-deoxy-16,16-dimethylprostaglandin
E2 | 0.338 | 0.0401 |
| 24 | Calmidazolium | 0.24 | 0.04036 |
| 25 | Digitoxigenin | 0.373 | 0.04752 |
Discussion
In the present study, 141 significant DEGs were
screened between OA and healthy labrum cells. A total of 23 DEGs
were identified to be key genes associated with OA. All the key
genes were downregulated in OA labrum cells and could be grouped
into two different WGCNA co-expression modules. Moreover, among the
key genes, FLT1, KDR, CD34 and CDH5 were associated
with the most abundant biological functions and may be
substantially involved in the development and progression of
OA.
In the PPI analysis in the present study, it was
demonstrated that FLT1, KDR, CD34 and CDH5 together
with ASPN, were hub nodes in the PPI network of DEGs. As
mentioned above, a previous bioinformatic study using the same
GSE60762 dataset also demonstrated that FLT1, KDR and
CDH5 were among the hub nodes (13). FLT1 and KDR are
vascular endothelial growth factor (VEGF) receptors activated upon
VEGF binding (28). VEGF signaling
has been reported to promote the formation of cartilage matrix,
indicating that inhibition of VEGF signaling may cause cartilage
damage in OA (29). It was
demonstrated that both FLT1 and KDR were
downregulated in the OA labrum, suggesting that inhibition of VEGF
signaling may also lead to labrum damage in OA. In addition, it has
reported that FLT1/VEGF are associated with the recruitment
and differentiation of osteoclast cells in bone-resorbing and
bone-forming (30,31). Moreover, Hopwood et al
(32) reveals that the expression
of FLT1 is decreased in OA bone and low expression of
FLT1 in OA can promote the activity of VEGF in angiogenesis
and osteogenesis. Similarly, the phosphorylation of
KDR/Flk-1 has been selected in the regulation of
angiogenesis induced by VEGF in several studies (33,34).
The angiogenesis and inflammation causes and effects each other in
the synovium in OA; the inflamed synovium produces VEGF which
accelerates angiogenesis, leading to a further inflammatory
response (35). Also, Mifune et
al (36) has demonstrated that
the upregulation of FLT1 is involved in promoting collagen
synthesis in articular cartilage repair. These findings were all
consistent with the results of literature mining analysis,
suggesting downregulation of those genes might be associated with
angiogenesis and osteogenesis in OA by interacting with VEGF.
CDH5 is a specific marker for endothelial cells, essential
for vascular integrity and endothelial functions (37). It also functions through binding to
KDR to suppress VEGF-driven sprouting (38), further confirming the involvement
of labrum VEGF signaling in OA. ASPN is a member of the SLRP
family, which was found to be downregulated in OA labrum cells by
the analysis of the present study and another bioinformatics study
(14). In contrast, ASPN
was found to be upregulated in OA chondrocytes (39), indicating that distinct
pathological processes could exist in OA cartilage and labrum. The
other hub node, CD34, is ubiquitously expressed on the
surface of hematopoietic cells and represents a marker of
hematopoietic cells (40). It has
been shown that CD34 facilitates the recruitment of
hematopoietic stem cells in the niches of bone marrow (40), which suggests that a loss of
function of CD34 may cause damage to bone and result in OA.
However, the roles of these hub nodes in OA labrum have not been
experimentally studied so far. Further studies are needed to
clarify the specific roles of FLT1, KDR, CD34, CDH5 and
ASPN in the OA labrum.
Various biological functions are dysregulated in OA.
TGFs are essential regulators of cell fate control, such as cell
proliferation, differentiation and apoptosis (41). It has been demonstrated that the
TGFβ signaling pathway is dysregulated in OA cartilage and bone
(42). Reduced TGFβ signaling may
cause a reduction in ECM synthesis of cartilage and therefore lead
to increased susceptibility to OA (43). BMPs are growth factors promoting
chondrocyte proliferation and ECM synthesis (44). Both BMP-4 and BMP-7
have been demonstrated to have a beneficial effect on OA by
improving cartilage repair (44).
Alkaline phosphatase is essential for controlled bone
mineralization (45).
Dysregulation of alkaline phosphatase activity leads to mineralized
bones (45,46). In the present study, it was
demonstrated that TGF signaling, ECM, BMP and alkaline phosphatase
may also be dysregulated in OA labrum. According to the literature
mining analysis of the present study, TGF signaling, ECM, BMP and
alkaline phosphatase were the leading moieties associated with the
key genes, including but not limited to FLT1, KDR, CD34, and
CDH5. However, the roles of TGF signaling, ECM, BMP and
alkaline phosphatase have not been directly studied in OA labrum to
date; therefore, further studies are needed to elucidate their
roles in OA.
Although OA is traditionally considered as a
non-inflammatory disease, increasing evidence supports the
involvement of inflammation in OA (47). Previously, synovitis has been
recognized as a major feature of OA (47,48).
In addition, inflammatory events in other joint tissues, such as
cartilage, bone and ligament also contribute to OA (47,48).
A variety of inflammatory mediators are released during OA
progression. As mentioned above, inflammatory genes including
CD55, PTGES and TNFAIP6 are significantly upregulated
in articular cartilage (7). In the
present study, links were also found between inflammation and OA.
Both arachidonic acid and mimosine, two top small molecular drugs
that were identified by CMAP analysis to target the OA-associated
key genes, are involved in the inflammatory process. L-mimosine is
an anti-inflammatory compound that functions by inhibiting
chemokines, such as monocyte chemoattractant protein-1 and
macrophage inflammatory protein-2 in OA (49). Consistent with this, a negative
correlation between mimosine and OA was identified, indicating the
role of inflammation in OA progression. Unlike mimosine,
arachidonic acid is known for its pro-inflammatory effect (50). Enzymatic oxidation of arachidonic
acid by COX2 produces prostaglandins (50), type of mediators of inflammation,
which promote the production of matrix metallopeptidases (51). However, it was demonstrated that
arachidonic acid was also negatively correlated with OA, which
further complicated the roles of inflammation in OA. Nevertheless,
it was hypothesized that both arachidonic acid and mimosine may
serve as potential candidate drugs for OA treatment, though the
effects of arachidonic acid and mimosine should be evaluated in
future experimental research.
The obvious advantage of the present study is that
an optimized bioinformatics strategy combining WGCNA analysis and
PPI analysis was used to reveal a well-defined and more
comprehensive set of key genes associated with OA. However, the
present study was also limited by the small sample size included in
the original dataset. Due to the particularity of the
osteoarthritic labrum cell samples used, appropriate data for data
validation and clinical samples for experimental validation was not
found. Therefore, studies with a larger number of samples will be
used to verify the results of the present in the future. To
conclude, 23 OA-associated key genes in labrum cells were
identified, among which FLT1, KDR, CD34 and CDH5 may
be involved in the development and progression of OA. It was
hypothesized that the findings would greatly contribute to the
investigation of OA progression; these genes may serve as novel
prognostic and diagnostic biomarker candidates and potential
therapeutic targets of OA, but further studies with large sample
sizes are needed to verify the results of the present study.
Supplementary Material
Supporting Data
Acknowledgements
Not applicable.
Funding
No funding was received.
Availability of data and materials
All data generated or analyzed during the present
study are included in this published article.
Authors' contributions
SW and CJ made substantial contributions to
conception and design, acquisition of data, analysis and
interpretation of data and drafted the manuscript. KZ revised the
manuscript for important intellectual content and conducted the
statistical analysis. All authors read and approved the final
manuscript.
Ethics approval and consent to
participate
Not applicable.
Patient consent for publication
Not applicable.
Competing interest
The authors declare that they have no competing
interest.
References
|
1
|
Johnson VL and Hunter DJ: The epidemiology
of osteoarthritis. Best Pract Res Clin Rheumatol. 28:5–15. 2014.
View Article : Google Scholar : PubMed/NCBI
|
|
2
|
Madry H, Luyten FP and Facchini A:
Biological aspects of early osteoarthritis. Knee Surg Sports
Traumatol Arthrosc. 20:407–422. 2012. View Article : Google Scholar : PubMed/NCBI
|
|
3
|
Zhang Y, Jia J, Yang S, Liu X, Ye S and
Tian H: MicroRNA-21 controls the development of osteoarthritis by
targeting GDF-5 in chondrocytes. Exp Mol Med. 46:e792014.
View Article : Google Scholar : PubMed/NCBI
|
|
4
|
Meulenbelt I, Min JL, Bos S, Riyazi N,
Houwing-Duistermaat JJ, van der Wijk HJ, Kroon HM, Nakajima M,
Ikegawa S, Uitterlinden AG, et al: Identification of DIO2 as a new
susceptibility locus for symptomatic osteoarthritis. Hum Mol Genet.
17:1867–1875. 2008. View Article : Google Scholar : PubMed/NCBI
|
|
5
|
Bomer N, den Hollander W, Ramos YF, Bos
SD, van der Breggen R, Lakenberg N, Pepers BA, van Eeden AE,
Darvishan A, Tobi EW, et al: Underlying molecular mechanisms of
DIO2 susceptibility in symptomatic osteoarthritis. Ann Rheum Dis.
74:1571–1579. 2015. View Article : Google Scholar : PubMed/NCBI
|
|
6
|
Sharma AC, Srivastava RN, Srivastava SR,
Parmar D, Singh A and Raj S: Association between single nucleotide
polymorphisms of SMAD3 and BMP5 with the risk of knee
osteoarthritis. J Clin Diagn Res. 11:GC01–GC04. 2017.PubMed/NCBI
|
|
7
|
Ramos YF, den Hollander W, Bovée JV, Bomer
N, van der Breggen R, Lakenberg N, Keurentjes JC, Goeman JJ,
Slagboom PE, Nelissen RG, et al: Genes involved in the
osteoarthritis process identified through genome wide expression
analysis in articular cartilage; the RAAK study. PLoS One.
9:e1030562014. View Article : Google Scholar : PubMed/NCBI
|
|
8
|
Aigner T, Fundel K, Saas J, Gebhard PM,
Haag J, Weiss T, Zien A, Obermayr F, Zimmer R and Bartnik E:
Large-scale gene expression profiling reveals major pathogenetic
pathways of cartilage degeneration in osteoarthritis. Arthritis
Rheum. 54:3533–3544. 2006. View Article : Google Scholar : PubMed/NCBI
|
|
9
|
Szychlinska MA, Trovato FM, Di Rosa M,
Malaguarnera L, Puzzo L, Leonardi R, Castrogiovanni P and Musumeci
G: Co-expression and co-localization of cartilage glycoproteins
CHI3L1 and lubricin in osteoarthritic cartilage: Morphological,
immunohistochemical and gene expression profiles. Int J Mol Sci.
17:3592016. View Article : Google Scholar : PubMed/NCBI
|
|
10
|
Musumeci G, Mobasheri A, Trovato FM,
Szychlinska MA, Graziano AC, Lo Furno D, Avola R, Mangano S,
Giuffrida R and Cardile V: Biosynthesis of collagen I, II, RUNX2
and lubricin at different time points of chondrogenic
differentiation in a 3D in vitro model of human mesenchymal stem
cells derived from adipose tissue. Acta Histochem. 116:1407–1417.
2014. View Article : Google Scholar : PubMed/NCBI
|
|
11
|
Di Rosa M, Szychlinska MA, Tibullo D,
Malaguarnera L and Musumeci G: Expression of CHI3L1 and CHIT1 in
osteoarthritic rat cartilage model. A morphological study. Eur J
Histochem. 58:24232014. View Article : Google Scholar : PubMed/NCBI
|
|
12
|
Giunta S, Castorina A, Marzagalli R,
Szychlinska MA, Pichler K, Mobasheri A and Musumeci G: Ameliorative
effects of PACAP against cartilage degeneration. Morphological,
immunohistochemical and biochemical evidence from in vivo and in
vitro models of rat osteoarthritis. Int J Mol Sci. 16:5922–5944.
2015. View Article : Google Scholar : PubMed/NCBI
|
|
13
|
Wang B, Zhao J and Zhang P: Gene
signatures in osteoarthritic acetabular labrum using microarray
analysis. Int J Rheum Dis. 20:1927–1934. 2017. View Article : Google Scholar : PubMed/NCBI
|
|
14
|
Juchtmans N, Dhollander AA, Coudenys J,
Audenaert EA, Pattyn C, Lambrecht S and Elewaut D: Distinct
dysregulation of the small leucine-rich repeat protein family in
osteoarthritic acetabular labrum compared to articular cartilage.
Arthritis Rheumatol. 67:435–441. 2015. View Article : Google Scholar : PubMed/NCBI
|
|
15
|
Najafi A, Tavallaei M and Hosseini SM: A
systems biology approach for miRNA-mRNA expression patterns
analysis in non-small cell lung cancer. Cancer Biomark. 16:31–45.
2016. View Article : Google Scholar : PubMed/NCBI
|
|
16
|
Barrett T and Edgar R: Gene expression
omnibus: Microarray data storage, submission, retrieval, and
analysis. Methods Enzymol. 411:352–369. 2006. View Article : Google Scholar : PubMed/NCBI
|
|
17
|
Altman NS: An introduction to kernel and
nearest-neighbor nonparametric regression. Am Statistician.
46:175–185. 1992. View
Article : Google Scholar
|
|
18
|
Hastie T, Tibshirani R, Balasubramanian N
and Chu G: Impute: Imputation for microarray data. R package
version 1.42. 0. 2013.
|
|
19
|
Bolstad BM: preprocess Core: A collection
of pre-processing functions. R package version. 1:2013.
|
|
20
|
Smyth GK, Ritchie M, Thorne N and
Wettenhall J: LIMMA: Linear models for microarray data. In
bioinformatics and computational biology solutions using R and
bioconductor. Statistics for Biology and Health. 2005. View Article : Google Scholar
|
|
21
|
Langfelder P and Horvath S: WGCNA: An R
package for weighted correlation network analysis. BMC
Bioinformatics. 9:5592008. View Article : Google Scholar : PubMed/NCBI
|
|
22
|
Ashburner M, Ball CA, Blake JA, Botstein
D, Butler H, Cherry JM, Davis AP, Dolinski K, Dwight SS, Eppig JT,
et al: Gene Ontology: Tool for the unification of biology. The Gene
Ontology Consortium. Nat Genet. 25:25–29. 2000. View Article : Google Scholar : PubMed/NCBI
|
|
23
|
Yu G, Wang LG, Han Y and He QY:
clusterProfiler: An R package for comparing biological themes among
gene clusters. OMICS. 16:284–287. 2012. View Article : Google Scholar : PubMed/NCBI
|
|
24
|
von Mering C, Jensen LJ, Kuhn M, Chaffron
S, Doerks T, Krüger B, Snel B and Bork P: STRING 7-recent
developments in the integration and prediction of protein
interactions. Nucleic Acids Res 35 (Database Isuue). D358–D362.
2007. View Article : Google Scholar
|
|
25
|
Shannon P, Markiel A, Ozier O, Baliga NS,
Wang JT, Ramage D, Amin N, Schwikowski B and Ideker T: Cytoscape: A
software environment for integrated models of biomolecular
interaction networks. Genome Res. 13:2498–2504. 2003. View Article : Google Scholar : PubMed/NCBI
|
|
26
|
Wang JH, Zhao LF, Lin P, Su XR, Chen SJ,
Huang LQ, Wang HF, Zhang H, Hu ZF, Yao KT and Huang ZX: GenCLiP
2.0: A web server for functional clustering of genes and
construction of molecular networks based on free terms.
Bioinformatics. 30:2534–2536. 2014. View Article : Google Scholar : PubMed/NCBI
|
|
27
|
Lamb J, Crawford ED, Peck D, Modell JW,
Blat IC, Wrobel MJ, Lerner J, Brunet JP, Subramanian A, Ross KN, et
al: The Connectivity Map: Using gene-expression signatures to
connect small molecules, genes, and disease. Science.
313:1929–1935. 2006. View Article : Google Scholar : PubMed/NCBI
|
|
28
|
Ferrara N, Gerber HP and LeCouter J: The
biology of VEGF and its receptors. Nat Med. 9:669–676. 2003.
View Article : Google Scholar : PubMed/NCBI
|
|
29
|
Pesesse L, Sanchez C and Henrotin Y:
Osteochondral plate angiogenesis: A new treatment target in
osteoarthritis. Joint Bone Spine. 78:144–149. 2011. View Article : Google Scholar : PubMed/NCBI
|
|
30
|
Mayr-Wohlfart U, Waltenberger J, Hausser
H, Kessler S, Günther KP, Dehio C, Puhl W and Brenner RE: Vascular
endothelial growth factor stimulates chemotactic migration of
primary human osteoblasts. Bone. 30:472–477. 2002. View Article : Google Scholar : PubMed/NCBI
|
|
31
|
Deckers MM, Karperien M, Van der Bent C,
Yamashita T, Papapoulos SE and Löwik CW: Expression of vascular
endothelial growth factors and their receptors during osteoblast
differentiation. Endocrinology. 141:1667–1674. 2000. View Article : Google Scholar : PubMed/NCBI
|
|
32
|
Hopwood B, Gronthos S, Kuliwaba JS, Robey
PG, Findlay DM and Fazzalari NL: Identification of differentially
expressed genes between osteoarthritic and normal trabecular bone
from the intertrochanteric region of the proximal femur using cDNA
microarray analysis. Bone. 36:635–644. 2005. View Article : Google Scholar : PubMed/NCBI
|
|
33
|
Gao Y, Lu N, Ling Y, Chen Y, Wang L, Zhao
Q, Qi Q, Liu W, Zhang H, You Q and Guo Q: Oroxylin A inhibits
angiogenesis through blocking vascular endothelial growth
factor-induced KDR/Flk-1 phosphorylation. J Cancer Res Clin Oncol.
136:667–675. 2010. View Article : Google Scholar : PubMed/NCBI
|
|
34
|
Kwak HJ, Park MJ, Park CM, Moon SI, Yoo
DH, Lee HC, Lee SH, Kim MS, Lee HW, Shin WS, et al: Emodin inhibits
vascular endothelial growth factor-A-induced angiogenesis by
blocking receptor-2 (KDR/Flk-1) phosphorylation. Int J Cancer.
118:2711–2720. 2010. View Article : Google Scholar
|
|
35
|
Haywood L, Mcwilliams DF, Pearson CI, Gill
SE, Ganesan A, Wilson D and Walsh DA: Inflammation and angiogenesis
in osteoarthritis. Arthritis Rheum. 48:2173–2177. 2003. View Article : Google Scholar : PubMed/NCBI
|
|
36
|
Mifune Y, Matsumoto T, Takayama K, Ota S,
Li H, Meszaros LB, Usas A, Nagamune K, Gharaibeh B, Fu FH and Huard
J: The effect of platelet-rich plasma on the regenerative therapy
of muscle derived stem cells for articular cartilage repair.
Osteoarthritis Cartilage. 21:175–185. 2013. View Article : Google Scholar : PubMed/NCBI
|
|
37
|
Mao XG, Xue XY, Wang L, Zhang X, Yan M, Tu
YY, Lin W, Jiang XF, Ren HG, Zhang W and Song SJ: CDH5 is
specifically activated in glioblastoma stemlike cells and
contributes to vasculogenic mimicry induced by hypoxia. Neuro
Oncol. 15:865–879. 2013. View Article : Google Scholar : PubMed/NCBI
|
|
38
|
Abraham S, Yeo M, Montero-Balaguer M,
Paterson H, Dejana E, Marshall CJ and Mavria G:
VE-Cadherin-mediated cell-cell interaction suppresses sprouting via
signaling to MLC2 phosphorylation. Curr Biol. 19:668–674. 2009.
View Article : Google Scholar : PubMed/NCBI
|
|
39
|
Strassburger M, Bloch W, Sulyok S,
Schüller J, Keist AF, Schmidt A, Wenk J, Peters T, Wlaschek M,
Lenart J, et al: Heterozygous deficiency of manganese superoxide
dismutase results in severe lipid peroxidation and spontaneous
apoptosis in murine myocardium in vivo. Free Radic Biol Med.
38:1458–1470. 2005. View Article : Google Scholar : PubMed/NCBI
|
|
40
|
Sidney LE, Branch MJ, Dunphy SE, Dua HS
and Hopkinson A: Concise review: Evidence for CD34 as a common
marker for diverse progenitors. Stem cells. 32:1380–1389. 2014.
View Article : Google Scholar : PubMed/NCBI
|
|
41
|
Kamato D, Burch ML, Piva TJ, Rezaei HB,
Rostam MA, Xu S, Zheng W, Little PJ and Osman N: Transforming
growth factor-β signalling: Role and consequences of Smad linker
region phosphorylation. Cell Signal. 25:2017–2024. 2013. View Article : Google Scholar : PubMed/NCBI
|
|
42
|
Grafe I, Yang T, Alexander S, Homan EP,
Lietman C, Jiang MM, Bertin T, Munivez E, Chen Y, Dawson B, et al:
Excessive transforming growth factor-beta signaling is a common
mechanism in osteogenesis imperfecta. Nat Med. 20:670–675. 2014.
View Article : Google Scholar : PubMed/NCBI
|
|
43
|
Blaney Davidson EN, van der Kraan PM and
van den Berg WB: TGF-beta and osteoarthritis. Osteoarthritis
Cartilage. 15:597–604. 2007. View Article : Google Scholar : PubMed/NCBI
|
|
44
|
Kuroda R, Usas A, Kubo S, Corsi K, Peng H,
Rose T, Cummins J, Fu FH and Huard J: Cartilage repair using bone
morphogenetic protein 4 and muscle-derived stem cells. Arthritis
Rheum. 54:433–442. 2006. View Article : Google Scholar : PubMed/NCBI
|
|
45
|
Hessle L, Johnson KA, Anderson HC,
Narisawa S, Sali A, Goding JW, Terkeltaub R and Millan JL:
Tissue-nonspecific alkaline phosphatase and plasma cell membrane
glycoprotein-1 are central antagonistic regulators of bone
mineralization. Proc Natl Acad Sci USA. 99:9445–9449. 2002.
View Article : Google Scholar : PubMed/NCBI
|
|
46
|
Addison WN, Azari F, Sørensen ES,
Kaartinen MT and McKee MD: Pyrophosphate inhibits mineralization of
osteoblast cultures by binding to mineral, up-regulating
osteopontin, and inhibiting alkaline phosphatase activity. J Biol
Chem. 282:15872–15883. 2007. View Article : Google Scholar : PubMed/NCBI
|
|
47
|
Berenbaum F: Osteoarthritis as an
inflammatory disease (osteoarthritis is not osteoarthrosis!).
Osteoarthritis Cartilage. 21:16–21. 2013. View Article : Google Scholar : PubMed/NCBI
|
|
48
|
Goldring MB and Otero M: Inflammation in
osteoarthritis. Curr Opin Rheumatol. 23:471–478. 2011. View Article : Google Scholar : PubMed/NCBI
|
|
49
|
Melgarejo E, Medina MA, Sánchez-Jiménez F
and Urdiales JL: Monocyte chemoattractant protein-1: A key mediator
in inflammatory processes. Int J Biochem Cell Biol. 41:998–1001.
2009. View Article : Google Scholar : PubMed/NCBI
|
|
50
|
Kuehl FA Jr and Egan RW: Prostaglandins,
arachidonic acid, and inflammation. Science. 210:978–984. 1980.
View Article : Google Scholar : PubMed/NCBI
|
|
51
|
Pillinger MH, Marjanovic N, Kim SY, Scher
JU, Izmirly P, Tolani S, Dinsell V, Lee YC, Blaser MJ and Abramson
SB: Matrix metalloproteinase secretion by gastric epithelial cells
is regulated by E prostaglandins and MAPKs. J Biol Chem.
280:9973–9979. 2005. View Article : Google Scholar : PubMed/NCBI
|