Introduction
Chronic gouty arthritis is a crystal-forming type of
arthritis that causes severe inflammation and irreversible bone
erosion, in which chondrocytes may serve an important role.
Patients with gout display severe cartilage destruction and empty
chondrocyte lacunae upon histopathological examination (1). A number of studies have demonstrated
reduced cell viability and impaired functionality of chondrocytes
following stimulation with monosodium urate monohydrate (MSU)
crystals (1–3); however, MSU is precipitated from
synovial soluble uric acid (sUA) in vivo only under certain
conditions (4). Thus, the impact
of sUA on chondrocytes may occur prior to MSU formation in gout,
which is characterized by hyperuricemia. It was reported that sUA
could lead to cellular dysfunction and a loss of viability in
numerous cell types, including renal tubular cells (5), endothelial cells (6), vascular smooth muscle cells (7,8),
hepatocytes (9), pancreatic
β-cells (10,11) and adipocytes (12); however, at present, few studies
have focused on the effects of high levels of sUA on
chondrocytes.
The oxidative properties of sUA require entry into
the intracellular environment; previous experiments have
demonstrated that inhibiting the entry of sUA into the cytoplasm
blocked sUA-induced oxidative damage (5–9,12–14).
Glucose transporter 9 (GLUT9) and urate transporter 1 (URAT1), the
most notable reabsorptive urate transporters, regulate the access
of sUA into the cytoplasm under normal and pathological conditions
(15). GLUT9 serves a major role
in UA homeostasis via its dual role in UA handling in the kidneys
and uptake in the liver (16). In
the Chinese population, a missense mutation in the GLUT9 gene was
associated with chronic gouty arthritis (17); however, its UA transport capacity
in chondrocytes and further actions in gout-associated cartilage
damage are yet to be determined. URAT1 has been reported to be
expressed in renal tubular cells (18), pancreatic β-cells (10,11),
endothelial cells (6), vascular
smooth muscle cells (19) and
adipocytes (12). The expression
and uric transport function of URAT1 in chondrocytes have not been
investigated.
To the best of our knowledge, whether there is a UA
transport process in chondrocytes has not been previously studied,
and the contribution of UA transport in chondrocytes to gouty
arthritis is yet to be identified. Therefore, the expression
profiles of GLUT9 and URAT1, and their contribution to UA transport
capacity in chondrocytes were investigated in the present
study.
Materials and methods
Tissue samples
The present study was approved by the Institutional
Review Board of Peking Union Medical College Hospital (permit no.
ZS-1445), and was conducted in accordance with the Declaration of
Helsinki. Human articular cartilage (AC) was obtained from patients
at the Orthopedic Department of the Peking Union Medical College
Hospital between December 2017 and March 2018. All patients signed
informed consent prior to the collection of samples. The inclusion
criteria were a diagnosis of femoral neck fracture due to trauma
and a requirement for a total hip replacement. Patients were
excluded if they exhibited: i) Hyperuricemia; ii) gout; iii)
arthritis; iv) rheumatoid arthritis; v) femoral head necrosis of
any origin; and vi) cancer. AC samples were obtained from the
otherwise discarded femoral head. AC tissue was immediately
snap-frozen in liquid nitrogen, with the remaining sample immersed
in 10% formalin at room temperature overnight for paraffin
embedding. The clinical characteristics of the 5 patients from whom
the AC samples were obtained are presented in Table SI.
Immunohistochemistry
Immunohistochemical assays were performed as
previously described (20).
Cartilage sections (thickness, 5 µm) were immersed at room
temperature within 3% hydrogen peroxide in the dark for 25 min and
then 3% BSA (cat. no. A8010; Beijing Solarbio Science &
Technology Co., Ltd.) for 30 min at room temperature to block the
endogenous peroxidase and non-specific protein, respectively. Then
the sections were incubated at 4°C overnight with rabbit polyclonal
antibodies against collagen II (1:100; cat. no. ab34712; Abcam),
human GLUT9 (1:100; cat. no. ab223470; Abcam), and human URAT1
(1:100; cat. no. 14937-1-AP; ProteinTech Group, Inc.). PBS was used
as an negative control (Fig. S1).
Sections were labeled with horseradish peroxidase (HRP)-conjugated
goat anti-rabbit immunoglobulin G heavy and light chain (IgG
H&L) secondary antibody (1:1,000; cat. no. ab6721; Abcam) at
room temperature for 50 min. Resolution with 3,3′-diaminobenzidine
substrate (cat. no. DA1010; Beijing Solarbio Science &
Technology Co., Ltd.) was guided microscopically. Cell nuclei were
counterstained with aqueous hematoxylin at room temperature for 3
min. Digital images were captured using a Nikon Microphot-FX
microscope (magnification ×100 and ×200; Nikon Corporation).
Human articular chondrocyte cell line
and gene knockdown
The human articular chondrocyte (HC-a) cell line,
derived from human ACs, was purchased from ScienCell Research
Laboratories, Inc. (cat. no. 4650). Cells were cultured at 37°C in
an humidified incubator with 5% CO2 with complete
chondrocyte medium that contained 5% FBS, 1% chondrocyte growth
supplement and 1% penicillin/streptomycin (cat. no. 4651; ScienCell
Research Laboratories, Inc.).
Gene knockdown was performed as previously described
(21). HC-a cells were cultured
24-well plates until they reached 1×10⁶ cells/well, and
the medium was replaced fresh medium containing 6 µg/ml
Polybrene® (cat. no. sc-134220; Santa Cruz
Biotechnology, Inc.). A total of 10 µl lentiviral particles
containing short hairpin (sh)RNA against SLC2A9 (the gene
encoding GLUT9; cat. no. sc-105399-V; Santa Cruz Biotechnology,
Inc.) or SLC22A12 (the gene encoding URAT1; cat. no.
sc-96373-V; Santa Cruz Biotechnology, Inc.) were then added and
incubated for at 37°C 24 h. Scrambled vector (cat. no. sc-108080;
Santa Cruz Biotechnology, Inc.) was used as a negative control.
Cells were then cultured in fresh complete medium and allowed to
grow to 90% confluency for ~24 h.
Humane embryonic kidney cells 293 and
gene overexpression
293 cells were purchased from the National
Infrastructure of Cell Line Resource (cat. no. 3111C0001CCC000010).
293 cells were cultured at 37°C with 5% CO2 in HyClone™
Minimal Essential Medium with Earle's (cat. no. SH30024.01; Beijing
Solarbio Science & Technology Co., Ltd.) supplemented with 10%
FBS (cat. no. P30-3302; PAN-Biotech).
293 cells were cultured on 24-well plates to a
density of 1×10⁶ cells/well and then subjected to gene
overexpression as previously reported (22). The recombinant plasmids
SLC2A9 pcDNA3.1-T2A-EGFP (Fig.
S2) and SLC22A12 pcDNA3.1-T2A-EGFP (Fig. S3) were purchased from Hanbio
Biotechnology Co., Ltd. Briefly, 0.8 µg plasmids were mixed with 2
µl LipoFiter™ liposomal transfection reagent (car. no.
HB-TRLF-1000; Hanbio Biotechnology Co., Ltd.) for 20 min at room
temperature and then added to cells. Empty vector
(pcDNA3.1-T2A-EGFP; Hanbio Biotechnology Co., Ltd.) was used as a
negative control. Following transduction for 6 h, the medium was
replaced with complete medium. Cells were then allowed to grow to
90% confluency for ~24 h.
Reverse transcription-quantitative PCR
(RT-qPCR)
Total RNA was extracted with TRIzol®
(cat. no. DP405-02; Tiangen Biotech Co., Ltd.) according to the
manufacturer's protocols. After converting the RNA to cDNA using a
PrimeScript™ RT kit (cat. no. RR047B; Takara Biotechnology Co.,
Ltd.), qPCR was conducted using Bio-Rad iQ5 and SYBR Green Master
Mix (cat. no. ABI7500; Bio-Rad Laboratories, Inc.) under the
following thermocycling conditions: 95°C for 30 sec, followed by 40
cycles of 95°C for 5 sec and 60°C for 40 sec, and then 95°C for 10
sec, 60°C for 60 sec and 95°C for 15 sec to obtain the melting
curve; finally, samples were slowly heated to 99°C. The relative
gene expression was quantified with the 2−∆∆Cq method
(23). Data were normalized to
β-actin mRNA levels. The primers used were as follows: GLUT9,
forward 5′-CCTGTTTGGAGTGATTGTGGT-3′, reverse
5′CTTGCCTCGTTGTGCTTCTC-3′; URAT1, forward 5′GCCCGACACCATCCAAGA-3′,
reverse 5′-TTCCTCTGACCGTCCCATC-3′; and β-actin, forward
5′CATCCCCCAAAGTTCACAAT3′ and reverse
5′-AGTGGGGTGGCTTTTAGGAT-3′.
Immunofluorescence
Immunofluorescence staining was performed according
to previously reported protocols (22). Cells were cultured on coverslips
and fixed in 4% paraformaldehyde at room temperature for 15 min.
Following permeabilization with 0.1% Triton X-100 and blocking with
normal goat serum (cat. no. SL038; Beijing Solarbio Science &
Technology Co., Ltd.) at room temperature for 20 and 30 min,
respectively, cells were then incubated with rabbit polyclonal
antibodies against human GLUT9 (1:100; cat. no. ab223470; Abcam)
and human URAT1 (1:200; cat. no. 14937-1-AP; ProteinTech Group.
Inc.) overnight at 4°C, followed by incubation with FITC-conjugated
mouse anti-rabbit IgG (1:1,000; cat. no. sc-2359; Santa Cruz
Biotechnology, Inc.) for 1 h at room temperature. PBS was used as a
negative control (Fig. S4). Cell
nuclei were counterstained with DAPI (cat. no. D21490; Invitrogen;
Thermo Fisher Scientific, Inc.) at room temperature in the dark for
5 min. Cells were imaged using a fluorescence photomicroscope
(IX51; Olympus Corporation; magnification ×400) and analyzed with
Image-Pro Plus 6.0 software (Media Cybernetics, Inc.) (24).
Protein preparation
Whole-cell protein lysates from cell lines and
frozen tissue samples were prepared using RIPA lysis and extraction
buffer (cat. no. 89901; Thermo Fisher Scientific, Inc.), and tissue
extraction reagent I (cat. no. FNN0071; Thermo Fisher Scientific,
Inc.) supplemented with Halt protease inhibitor cocktail (cat. no.
78425; Thermo Fisher Scientific, Inc.), respectively. To separate
cell membrane and cytoplasmic proteins, a membrane and cytosol
protein extraction kit (cat. no. P0033; Beyotime Institute of
Biotechnology) was used. Briefly, cells were minced on ice and then
centrifuged at 700 × g for 10 min to remove cell nuclei and
unminced cells. Samples were then centrifuged again at 14,000 × g
for 30 min to collect the supernatant, which contained the
cytoplasmic protein. The sediments were re-suspended with solution
B from the kit, vortexed 2–3 times for 5 sec, and then further
centrifuged at 14,000 × g for ٥ min, prior to collection of the
final the supernatant, which contained the membrane protein. All
centrifugations here were performed at 4°C. Protein content was
determined using a bicinchoninic acid kit (cat. no. P1511; Applygen
Technologies, Inc.).
Western blot analysis
Western blotting was conducted as previously
described (24). Proteins (30 µg)
were separated via 10% SDS-PAGE under reducing conditions, and
transferred onto nitrocellulose membranes. Following blocking with
5% skimmed milk at room temperature for 1 h, membranes were
incubated with primary antibodies at 4°C overnight, and labeled
with secondary antibodies at room temperature for 45 min. The
primary antibodies used for western blot analysis included: Rabbit
polyclonal antibodies to collagen II (1:1,000; cat. no. ab34712;
Abcam), human GLUT9 (1:1,000; cat. no. ab223470; Abcam), and human
URAT1 (1:600; cat. no. 14937-1-AP; ProteinTech Group, Inc.). Mouse
polyclonal antibodies against β-actin (1:1,000; cat. no. ab8226;
Abcam), Na-K ATPase (EP1845Y; 1:5,000; cat. no. ab76020; Abcam) and
GAPDH (EPR16891; 1:5,000; cat. no. ab181602; Abcam) were used as
loading controls for whole cell, cell membrane and cytoplasmic
protein extracts, respectively. PBS was used as a negative control
(Fig. S5). HRP-conjugated goat
anti-rabbit IgG H&L (1:10,000; cat. no. ab6721; Abcam) and goat
anti-mouse IgG H&L (1:10,000; cat. no. ab205719; Abcam)
antibodies were used as the secondary antibodies. Chemiluminescence
was performed using Pierce™ Fast Western Blot ECL substrate (cat.
no. 35055; Thermo Fisher Scientific, Inc.). Densitometric analysis
of the band intensities was conducted using AlphaView Stand Alone
(version 3.4.0, ProteinSimple) as previously described (24).
UA transport assays
Cells were cultured in 6-well plates to a density of
1×10⁶ per well and washed with Krebs-Ringer bicarbonate
(KRP) buffer (cat. no. G0430; Beijing Solarbio Science &
Technology Co., Ltd.). Cells were pretreated with KRP buffer
containing 50 µM benzbromarone for 30 min and incubated with 1 mM
benzbromarone for an additional 30 min. It was previously
demonstrated that rapid UA transport occurs as early as 20 min
post-incubation with UA (14),
which could be inhibited by benzbromarone at a concentration of 50
µM (25,26). Thus, for UA transport assays, cells
were starved in KRP for 30 min, followed by the addition of
exogenous sUA (cat. no. U0881; Sigma-Aldrich; Merck KGaA) at
concentrations of 0, 0.25, 0.50, 0.75 and 1 mM at 37 °C for 30 min.
For inhibition assays, cells were pretreated with KRP buffer
containing 50 µM benzbromarone (J&K Scientific Ltd.) at 37°C
for 30 min and incubated with 1 mM sUA at 37°C for a further 30
min.
Following this incubation, supernatants were
removed, cells were washed twice with cold PBS and intracellular UA
concentrations were measured using Colorimetric UA assay kits (cat.
no. ab65344; Abcam) according to the manufacturer's protocols.
Briefly, cells were resuspended in UA assay buffer and centrifuged
at 13,000 × g at 4°C for 5 min. Supernatants were collected and
reaction solutions were added for 30 min at 37°C in the dark. The
optical density at 570 nm was measured using a microplate reader.
Standard curves were obtained with UA standards.
Statistical analysis
Data were presented as the mean ± standard deviation
of at least three independent experiments, with the exception of
western blot analysis of human cartilage samples, which presented
protein for individual patients, with error bars indicating the
variation observed in three replicates. A linear regression model
was used to study the association between exogenous sUA and the
intracellular UA concentration following incubation. Student's
t-tests and one-way ANOVA followed by Bonferroni's test were used
to compare results in two groups and >2 groups, respectively.
P<0.05 was considered to indicate a statistically significant
difference. Stata14.0 (StataCorp LP) was used for statistical
analysis.
Results
GLUT9 and URAT1 are expressed in human
cartilage and HC-a chondrocyte cells
A total of 5 AC samples were collected during the
present study. The clinical characteristics of the 5 patients from
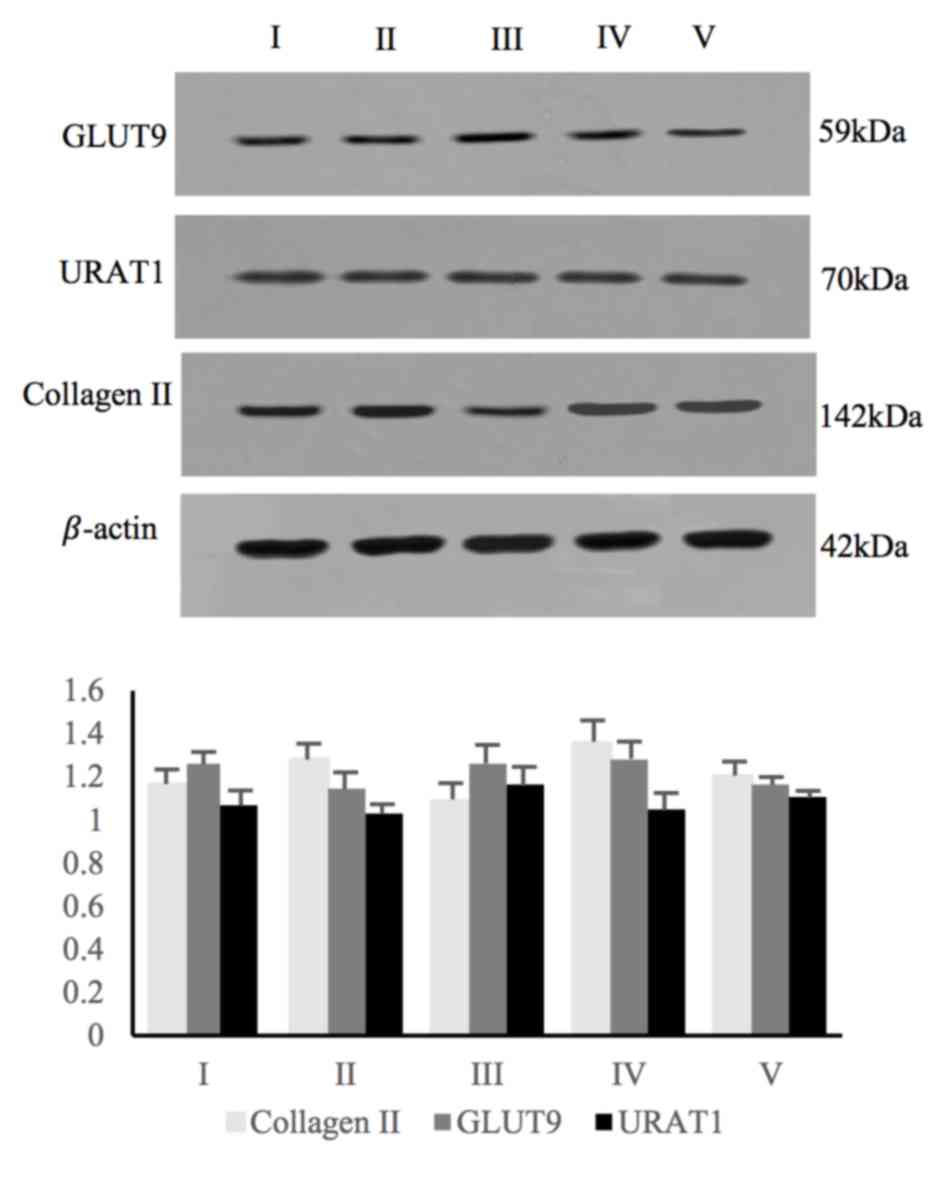
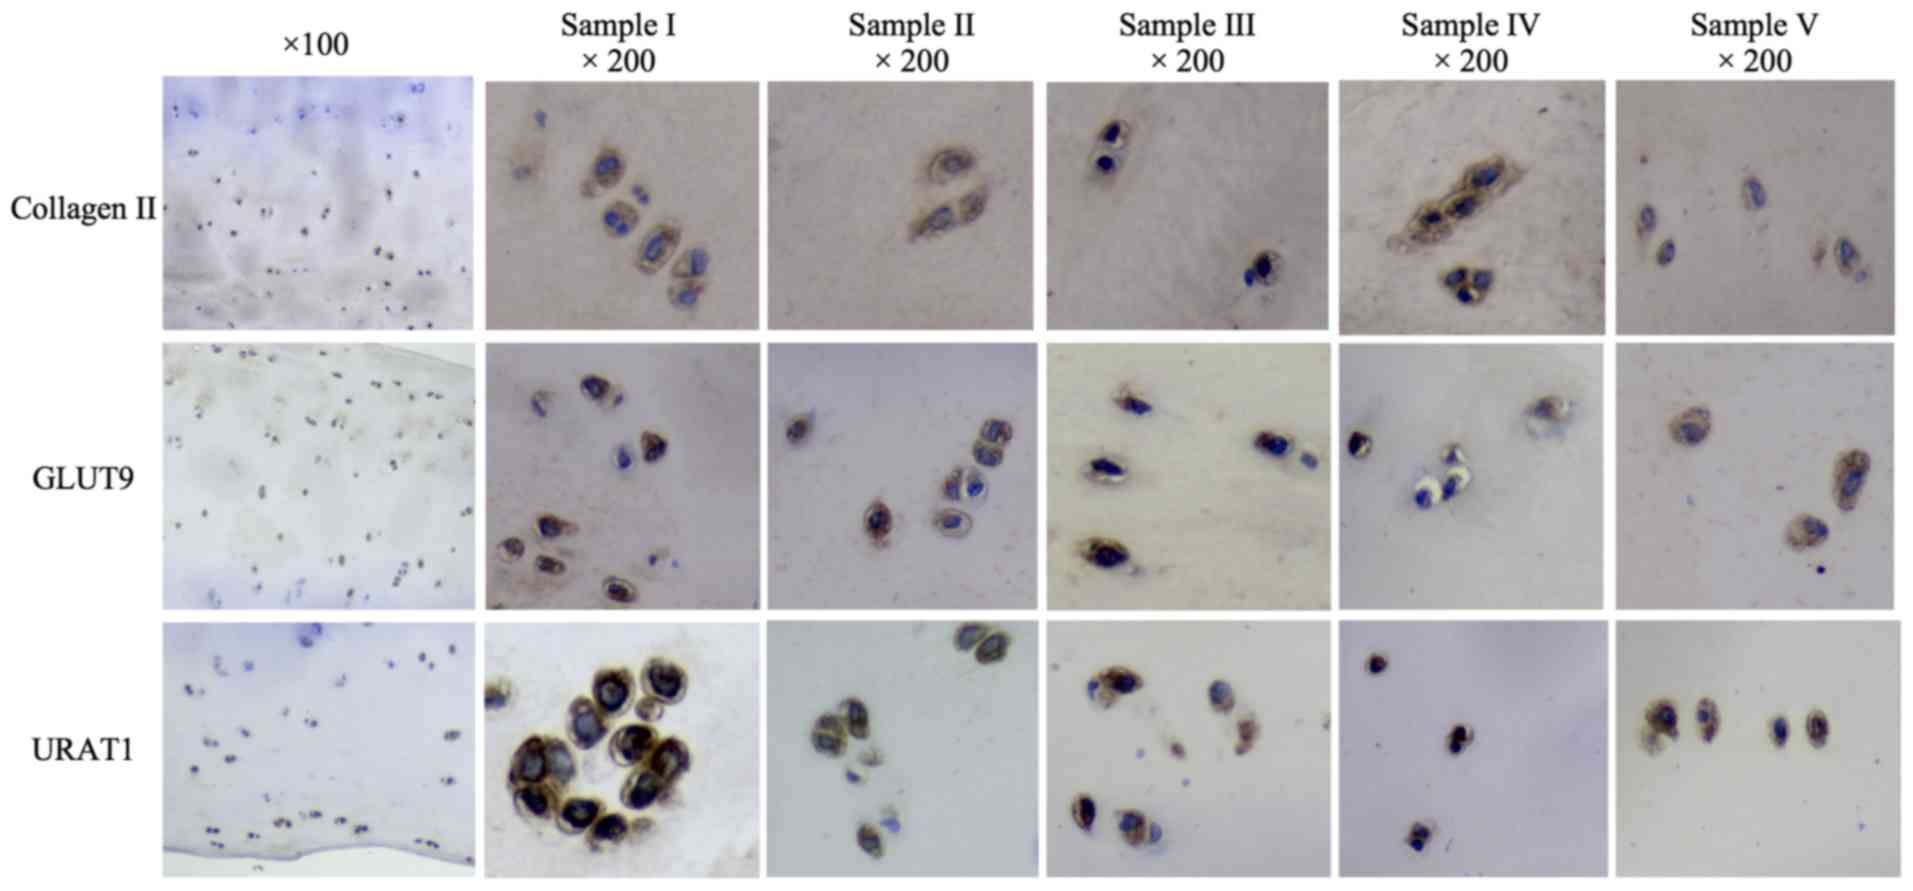
whom the AC samples were obtained are presented in Table SI. The expression levels of GLUT9
and URAT1 in the 5 human AC samples were examined by western blot
and immunohistochemical analyses. Collagen II expression is a
characteristic of chondrocytes (27), thus the detection of collagen II
indicated the presence of chondrocytes in AC samples (Figs. 1 and 2). Western blot analysis using specific
antibodies against GLUT9 and URAT1 revealed positive expression in
all 5 samples (Fig. 1; Table SII). Immunohistochemical assays
also revealed positive staining for GLUT9 and URAT1 in all AC
samples (Fig. 2).
Furthermore, GLUT9 and URAT1 expression was observed
in HC-a cells, the human articular chondrocyte cell line, via
RT-qPCR (Fig. 3A),
immunofluorescence (Fig. 3B) and
western blot analyses (Fig. 3C;
Tables SIII and SIV). Further separation of the membrane
portion revealed high expression of the two transporters in the
membrane protein extracts (Fig.
3D; Tables SIII and SIV), with limited expression in
cytoplasmic protein extracts (Fig.
3E; Tables SIII and SIV).
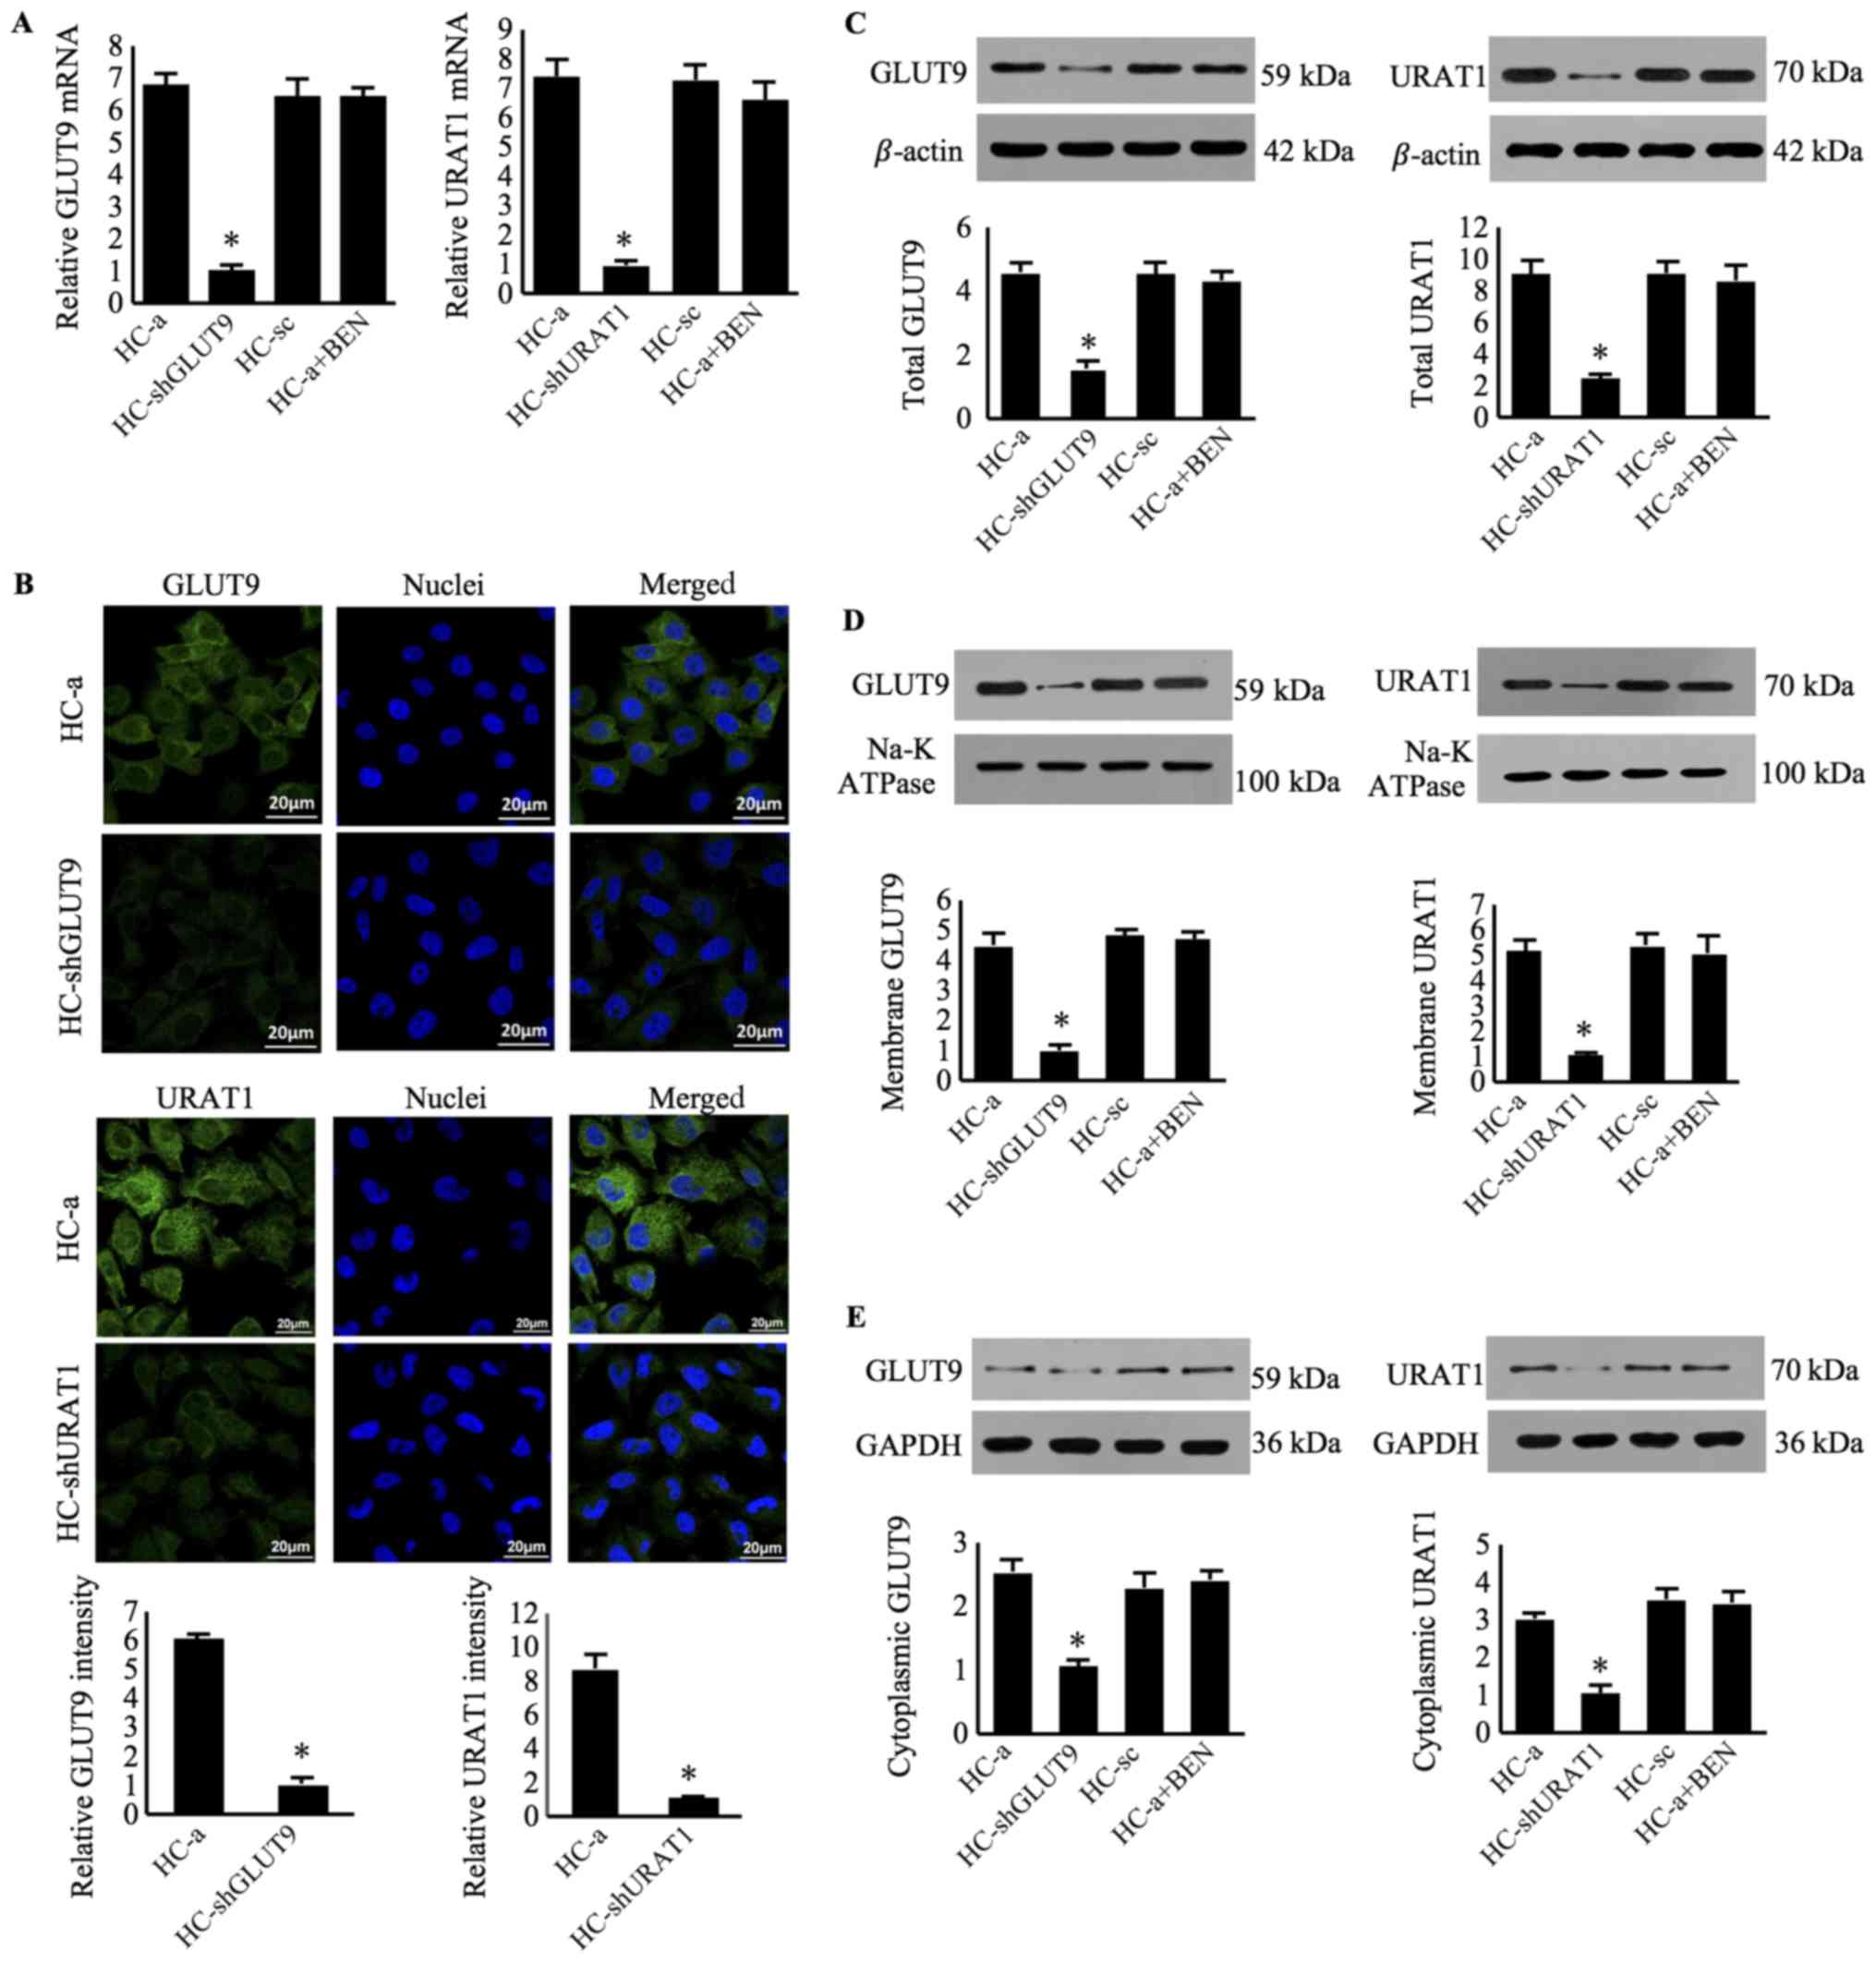 | Figure 3.Expression of GLUT9 and URAT1 in
human chondrocyte cells. (A) Reverse transcription-quantitative PCR
analysis of GLUT9 and URAT mRNA expression in HC-a cells, using
β-actin as an endogenous control. (B) Immunofluorescence of HC-a,
HC-shGLUT9 and HC-shURAT1 cells using FITC-conjugated mouse
anti-rabbit immunoglobulin G antibodies (green) and DAPI (blue).
Western blot analysis of (C) total protein, (D) membrane protein
and (E) cytoplasmic protein content, using β-actin, Na-K ATPase and
GADPH as loading controls, respectively. Data were presented as the
mean ± standard deviation (n=3). *P<0.05 vs. HC-a. GLUT9,
glucose transporter 9; URAT1, urate transporter 1; sh, short
hairpin RNA; HC-shGLUT9, HC-a cells with GLUT9 knockdown;
HC-shURAT1, HC-a cells with URAT1 knockdown; HC-sc, HC-a cells
transduced with scrambled RNA; BEN, benzbromarone. |
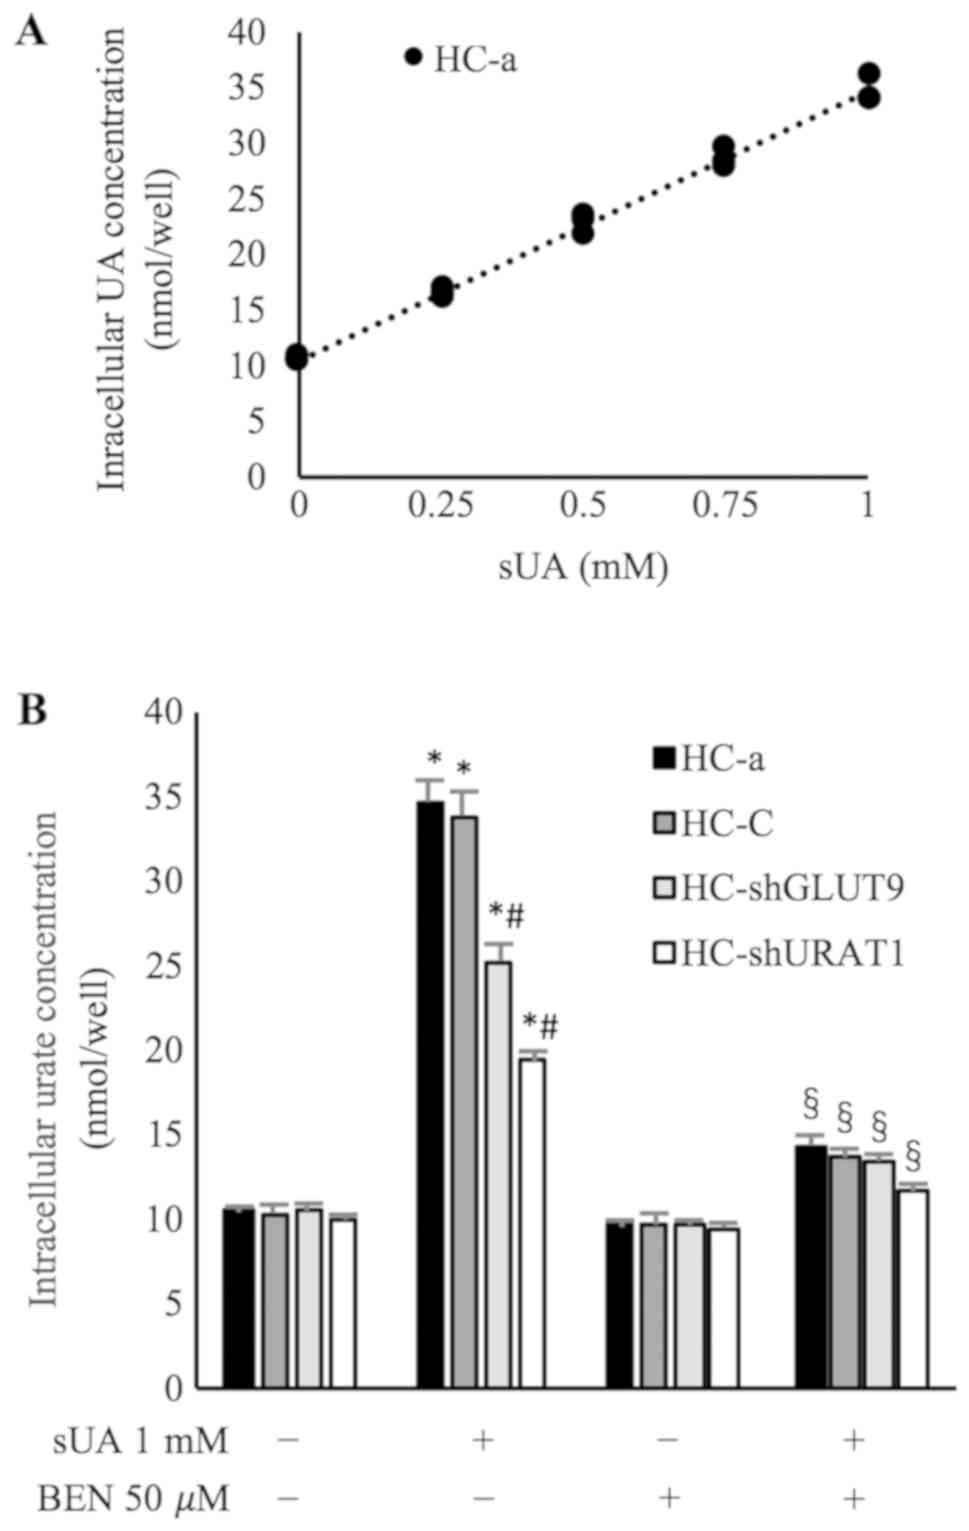
HC-a cells display a
concentration-dependent UA transport process
As the aforementioned results indicated the
expression of two major urate transporters in chondrocytes, the
present study then investigated the UA transport capacity of
chondrocytes. sUA was added to HC-a cells at increasing
concentrations (0, 0.25, 0.50, 0.75 and 1 mM), and intracellular UA
concentrations were measured using colorimetric UA assays. It was
demonstrated that HC-a cells displayed UA transport capacity, as
evidenced by a concentration-dependent increase in intracellular
UA, with a linear R2 of 0.993 (Fig. 4A; Table SV).
UA transport is inhibited by GLUT9 and
URAT1 knockdown in HC-a cells
To study the contribution of GLUT9 and URAT1 to UA
transport, HC-a cells were transduced with lentiviral particles
containing shRNAs to knockdown the expression of GLUT9 (HC-shGLUT9)
and URAT1 (HC-shURAT1), with knockdown demonstrated via
immunofluorescence, RT-qPCR and western blot analyses (Fig. 3). Then, HC-shGLUT9 and HC-shURAT1
cells were incubated with sUA (1 mM) under the same conditions as
the wildtype HC-a cells. Compared with wildtype cells,
intracellular UA concentrations in HC-shGLUT9 and HC-shURAT1 cells
were significantly decreased by 27.13±2.70 and 44.22±2.34%,
respectively (P<0.05; Fig. 4B;
Table SVI). Cells transduced with
scrambled vectors did not exhibit altered protein expression or UA
transport capacity (Figs. 3 and
4; Tables SIII, SIV, and SVI). These data confirmed there may be a
role for GLUT9 and URAT1 in the UA transport capacity of
chondrocytes.
UA transport is inhibited by
benzbromarone in HC-a cells
Previous studies have reported that 50 µM
benzbromarone, a widely used uricosuric agent, can reduce the UA
transport capacity of GLUT9 and URAT1 by ~68% (25) and ~93% (26), respectively. Therefore, it was used
to investigate the effects of the two Urate transporters in HC-a
cells. The results revealed that benzbromarone treatment
significantly reduced the intracellular UA concentration in HC-a
cells by 58.46±2.32% (P<0.05; Fig.
4B; Table SVI), but it did
not affect protein expression or subcellular location in HC-a
cells, as determined by RT-qPCR and western blot assays (Fig. 3).
In HC-shGLUT9 and HC-shURAT1 cells, whose
intracellular UA concentrations were already reduced following gene
knockdown, benzbromarone pretreatment further decreased
intracellular UA concentrations by 46.79±2.46 and 39.79±2.22%,
respectively (P<0.05; Fig. 4B;
Table SVI), suggesting that GLUT9
and URAT1 acted synergistically to mediate UA transport in HC-a
cells.
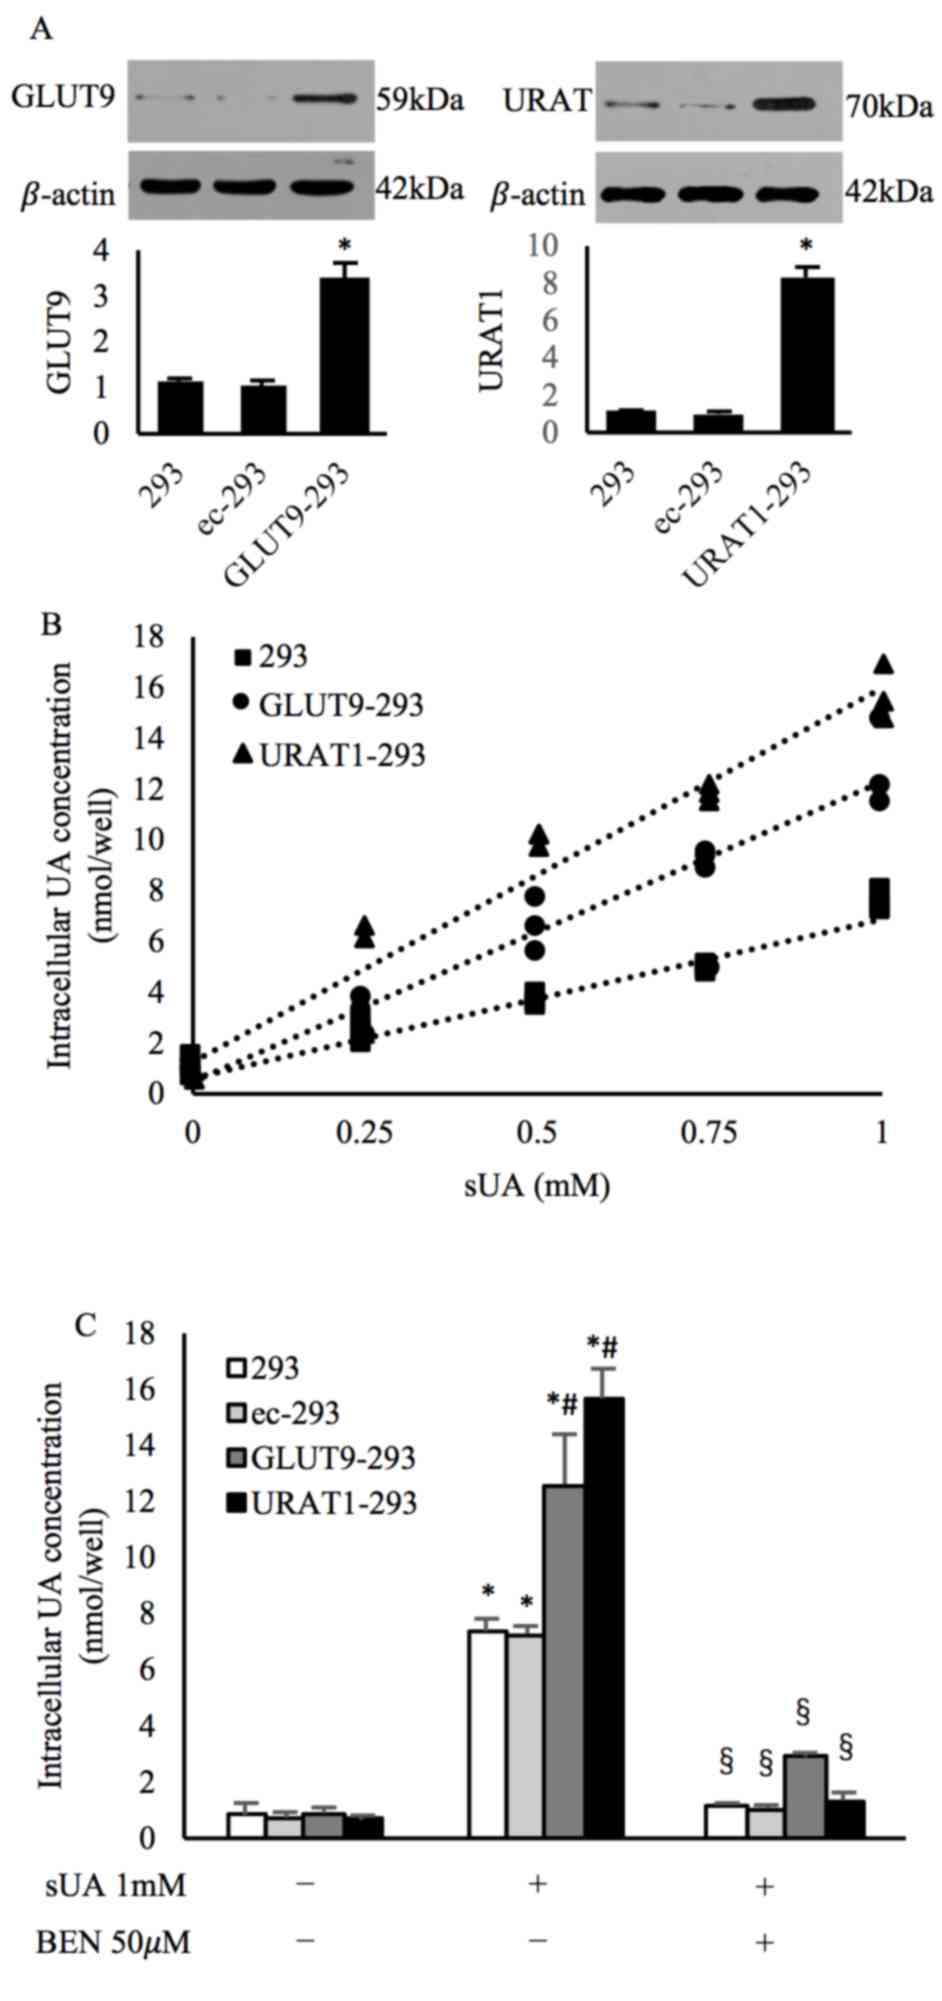
UA transport is enhanced in 293 cells
overexpressing GLUT9 and URAT1, which is reversed by benzbromarone
treatment
To verify the sensitivity of the colorimetric UA kit
and as a positive cell control, GLUT9 and URAT1 were overexpressed
in 293 cells (Fig. 5A; Table SVII), a well characterized UA
transport assay system (14,28).
Wildtype 293, GLUT9-293 and URAT1-293 cells were incubated with sUA
(0, 0.25, 0.50, 0.75, and 1 mM), and the intracellular UA levels
were assessed. The results revealed enhanced UA transport with
increasing concentrations of sUA in all 3 types of cell
(R2=0.954 for wildtype cells, 0.955 for GLUT9-293 cells
and 0.947 for URAT1-293 cells). In addition, the intracellular UA
concentrations were significantly increased in GLUT9-293 and
URAT1-293 cells compared with the wildtype 293 cells at all sUA
concentrations assessed (Fig. 5B;
Table SVIII); however,
pretreatment with benzbromarone significantly reversed the
increased intracellular UA concentrations induced by the
overexpression of GLUT9 and URAT1 (Fig. 5C; Table SIX). Cells transduced with empty
vector did not exhibit altered protein expression or UA transport
capacity (Fig. 5; Tables SVII and SIX). These findings were consistent with
those of previous studies (14,28)
and thus demonstrated the sensitivity of the colorimetric UA
transport assay.
Discussion
In the present study, the expressions of GLUT9 and
URAT1 were demonstrated in AC tissues obtained from human cartilage
via immunohistochemistry and western blot analyses, and then
further verified using a human cartilage chondrocyte cell line
(HC-a). The two proteins were predominantly expressed in the cell
membrane, with limited expression in the cytoplasm. Functional
studies revealed that wildtype HC-a cells exhibited a
concentration-dependent increase in intracellular UA concentrations
following incubation with exogenous sUA. Specific gene knockdown or
functional inhibition of GLUT9 and URAT1 significantly decreased
intracellular sUA. Therefore, to the best of our knowledge, the
present study demonstrated for the first time that there is an
active UA transport system in chondrocytes, which possessed two
major urate transporters, GLUT9 and URAT1.
The confirmation of a UA transport system in
chondrocytes is notable, as sUA turns into a strong pro-oxidative
agent once transported into cytoplasm, and inhibiting this
transport may prevent sUA-induced cell damage (5–9,12–14).
Previous studies in other cell types revealed that intracellular
sUA directly activates NADPH oxidase, which in turn actives the
production of reactive oxygen species (ROS) (29). Increased ROS levels in turn
stimulate protein kinases (MAPKs, ERKp44/42 and p38), proliferative
factors (platelet-derived growth factor and transforming growth
factor β) and proinflammatory transcription factors (NF-κB), alter
mitochondrial morphology and functionality, and activate
endoplasmic reticulum (ER) stress (8,9,30–32),
leading to cell type-specific damage. Blocking the access of sUA to
the cytoplasm using UA transport inhibitors significantly prevented
sUA-induced ROS production and oxidative damage (5–9,12–14).
Chondrocytes are characterized by their sensitivity to oxidative
stress. ROS in chondrocytes directly activated mitochondrial
oxidation (33), ER stress
(34) and various signaling
pathways, including p38MAPK, ERK1/2 and NF-κB pathways (35), leading to alterations in cell
viability and functionality. Thus, it was hypothesized that
intracellular sUA may influence chondrocyte viability and
functionality. The identification of a UA transport system in
chondrocytes is central for research into sUA-induced changes in
chondrocytes, and may support future interventions targeted against
sUA-induced chondrocyte damage in patients in early stages of
gout.
In the present study, GLUT9 and URAT1 were revealed
to be active urate transporters in chondrocytes. Previous studies
have reported that the two transporters are crucial for regulating
UA homeostasis and are subject to various regulatory mechanisms.
For example, at the transcriptional level, the GLUT9 promoter
contains a conserved response element of STAT5b, which transduces
the negative regulatory effects of growth hormone (36). Similarly, the promoter region of
URAT1 contains two GATA sites, which may be responsible for the
binding of testosterone (37).
In vivo studies with mice confirmed that GLUT9 expression
was subject to the inhibitory effects of male-pattern growth
hormone secretion (36), whereas
URAT1 mRNA was 2.3 times higher in male mice than in female mice
(38). In addition, IL-1β
stimulation significantly increased the mRNA levels of GLUT9 in
chondrocytes (39), whereas tumor
suppressor p53 promoted GLUT9 mRNA levels by binding to the
promoter region with increased UA transport in fibroblast cell
lines and lung cancer cells (40).
The promoter region of URAT1 also contains 2 activating protein
(AP)-1 sites, 4 AP-4 sites, 1 hepatocyte nuclear factor 1 site and
a CCAAT enhancer binding protein β site (37), indicating its potential for
regulation. Furthermore, a hyperuricemic mouse model exhibited
decreased levels of URAT1 mRNA, whereas obese mice possessed
increased levels of URAT1 Mrna (41,42).
These results highlight the role of the two transporters in
maintaining UA homeostasis during different physiological and
pathological conditions. At the post-translational level, the two
proteins require targeting to the cell membrane, which may be
regulated by endocytic processes. The N-terminal dileucine motif in
GLUT9 may be involved in endocytic regulation, as this motif was
responsible for the endocytosis of GLUT4, GLUT8 and GLUT12
(43). In 293 cells, Wu et
al (44) reported that Numb, a
clathrin-coated pit adapter protein, bound to URAT1 via its
phosphotyrosine-binding domain, facilitating the endocytic
regulation of URAT1 under normal and pathological conditions. Due
to the importance of plasma membrane density in transporter
function, improved understanding of endocytic processes that
regulate GLUT9 and URAT1 spatial density may reveal novel
trafficking processes that can be targeted to control UA transport
in chondrocytes.
At the protein level, the activities of the two
proteins are regulated by a number of drugs. Among these,
benzbromarone is a strong uricosuric agent that inhibits GLUT9
(IC50 ~14.2 µmol/l) and URAT1 (IC50 ~0.45
µmol/l) in irreversible manners (45,46).
The mechanism of benzbromarone is considered functional. In GLUT9,
the binding pocket is formed by critical transmembrane domain 7
(TM7) and other residues, including N429, C181, C301, C459, C128,
I355 and W110 (47,48). Among these residues, C181, the
cysteine residue that faces the translocation pore, may be
responsible for inhibitor binding and substrate transport function,
as proposed by a protein homological study (48). In URAT1, 3 key residues, F365 on
TM7, S35 on TM1 and I481 on TM11, form a plane in the channel that
is perpendicular to the cell membrane. A loss-of-function mutation
of any of these amino acids resulted in a reduced binding affinity
of benzbromarone by 17-, 10-, and 5-fold, respectively. Similarly,
F365 and S35 were important for uric acid binding affinity, as
mutation of the two amino acids resulted in a 2.5- and 2.1-fold
decrease in uric acid binding affinity, respectively. Thus, it was
proposed that benzbromarone functioned by preventing substrate
interactions within the central portion of the URAT1 channel
(45). The present findings
revealed that neither total nor membrane expression of the two
transporters was altered following incubation of HC-a cells with
benzbromarone, which supported the notion that the drug was a
functional inhibitor without affecting transporter expression or
subcellular location.
There were certain limitations to the present study.
GLUT9 exists as one of two splicing variants, GLUT9L and GLUT9S,
which differ in their N-terminals and cell distribution (49). The antibody used in the present
study recognizes the C-terminal of the GLUT9 protein, and therefore
could not distinguish between the two variants; however, previous
studies have reported two prominent bands in chondrocytes of 60 and
50 kDa, suggesting the existence of two different splice variants
(50). Furthermore, as
benzbromarone also inhibited other minor, facilitative urate
transporters, including organic anion transporter (OAT)-1 (Ki 0.22
µM) (28), OAT3 (Ki 0.11 µM)
(28), OAT4 (IC50 3.19
µM) (51), and OAT10
(IC50 ~20 µM) (46),
these OATs may also be components of the UA transport system in
chondrocytes. The expression and UA transport capacity of the minor
urate transporters, as well as ATP-binding cassette subfamily G
member 2, nicotinate phosphoribosyltransferase (NPT)1, NPT4 and
multidrug resistance-associated protein 4 may be investigated in
future studies to obtain further understanding of the UA transport
system in chondrocytes. Additionally, the present study used
colorimetric UA transport assays, which are qualitative, but do not
allow for the assessment of UA uptake kinetics; however, the
results did verify the sensitivity of the colorimetric UA transport
assays in positive control 293 cells following GLUT9 and URAT1
overexpression, which was consistent with radiolabeled assays
previously employed in this cell line (14,28).
Finally, the present study failed to obtain cartilage samples from
patients with gout, and to explore the regulation of the two
transporters during in vitro experiments, which may provide
evidence regarding the pathological regulation of the two
transporters. Such regulations, as well as subsequent changes in
cell viability and functionality, will be the focus of future
studies.
In conclusion, to the best of our knowledge, the
present study is the first to report that chondrocytes obtain an
active UA transport system mediated by GLUT9 and URAT1, which may
be targets for pathological regulation and therapeutic
interventions. The involvement of chondrocytes in gouty arthritis
may be complex. Further studies into the impact of sUA on
chondrocyte ROS production, viability and functionality, and UA
transport regulation during normal and pathological conditions, may
reveal the potential roles of urate transporters during gouty
arthritis. These findings may identify promising targets in UA
transport processes for the early control of chronic gouty
arthritis.
Supplementary Material
Supporting Data
Acknowledgements
Not applicable.
Funding
This study was supported by the 2016 PUMCH Science
Fund for Junior Faculty (grant no. pumch-2016-2.13), the Medical
Epigenetics Research Center, Chinese Academy of Medical Sciences
(grant no. 2017PT31035), the CAMS Innovation Fund for Medical
Sciences (grant no. 2016-I2M-1-002), and the Chinese Research
Special Fund for Public Welfare industry of Health (grant no.
201502024).
Availability of data and materials
The datasets used and/or analyzed during the current
study are available from the corresponding author on reasonable
request.
Authors' contributions
BiZ and MD designed the study and drafted the
manuscript. BiZ, MD and BL conducted the majority of the
experiments. BaZ and YJ enrolled the patients and collected the
tissue samples. BiZ, DW and YZ analyzed the data. JC and XH
interpreted the data and revised the manuscript for critical
intellectual content. LZ and XZ contributed to the study design,
provided assistance with the experiments and revised the
manuscript. All authors read and approved the manuscript.
Ethics approval and consent to
participate
This study was approved by the institutional review
board of Peking Union Medical College Hospital (permit no. ZS-1445)
and was conducted in accordance with the Declaration of Helsinki
(2000) of the World Medical Association. All patients signed
informed consent prior to tissue sample collection.
Patient consent for publication
Not applicable.
Competing interests
The authors declare that they have no competing
interests.
References
|
1
|
Chhana A, Callon KE, Pool B, Naot D,
Gamble GD, Dray M, Pitto R, Bentley J, McQueen FM, Cornish J and
Dalbeth N: The effects of monosodium urate monohydrate crystals on
chondrocyte viability and function: Implications for development of
cartilage damage in gout. J Rheumatol. 40:2067–2074. 2013.
View Article : Google Scholar : PubMed/NCBI
|
|
2
|
Liu R, Lioté F, Rose DM, Merz D and
Terkeltaub R: Proline-rich tyrosine kinase 2 and Src kinase
signaling transduce monosodium urate crystal-induced nitric oxide
production and matrix metalloproteinase 3 expression in
chondrocytes. Arthritis Rheum. 50:247–258. 2004. View Article : Google Scholar : PubMed/NCBI
|
|
3
|
Hwang HS, Yang CM, Park SJ and Kim HA:
Monosodium urate crystal-induced chondrocyte death via autophagic
process. Int J Mol Sci. 16:29265–29277. 2015. View Article : Google Scholar : PubMed/NCBI
|
|
4
|
Martillo MA, Nazzal L and Crittenden DB:
The crystallization of monosodium urate. Curr Rheumatol Rep.
16:4002014. View Article : Google Scholar : PubMed/NCBI
|
|
5
|
Kang DH: Hyperuricemia and progression of
chronic kidney disease: Role of phenotype transition of renal
tubular and endothelial cells. Contrib Nephrol. 192:48–55. 2018.
View Article : Google Scholar : PubMed/NCBI
|
|
6
|
Liang WY, Zhu XY, Zhang JW, Feng XR, Wang
YC and Liu ML: Uric acid promotes chemokine and adhesion molecule
production in vascular endothelium via nuclear factor-kappa B
signaling. Nutr Metab Cardiovasc Dis. 25:187–194. 2015. View Article : Google Scholar : PubMed/NCBI
|
|
7
|
Kang DH, Han L, Ouyang X, Kahn AM,
Kanellis J, Li P, Feng L, Nakagawa T, Watanabe S, Hosoyamada M, et
al: Uric acid causes vascular smooth muscle cell proliferation by
entering cells via a functional urate transporter. Am J Nephrol.
25:425–433. 2005. View Article : Google Scholar : PubMed/NCBI
|
|
8
|
Kırça M, Oğuz N, Çetin A, Uzuner F and
Yeşilkaya A: Uric acid stimulates proliferative pathways in
vascular smooth muscle cells through the activation of p38 MAPK,
p44/42 MAPK and PDGFRβ. J Recept Signal Transduct Res. 37:167–173.
2017. View Article : Google Scholar : PubMed/NCBI
|
|
9
|
Choi YJ, Shin HS, Choi HS, Park JW, Jo I,
Oh ES, Lee KY, Lee BH, Johnson RJ and Kang DH: Uric acid induces
fat accumulation via generation of endoplasmic reticulum stress and
SREBP-1c activation in hepatocytes. Lab Invest. 94:1114–1125. 2014.
View Article : Google Scholar : PubMed/NCBI
|
|
10
|
Xin Y, Wang K, Jia Z, Xu T, Xu Q, Zhang C,
Liu J, Chen R, Du Z and Sun J: Zurampic protects pancreatic
beta-cells from high uric acid induced-damage by inhibiting URAT1
and inactivating the ROS/AMPK/ERK pathways. Cell Physiol Biochem.
47:1074–1083. 2018. View Article : Google Scholar : PubMed/NCBI
|
|
11
|
Zhang Y, Yamamoto T, Hisatome I, Li Y,
Cheng W, Sun N, Cai B, Huang T, Zhu Y, Li Z, et al: Uric acid
induces oxidative stress and growth inhibition by activating
adenosine monophosphate-activated protein kinase and extracellular
signal-regulated kinase signal pathways in pancreatic β cells. Mol
Cell Endocrinol. 375:89–96. 2013. View Article : Google Scholar : PubMed/NCBI
|
|
12
|
Sautin YY, Nakagawa T, Zharikov S and
Johnson RJ: Adverse effects of the classic antioxidant uric acid in
adipocytes: NADPH oxidase-mediated oxidative/nitrosative stress. Am
J Physiol Cell Physiol. 293:C584–C596. 2007. View Article : Google Scholar : PubMed/NCBI
|
|
13
|
Evans SA, Doblado M, Chi MM, Corbett JA
and Moley KH: Facilitative glucose transporter 9 expression affects
glucose sensing in pancreatic beta-cells. Endocrinology.
150:5302–5310. 2009. View Article : Google Scholar : PubMed/NCBI
|
|
14
|
Caulfield MJ, Munroe PB, O'Neill D,
Witkowska K, Charchar FJ, Doblado M, Evans S, Eyheramendy S,
Onipinla A, Howard P, et al: SLC2A9 is a high-capacity urate
transporter in humans. PLoS Med. 5:e1972008. View Article : Google Scholar : PubMed/NCBI
|
|
15
|
Nigam SK and Bhatnagar V: The systems
biology of uric acid transporters: The role of remote sensing and
signaling. Curr Opin Nephrol Hypertens. 27:305–313. 2018.
View Article : Google Scholar : PubMed/NCBI
|
|
16
|
Preitner F, Bonny O, Laverriere A, Rotman
S, Firsov D, Da Costa A, Metref S and Thorens B: Glut9 is a major
regulator of urate homeostasis and its genetic inactivation induces
hyperuricosuria and urate nephropathy. Proc Natl Acad Sci USA.
106:15501–15506. 2009. View Article : Google Scholar : PubMed/NCBI
|
|
17
|
Tu HP, Chen CJ, Tovosia S, Ko AM, Lee CH,
Ou TT, Lin GT, Chang SJ, Chiang SL, Chiang HC, et al: Associations
of a non-synonymous variant in SLC2A9 with gouty arthritis and uric
acid levels in Han Chinese subjects and solomon islanders. Ann
Rheum Dis. 69:887–890. 2010. View Article : Google Scholar : PubMed/NCBI
|
|
18
|
Nakanishi T, Ohya K, Shimada S, Anzai N
and Tamai I: Functional cooperation of URAT1 (SLC22A12) and URATv1
(SLC2A9) in renal reabsorption of urate. Nephrol Dial Transplant.
28:603–611. 2013. View Article : Google Scholar : PubMed/NCBI
|
|
19
|
Price KL, Sautin YY, Long DA, Zhang L,
Miyazaki H, Mu W, Endou H and Johnson RJ: Human vascular smooth
muscle cells express a urate transporter. J Am Soc Nephrol.
17:1791–1795. 2006. View Article : Google Scholar : PubMed/NCBI
|
|
20
|
Richardson S, Neama G, Phillips T, Bell S,
Carter SD, Moley KH, Moley JF, Vannucci SJ and Mobasheri A:
Molecular characterization and partial cDNA cloning of facilitative
glucose transporters expressed in human articular chondrocytes;
stimulation of 2-deoxyglucose uptake by IGF-I and elevated MMP-2
secretion by glucose deprivation. Osteoarthritis Cartilage.
11:92–101. 2003. View Article : Google Scholar : PubMed/NCBI
|
|
21
|
Zhai K, Tang Y, Zhang Y, Li F, Wang Y, Cao
Z, Yu J, Kou J and Yu B: NMMHC IIA inhibition impedes tissue factor
expression and venous thrombosis via Akt/GSK3beta-NF-kappaB
signalling pathways in the endothelium. Thromb Haemost.
114:173–185. 2015. View Article : Google Scholar : PubMed/NCBI
|
|
22
|
Zhai KF, Zheng JR, Tang YM, Li F, Lv YN,
Zhang YY, Gao Z, Qi J, Yu BY and Kou JP: The saponin D39 blocks
dissociation of non-muscular myosin heavy chain IIA from TNF
receptor 2, suppressing tissue factor expression and venous
thrombosis. Br J Pharmacol. 174:2818–2831. 2017. View Article : Google Scholar : PubMed/NCBI
|
|
23
|
Livak KJ and Schmittgen TD: Analysis of
relative gene expression data using real-time quantitative PCR and
the 2(-Delta Delta C(T)) method. Methods. 25:402–408. 2001.
View Article : Google Scholar : PubMed/NCBI
|
|
24
|
Zhai KF, Duan H, Khan GJ, Xu H, Han FK,
Cao WG, Gao GZ, Shan LL and Wei ZJ: Salicin from alangium chinense
ameliorates rheumatoid arthritis by modulating the Nrf2-HO-1-ROS
pathways. J Agric Food Chem. 66:6073–6082. 2018. View Article : Google Scholar : PubMed/NCBI
|
|
25
|
Anzai N, Ichida K, Jutabha P, Kimura T,
Babu E, Jin CJ, Srivastava S, Kitamura K, Hisatome I, Endou H and
Sakurai H: Plasma urate level is directly regulated by a
voltage-driven urate efflux transporter URATv1 (SLC2A9) in humans.
J Biol Chem. 283:26834–26838. 2008. View Article : Google Scholar : PubMed/NCBI
|
|
26
|
Enomoto A, Kimura H, Chairoungdua A,
Shigeta Y, Jutabha P, Cha SH, Hosoyamada M, Takeda M, Sekine T,
Igarashi T, et al: Molecular identification of a renal urate anion
exchanger that regulates blood urate levels. Nature. 417:447–452.
2002. View Article : Google Scholar : PubMed/NCBI
|
|
27
|
Eyre D: Collagen of articular cartilage.
Arthritis Res. 4:30–35. 2002. View
Article : Google Scholar : PubMed/NCBI
|
|
28
|
Ahn SO, Ohtomo S, Kiyokawa J, Nakagawa T,
Yamane M, Lee KJ, Kim KH, Kim BH, Tanaka J, Kawabe Y and Horiba N:
Stronger uricosuric effects of the novel selective URAT1 inhibitor
UR-1102 lowered plasma urate in tufted capuchin monkeys to a
greater extent than benzbromarone. J Pharmacol Exp Ther.
357:157–166. 2016. View Article : Google Scholar : PubMed/NCBI
|
|
29
|
Sharaf El Din UAA, Salem MM and Abdulazim
DO: Uric acid in the pathogenesis of metabolic, renal, and
cardiovascular diseases: A review. J Adv Res. 8:537–548. 2017.
View Article : Google Scholar : PubMed/NCBI
|
|
30
|
Kanellis J, Watanabe S, Li JH, Kang DH, Li
P, Nakagawa T, Wamsley A, Sheikh-Hamad D, Lan HY, Feng L and
Johnson RJ: Uric acid stimulates monocyte chemoattractant protein-1
production in vascular smooth muscle cells via mitogen-activated
protein kinase and cyclooxygenase-2. Hypertension. 41:1287–1293.
2003. View Article : Google Scholar : PubMed/NCBI
|
|
31
|
Jia L, Xing J, Ding Y, Shen Y, Shi X, Ren
W, Wan M, Guo J, Zheng S, Liu Y, et al: Hyperuricemia causes
pancreatic beta-cell death and dysfunction through NF-kappaB
signaling pathway. PLoS One. 8:e782842013. View Article : Google Scholar : PubMed/NCBI
|
|
32
|
Corry DB, Eslami P, Yamamoto K, Nyby MD,
Makino H and Tuck ML: Uric acid stimulates vascular smooth muscle
cell proliferation and oxidative stress via the vascular
renin-angiotensin system. J Hypertens. 26:269–275. 2008. View Article : Google Scholar : PubMed/NCBI
|
|
33
|
Wu L, Liu H, Li L, Liu H, Cheng Q, Li H
and Huang H: Mitochondrial pathology in osteoarthritic
chondrocytes. Curr Drug Targets. 15:710–719. 2014. View Article : Google Scholar : PubMed/NCBI
|
|
34
|
Takada K, Hirose J, Yamabe S, Uehara Y and
Mizuta H: Endoplasmic reticulum stress mediates nitric
oxide-induced chondrocyte apoptosis. Biomed Rep. 1:315–319. 2013.
View Article : Google Scholar : PubMed/NCBI
|
|
35
|
Henrotin YE, Bruckner P and Pujol JP: The
role of reactive oxygen species in homeostasis and degradation of
cartilage. Osteoarthritis Cartilage. 11:747–755. 2003. View Article : Google Scholar : PubMed/NCBI
|
|
36
|
Bu P, Le Y, Zhang Y and Cheng X: Hormonal
and chemical regulation of the Glut9 transporter in Mice. J
Pharmacol Exp Ther. 360:206–214. 2017. View Article : Google Scholar : PubMed/NCBI
|
|
37
|
Li T, Walsh JR, Ghishan FK and Bai L:
Molecular cloning and characterization of a human urate transporter
(hURAT1) gene promoter. Biochim Biophys Acta. 24:53–58. 2004.
View Article : Google Scholar
|
|
38
|
Hosoyamada M, Ichida K, Enomoto A, Hosoya
T and Endo H: Function and localization of urate transporter 1 in
mouse kidney. J Am Soc Nephrol. 15:261–268. 2004. View Article : Google Scholar : PubMed/NCBI
|
|
39
|
Shikhman AR, Brinson DC, Valbracht J and
Lotz MK: Cytokine regulation of facilitated glucose transport in
human articular chondrocytes. J Immunol. 15:7001–7008. 2001.
View Article : Google Scholar
|
|
40
|
Itahana Y, Han R, Barbier S, Lei Z, Rozen
S and Itahana K: The uric acid transporter SLC2A9 is a direct
target gene of the tumor suppressor p53 contributing to antioxidant
defense. Oncogene. 34:1799–1810. 2015. View Article : Google Scholar : PubMed/NCBI
|
|
41
|
Nishizawa K, Yoda N, Morokado F, Komori H,
Nakanishi T and Tamai I: Changes of drug pharmacokinetics mediated
by downregulation of kidney organic cation transporters Mate1 and
Oct2 in a rat model of hyperuricemia. PLoS One. 14:e02148622019.
View Article : Google Scholar : PubMed/NCBI
|
|
42
|
Doshi M, Takiue Y, Saito H and Hosoyamada
M: The increased protein level of URAT1 was observed in
obesity/metabolic syndrome model mice. Nucleosides Nucleotides
Nucleic Acids. 30:1290–1294. 2011. View Article : Google Scholar : PubMed/NCBI
|
|
43
|
Augustin R, Carayannopoulos MO, Dowd LO,
Phay JE, Moley JF and Moley KH: Identification and characterization
of human glucose transporter-like protein-9 (GLUT9): Alternative
splicing alters trafficking. J Biol Chem. 279:16229–16236. 2004.
View Article : Google Scholar : PubMed/NCBI
|
|
44
|
Wu X, Zhang J, Liu T, Yan M, Liu H, Xie H,
Zhang S, Sun B, Ke B and Zhou H: Uric acid crystal could inhibit
numb-induced URAT1 lysosome degradation in uric acid nephropathy. J
Physiol Biochem. 17:217–226. 2015. View Article : Google Scholar
|
|
45
|
Tan PK, Ostertag TM and Miner JN:
Mechanism of high affinity inhibition of the human urate
transporter URAT1. Sci Rep. 6:349952016. View Article : Google Scholar : PubMed/NCBI
|
|
46
|
Mandal AK, Mercado A, Foster A,
Zandi-Nejad K and Mount DB: Uricosuric targets of tranilast.
Pharmacol Res Perspect. 5:e002912017. View Article : Google Scholar : PubMed/NCBI
|
|
47
|
Long W, Panwar P, Witkowska K, Wong K,
O'Neill D, Chen XZ, Lemieux MJ and Cheeseman CI: Critical roles of
two hydrophobic residues within human glucose transporter 9
(hSLC2A9) in substrate selectivity and urate transport. J Biol
Chem. 290:15292–15303. 2015. View Article : Google Scholar : PubMed/NCBI
|
|
48
|
Long W, Panigrahi R, Panwar P, Wong K, O
Neill D, Chen XZ, Lemieux MJ and Cheeseman CI: Identification of
key residues for urate specific transport in human glucose
transporter 9 (hSLC2A9). Sci Rep. 7:411672017. View Article : Google Scholar : PubMed/NCBI
|
|
49
|
Kimura T, Takahashi M, Yan K and Sakurai
H: Expression of the GLUT1 and GLUT9 facilitative glucose
transporters in embryonic chondroblasts and mature chondrocytes in
ovine articular cartilage. PLoS One. 9:e849962014. View Article : Google Scholar : PubMed/NCBI
|
|
50
|
Mobasheri A, Dobson H, Mason SL,
Cullingham F, Shakibaei M, Moley JF and Moley KH: Expression of the
GLUT1 and GLUT9 facilitative glucose transporters in embryonic
chondroblasts and mature chondrocytes in ovine articular cartilage.
Cell Biol Int. 29:249–260. 2005. View Article : Google Scholar : PubMed/NCBI
|
|
51
|
Miner J, Tan PK, Hyndman D, Liu S, Iverson
C, Nanavati P, Hagerty DT, Manhard K, Shen Z, Girardet JL, et al:
Lesinurad, a novel, oral compound for gout, acts to decrease serum
uric acid through inhibition of urate transporters in the kidney.
Arthritis Res Ther. 18:2142016. View Article : Google Scholar : PubMed/NCBI
|