Introduction
Osteoporosis (OP), a systemic skeletal disease
characterized by low bone mass and micro-architectural
deterioration of bone tissue, results in an increased vulnerability
to bone fracture (1). Based on
data from the National Health and Nutrition Examination Survey III,
the National Osteoporosis Foundation estimates that more than 9.9
million cases have OP in the United States and 1.5 million
osteoporotic fractures occur annually. In China, 19.2% of people
>50 years of age were assessed to have OP in 2018, and ~2.69
million osteoporotic fractures occurred in 2015 (2). Notably, OP-induced fractures cause
high economic expenditures with an estimated cost of 20.4 billion
USD in the United States in 2015 (3) and ~10.87 billion USD in China in 2015
(2). This indicates that OP is
developing into a major concern affecting worldwide public health.
Postmenopausal osteoporosis (PMO), caused by oestrogen deficiency,
is the most common type of primary OP. Oestrogen deficiency causes
an imbalance in bone formation and resorption, finally leading to
bone loss and OP. Although many factors, such as OPG/RANKL/RANK
system (4), oxidative stress
(5,6), and altered oestrogen signaling
(4), have been revealed to
contribute to PMO, specific biomarkers for the early diagnosis and
therapy of PMO are not available. Therefore, diagnostic biomarkers
predicting the occurrence of PMO are warranted.
The present literature suggests that screening for
differentially expressed genes (DEGs) has been the focus of PMO
research in identifying biomarkers. Of note, few studies have
explored the relevance of genes that share a high degree of
functional interconnection and are regulated in a similar fashion.
Weighted gene co-expression network analysis (WGCNA), a systems
biology method, is particularly useful in this context and helps to
create free-scale gene co-expression networks to identify the
association between different gene sets or between gene sets and
clinical features (7). Notably,
WGCNA has been broadly used to identify the hub genes linked with
clinical features in different diseases, such as clear cell renal
cell carcinoma (8–11), bladder cancer (12,13),
breast cancer (14), and
neuropathic pain (15).
In the present study, WGCNA along with different
approaches were used to analyze the microarray data of blood
monocytes in pre- and postmenopausal women with a low or high bone
mineral density (BMD) to characterize the key genes associated with
PMO. The present results revealed that peptidylprolyl isomerase
domain and WD repeat containing 1 (PPWD1) may be a potential
key biomarker for predicting the occurrence of PMO.
Materials and methods
Data collection
mRNA expression profiles obtained from circulating
monocytes of pre- and postmenopausal subjects with a low or high
BMD were downloaded from the Gene Expression Omnibus (GEO) database
(http://www.ncbi.nlm.nih.gov/geo/). In
the present study, the GSE56815 dataset performed on Affymetrix
Human Genome U133A Array was used as a training set to build
co-expression networks and find hub genes. This dataset consisted
of 80 Caucasian females, of which 40 subjects had a high hip BMD
(20 pre- and 20 postmenopausal) and 40 subjects had a low hip BMD
(20 pre- and 20 postmenopausal). Separately, the GSE2208 dataset
based on the same microarray platform was downloaded from the GEO
and used as a test set to validate our results. This dataset
included 19 female subjects, 10 with a high BMD and 9 with a low
BMD.
Data preprocessing
Normalized data were obtained from the GEO database.
The quality of the microarray was evaluated by sample clustering
using the distance between different samples in Pearson's
correlation matrices. To perform further analysis, genes with an
average expression >7 were selected as the cut-off criteria.
Co-expression network
construction
At first, DEGs were assessed for their expression
data profile to distinguish between good and bad samples, or good
and bad genes, after which the ‘WGCNA’ package in R was applied to
build a scale-free co-expression network for the selected genes
(16). For the pair-wise genes,
Pearson's correlation matrices were initially performed, followed
by a weighted adjacency matrix constructed using a power function
amn=|cmn|β (where
cmn=Pearson's correlation between gene m and gene n; and
amn=adjacency between gene m and gene n). Upon assigning
the proper β, the weighted network was transformed into a
topological overlap matrix (TOM) to calculate the network
connectivity of a gene as previously described (8,13).
The TOM-based dissimilarity measure was then used to conduct
average linkage hierarchical clustering, and genes with similar
expression profiles were classified into gene modules. The
hierarchical clustering was performed on a minimum size (50 genes)
to generate a gene dendrogram. The module was further analyzed by
calculating the dissimilarity of module eigengenes (MEs). A cut
line was selected for the module dendrogram, and certain modules
were merged.
Identification of
phenotype-significant modules
Module- related phenotypes were identified by two
approaches. Gene significance (GS), defined as the log10
transformation of the P-value (GS=lgP) in the linear regression
between gene expression and the clinical traits (BMD and menopausal
status) and module significance (MS), defined as the average GS for
all the genes involved in the module, were used. The module related
to the phenotype was selected based on the absolute MS ranking
(first or second) among the selected modules. In the principal
component analysis, MEs were considered as the major component to
summarize the expression pattern of all genes in a given module
into a single characteristic expression profile. Additionally, the
correlation between the MEs and phenotypes was calculated to
validate the relevance of the module. The module related to the
clinical trait was selected based on their maximal absolute MS.
Finally, the module with the highest correlation to a certain
phenotype was used for subsequent analysis.
Identification of hub genes and
validation
Hub genes are genes that display a considerable
interconnection with other genes in a module and have been
previously revealed to be functionally significant. In the
co-expression network, hub genes were identified in a module that
was correlated with certain phenotypes. Next, all genes in the hub
module were uploaded to the Search Tool for the Retrieval of
Interacting Genes database (https://string-db.org/), with a confidence >0.4 to
create a protein-protein interaction (PPI) network. In the PPI
network, genes displaying a connectivity degree of ≥5 (node/edge)
were identified as hub genes. The hub genes that were common in
both the co-expression network and PPI network were regarded as
‘real’ hub genes and selected for subsequent analysis. The
validation was performed using a training set and test set. In the
test set of the GSE2208 dataset, the comparison of real hub genes
with a low BMD and a high BMD was performed.
Functional and pathway enrichment
analysis
The DAVID database (http://david.abcc.ncifcrf.gov/), an online program
that provides a comprehensive set of functional annotation tools to
understand the biological relevance behind the obtained large
dataset of genes, was used for analysis of the DEGs in the hub
module [particularly Gene Ontology (GO) terms and their
visualization on Kyoto Encyclopedia of Genomes and Genes (KEGG)
pathway maps]. The top 20 terms involving the candidate hub genes
were selected as the biological processes and pathways of interest.
P<0.05 was set as the cut-off criterion.
Gene set enrichment analysis
(GSEA)
To further analyze the potential function, the
training set was divided into several groups according to three
labels: BMD (high BMD vs. low BMD), menopausal status
(postmenopausal vs. premenopausal) and expression level of
PPWD1 according to the median expression of PPWD1 (a
high expression of PPWD1 vs. a low expression of
PPWD1). For use with GSEA software, the collection of
annotated gene sets of h.all.v6.1.symbol.gmat (Hallmarks) in the
Molecular Signatures Database (MSigDB, http://software.broadinstitute.org/gsea/msigdb/index.jsp)
was selected as the reference gene set. The gene sets enriched in
the aforementioned 3 groups were selected, and a P-value <0.05
was selected as the cut-off criteria.
Results
DEG screening
After preprocessing and quality assessment of the
data, the expression matrices were obtained from which 5,570 genes
with a log2 expression level >7 were selected for
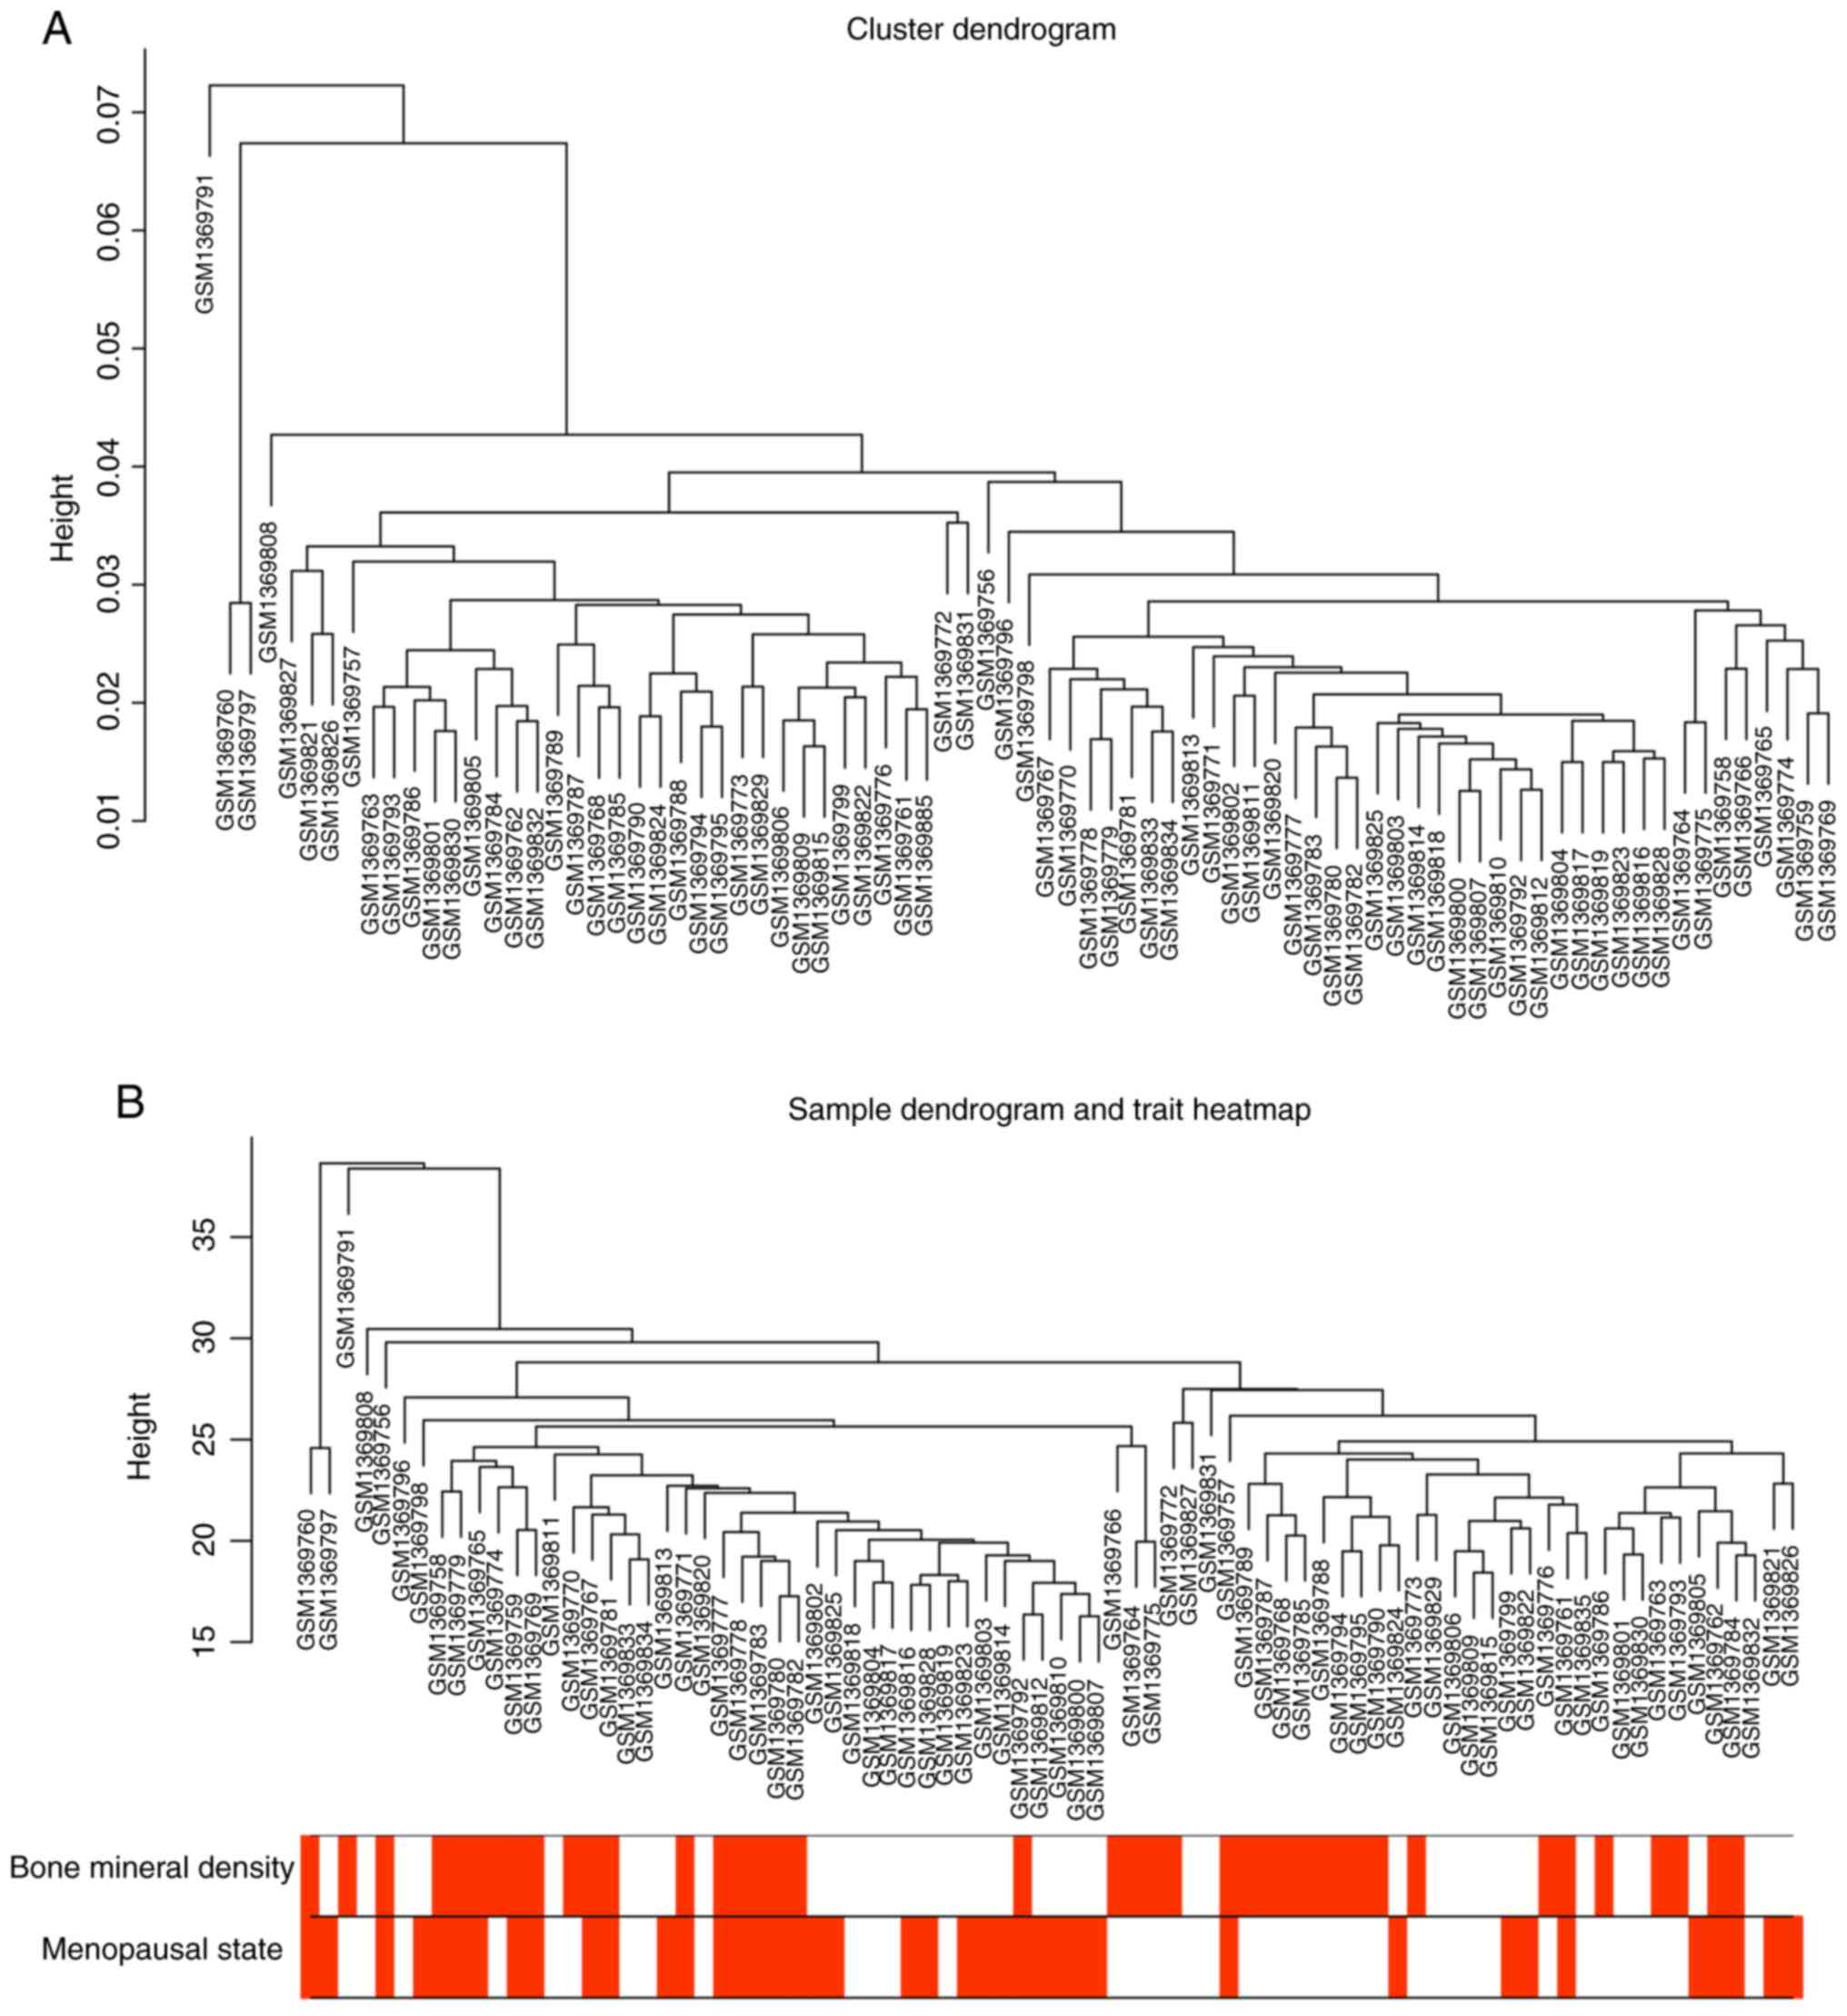
subsequent analysis. At first, a sample cluster with phenotypes
using average linkage and Pearson's correlation was performed
(Fig. 1). No samples were
removed.
Weighted co-expression network
construction and key module identification
The ‘WGCNA’ package in R was used for the average
linkage hierarchical clustering of DEGs with similar expression
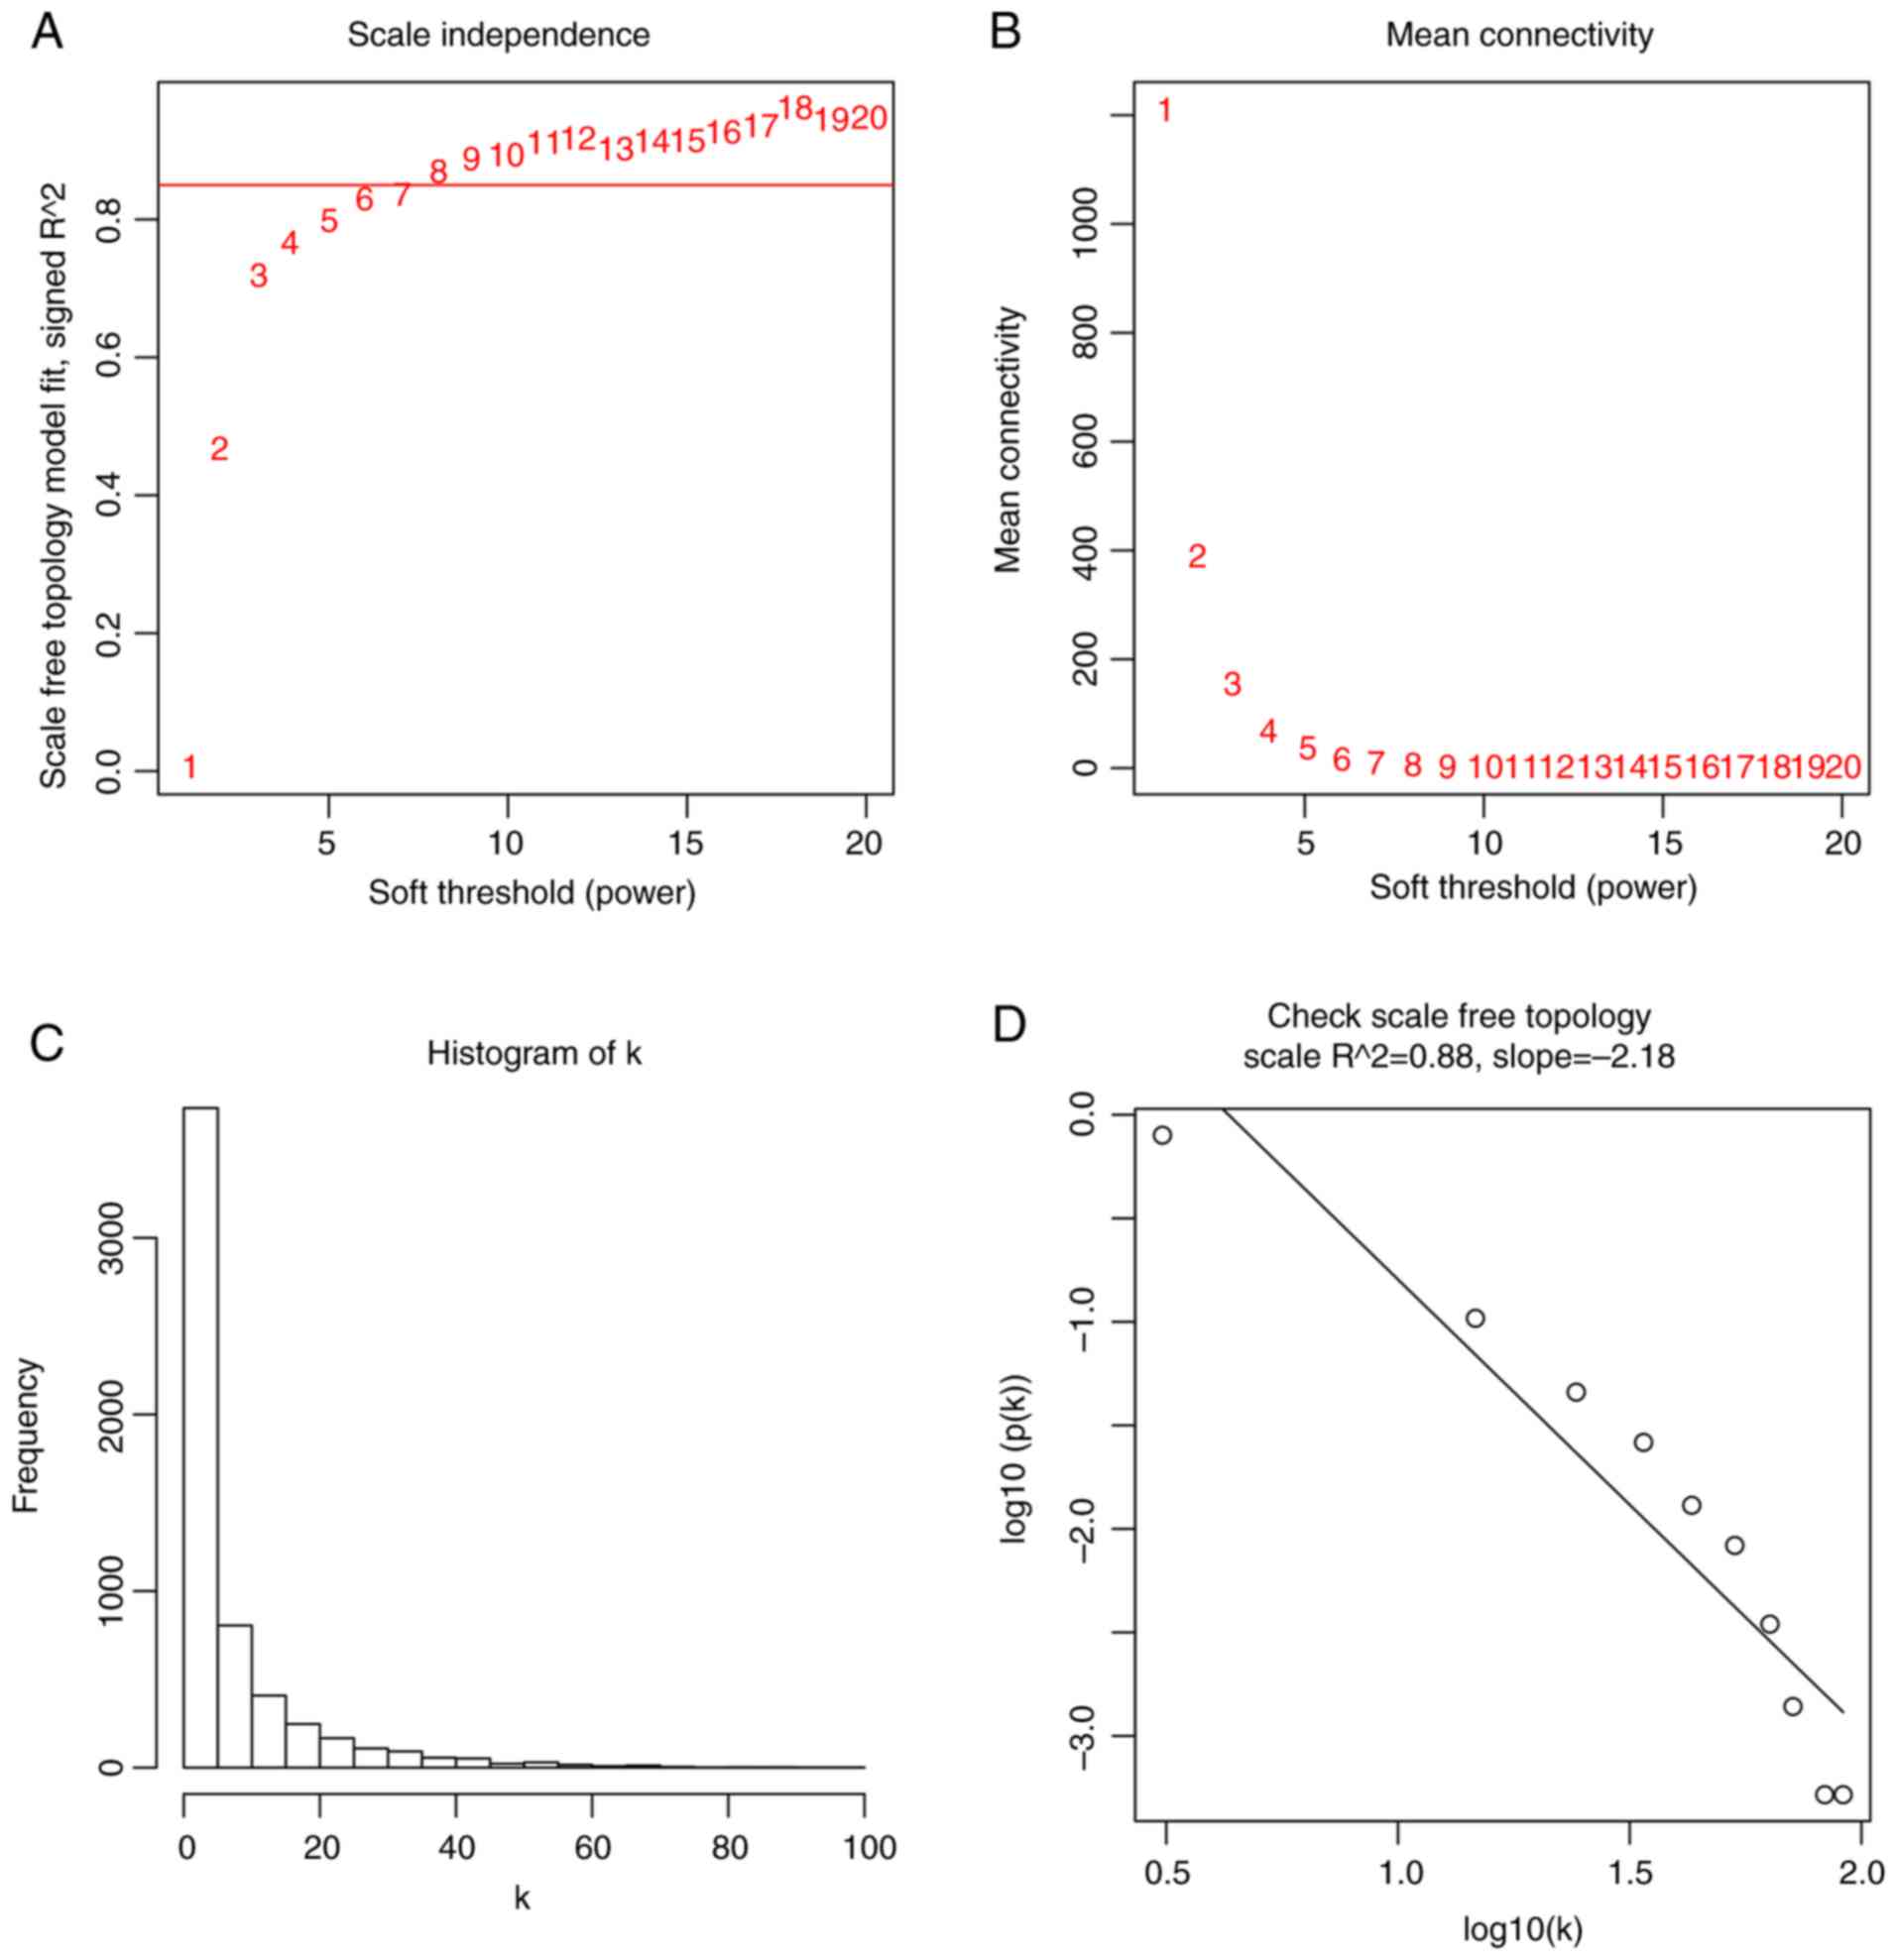
patterns into modules. β, a soft-thresholding parameter, emphasizes
strong gene correlations and penalizes weak correlations. Herein,
the power of β=8 (scale free R2=0.88) was selected to
ensure a scale-free network (Fig.
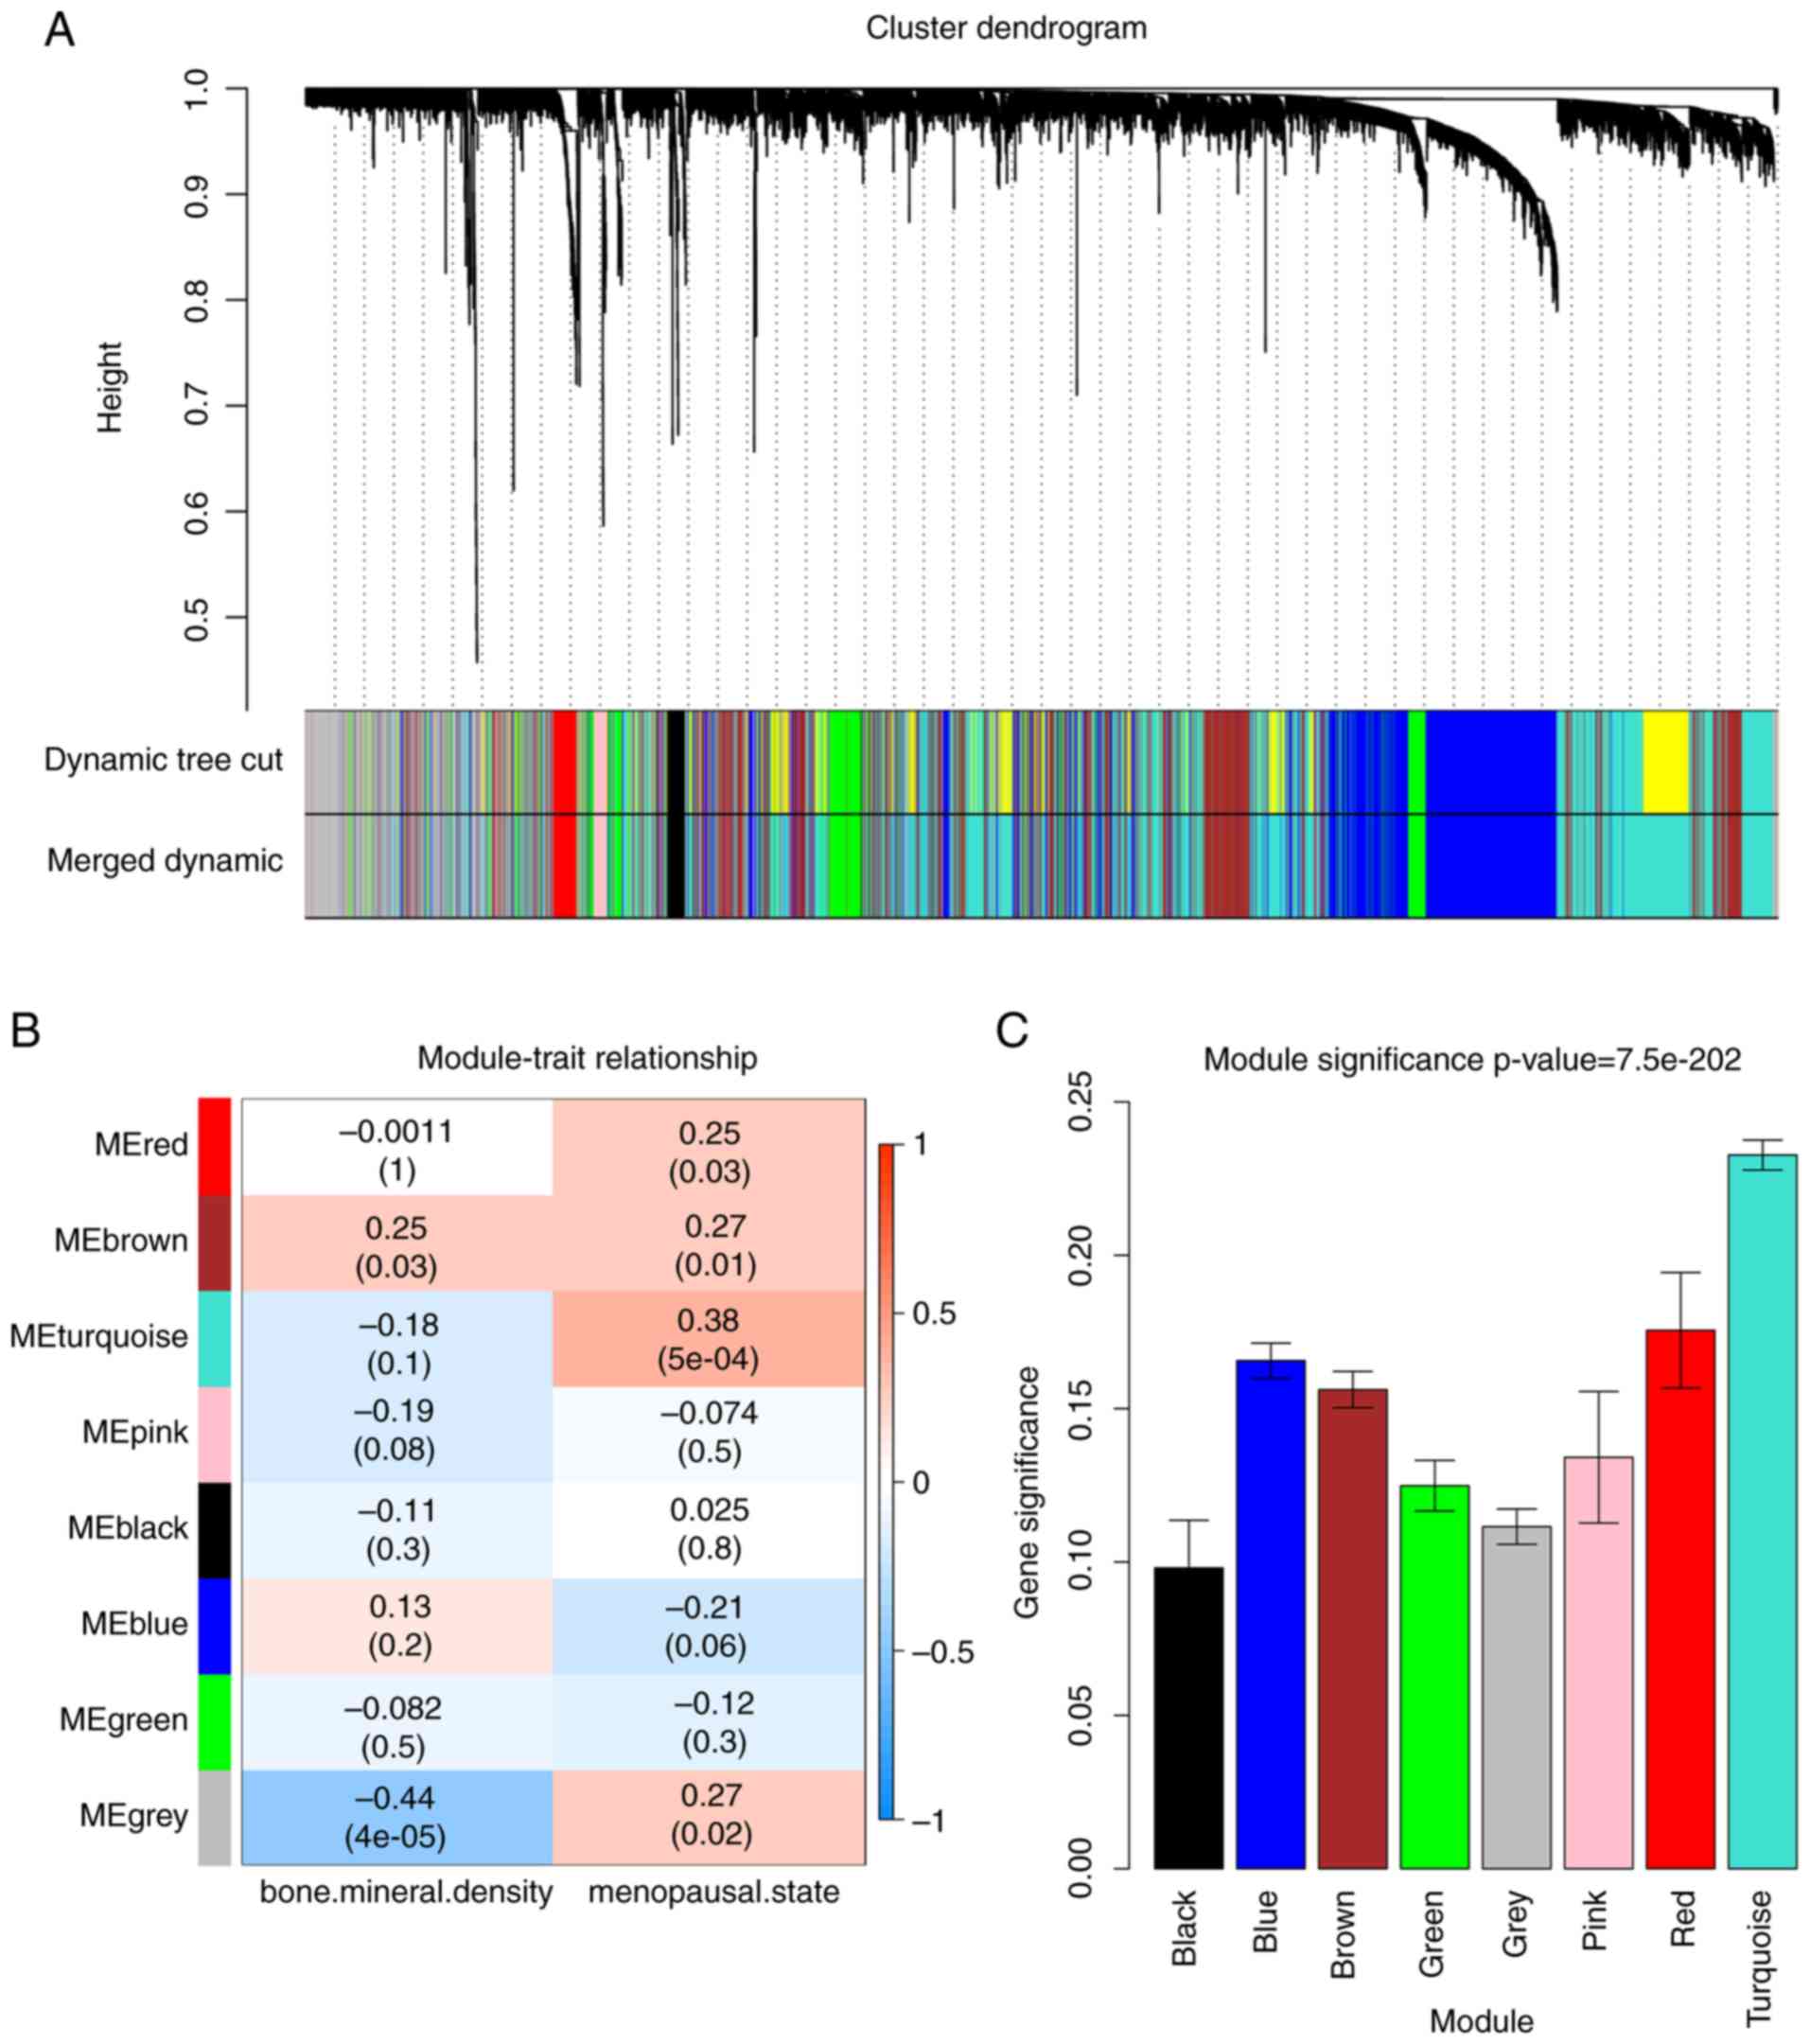
2). In total, 8 modules were identified (Fig. 3A). The relevance between the
phenotype (menopausal status) and module was assessed by two
methods. Initially, modules with higher MS were considered to be
more related to the menopausal status, and accordingly, the
turquoise module MS (P=5×10⁻⁴, R2=0.38) was
revealed to be higher in comparison to the MS of other modules
(Fig. 3B). Similarly, the ME of
the turquoise module exhibited a higher correlation with menopausal
status than the other modules (Fig.
3C). Based on these findings, the turquoise module with
menopausal status was identified as the clinically significant
module and extracted for subsequent analysis.
Identification of hub genes for
menopausal status in the turquoise module
Next, the PPI network of the turquoise module, under
the cut-off of confidence >0.4 and connectivity degree of ≥39,
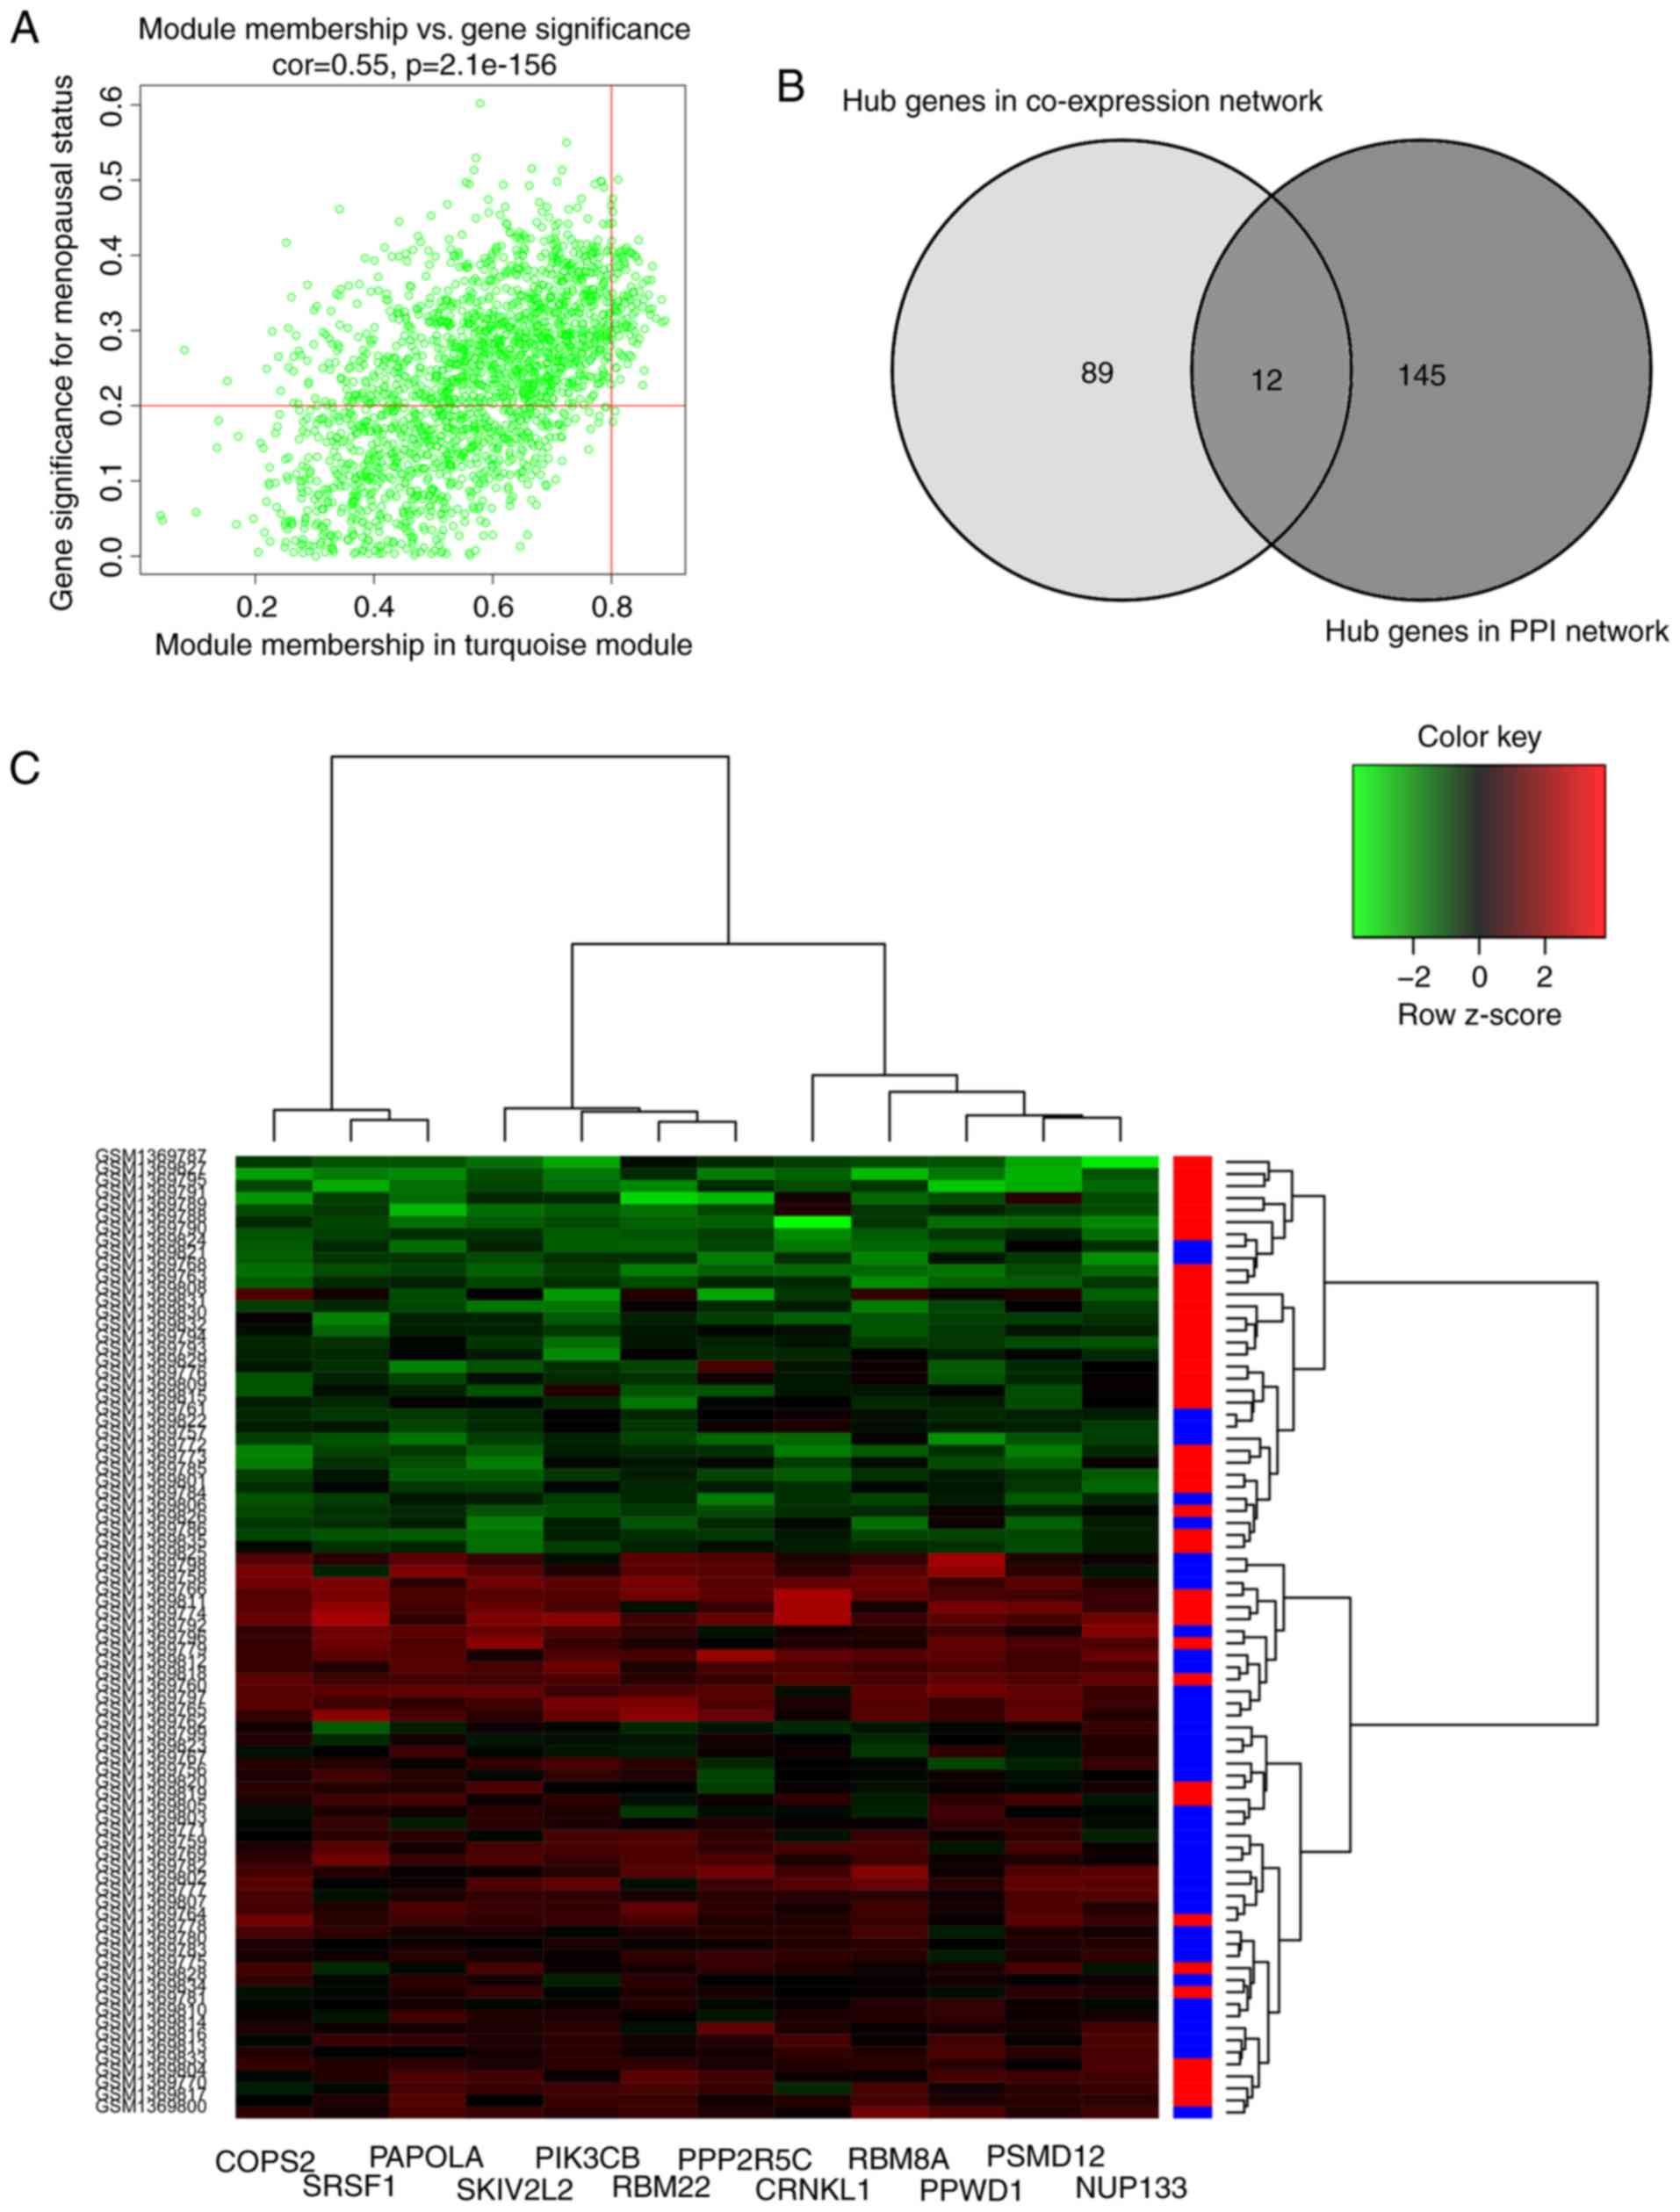
identified 157 genes as hub genes. Further analysis with more
stringent parameters, such as the module connectivity measured by
the absolute value of the Pearson's correlation coefficient
(cor.geneModuleMembership >0.8) and the clinical trait
relationship measured by the absolute value of the Pearson's
correlation coefficient (cor.geneTraitSignificance >0.2),
revealed 101 genes in the turquoise module with a high connectivity
(Fig. 4A). Among the 101 genes,
only NUP133, PSMD12, PPWD1, RBM8A, CRNKL1, PPP2R5C, RBM22,
PIK3CB, SKIV2L2, PAPOLA, SRSF1 and COPS2 were identified
in both PPI and co-expression network (Fig. 4B and C). Hence, these 12 genes were
determined as the ‘real’ hub genes for menopausal status and were
selected for subsequent analysis.
Hub gene validation
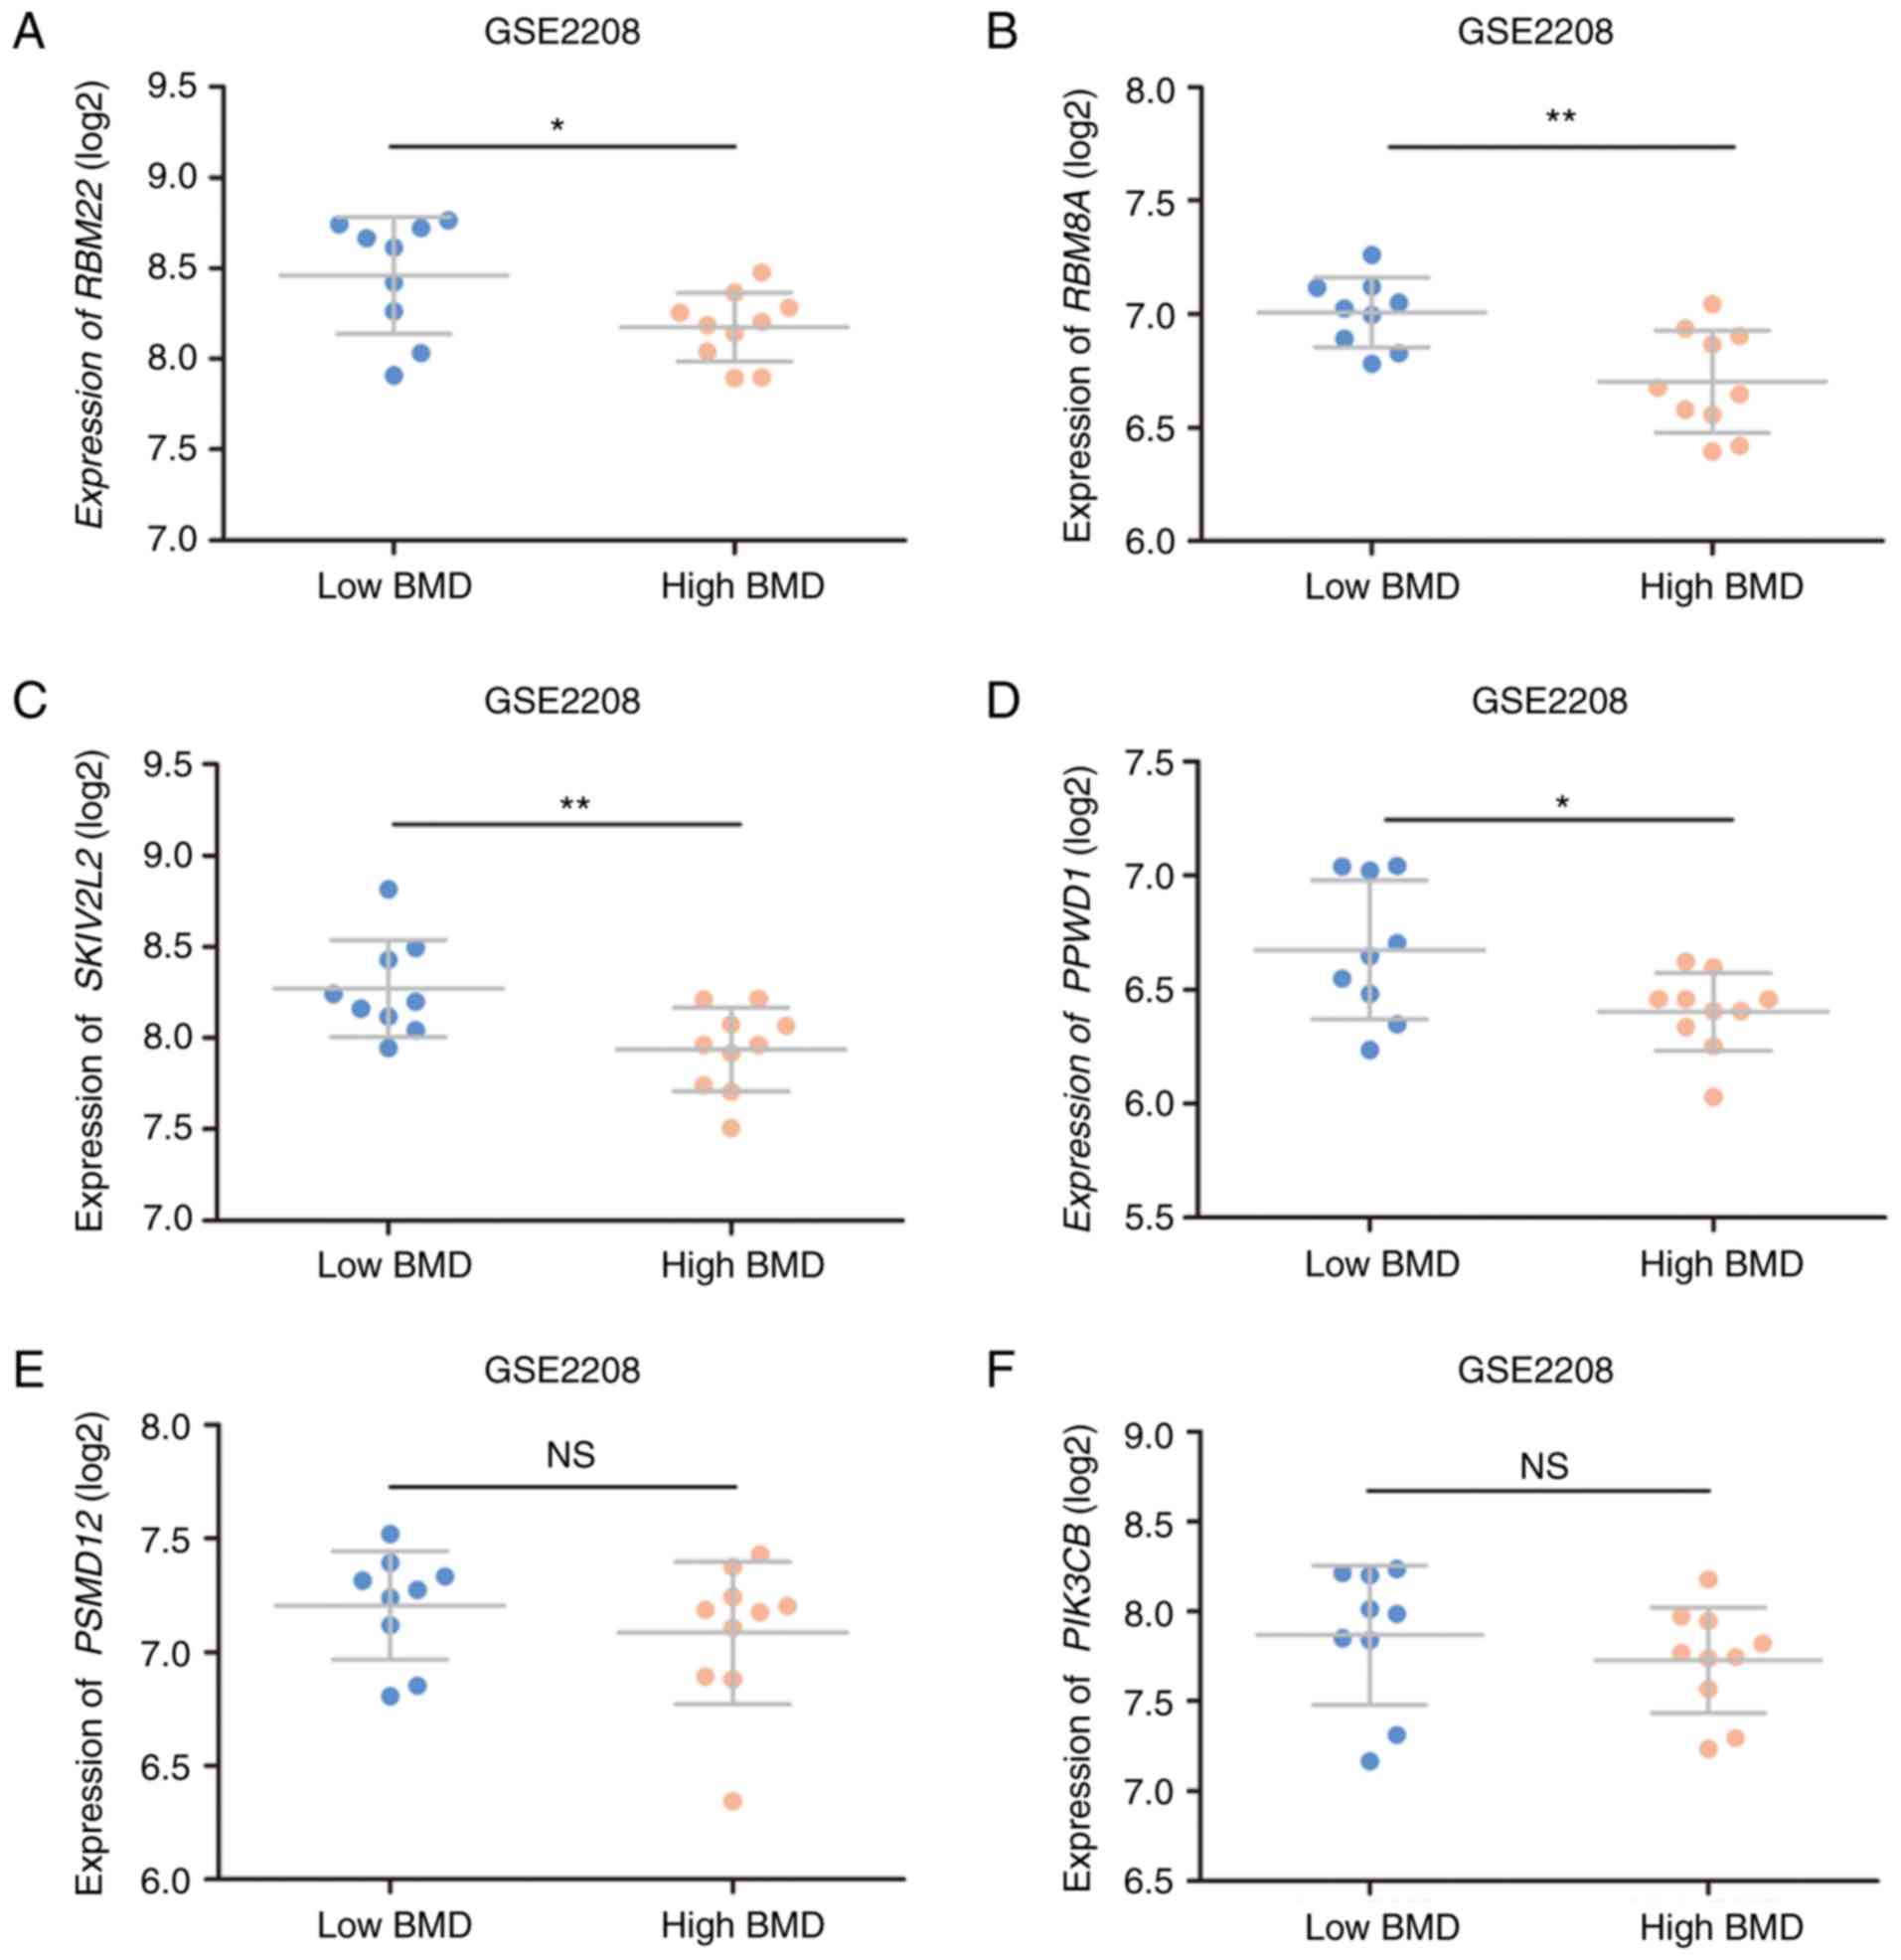
The validation set revealed that the expression
levels of the identified hub genes were increased in postmenopausal
status compared to premenopausal status (Fig. 5A-b to L-b). Furthermore, all genes
except CRKNL1 changed significantly between pre- and
postmenopausal status in women with a high BMD (Fig. 5A-a to L-a). Notably, relative to
those with a premenopausal status, PPP2R5C and PPWD1
were significantly upregulated in women with a low BMD and
postmenopausal status (Fig. 5F-a and
G-a). However, only PPWD1 was altered in the comparison
between low and high BMD women (Fig.
5A-c to L-c). In the premenopausal status, PPWD1
expression was significantly decreased in high BMD women compared
to low BMD women (Fig. 5G-a). A
similar trend was also noted in postmenopausal status, although
statistical significance was not achieved. In the validation set, 4
genes (RBM22, RBM8A, SKIV2L2, and PPWD1) were
significantly downregulated in high BMD women in comparison to low
BMD women (Fig. 6).
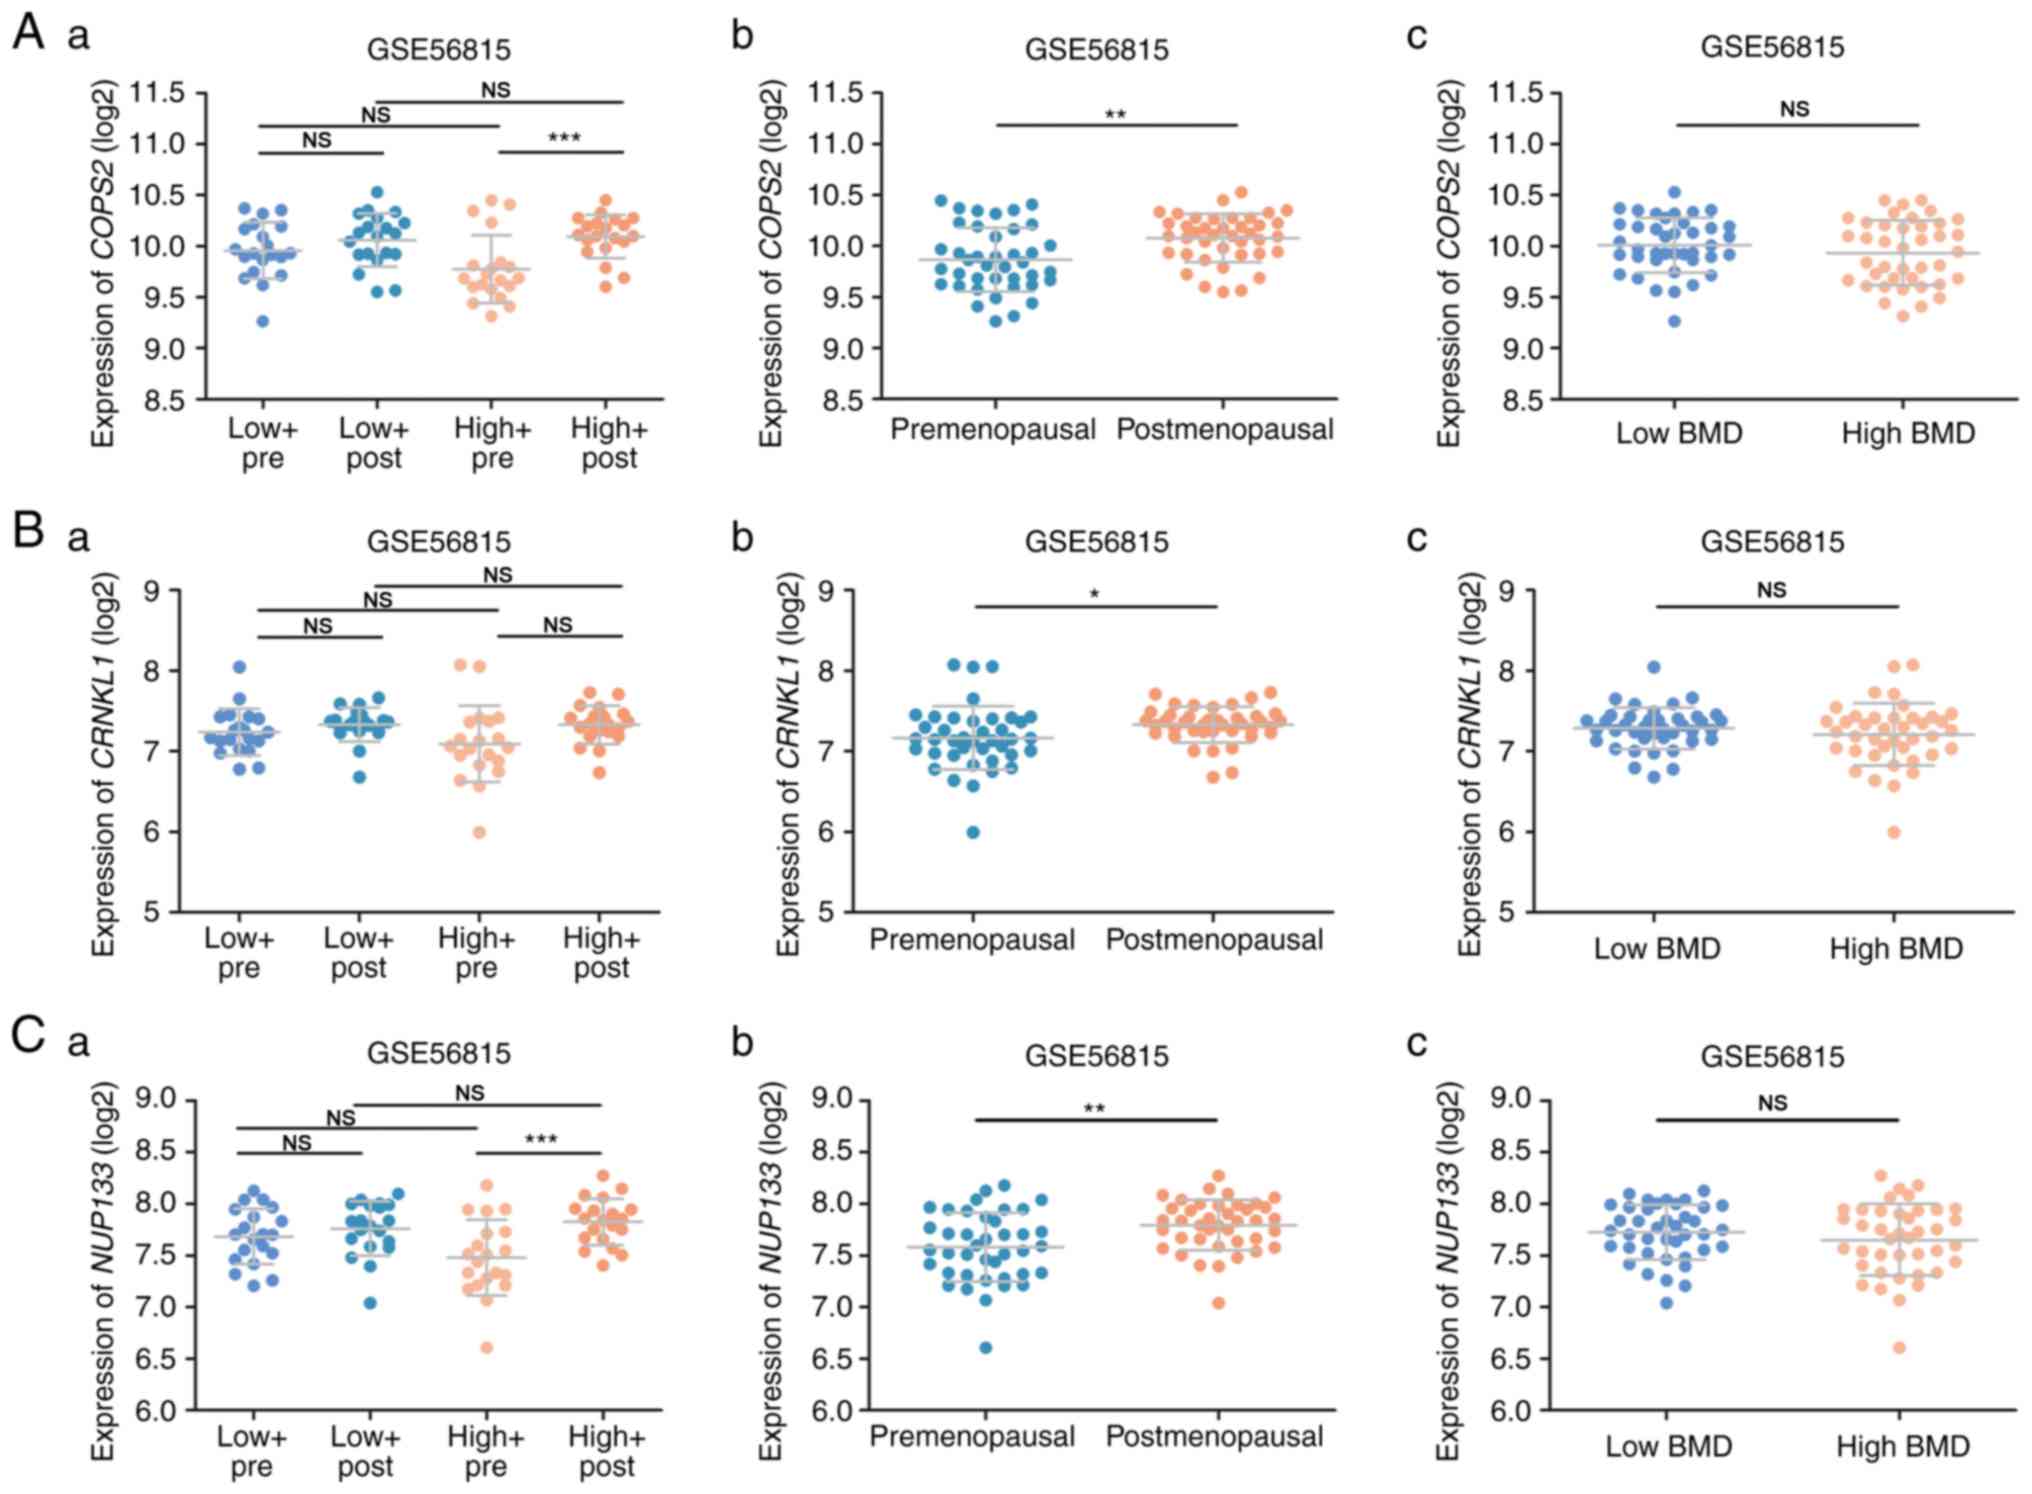 | Figure 5.(A-F) Hub gene validation using the
training set. (A) COPS2 (B) CRNKL1 (C) NUP133
(D) PAPOLA (E) PIK3CB (F) PPP2R5C. (G-L) Hub
gene validation using the training set. (G) PPWD1 (H)
PSMD12 (I) RBM8A (J) RBM22 (K) SKIV2L2
and (L) SRSF1. *P<0.05, **P<0.01, ***P<0.001. low,
low BMD, high, high BMD, pre, premenopausal status, post,
postmenopausal status; BMD, bone mineral density; PPWD1,
peptidylprolyl isomerase domain and WD repeat containing 1. |
Functional and pathway enrichment
analysis
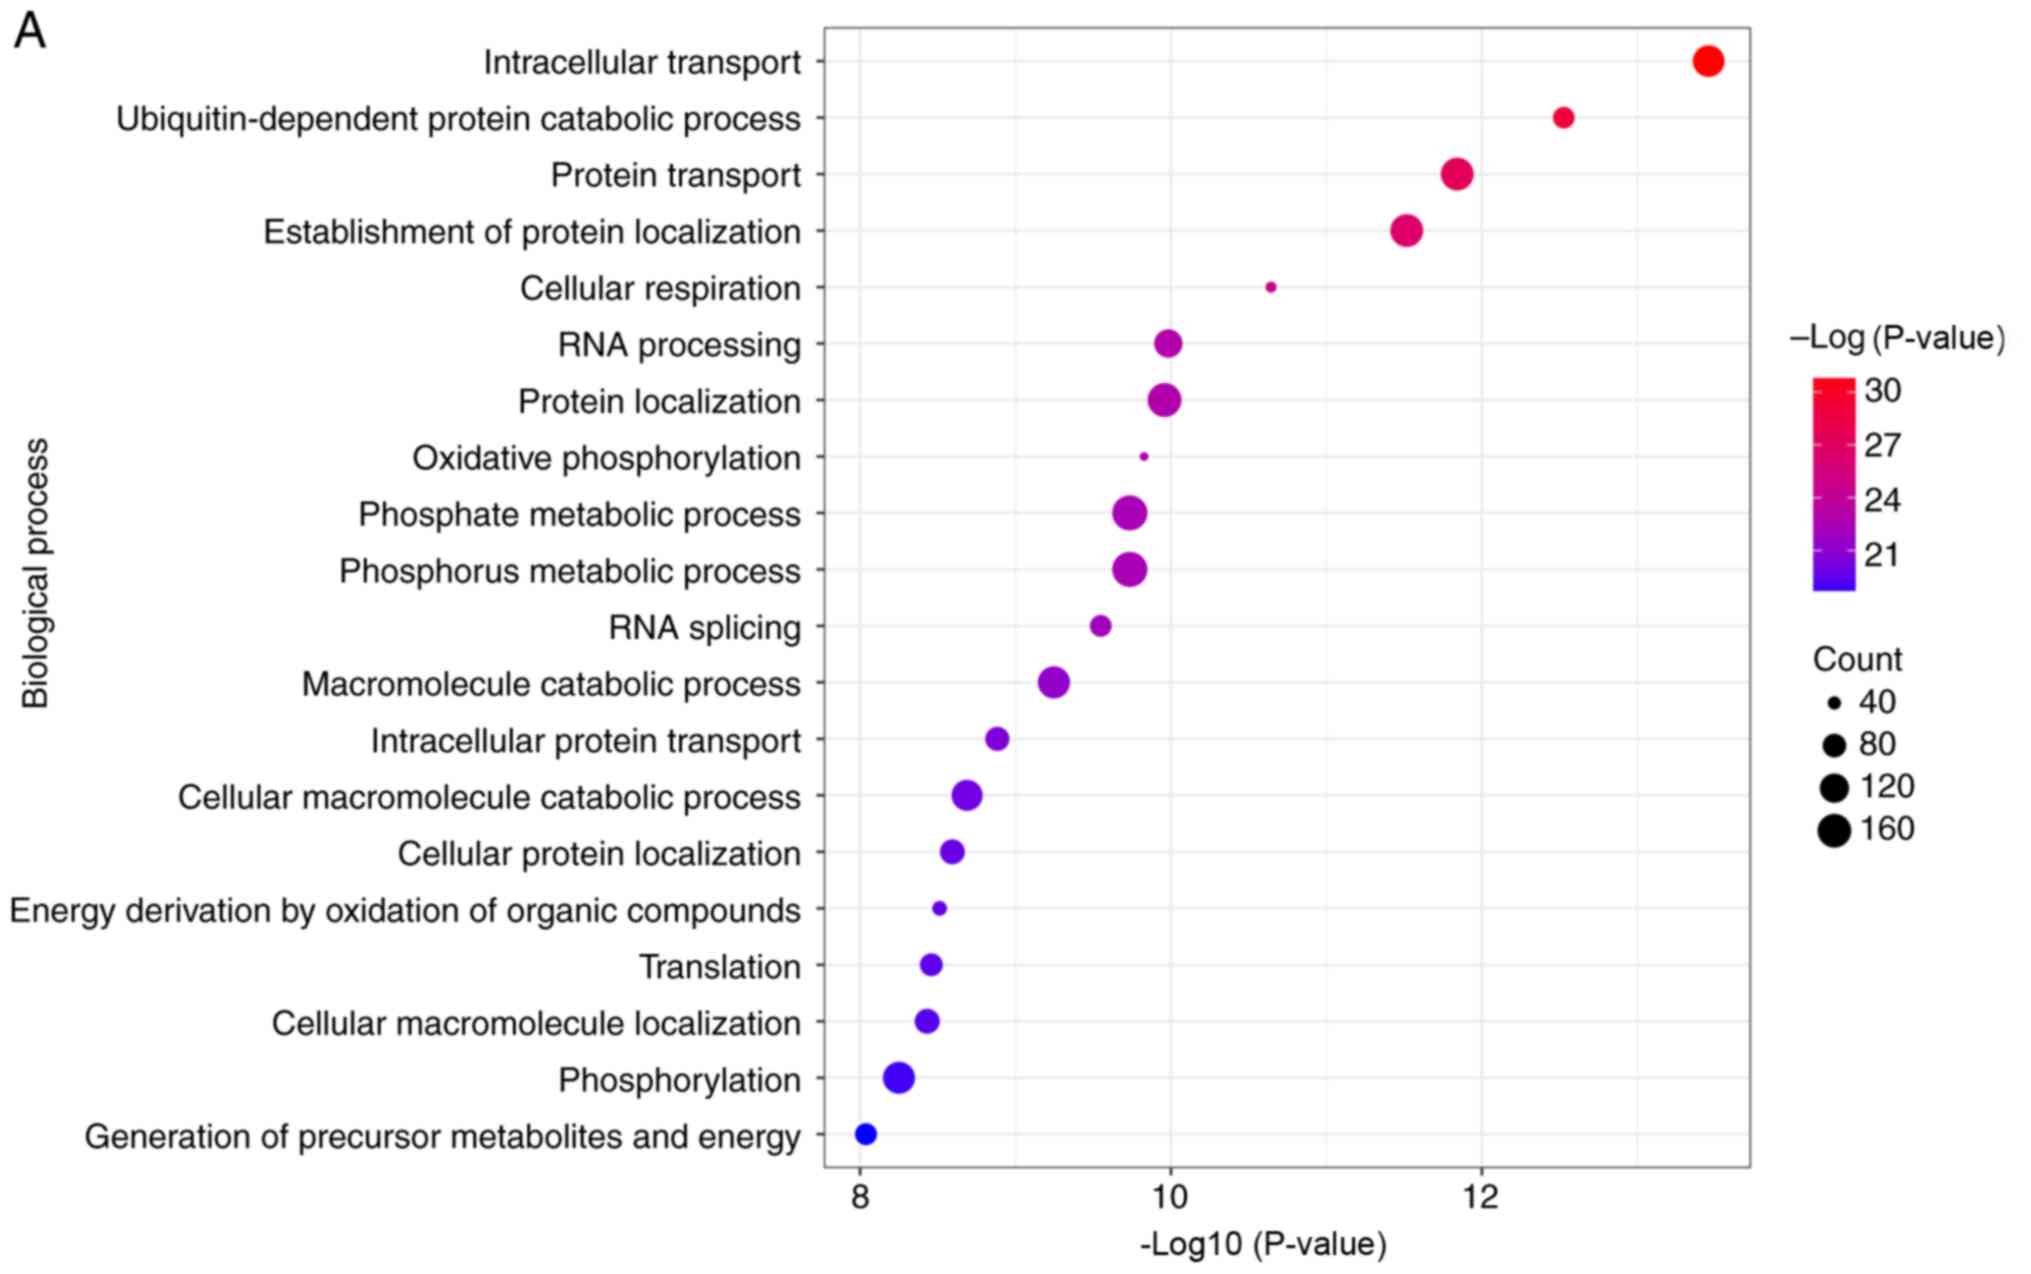
The turquoise module was uploaded to the DAVID
database to gain more insight into the function of these DEGs. GO
analysis revealed a role for the hub genes in the top 20 biological
processes (BP), including intracellular transport,
ubiquitin-dependent protein catabolic process, protein transport,
establishment of protein localization, cellular respiration, RNA
processing, protein localization, oxidative phosphorylation,
phosphate metabolic process, phosphorus metabolic process, RNA
splicing, macromolecule catabolic process, intracellular protein
transport, cellular macromolecule catabolic process, cellular
protein localization, energy derivation by oxidation of organic
compounds, translation, cellular macromolecule localization,
phosphorylation, and generation of precursor metabolites and
energy. Moreover, hub genes were also overrepresented in these top
20 KEGG pathways, including oxidative phosphorylation, Huntington's
disease, Parkinson's disease, proteasome, Alzheimer's disease,
Spliceosome, ubiquitin mediated proteolysis, RNA degradation,
nucleotide excision repair, basal transcription factors,
aminoacyl-tRNA biosynthesis, inositol phosphate metabolism, SNARE
interactions in vesicular transport, lysosome, neurotrophin
signaling pathway, N-glycan biosynthesis, endometrial cancer, mTOR
signaling pathway, Toll-like receptor signaling pathway, and
citrate cycle (TCA cycle) (Fig.
7).
Gene set enrichment analysis
(GSEA)
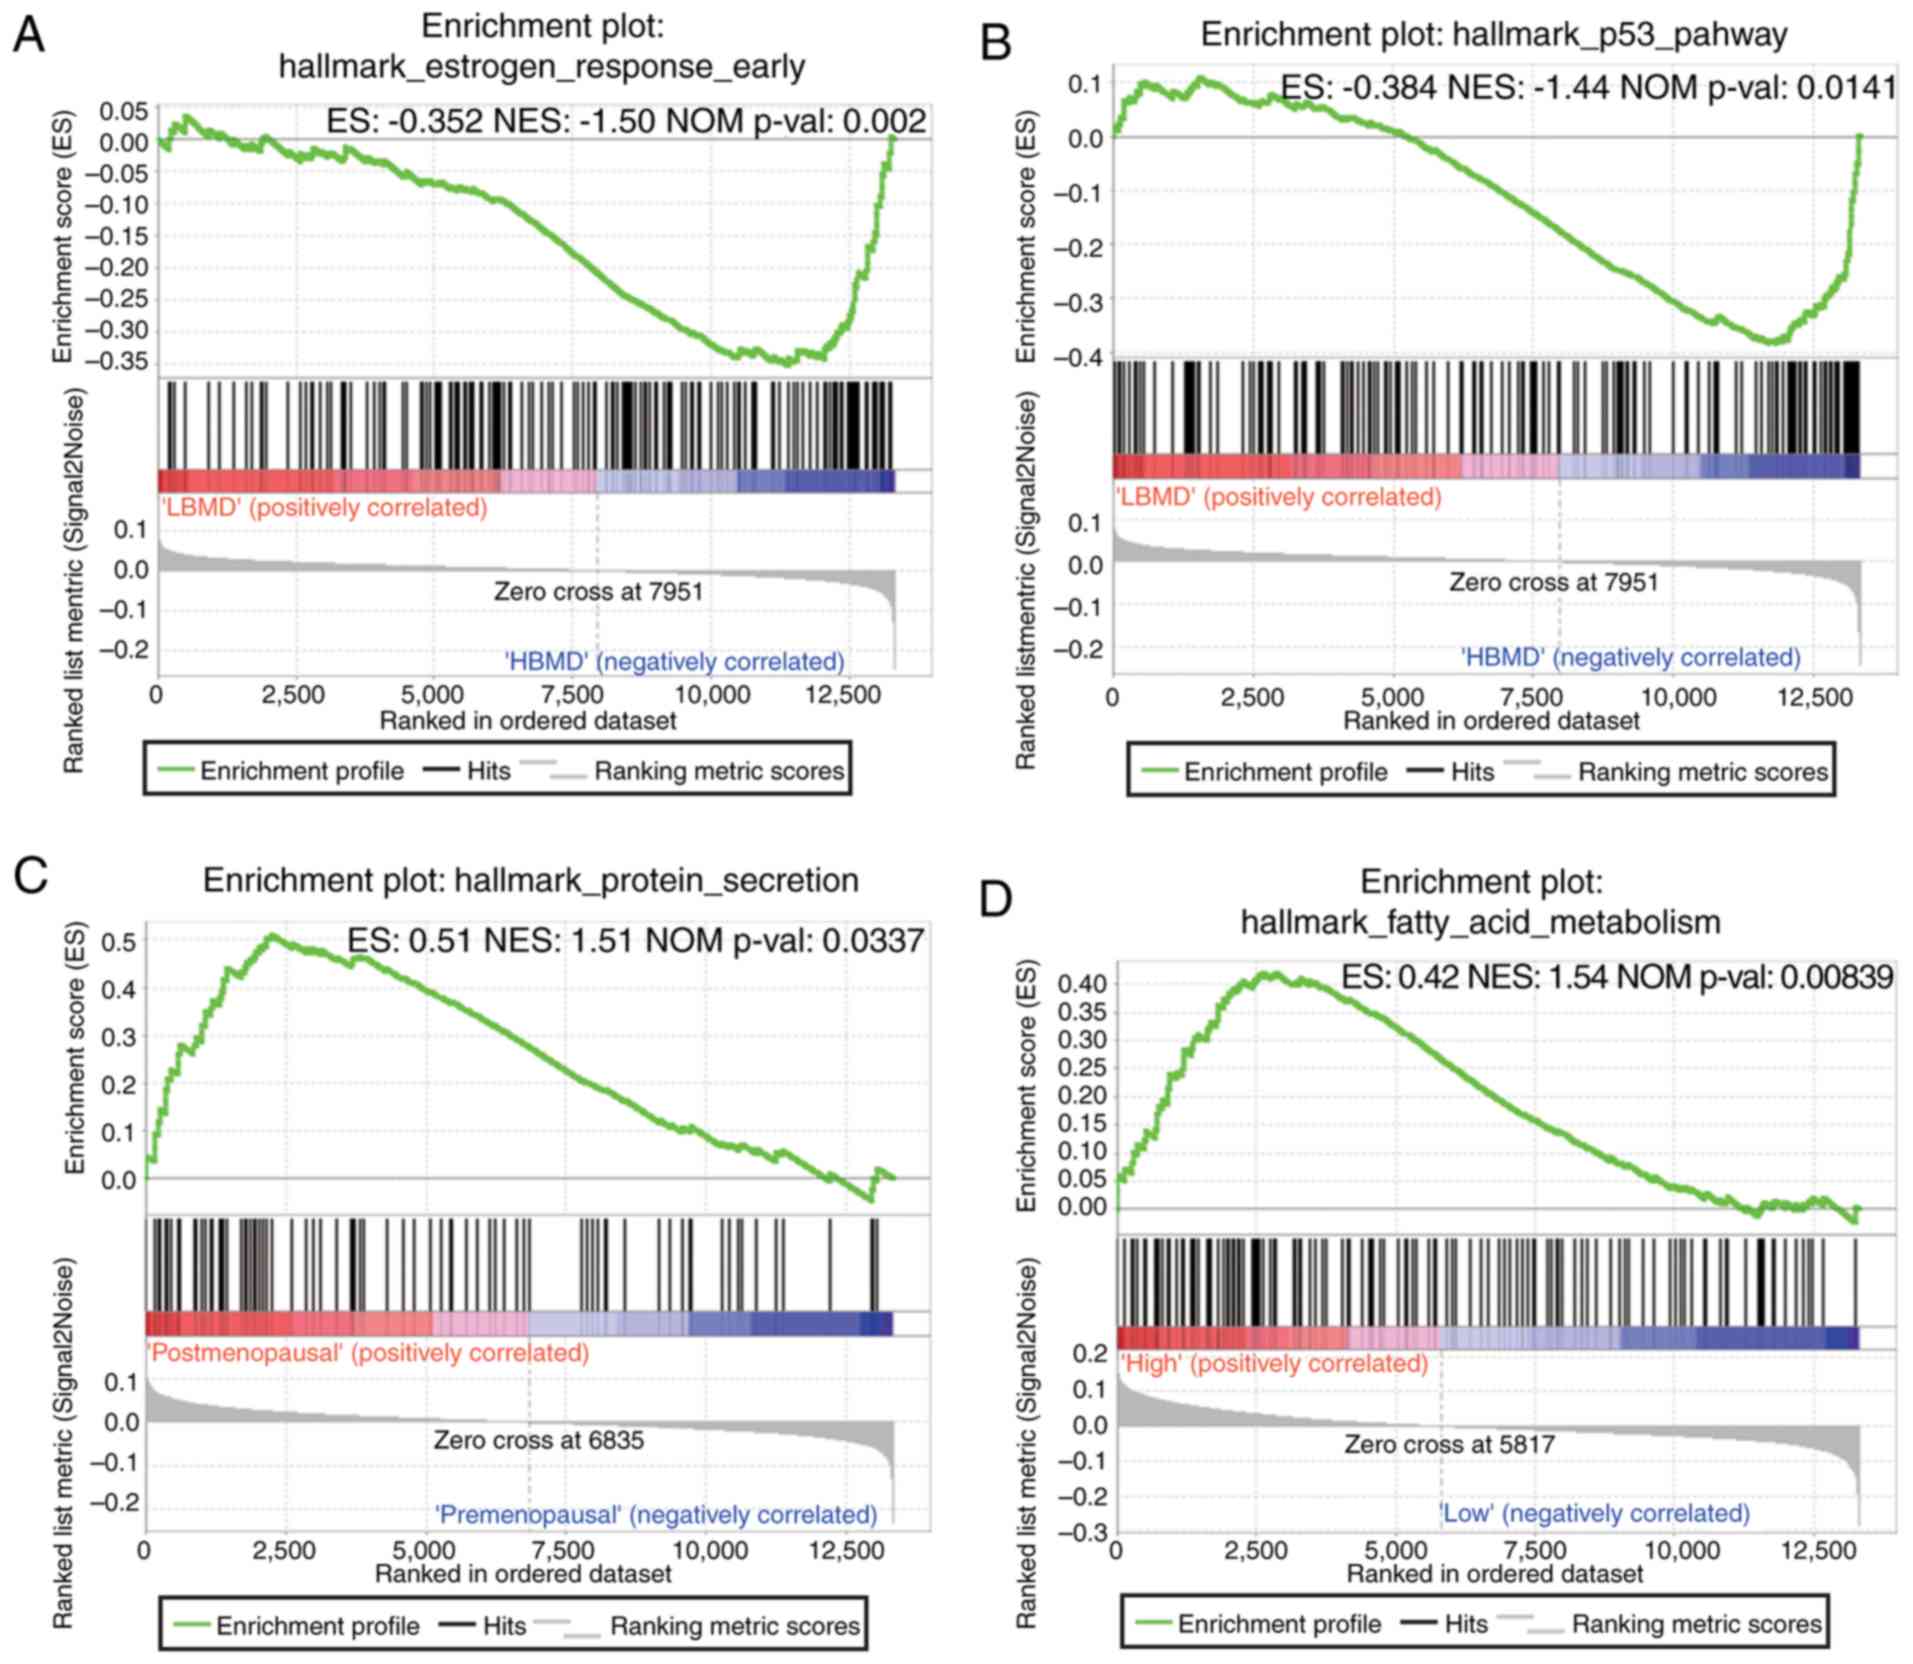
GSEA was conducted to map the gene sets into the
Molecular Signatures Database (MSigDB) and to further elucidate the
potential functions of the hub genes. The results revealed that two
gene sets were associated with BMD, including ‘estrogen response
early’ and the ‘p53 pathway’. One gene set-‘protein secretion’ was
related to menopausal status. In contrast, the level of
PPWD1 was influenced by ‘fatty acid metabolism’ (Fig. 8).
Discussion
The vast majority of patients suffering from OP are
PMO. Although PMO is well understood as a disease, only a few
biomarkers are available to predict its occurrence until now.
Therefore, specific biomarkers for the occurrence of PMO are
necessary. In the present study, a bioinformatics-based approach
was conducted to screen for potential biomarkers, and the findings
indicated that the PPWD1 gene may be a possible
candidate.
In the present study, WGCNA identified the turquoise
module as clinically significant, and subsequent analysis revealed
12 genes (NUP133, PSMD12, PPWD1, RBM8A, CRNKL1, PPP2R5C, RBM22,
PIK3CB, SKIV2L2, PAPOLA, SRSF1 and COPS2) that
overlapped in PPI and co-expression analysis as ‘real’ hub genes. A
previous WGCNA from Farber identified 6 genes (IFI35, EPSTI1,
SP110, STAT1, TAP1, PSMA6) from 26 healthy young Chinese
females through the integration of network analysis and genome-wide
association data (17).
Independently, Zhang et al identified 7 genes (LOC654188,
PPIA, TAGLN2, YWHAB, LMNB1, ANXA2P2, ANXA2) from 42 unrelated
postmenopausal Caucasian women in one study (18) and Chen et al 2 genes
(HOMER1, SPTBN1) from 84 postmenopausal white women in
another study (19). Notably, the
genes identified in the present study were not reported in these
earlier studies. We reason that the observed discrepancy may be
connected to the differences in the subjects and samples, and
should be investigated further.
The present results revealed the high expression
levels of these ‘real’ hub genes in postmenopausal women. However,
only the expression of PPWD1 among the various hub genes
exhibited a strong reduction in high BMD women. In the validation
set, a similar expression pattern of PPWD1 was revealed.
Collectively, the present results indicated that PPWD1 may
be a key gene contributing to the occurrence of PMO. PPWD1
was first cloned in 1994 (20) and
later purified as part of the catalytically competent form of the
spliceosome C complex (21). The
functional role of PPWD1 is currently elusive and is
proposed to be involved in pre-RNA splicing (22). Of note, a functional link between
PPWD1 and bone metabolism has not yet been established.
To investigate the involvement of PPWD1 in
BMD regulation, several gene functional enrichment analyses were
used. Firstly, GO and KEGG pathway analyses were performed. In GO
analysis, it was revealed that these hub genes were significantly
enriched in the metabolic bioenergetics pathway of oxidative
phosphorylation, which takes place in the mitochondria. Similarly,
the KEGG pathway analysis revealed that oxidative phosphorylation
was the most abundant pathway. Hence, it was speculated that the
function of PPWD1 may be linked to energy metabolism in
mitochondria. To confirm this hypothesis, GSEA analysis was carried
out. Notably, our results revealed that the fatty acid metabolism
pathway was significantly enriched in the samples with a high
expression of PPWD1. Therefore, PPWD1 may play a role
in the fatty acid oxidation pathway, which is functionally
inter-linked to the oxidative phosphorylation pathway, as both
derive ATP through the mitochondrial electron transport chain.
Notably, many studies have highlighted the role of fatty acids in
bone metabolism, including bone formation and resorption (23–27).
Treatment with palmitate has been revealed to block the osteoblast
differentiation of fetal rat calvarial cells (28). Independently, Kim et al
demonstrated that a medium-chain fatty acid, capric acid, inhibits
the osteoclast differentiation induced by RANKL (29). Recently, Lavadogarcía et al
described a positive correlation between a dietary intake of long
chain omega-3 polyunsaturated fatty acids and BMD in normal and
osteopenia Spanish women (30).
However, the exact function of PPWD1 requires investigation
to identify whether it may have an effect on bone metabolism by
regulating fatty acid metabolism.
In summary, the present study used a weighted gene
co-expression analysis to construct a gene co-expression network to
identify and validate hub genes associated with menopausal status
and BMD. Subsequently, PPWD1 was identified and validated in
association with the occurrence of PMO, and the present findings
highlighted the potential of PPWD1 as a possible diagnostic
biomarker for PMO.
Acknowledgements
Not applicable.
Funding
The present study was supported in part by grants
from the Medical Science and Technology Project of Zhejiang
Province (nos. 2016KYB082 and 2017KY049), the Science and
Technology Project of Zhejiang Province (no. 2017C37152) and the
National Natural Science Foundation of China (nos. 81500616 and
81701365).
Availability of data and materials
The datasets used and/or analyzed during the current
study are available from the corresponding author on reasonable
request.
Authors' contributions
GFQ, LSY and YX designed the study. GFQ and LSY
analyzed the data and drafted the manuscript. MC, DY, GPC, ZZ, CJL,
VV and YX analyzed the data and revised the manuscript. All authors
read and approved the final manuscript and agree to be accountable
for all aspects of the research in ensuring that the accuracy or
integrity of any part of the work are appropriately investigated
and resolved.
Ethics approval and consent to
participate
Not applicable.
Patient consent for publication
Not applicable.
Competing interests
The authors declare that they have no competing
interests.
References
|
1
|
Kanis JA, Melton LJ III, Christiansen C,
Johnston CC and Khaltaev N: The diagnosis of osteoporosis. J Bone
Miner Res. 9:1137–1141. 1994. View Article : Google Scholar : PubMed/NCBI
|
|
2
|
Si L, Winzenberg TM, Jiang Q, Chen M and
Palmer AJ: Projection of osteoporosis-related fractures and costs
in China: 2010–2050. Osteoporos Int. 26:1929–1937. 2015. View Article : Google Scholar : PubMed/NCBI
|
|
3
|
Burge R, Dawson-Hughes B, Solomon DH, Wong
JB, King A and Tosteson A: Incidence and economic burden of
osteoporosis-related fractures in the United States, 2005–2025. J
Bone Miner Res. 22:4652007. View Article : Google Scholar : PubMed/NCBI
|
|
4
|
Eastell R, O'Neill TW, Hofbauer LC,
Langdahl B, Reid IR, Gold DT and Cummings SR: Postmenopausal
osteoporosis. Nat Rev Dis Primers. 2:160692016. View Article : Google Scholar : PubMed/NCBI
|
|
5
|
Almeida M, Martin-Millan M, Ambrogini E,
Bradsher R III, Han L, Chen XD, Roberson PK, Weinstein RS, O'Brien
CA, Jilka RL and Manolagas SC: Estrogens attenuate oxidative stress
and the differentiation and apoptosis of osteoblasts by
DNA-binding-independent actions of the ERα. J Bone Miner Res.
25:769–781. 2010.PubMed/NCBI
|
|
6
|
Goettsch C, Babelova A, Trummer O, Erben
RG, Rauner M, Rammelt S, Weissmann N, Weinberger V, Benkhoff S,
Kampschulte M, et al: NADPH oxidase 4 limits bone mass by promoting
osteoclastogenesis. J Clin Inves. 123:4731–4738. 2013. View Article : Google Scholar
|
|
7
|
Langfelder P and Horvath S: WGCNA: An R
package for weighted correlation network analysis. BMC
Bioinformatics. 9:5592008. View Article : Google Scholar : PubMed/NCBI
|
|
8
|
Yuan L, Zeng G, Chen L, Wang G and Wang X,
Cao X, Lu M, Liu X, Qian G, Xiao Y and Wang X: Identification of
key genes and pathways in human clear cell renal cell carcinoma
(ccRCC) by co-expression analysis. Int J Biol Sci. 14:266–279.
2018. View Article : Google Scholar : PubMed/NCBI
|
|
9
|
Chen L, Yuan L, Wang Y, Wang G, Zhu Y, Cao
R, Qian G, Xie C, Liu X, Xiao Y and Wang X: Co-expression network
analysis identified FCER1G in association with progression and
prognosis in human clear cell renal cell carcinoma. Int J Biol Sci.
13:1361–1372. 2017. View Article : Google Scholar : PubMed/NCBI
|
|
10
|
Yuan L, Chen L, Qian K, Wang G, Lu M, Qian
G, Cao X, Jiang W, Xiao Y and Wang X: A novel correlation
betweenATP5A1gene expression and progression of human clear cell
renal cell carcinoma identified by co-expression analysis. Oncol
Rep. 39:5252018.PubMed/NCBI
|
|
11
|
Yuan L, Chen L, Qian K, Qian G, Wu CL,
Wang X and Xiao Y: Co-expression network analysis identified six
hub genes in association with progression and prognosis in human
clear cell renal cell carcinoma (ccRCC). Genom Data. 14:132–140.
2017. View Article : Google Scholar : PubMed/NCBI
|
|
12
|
Chen L, Yuan L, Wang G, Cao R, Peng J, Shu
B, Qian G, Wang X and Xiao Y: Identification and bioinformatics
analysis of miRNAs associated with human muscle invasive bladder
cancer. Mol Med Rep. 16:8709–8720. 2017. View Article : Google Scholar : PubMed/NCBI
|
|
13
|
Yuan L, Shu B, Chen L, Qian K, Wang Y,
Qian G, Zhu Y, Cao X, Xie C, Xiao Y and Wang X: Overexpression of
COL3A1 confers a poor prognosis in human bladder cancer identified
by co-expression analysis. Oncotarget. 8:70508–70520. 2017.
View Article : Google Scholar : PubMed/NCBI
|
|
14
|
Shi H, Zhang L, Qu Y, Hou L, Wang L and
Zheng M: Prognostic genes of breast cancer revealed by gene
co-expression network analysis. Oncol Lett. 14:4535–4542. 2017.
View Article : Google Scholar : PubMed/NCBI
|
|
15
|
Zhang Y, Wang J, Ji LJ, Li L, Wei M, Zhen
S and Wen CC: Identification of key gene modules of neuropathic
pain by co-expression analysis. J Cell Biochem. 118:44362017.
View Article : Google Scholar : PubMed/NCBI
|
|
16
|
Horvath S and Dong J: Geometric
interpretation of gene co-expression network analysis. PLoS Comput
Biol. 4:e10001172008. View Article : Google Scholar : PubMed/NCBI
|
|
17
|
Farber CR: Identification of a gene module
associated with BMD through the integration of network analysis and
genome-wide association data. J Bone Miner Res. 25:2359–2367. 2010.
View Article : Google Scholar : PubMed/NCBI
|
|
18
|
Zhang L, Liu YZ, Zeng Y, Zhu W, Zhao YC,
Zhang JG, Zhu JQ, He H, Shen H, Tian Q, et al: Network-based
proteomic analysis for postmenopausal osteoporosis in Caucasian
females. Proteomics. 16:12–28. 2016. View Article : Google Scholar : PubMed/NCBI
|
|
19
|
Chen YC, Guo YF, He H, He H, Lin X, Wang
XF, Zhou R, Li WT, Pan DY, Shen J and Deng HW: Integrative analysis
of genomics and transcriptome data to identify potential functional
genes of BMDs in females. J Bone Miner Res. 31:1041–1049. 2016.
View Article : Google Scholar : PubMed/NCBI
|
|
20
|
Nomura N, Nagase T, Miyajima N, Sazuka T,
Tanaka A, Sato S, Seki N, Kawarabayasi Y, Ishikawa K and Tabata S:
Prediction of the coding sequences of unidentified human genes. II.
The coding sequences of 40 new genes (KIAA0041-KIAA0080) deduced by
analysis of cDNA clones from human cell line KG-1 (supplement). DNA
Res. 1:251–162. 1994. View Article : Google Scholar : PubMed/NCBI
|
|
21
|
Jurica MS and Moore MJ: Pre-mRNA splicing:
Awash in a sea of proteins. Mol Cell. 12:5–14. 2003. View Article : Google Scholar : PubMed/NCBI
|
|
22
|
Davis TL, Walker JR, Ouyang H, MacKenzie
F, Butler-Cole C, Newman EM, Eisenmesser EZ and Dhe-Paganon S: The
crystal structure of human WD40 repeat-containing peptidylprolyl
isomerase (PPWD1). FEBS J. 275:2283–2295. 2008. View Article : Google Scholar : PubMed/NCBI
|
|
23
|
Lee WC, Guntur AR, Long F and Rosen CJ:
Energy metabolism of the osteoblast: Implications for osteoporosis.
Endocr Rev. 38:255–266. 2017. View Article : Google Scholar : PubMed/NCBI
|
|
24
|
Kruger MC, Coetzee M, Haag M and Weiler H:
Long-chain polyunsaturated fatty acids: Selected mechanisms of
action on bone. Prog Lipid Res. 49:438–449. 2010. View Article : Google Scholar : PubMed/NCBI
|
|
25
|
Frey JL, Li Z, Ellis JM, Zhang Q, Farber
CR, Aja S, Wolfgang MJ, Clemens TL and Riddle RC: Wnt-Lrp5
signaling regulates fatty acid metabolism in the osteoblast. Mol
Cell Biol. 35:1979–1991. 2015. View Article : Google Scholar : PubMed/NCBI
|
|
26
|
Kushwaha P, Wolfgang MJ and Riddle RC:
Fatty acid metabolism by the osteoblast. Bone. 115:8–14. 2018.
View Article : Google Scholar : PubMed/NCBI
|
|
27
|
Lin G, Wang H, Dai J, Li X, Guan M, Gao S,
Ding Q, Wang H and Fang H: Conjugated linoleic acid prevents
age-induced bone loss in mice by regulating both osteoblastogenesis
and adipogenesis. Biochem Biophys Res Commun. 490:813–823. 2017.
View Article : Google Scholar : PubMed/NCBI
|
|
28
|
Yeh LCC, Ford JJ, Lee JC and Adamo ML:
Palmitate attenuates osteoblast differentiation of fetal rat
calvarial cells. Biochem Biophys Res Commun. 450:777–781. 2014.
View Article : Google Scholar : PubMed/NCBI
|
|
29
|
Kim HJ, Yoon HJ, Kim SY and Yoon YR: A
medium-chain fatty acid, capric acid, inhibits RANKL-induced
osteoclast differentiation via the suppression of NF-κB signaling
and blocks cytoskeletal organization and survival in mature
osteoclasts. Mol Cells. 37:598–604. 2014. View Article : Google Scholar : PubMed/NCBI
|
|
30
|
Lavadogarcía J, Ronceromartin R, Moran JM,
Pedrera-Canal M, Aliaga I, Leal-Hernandez O, Rico-Martin S and
Canal- Macias ML: Long-chain omega-3 polyunsaturated fatty acid
dietary intake is positively associated with bone mineral density
in normal and osteopenic Spanish women. PLoS One. 13:e01905392018.
View Article : Google Scholar : PubMed/NCBI
|