Introduction
Esophageal squamous cell carcinoma (ESCC) is one of
the most life-threatening types of cancer worldwide and the major
histological type of esophageal cancer in East Asian countries
(1). Approximately 455,800 new
cases of esophageal cancer and 400,200 cases of esophageal
cancer-related mortality occurred in 2012 worldwide; men with
esophageal cancer have a three- to four-fold higher mortality rate
than women (1). ESCC is an
invasive tumor with a poor prognosis and is generally diagnosed
only following the onset of symptoms. Although ESCC treatment has
improved, the 5-year overall survival (OS) rate of patients with
ESCC remains low due to insufficient understanding of its molecular
pathogenesis and infrequent early-stage examination (2). Therefore, novel insights into the
diagnosis and prognosis of ESCC can be obtained by increasing the
level of understanding of its pathogenesis.
Similar to other types of cancer, the development of
ESCC involves the gradual accumulation of vital gene mutations
involved in cell cycle control, cell growth, differentiation,
apoptosis, migration and invasion, or other functions, including
the inactivation of tumor suppressor genes and activation of
oncogenes (3). Zhang et al
(4) found that ROC1 is expressed
at a high level in ESCC and is associated with poor prognosis.
Targeting the overexpressed ROC1 induces G2 cell cycle arrest and
apoptosis in esophageal cancer cells. Hers et al (5) found that increasing the transduction
of the Akt signaling pathway serves an important role in several
types of cancer, including breast cancer (6), prostate cancer (7) and gastric cancer (5,8). P53
is one of the most commonly mutated genes in human cancer, the
overexpression of epidermal growth factor receptor and P53 mutation
induces tumor development, invasion and differentiation (9). Although certain genes or proteins are
involved in the development of ESCC, the pathogenic mechanisms
remain unclear. Therefore, determining the pathogenesis of
esophageal cancer-related signaling pathways and predicting the
prognosis of esophageal cancer are crucial.
The present study aimed to identify the hub genes
(Table I) related to the
occurrence and development of esophageal cancer through
bioinformatics analysis, and then examine the signaling pathways
involved in these hub genes and their relationship with the
prognosis of esophageal cancer. The present study aims to further
improve current understanding of the occurrence and development of
esophageal cancer.
 | Table I.Eight hub genes with a high degree of
connectivity. |
Table I.
Eight hub genes with a high degree of
connectivity.
| Gene | Degree of
connectivity | adj.P.Val |
|---|
| CHEK1 | 88 | 1.64E-08 |
| BUB1B | 84 | 2.10E-08 |
| PTTG1 | 64 | 1.62E-04 |
| COL4A1 | 16 | 2.26E-04 |
| CXCR2 | 15 | 1.15E-08 |
| ADRB2 | 12 | 2.15E-05 |
| ACOX2 | 5 | 5.82E-06 |
| EFNA1 | 4 | 1.27E-06 |
Materials and methods
Microarray data
The GSE38129 gene expression dataset was submitted
by Hu et al (10) and can
be obtained from the publicly accessible Gene Expression Omnibus
(GEO) database. The dataset was downloaded and analyzed from the
GEO at the National Center for Biotechnology Information website
(https://www.ncbi.nlm.nih.gov/geo/).
The study was based on the GPL571 platform (Affymetrix Human Genome
U133A 2.0 Array, Affymetrix; Thermo Fisher Scientific, Inc.). The
samples used for gene profile analysis were obtained from 30
patients with ESCC and paired adjacent normal tissues, the patients
were from high-risk areas of China, and the most recent update was
in April 2017.
Data processing of differentially
expressed genes (DEGs)
GEO2R online software was used for GSE38129 analysis
to detect the DEGs between the tumor and normal tissues. GEO2R is
an interactive networking tool that helps users to compare various
groups of samples in the GEO series and identify DEGs under
specific experimental conditions. The adjusted P<0.01 and |log
fold change (FC)|>1 values were used as the cut-off criteria for
DEG identification. Subsequently, 928 DEGs were identified
following GSE38129 analysis. Among these DEGs, 498 and 430 were
upregulated and downregulated, respectively.
Gene Ontology (GO) function and Kyoto
Encyclopedia of Genes and Genomes (KEGG) pathway enrichment
analyses
GO analysis (https://david.ncifcrf.gov/) (11), which is a bioinformatics tool that
can be used to annotate genes and gene products and determine the
biological characteristics of high-throughput genome or
transcriptome data, includes three categories, namely, biological
process (BP), cellular component (CC) and molecular function (MF).
The KEGG knowledge database (12)
is a group of databases used for all types of biological data and
can be used to determine functional and metabolic pathways.
P<0.05 was set as the cut-off criterion and considered to
indicate a statistically significant difference (Fig. S1). The Database for Annotation,
Visualization and Integrated Discovery (DAVID) (13) is a web-based online bioinformatics
resource and a functional interpretation tool with a large scale
gene or protein dataset that can provide comprehensive functional
annotation for genes.
Protein-protein interaction (PPI)
network construction and module analysis
The Search Tool for the Retrieval of Interacting
Genes (STRING; http://string-db.org/) (14) database is an online tool that
contains comprehensive information of various proteins and detects
potential associations among the DEGs. The results were input into
Cytoscape to visualize the PPI networks of the DEGs. A high
combined score indicated reliable PPIs. In the present study,
interactions with a combined confidence of >0.7 were considered
significant. The PPI network was constructed using Cytoscape
software. The Molecular Complex Detection plug-in of Cytoscape
(15) further indicated the
essential modules in the PPI networks (degree node score
cut-off=0.2, K-Core=2, degree cut-off=2).
Survival analysis
Gene Expression Profiling Interactive Analysis
(GEPIA) (16) is a web-based
server for cancer and normal gene expression analyses and
interactive analysis on the basis of The Cancer Genome Atlas (TCGA)
and Genotype-Tissue Expression (GTEx) data. Multiple types of
analyses can be performed, including differential expression
analysis, profiling plotting, correlation analysis and patient
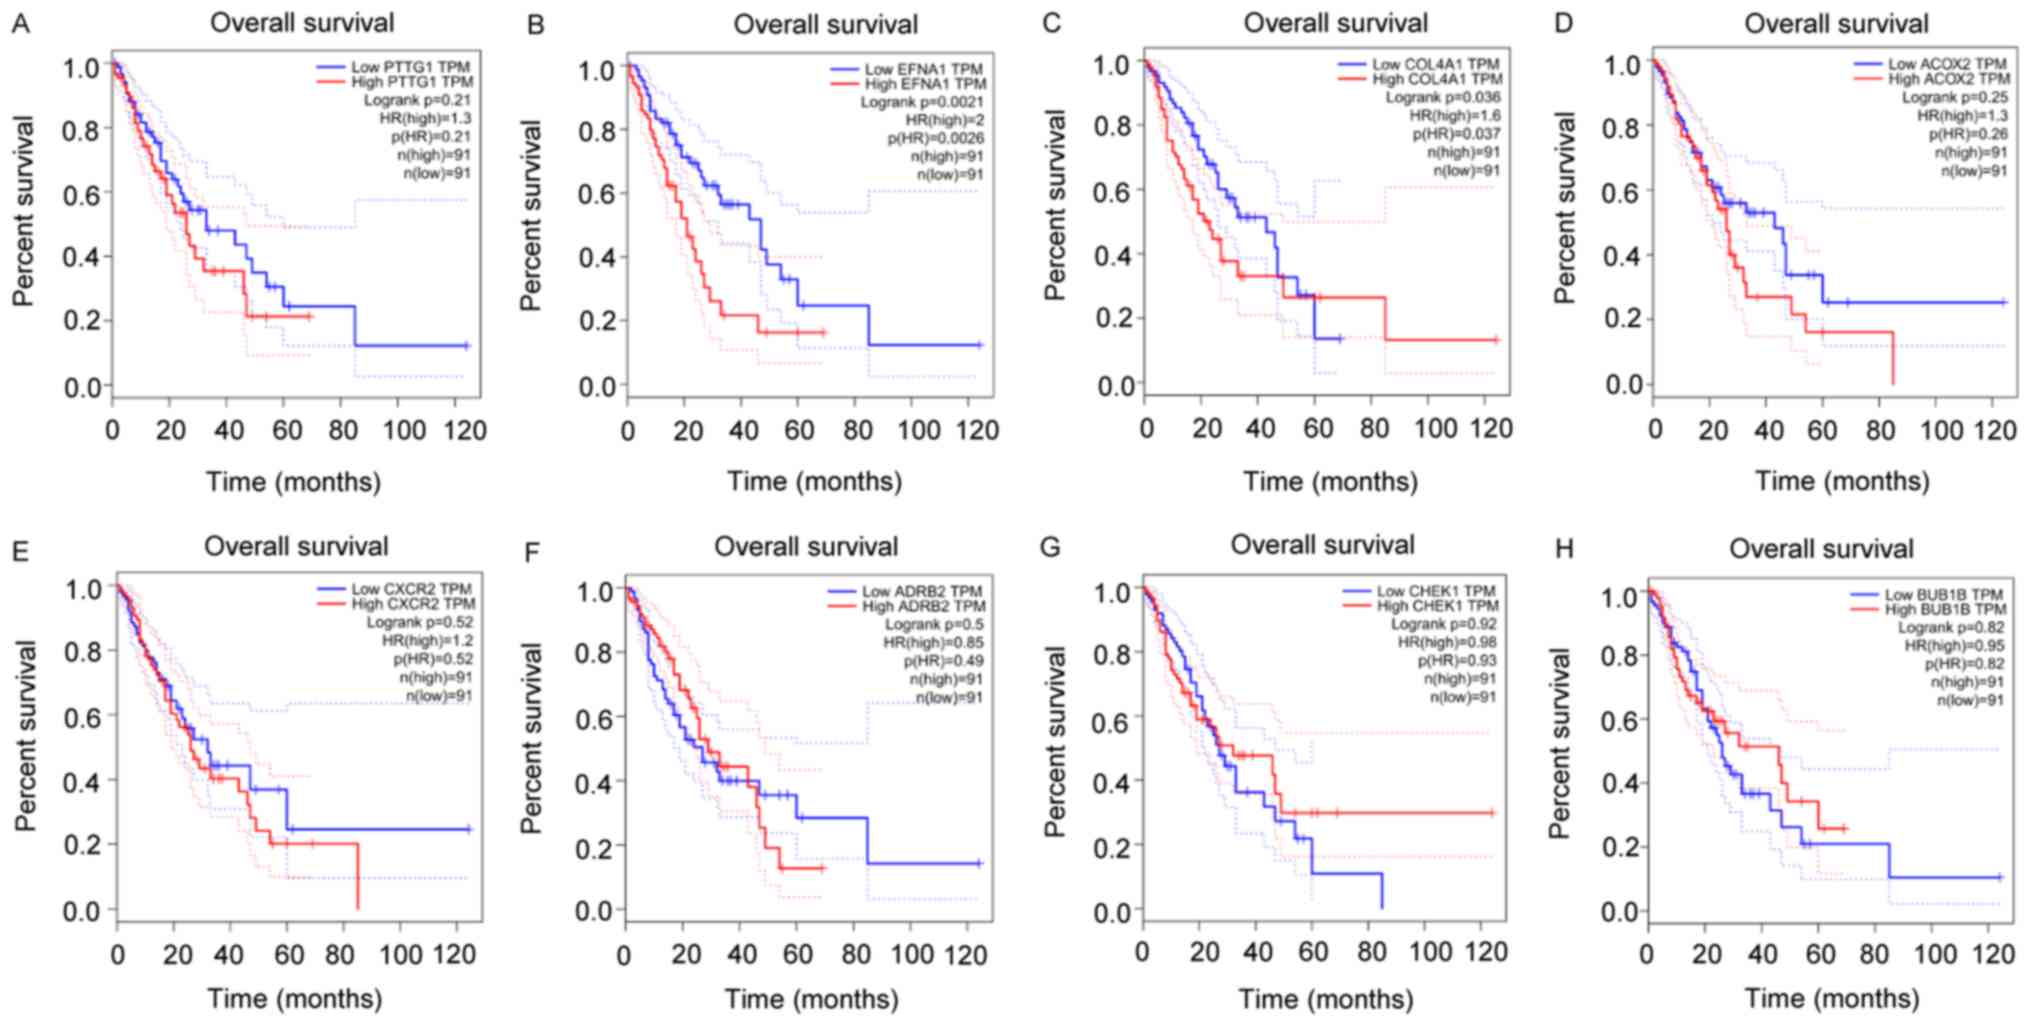
survival analysis. Through GEPIA analysis, ephrin-A1 (EFNA1) and
collagen type IV α1 (COL4A1) were expressed at high levels in ESCC
and were associated with a poor prognosis. The low expression of
C-X-C chemokine receptor 2 (CXCR2) was not statistically
significant.
Patients and samples
A total of 36 ESCC tissue samples and 35 normal
esophageal tissue samples were collected for the present study,
which had been surgically removed from Kazakh patients at the First
Affiliated Hospital of Shihezi University (Xinjiang, China) between
June 2018 to March 2019. The research protocol was approved by the
Medical Ethics and Human Clinical Trial Committee of Shihezi
University School of Medicine (Xinjiang, China) and all recruited
subjects were enrolled following the provision of written informed
consent. All surgical samples were used as residual specimens
following diagnostic sampling.
Immunohistochemistry (IHC)
A total of 36 esophageal cancer tissue samples and
35 normal samples from Kazakh patients were selected from
formalin-fixed and paraffin-embedded tissue chips. The sample
tissue chips, with a diameter of 0.6 mm, were obtained using
ALPHELYS. The tissue microarrays were heated in an oven at 65°C for
30 min, rehydrated with graded alcohols, immersed in
ethylenediaminetetraacetic acid buffer (pH 9.0) at 130°C, and
autoclaved in a microwave oven for 10 min. Following cooling to
30°C, the tissues were incubated at room temperature with 3%
H2O2 solution for 10 min. The tissue sections
were then incubated at 4°C with anti-securin antibody [also termed
anti-pituitary tumor transforming gene 1 (PTTG1) antibody, Bioss
antibodies, rabbit polyclonal, cat. no. bs-1881R, dilution 1:400]
overnight. The tissue sections were organized and washed in PBS
three times for 5 min each and then incubated with secondary
antibody [universal kit (mouse/rabbit polymer method detection
system), cat. no. PV6000, ZSGB, Ready-to-use antibody] at 37°C for
30 min. Diaminobenzidine (DAB) solution was used for 5 min at room
temperature and hematoxylin was used to counterstain the sections.
The IHC score was performed independently by two pathologists using
a light microscope (BX51; Olympus, Tokyo, Japan; magnification,
×400) according to the color intensity as either negative (score
0), weak (score 1), moderate (score 2) or strong (score 3), and
coloring area as negative (score 0), ≤10-25% (score 2), 25–50%
(score 3) or >50% (score 4). The final score was determined as
the coloring intensity multiplied by the coloring area. Scores 0–4
and 5–12 indicated low and high expression groups,
respectively.
Statistical analysis
Data were assessed using the SPSS (version 17.0;
SPSS, Inc.) statistical software package, and GraphPad Prism 5.0
(GraphPad Software, Inc.) was used to describe data. Comparisons of
the expression levels of proteins between the ESCC (n=36) and
normal tissues (n=35) were performed using the independent-samples
t-test and χ2 test. All data are presented as the mean ±
SD.
Results
DEG identification
The DEGs were detected using the GEO2R online
analytical tool with adjusted P<0.01 and |logFC|>1 as cut-off
criteria. A total of 928 DEGs were obtained between the ESCC and
normal samples, including 498 upregulated and 430 downregulated
genes. Eight core genes were selected on the basis of the degree of
connectivity and adjusted P-value (Table I), including checkpoint kinase 1
(CHEK1), BUB1B, PTTG1, COL4A1, CXCR2, adrenoreceptor β2 (ADRB2),
acyl-CoA oxidase 2 (ACOX2) and EFNA1. The top 50 DEGs are shown in
Table II (19 upregulated and 31
downregulated genes). Additionally, by setting |logFC|>2.5 and
adjusted P<0.01, 52 DEGs were selected, of which 30 and 22 were
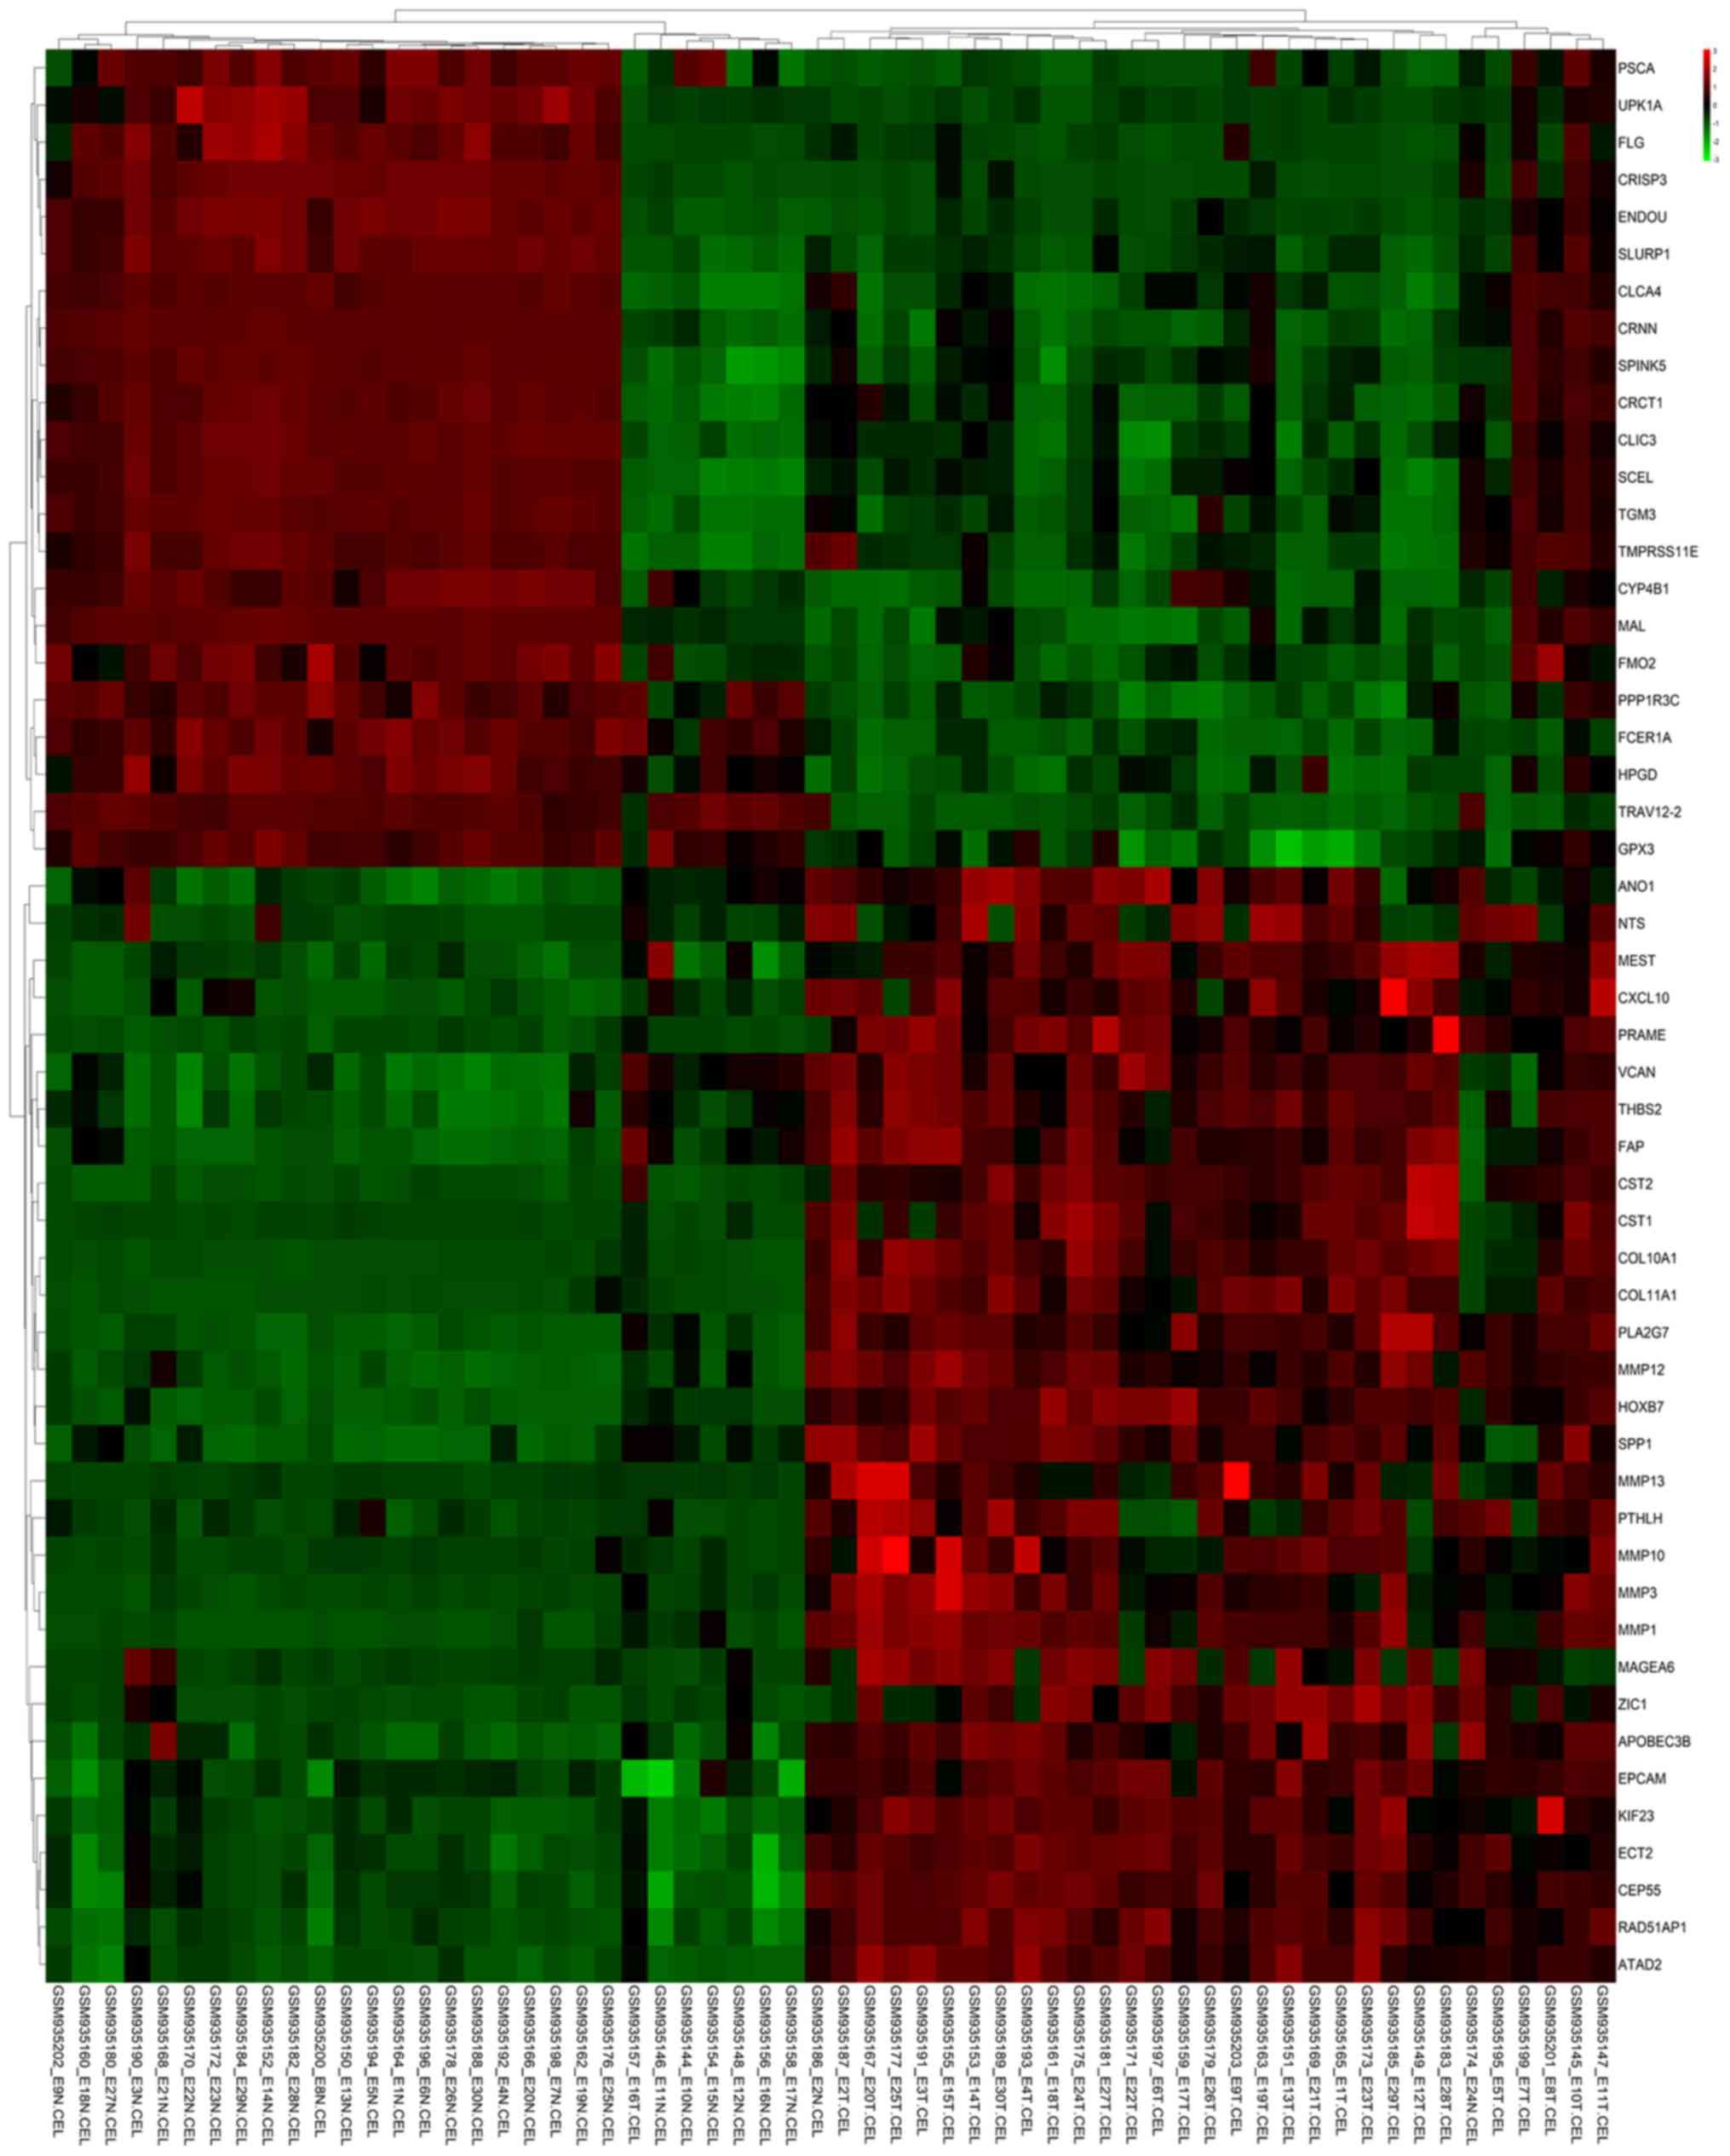
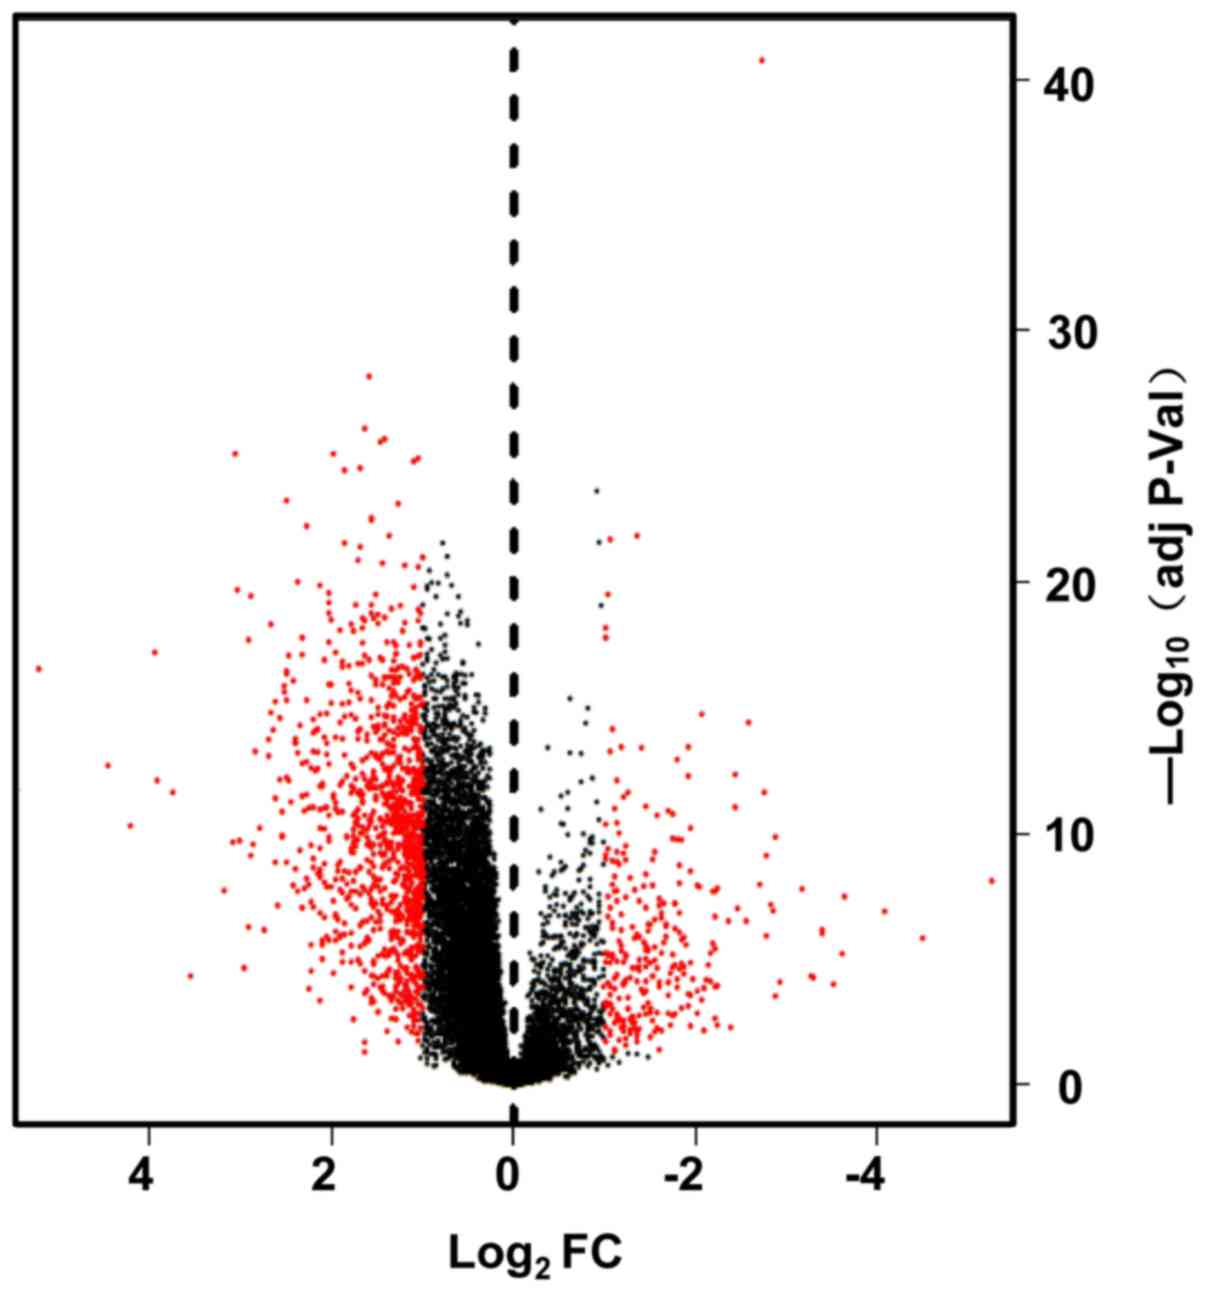
upregulated and downregulated, respectively. The heat maps and
volcano plots show the different DEG samples (Figs. 1 and 2). These volcano plots and heat maps
indicate all genes, and the top 52 DEGs, respectively.
| Table II.Top 50 DEGs, including 19 upregulated
and 31 downregulated genes. |
Table II.
Top 50 DEGs, including 19 upregulated
and 31 downregulated genes.
| ID | adj.P.Val | P-value | logFC | Gene |
|---|
| Downregulated |
| 207802_at | 2.95E-08 | 5.42E-10 | −5.38992228 | CRISP3 |
| 220090_at | 6.96E-06 | 4.36E-07 | −4.46587146 | CRNN |
| 204777_s_at | 1.29E-07 | 3.34E-09 | −4.3672882 | MAL |
| 220620_at | 8.69E-06 | 5.70E-07 | −3.9442306 | CRCT1 |
| 206004_at | 4.68E-06 | 2.68E-07 | −3.94095422 | TGM3 |
| 209613_s_at | 1.56E-08 | 2.40E-10 | −3.67537874 | ADH1B |
| 220026_at | 1.61E-04 | 1.80E-05 | −3.65426494 | CLCA4 |
| 214536_at | 1.05E-06 | 4.61E-08 | −3.56033721 | SLURP1 |
| 206884_s_at | 6.42E-05 | 6.13E-06 | −3.51463756 | SCEL |
| 219529_at | 3.15E-06 | 1.67E-07 | −3.47635301 | CLIC3 |
| 203914_x_at | 1.03E-09 | 7.43E-12 | −3.44800172 | HPGD |
| 206605_at | 1.49E-08 | 2.28E-10 | −3.43754016 | ENDOU |
| 215704_at | 7.39E-07 | 2.90E-08 | −3.37242552 | FLG |
| 213240_s_at | 3.44E-04 | 4.35E-05 | −3.31829107 | KRT4 |
| 205185_at | 1.44E-04 | 1.59E-05 | −3.20158834 | SPINK5 |
| 204284_at | 2.66E-10 | 1.34E-12 | −3.14636945 | PPP1R3C |
| 210096_at | 1.07E-07 | 2.68E-09 | −3.13376609 | CYP4B1 |
| 220431_at | 1.03E-04 | 1.08E-05 | −3.13073801 | TMPRSS11E |
| 207008_at | 1.15E-08 | 1.61E-10 | −3.11373209 | CXCR2 |
| 205783_at | 4.37E-05 | 3.91E-06 | −3.08906259 | KLK13 |
| 206199_at | 9.59E-06 | 6.39E-07 | −3.06841828 | CEACAM7 |
| 201348_at | 1.59E-11 | 2.07E-14 | −3.06249067 | GPX3 |
| 205767_at | 5.58E-08 | 1.22E-09 | −2.96580978 | EREG |
| 212681_at | 1.24E-11 | 1.40E-14 | −2.9062456 | EPB41L3 |
| 201325_s_at | 9.91E-08 | 2.46E-09 | −2.78110281 | EMP1 |
| 209365_s_at | 4.24E-07 | 1.47E-08 | −2.72959968 | ECM1 |
| 211726_s_at | 7.83E-06 | 5.04E-07 | −2.71946544 | FMO2 |
| 205319_at | 1.03E-06 | 4.47E-08 | −2.67917377 | PSCA |
| 211026_s_at | 4.92E-12 | 2.43E-15 | −2.61375129 | MGLL |
| 207980_s_at | 1.36E-10 | 5.35E-13 | −2.57860425 | CITED2 |
| 204614_at | 1.34E-03 | 2.18E-04 | −2.55597414 | SERPINB2 |
| Upregulated |
| 204620_s_at | 4.60E-08 | 9.68E-10 | 2.57111875 | VCAN |
| 212353_at | 8.15E-08 | 1.92E-09 | 2.57383841 | SULF1 |
| 204779_s_at | 2.10E-12 | 7.56E-16 | 2.57925018 | HOXB7 |
| 214612_x_at | 1.06E-03 | 1.66E-04 | 2.61538749 | MAGEA6 |
| 209942_x_at | 8.45E-04 | 1.27E-04 | 2.63065096 |
MAGEA6///MAGEA3 |
| 202859_x_at | 1.18E-06 | 5.33E-08 | 2.6515207 | CXCL8 |
| 205680_at | 3.82E-06 | 2.11E-07 | 2.72388472 | MMP10 |
| 206632_s_at | 1.86E-08 | 3.05E-10 | 2.77430412 | APOBEC3B |
| 204475_at | 1.12E-09 | 8.31E-12 | 4.8371858 | MMP1 |
| 202404_s_at | 1.57E-07 | 4.29E-09 | 2.84748214 | COL1A2 |
| 202310_s_at | 3.58E-08 | 6.90E-10 | 3.00373934 | COL1A1 |
| 206224_at | 1.58E-08 | 2.43E-10 | 3.04664986 | CST1 |
| 206291_at | 6.57E-04 | 9.38E-05 | 3.19271902 | NTS |
| 210809_s_at | 4.97E-07 | 1.78E-08 | 3.22856265 | POSTN |
| 205157_s_at | 3.12E-06 | 1.65E-07 | 3.32873111 | KRT17///JUP |
| 217428_s_at | 1.24E-11 | 1.47E-14 | 3.34429678 | COL10A1 |
| 204580_at | 2.92E-09 | 2.93E-11 | 3.47409534 | MMP12 |
| 37892_at | 4.08E-11 | 8.94E-14 | 4.18462587 | COL11A1 |
| 209875_s_at | 3.55E-10 | 1.94E-12 | 4.46479482 | SPP1 |
GO and KEGG pathway analyses of
DEGs
To appreciate the functions of the DEGs further,
DAVID (https://david.ncifcrf.gov/) was used to
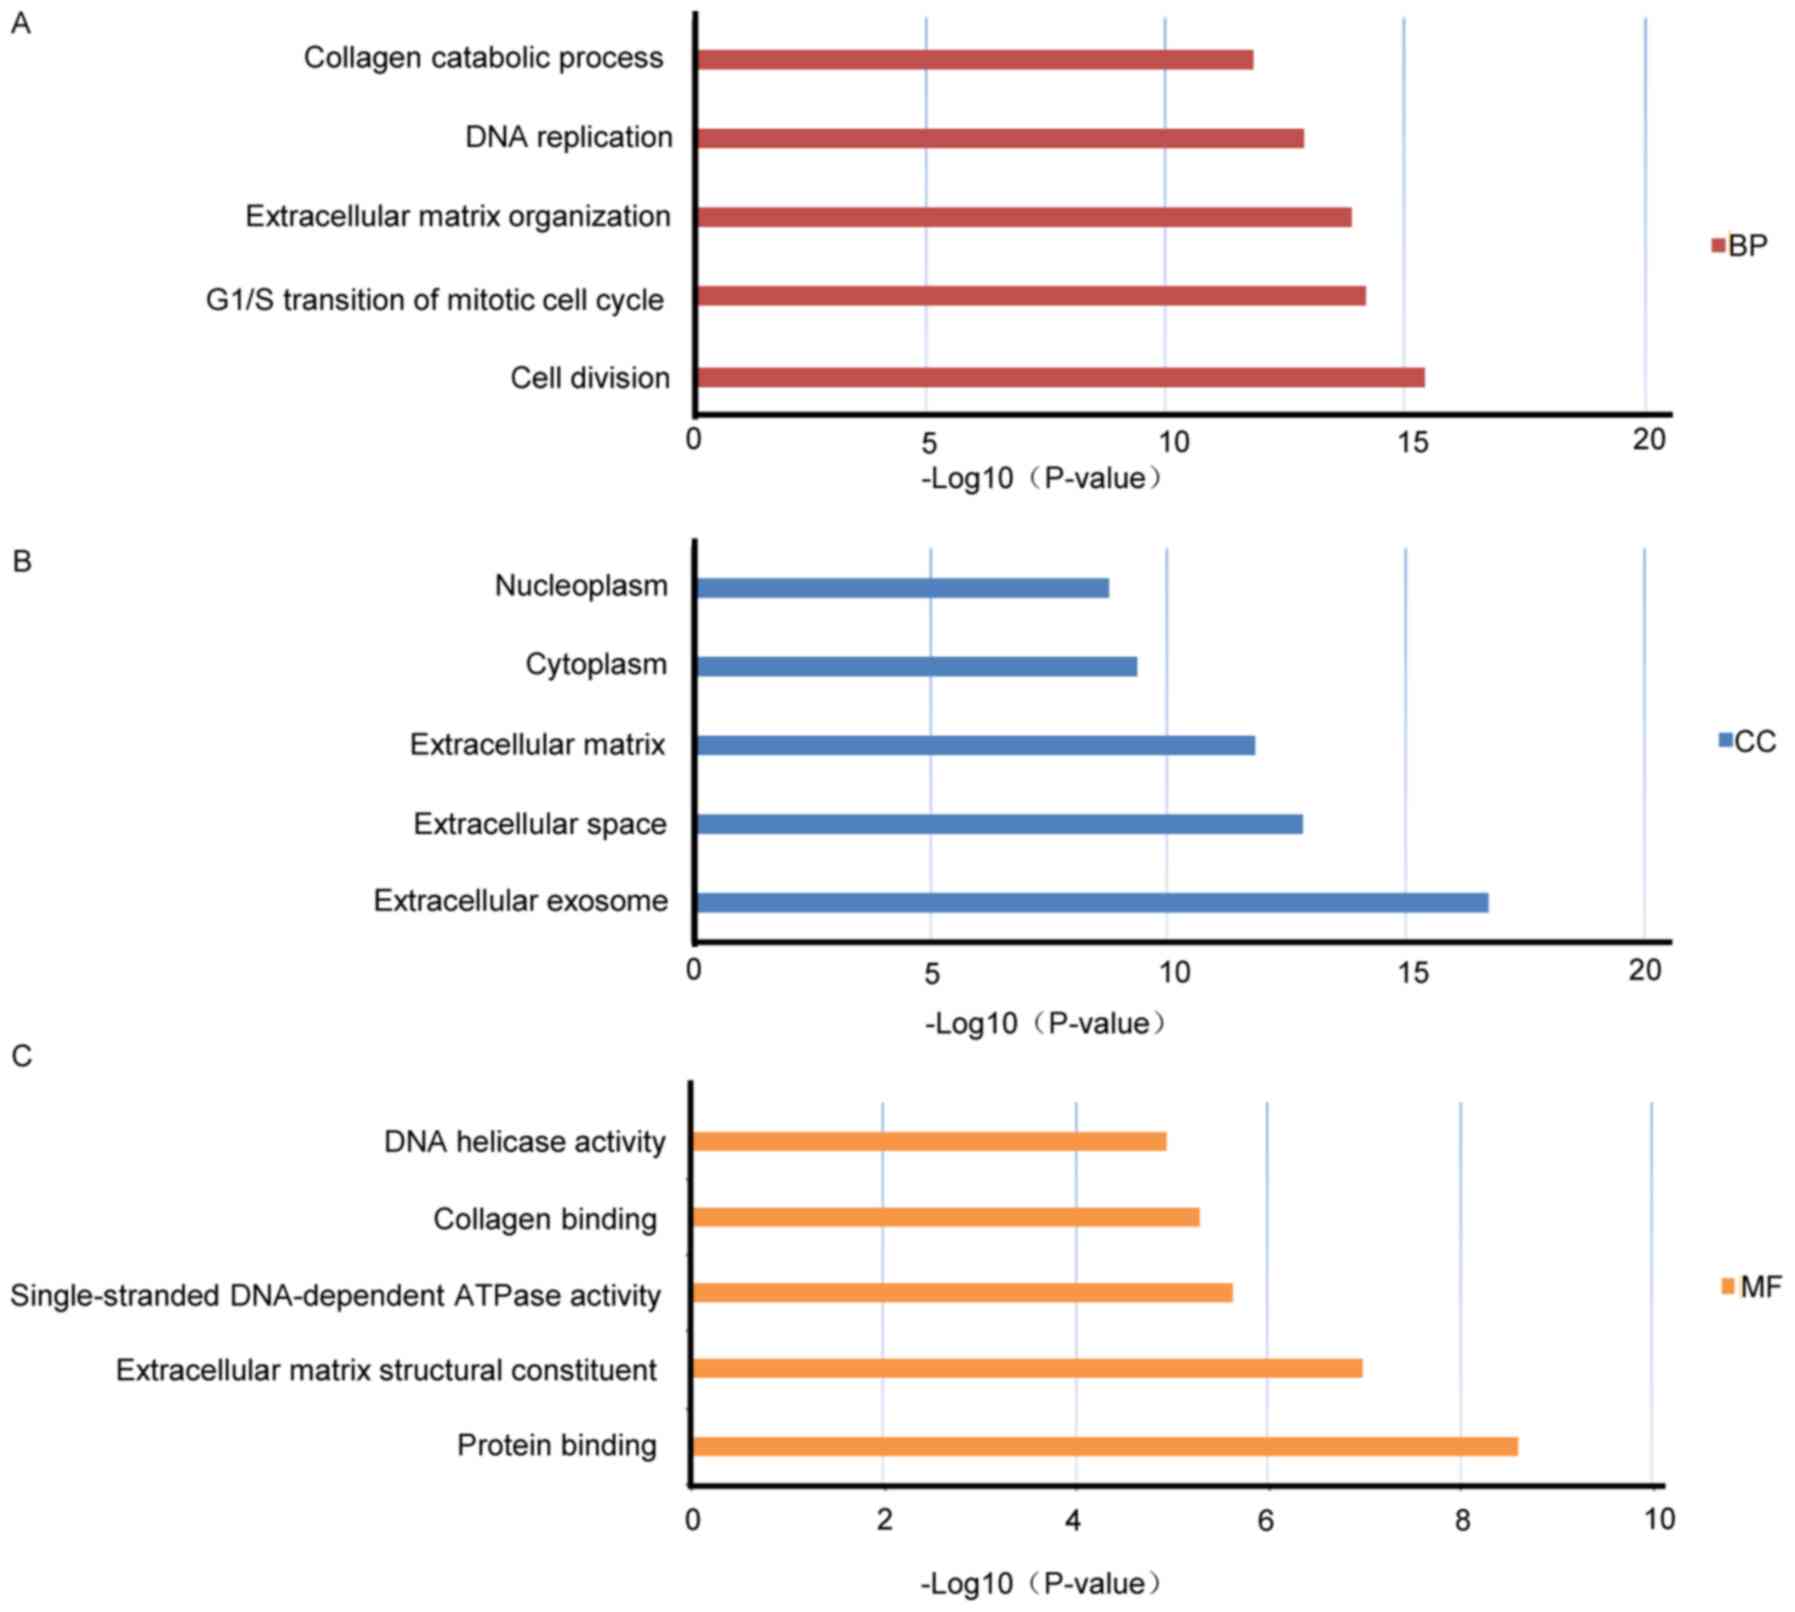
apply the GO function and KEGG pathway for enrichment analysis. The
BPs, CCs and MFs of the DEGs were annotated and classified by GO
analysis. The present study identified 39 GO terms on the basis of
the DEGs of modules with a false discovery rate (FDR) <0.05 and
count of >2 as thresholds and these terms were then sorted by
the P-value. The top five enriched GO terms for the BPs, CCs and
MFs were selected from the GO terms (Fig. 3 and Table III). The signaling pathways were
obtained through the KEGG database, and the major signaling
pathways included ‘cell cycle’, ‘ECM-receptor interaction’, ‘p53
signaling pathway’, ‘protein digestion and uptake’, ‘small cell
lung cancer’ and ‘proteoglycans in cancer’ (Table IV).
| Table III.Top five BPs, CCs and MFs in the
analysis of differentially expressed genes between ECSS and normal
tissues. |
Table III.
Top five BPs, CCs and MFs in the
analysis of differentially expressed genes between ECSS and normal
tissues.
| Term | Count | P-value | FDR | Functional
group |
|---|
| GO:0051301 cell
division | 59 | 4.21E-16 | 8.10E-13 | BP |
| GO:000008 G1/S
transition of mitotic cell cycle | 30 | 7.47E-15 | 1.36E-11 | BP |
| GO:0030198
Extracellular matrix organization | 41 | 1.50E-14 | 2.75E-11 | BP |
| GO:0006260 DNA
replication | 35 | 1.60E-13 | 2.93E-10 | BP |
| GO:0030574 collagen
catabolic process | 22 | 1.79E-12 | 3.28E-09 | BP |
| GO:0070062
extracellular exosome | 229 | 1.55E-17 | 2.27E-14 | CC |
| GO:0005615
extracellular space | 127 | 1.20E-13 | 1.76E-10 | CC |
| GO:0031012
extracellular matrix | 47 | 1.32E-12 | 1.93E-09 | CC |
| GO:0005737
cytoplasm | 333 | 3.71E-10 | 5.43E-07 | CC |
| GO:0005654
nucleoplasm | 199 | 1.59E-09 | 2.32E-06 | CC |
| GO:0005515 protein
binding |
515 | 2.55E-09 | 4.07E-06 | MF |
| GO:0005201
extracellular matrix structural constituent | 17 | 1.07E-07 | 1.71E-04 | MF |
| GO:0043142
single-stranded DNA-dependent | 7 | 2.46E-06 | 0.003918 | MF |
| ATPase
activity |
| GO:0005518 collagen
binding | 14 | 5.39E-06 | 0.008585 | MF |
| GO:0003678 DNA
helicase activity | 9 | 1.20E-05 | 0.019143 | MF |
| Table IV.KEGG pathway analysis of
differentially expressed genes. |
Table IV.
KEGG pathway analysis of
differentially expressed genes.
| Category | Term | Count | P-value | FDR |
|---|
| hsa04110 | Cell cycle | 29 |
3.86E-10 |
5.05E-07 |
| hsa03030 | DNA
replication | 16 |
4.92E-10 |
6.43E-07 |
| hsa04512: | ECM-receptor
interaction | 23 |
3.24E-09 |
4.24E-06 |
| hsa05146 | Amoebiasis | 19 |
3.94E-05 |
0.051506178 |
| hsa04974 | Protein digestion
and absorption | 17 |
4.48E-05 |
0.058547669 |
| hsa04510 | Focal adhesion | 28 |
6.69E-05 |
0.087469624 |
| hsa04115 | p53 signaling
pathway | 14 |
1.16E-04 |
0.151932901 |
| hsa05222 | Small cell lung
cancer | 14 |
0.001286708 |
1.670849429 |
| hsa03430 | Mismatch
repair | 7 |
0.001721063 |
2.229032091 |
| hsa05200 | Pathways in
cancer | 38 |
0.002816977 |
3.624393493 |
| hsa05202 | Transcriptional
misregulation in cancer | 19 |
0.009704623 |
11.98140955 |
| hsa04114 | Oocyte meiosis | 14 |
0.011336843 |
13.861154 |
| hsa04151 | PI3K-Akt signaling
pathway | 31 |
0.019748427 |
22.97410608 |
| hsa04972 | Pancreatic
secretion | 12 |
0.020140081 |
23.37588312 |
| hsa05144 | Malaria | 8 |
0.023512051 |
26.75579741 |
| hsa05205 | Proteoglycans in
cancer | 20 |
0.026031699 |
29.1909003 |
| hsa00590 | Arachidonic acid
metabolism | 9 |
0.027995297 |
31.03652764 |
| hsa04914 |
Progesterone-mediated oocyte
maturation | 11 |
0.031059516 |
33.82807896 |
| hsa05219 | Bladder cancer | 7 |
0.03140939 |
34.14009186 |
| hsa00410 | beta-Alanine
metabolism | 6 |
0.033090282 |
35.62023199 |
| hsa03320 | PPAR signaling
pathway | 9 |
0.041960173 |
42.93477387 |
| hsa00071 | Fatty acid
degradation | 7 |
0.042590557 |
43.42421223 |
PPI network construction and module
analysis
The STRING database was used to predict the
interaction between 928 DEGs (minimum required interaction score of
>0.7). To select important modules in the PPI network, the MCODE
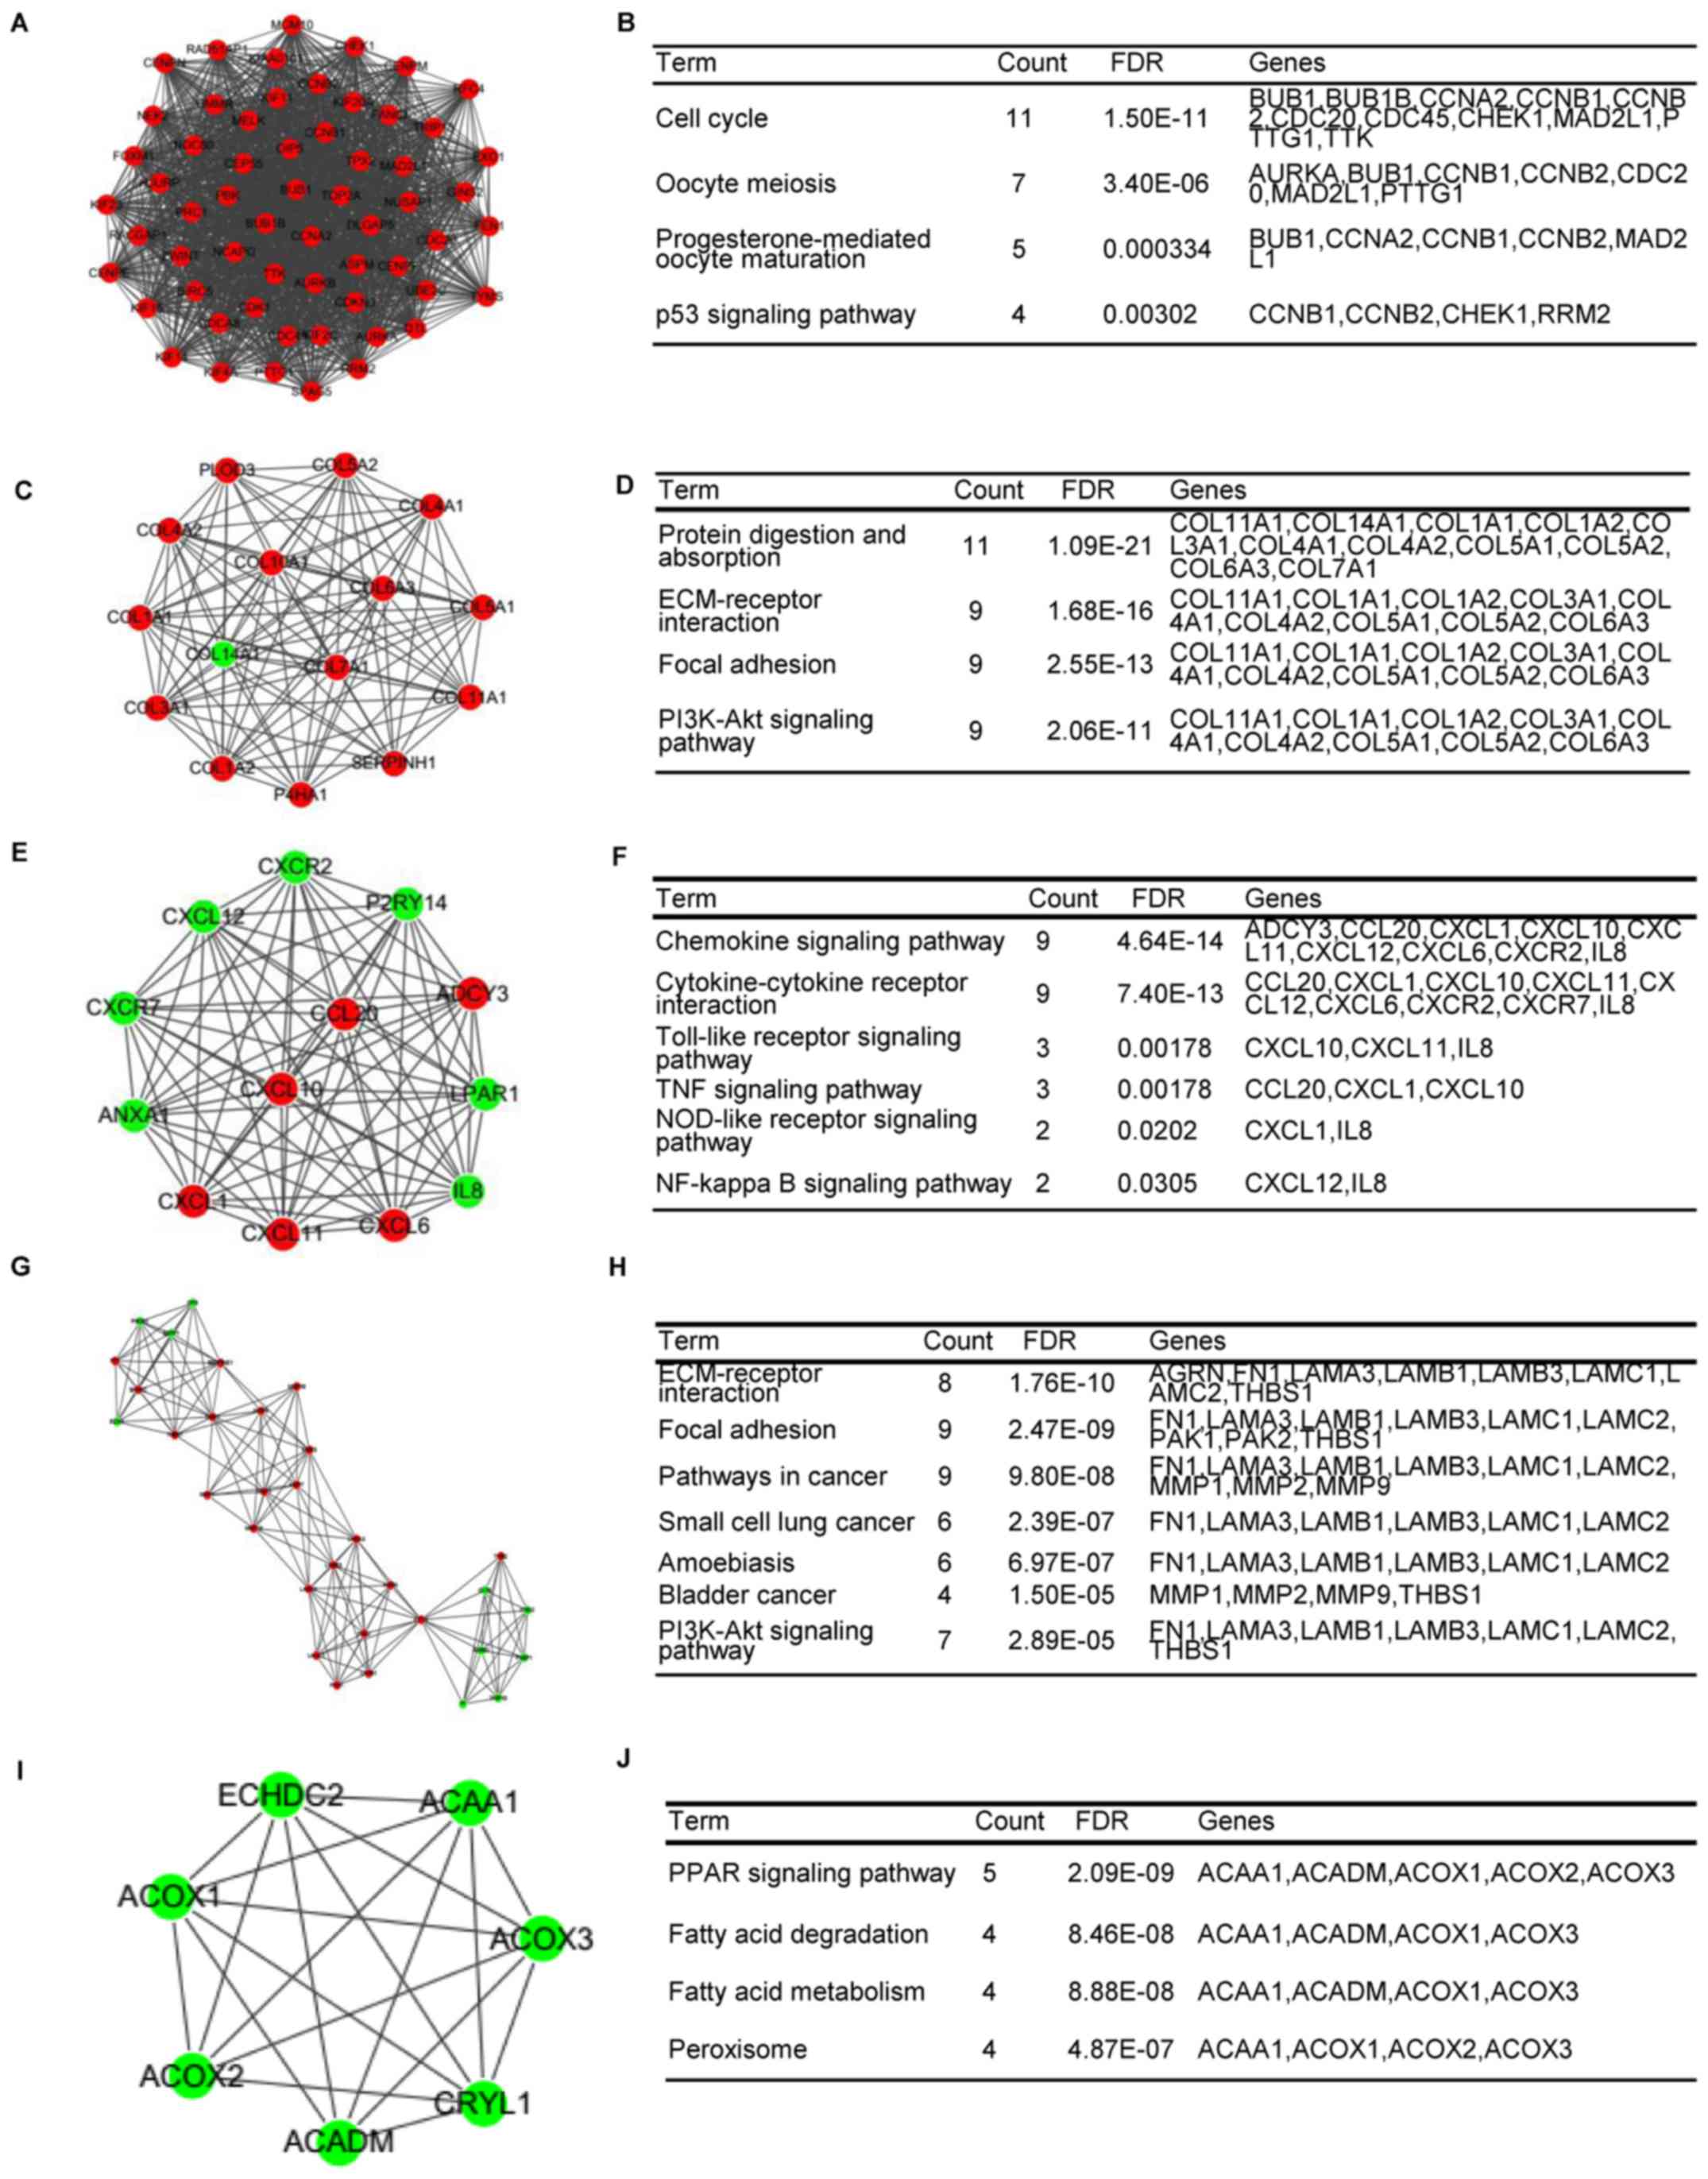
plug-in was used and 25 modules were found. The top five modules
were also selected for further analysis, which included 60, 15, 13,
32 and 7 genes (Table V). The DEGs
in the top five modules were also enriched in important pathways
(Fig. 4A-J). Module A had 60 nodes
and 1,643 interactions, and all of the DEGs were upregulated in
this module. The genes in this module, including CHEK1, cyclin A2
(CCNA2) and TTK, were considerably enriched in the cell cycle and
p53 signaling pathway-related functions (Fig. 4B).
| Table V.Modules of networks. |
Table V.
Modules of networks.
| Module name | Nodes | Edges | Cluster scores |
|---|
| A | 60 | 1643 | 55.695 |
| B | 15 | 102 | 14.571 |
| C | 13 | 78 | 13.000 |
| D | 32 | 144 | 9.290 |
| E | 7 | 20 | 6.667 |
Survival analysis
Gene expression and survival analyses were performed
by GEPIA in the TCGA database. The resulting box plots (Fig. 5A-H) showed that EFNA1 and COL4A1
were expressed at a high level in ESCC (Fig. 5B and C), whereas the expression of
CXCR2 was low in ESCC (Fig. 5E).
Survival analysis (Fig. 6A-H)
further showed that EFNA1 and COL4A1 were associated with poor
prognosis and exhibited statistically significant differences
(Fig. 6B and C).
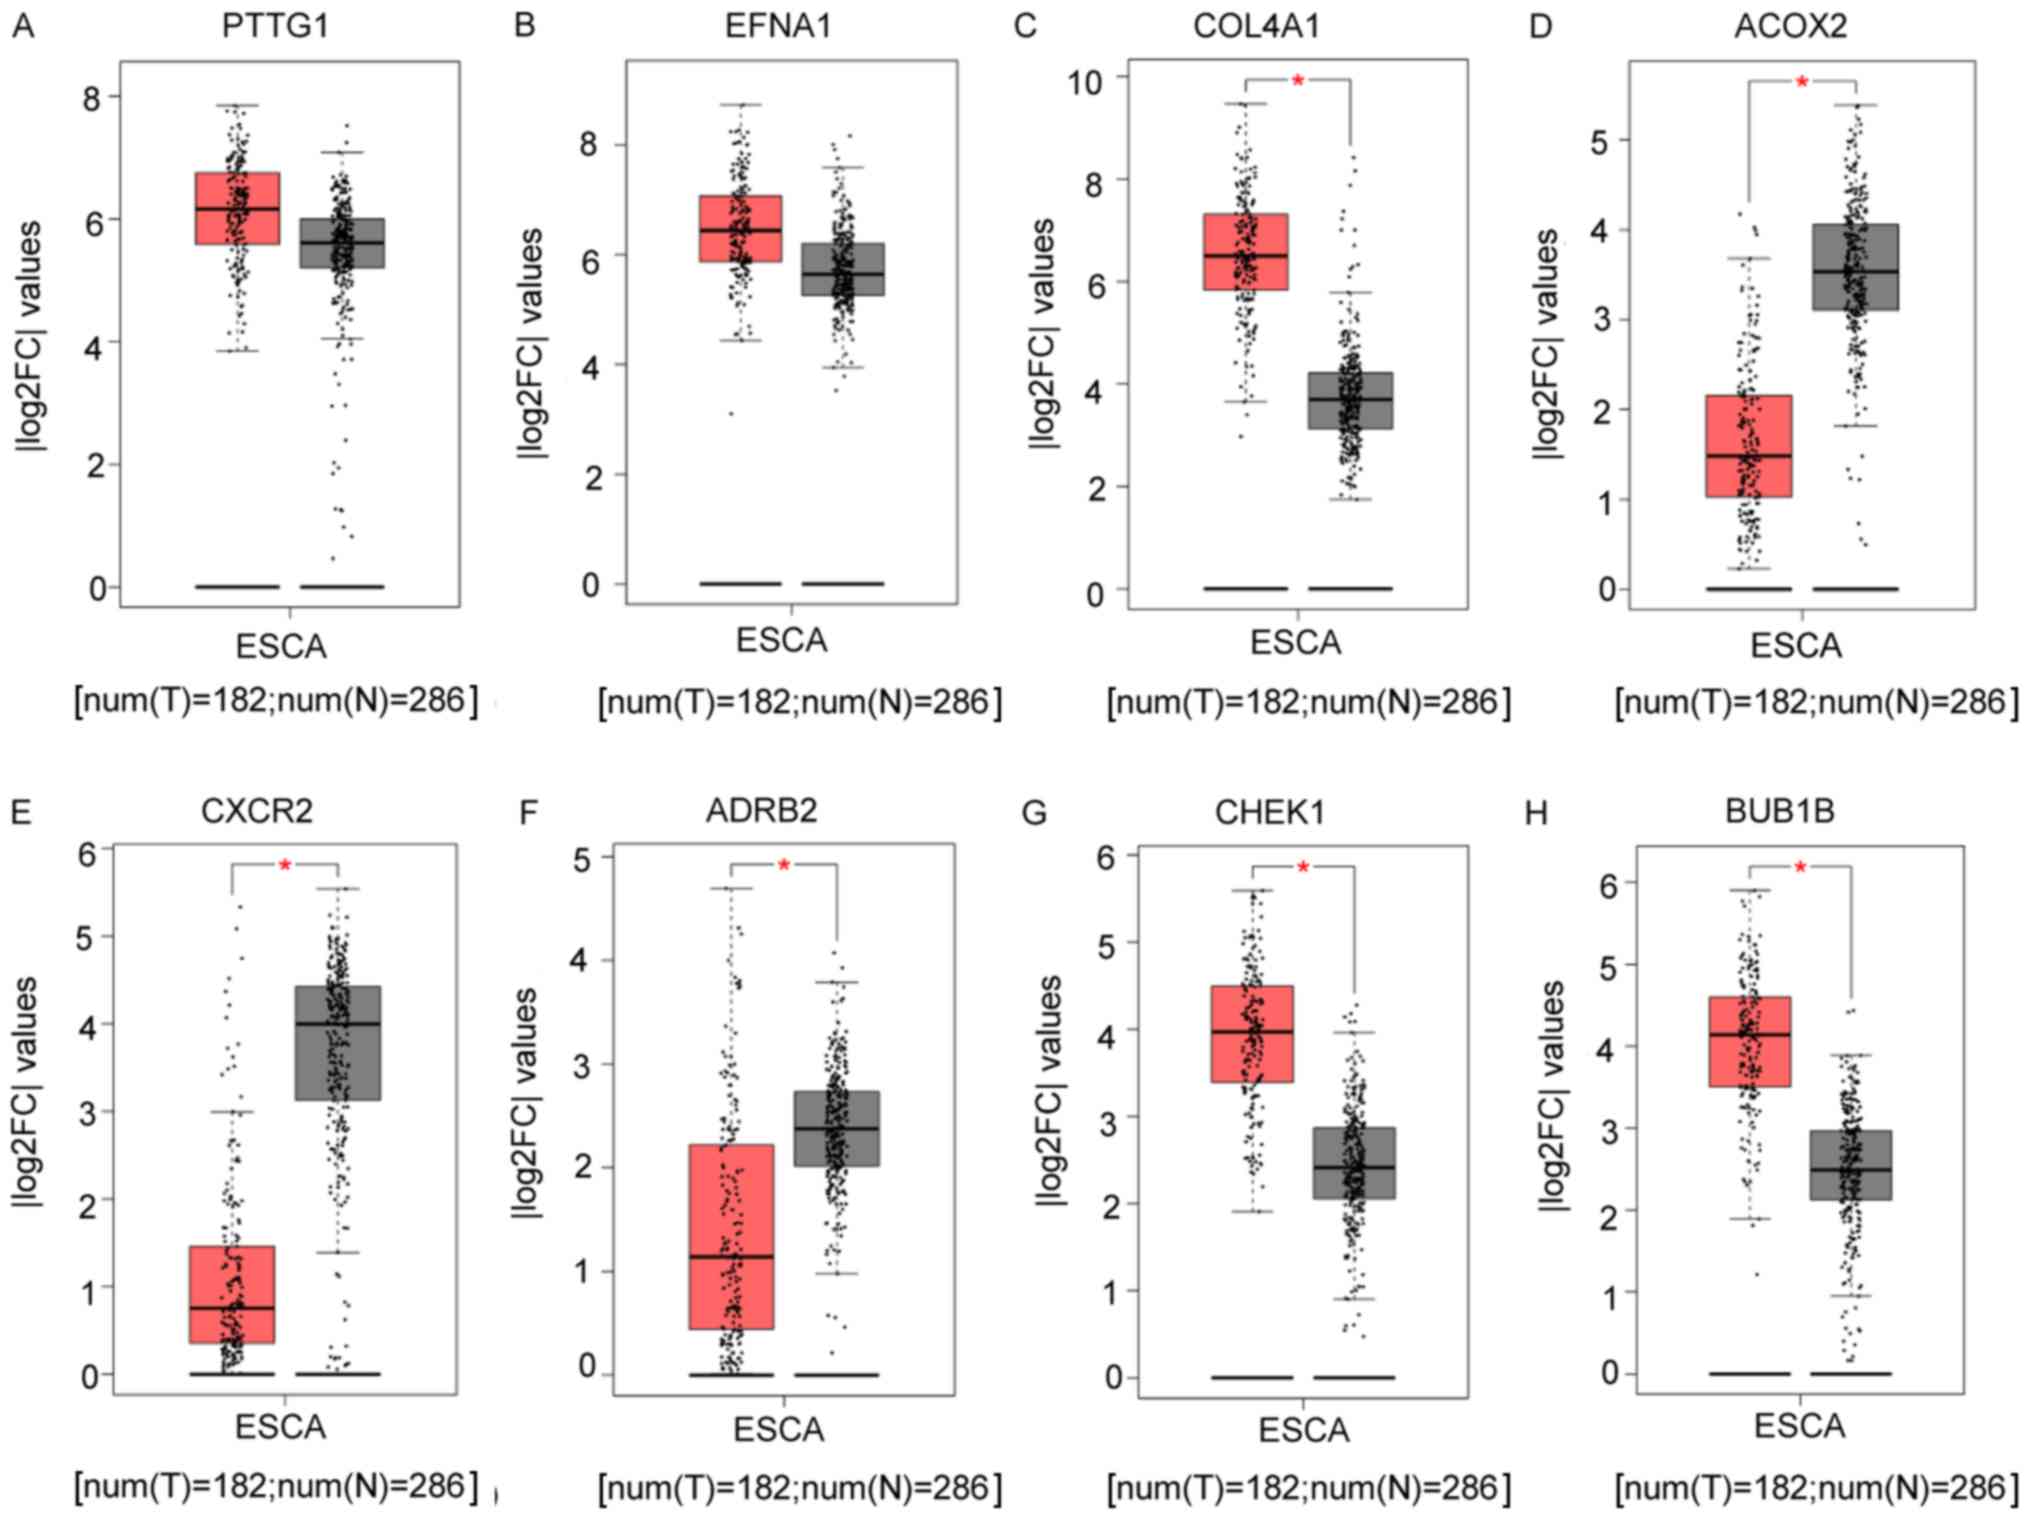 | Figure 5.Box plots of ESCC and normal tissue
expression levels in The Cancer Genome Atlas database. Box plots
indicate the expression of different genes in tumor and normal
tissues. The expression levels of (A) PTTG1 and (B) EFNA1 in ESCC
tissues were higher than those in normal tissues, although there
was no statistical significance. (C) COL4A1, (D) ACOX2, (E) CXCR2,
(F) ADRB2, (G) CHEK1 and (H) BUB1B exhibited statistically
significant differences. *P<0.05 between ESCC and normal
tissues. ESCC tissues are shown in red, normal tissues are shown in
black. Y-axis: |log2FC| cut-off. X-axis: num (T)=182, num (N)=286.
ESCC, esophageal squamous cell carcinoma; FC, fold-change; T,
tumor; N, normal tissues. |
IHC features
According to the degree of connectivity and adjusted
P-value, eight core genes were selected (Table I), among which the most strongly
correlated genes were CHEK1 (degree of connectivity=88, adjusted
P=1.64E-08), BUB1B (degree of connectivity=84, adjusted
P=2.10E-08), PTTG1 (degree of connectivity=64, adjusted
P=1.62E-04), COL4A1 (degree of connectivity=16, adjusted
P=2.26E-04), and CXCR2 (degree of connectivity=15, adjusted
P=1.15E-08). No significant prognostic significance was found for
CHEK1 or BUB1B (Fig. 6G and H).
Relevant references were also reviewed and it was found that PTTG1
is an oncogene that is overexpressed in several tumors. The high
expression of PTTG1 also exhibited a relatively poor prognosis
through GEPIA survival analysis (Fig.
6A). Therefore, PTTG1 was selected for IHC analysis. IHC was
used to detect the expression of PTTG1 in 36 ESCC tissue samples
and 35 normal tissue samples of the Kazakh patients. The results
showed that the expression of PTTG1 (Fig. 7A and B) in esophageal cancer
tissues was significantly higher than that in normal tissues, and
the difference was statistically significant (P=0.002). In
addition, the PTTG1 IHC staining scores in the ESCC and normal
tissues were compared using independent-samples t-test analysis,
and the difference was statistically significant (P<0.001;
Fig. 7C).
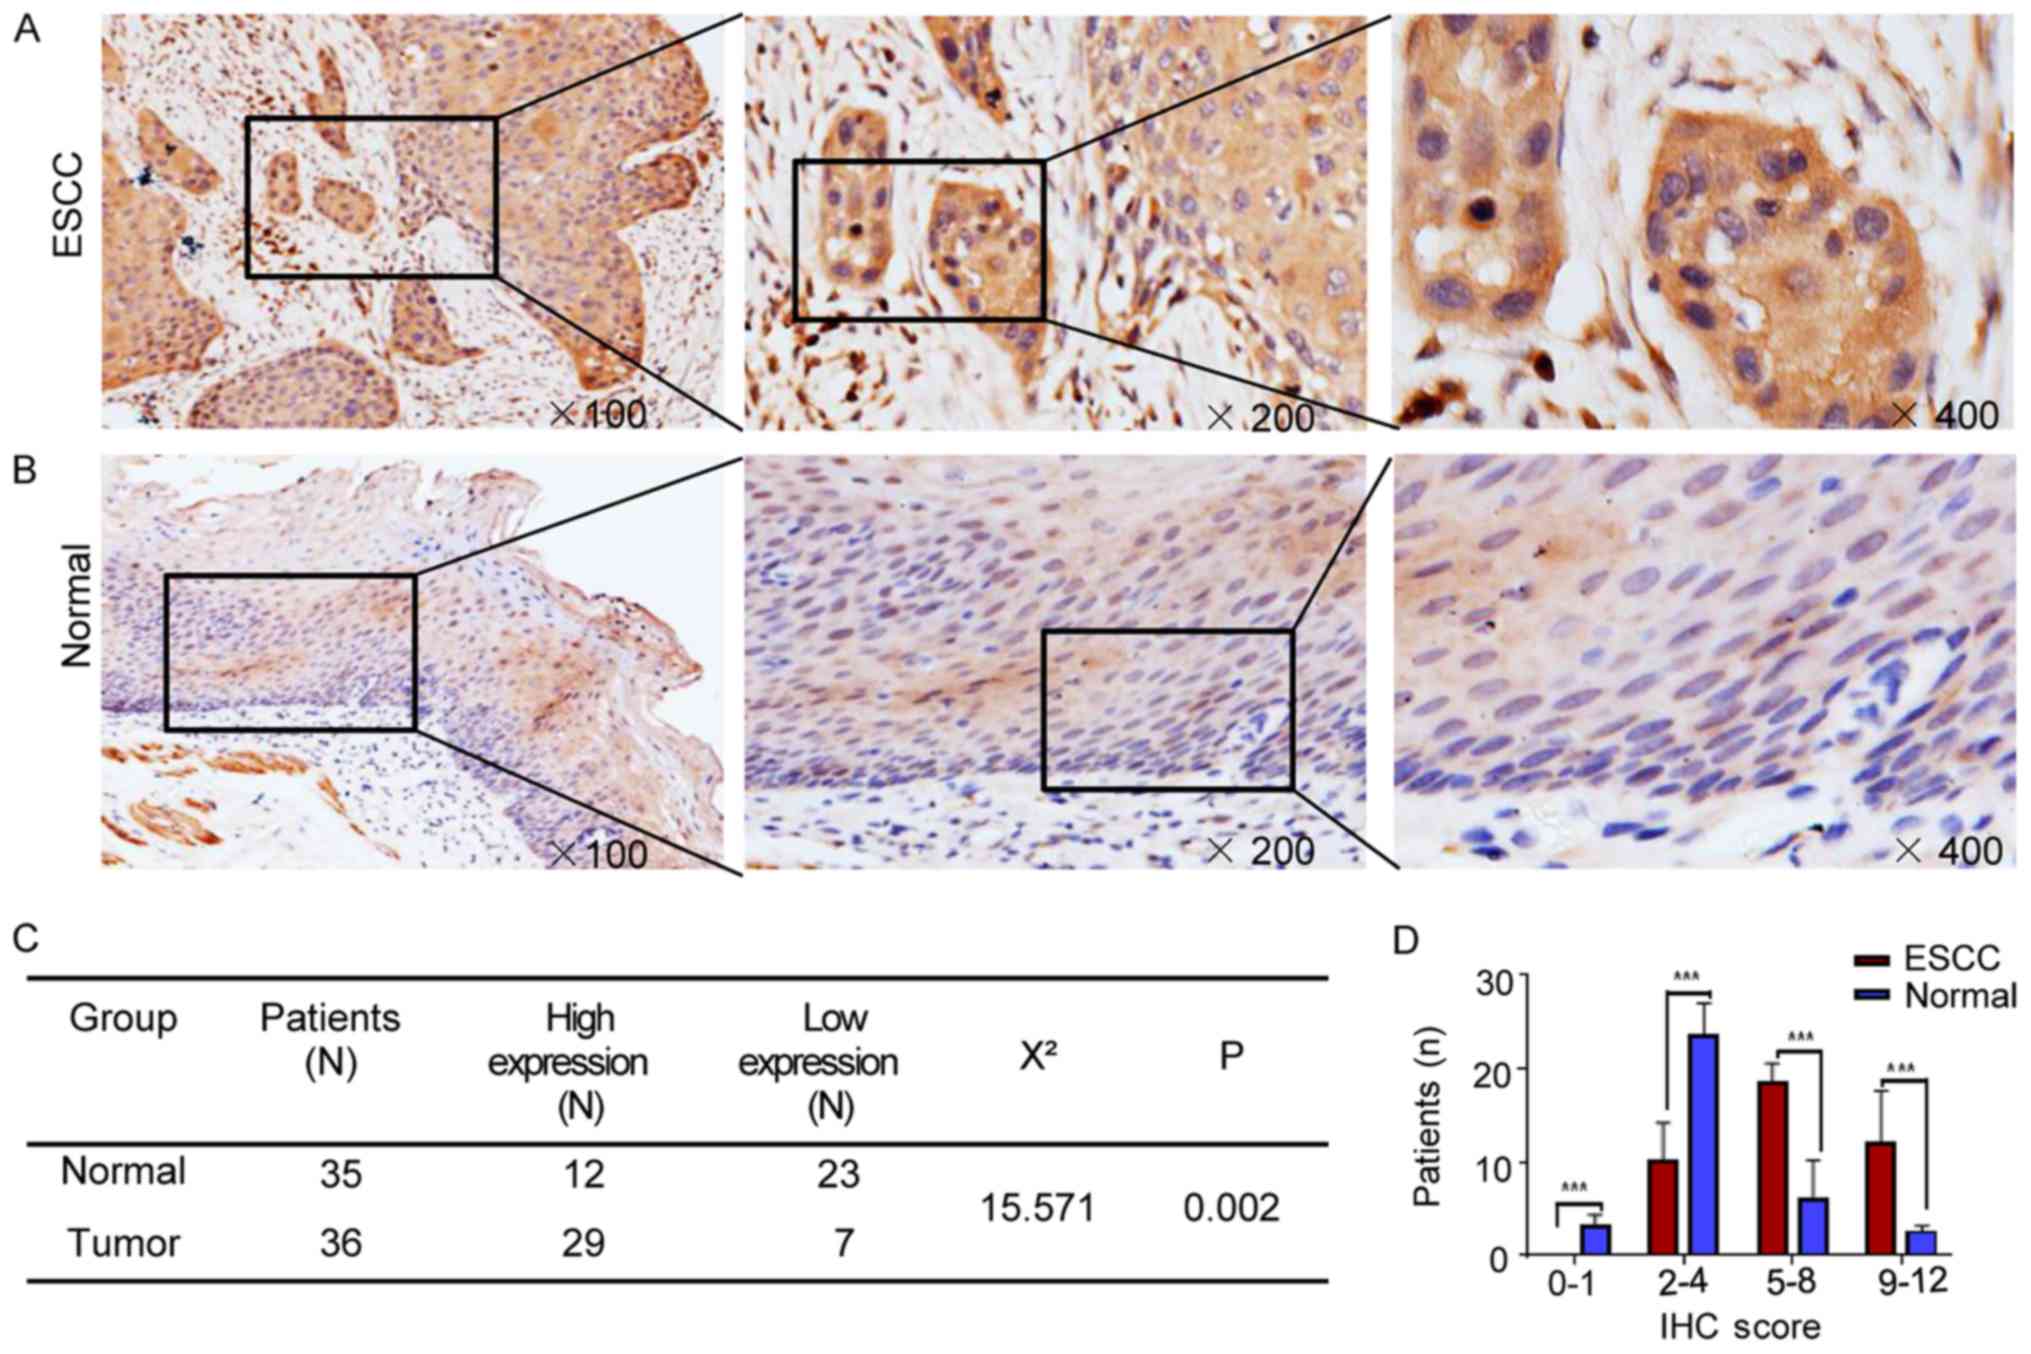 | Figure 7.Protein expression of PTTG1 in ESCC
and normal tissues. (A) Expression of PTTG1 in ESCC, cytoplasmic
staining (magnification, ×100, ×200, ×400). (B) Expression of PTTG1
in normal tissues, cytoplasmic staining (magnification, ×100, ×200,
×400). (C) Expression of PTTG1 in ESCC tissues (n=36) was
significantly higher than that in normal tissues (n=35), and the
difference was statistically significant (P=0.002). (D) PTTG1 IHC
staining score in ESCC and normal tissues using independent-samples
t-test analysis; each bar represents the mean ± SD. ***P<0.001.
ESCC, esophageal squamous cell carcinoma; IHC,
immunohistochemistry. |
Discussion
ESCC is a digestive tract tumor, is the fourth
highest cause of cancer-associated mortality and is one of the most
aggressive malignancies in China (17). In the present study, the online
GEO2R tool was used between ESCC and normal samples to detect 928
DEGs, including 498 upregulated and 430 downregulated genes. Using
several bioinformatics tools, the DEGs were found to be mainly
related to cell cycle, DNA replication and ECM-receptor
interactions. A PPI network of the DEGs was also constructed, and
the first five modules were selected for further analysis. All the
genes enriched in module 1, including BUB1B, CCNA2, CHEK1, BUB1,
CCNB1 and CCNB2, were upregulated. These genes were mainly related
to cell cycle, progesterone-mediated oocyte, and the p53 signaling
pathway. The COL family of genes was mainly enriched in module 2,
including COL11A1, COL1A1, COL1A2, COL5A1, COL5A2 and COL6A3, which
was involved in the ECM-receptor interaction and PI3K-Akt signaling
pathways. EFNA1 and COL4A1 were also associated with the prognosis
of patients with ESCC.
EFNA1 is an angiogenic factor. EFNA1 was originally
separated from human umbilical vein endothelial cells as a
secretory protein and treated with tumor necrosis factor-α. Tumor
necrosis factor-α-induced (18)
EFNA1 and its receptor, Eph receptor 2, are associated with various
types of cancer, including bladder cancer (19) and gastric cancer (20). High expression of EFNA1 is also
involved in colorectal cancer (21) and its low expression is associated
with a poor prognosis in clear cell renal cell carcinoma (22). High expression of COL4A1 is
associated with advanced tumors and poor OS and disease-free
survival in patients with HCC (23). COL4A1 knockdown decreases cell
viability and cell cycle in breast cancer cells (24). Therefore, EFNA1 and COL4A1 may be
associated with the prognosis of esophageal cancer. The GEPIA
database in the TCGA was used in the present study for the survival
analysis and it was found that EFNA1 and COL4A1 were associated
with a poor prognosis in ESCC.
The cell cycle is a process in which a cell
completely divides, including interphase and division phases. The
mechanism of cell cycle disorder in any condition causes the
development of cancer, as cancer is closely associated with cell
proliferation and growth (25). An
important hallmark of cancer is uncontrolled cell proliferation.
Tumor cells generally exhibit damage to genes that directly
regulate cell cycle (26). In the
present study, several DEGs were enriched in the cell cycle. COL1A1
and COL1A2 encode the α1 and α2 chains of type I collagen,
respectively (27). The cell
adhesion molecule COL1A1 is expressed at a high level in ESCC,
which is essential for ESCC carcinogenesis (28). CHEK1 is also type of protein-coding
gene. The protein encoded by CHEK1 belongs to the Ser/Thr protein
kinase family. Checkpoints that mediate cell cycle arrest require
the presence of DNA damage or unreplicated DNA. The high
cytoplasmic expression of phosphorylated CHEK1 was associated with
the poor prognosis of breast cancer (29) and also exhibited high expression in
ovarian and oral squamous cell carcinoma (30,31).
Therefore, the targeted regulation of CHEK1 may become a novel
method for cancer treatment.
PTTG1 is an oncogene that is overexpressed in
several tumor types. The expression of PTTG1 is high in bladder
cancer. PTTG1 knockdown significantly inhibits bladder cancer cell
migration, invasion, metastasis and growth, and induces G0/G1 phase
senescence and cell cycle arrest (32). Feng et al (33) reported that PTTG1, via activating
the expression of GLI1 in ESCC, was involved in the
epithelial-mesenchymal transformation (EMT) process, and promoted
the metastasis in ESCC cell lines and tissues by inducing EMT.
Particularly in cells with lymph node metastasis. TTK, also
referred to as Mps1, is overexpressed in human pancreatic cancer
and primary liver cancer (34,35).
BUB1B, which is a mitotic checkpoint serine/threonine kinase B, is
a member of the spindle assembly checkpoint protein family and is
involved in various types of cancer. The expression of BUB1B is
high in prostate cancer and associated with poor prognosis
(36). BUB1B is also expressed at
a high level in lung adenocarcinoma, and the overexpression of
BUB1B is associated with poor disease progression and poor survival
rates in patients with lung adenocarcinoma (37). Certain transcription factors can
regulate ESCC cancer cell cycle by regulating BUB1B, which is a
cell cycle-related DEG, thereby promoting the development of ESCC
(38). Therefore, BUB1B may
promote the development of ESCC by deregulating the cell cycle.
The present study identified DEGs through
bioinformatics analysis, some of which may serve an important role
in the development, progression and prognosis of ESCC. CHEK1 and
BUB1B are primarily related to the cell cycle, and COL5A1, COL11A1
and COL1A1 are related to the main ECM-receptor interaction
pathway. Through KEGG analysis, these differentially expressed
genes were mainly related to cell cycle and ECM receptors. CHEK1,
BUB1B, COL5A1, PTTG1, TTK and COL1A1 have also been associated with
the development of various types of cancer. EFNA1 and COL4A1 were
associated with the prognosis of ESCC. The IHC results showed that
the expression of PTTG1 in ESCC tissues was significantly higher
than that in normal esophageal tissues, with statistical
significance. However, the present study used mostly consultation
cases from the People's Hospital of Xinjiang Uyghur Autonomous
Region, and the Xinjiang Yili Prefecture Friendship Hospital; ESCC
fresh samples are difficult to obtain due to the lack of patients
in this region, therefore, it is difficult to collect proteins for
further analysis. In future research, when additional fresh tissue
samples are collected, reverse transcription-PCR and western blot
analyses will be performed for the validation of these identified
target genes in clinical samples. In conclusion, the genes
identified may serve an important role in the occurrence and
prognosis of ESCC. However, their mechanism in ESCC requires
further investigation.
Supplementary Material
Supporting Data
Acknowledgements
Not applicable.
Funding
This study was supported by grants from the National
Natural Science Foundation of China (grant nos. 81460362, 81773116,
81760436, 81560399 and 81360358), the Medical And Health Science
And Technology Project Of Suzhou High Tech Zone (grant no.
2017Z006), the Applied Basic Research Projects of Xinjiang
Production and Construction Corps (grant no. 2016AG020), the Major
Science And Technology Projects of Shihezi University (grant no.
gxjs2014-zdgg06), the High-Level Talent Project of Shihezi
University (grant no. RCZX201533) and the Foundation for
Distinguished Young Scholars of Shihezi University (grant no.
2015ZRKXJQ02). The funders were not involved in the study design,
data collection and analysis, decision to publish, or preparation
of the manuscript.
Availability of data and materials
The datasets analyzed in the present study are
available from the GEO repository (https://www.ncbi.nlm.nih.gov/geo/query/acc.cgi?acc=GSE38129).
Authors' contributions
XBC and FFC conceived and designed the study. YZC,
HP and SRZ collected the expression data and screened for the
differentially expressed genes. FFC and HP analyzed and interpreted
the data. FFC wrote the manuscript. XBC and YZC reviewed and edited
the manuscript. All authors read and approved the final
manuscript.
Ethics approval and consent to
participate
The present study was approved by the Medical Ethics
and Human Clinical Trial Committee of Shihezi University School of
Medicine, and all recruited subjects were enrolled following the
provision of written informed consent.
Patient consent for publication
Not applicable.
Competing interests
The authors declare that they have no competing
interests.
References
|
1
|
Torre LA, Bray F, Siegel RL, Ferlay J,
Lortet-Tieulent J and Jemal A: Global cancer statistics, 2012. CA
Cancer J Clin. 65:87–108. 2015. View Article : Google Scholar : PubMed/NCBI
|
|
2
|
Cui XB, Zhang SM, Xu YX, Dang HW, Liu CX,
Wang LH, Yang L, Hu JM, Liang WH, Jiang JF, et al: PFN2, a novel
marker of unfavorable prognosis, is a potential therapeutic target
involved in esophageal squamous cell carcinoma. J Transl Med.
14:1372016. View Article : Google Scholar : PubMed/NCBI
|
|
3
|
Ma S, Bao JY, Kwan PS, Chan YP, Tong CM,
Fu L, Zhang N, Tong AH, Qin YR, Tsao SW, et al: Identification of
PTK6, via RNA sequencing analysis, as a suppressor of esophageal
squamous cell carcinoma. Gastroenterology. 143:675–686 e612. 2012.
View Article : Google Scholar : PubMed/NCBI
|
|
4
|
Zhang J, Li S, Shang Z, Lin S, Gao P,
Zhang Y, Hou S, Mo S, Cao W, Dong Z, et al: Targeting the
overexpressed ROC1 induces G2 cell cycle arrest and apoptosis in
esophageal cancer cells. Oncotarget. 8:29125–29137. 2017.PubMed/NCBI
|
|
5
|
Hers I, Vincent EE and Tavare JM: Akt
signalling in health and disease. Cell Signal. 23:1515–1527. 2011.
View Article : Google Scholar : PubMed/NCBI
|
|
6
|
Durán-Prado M, Gahete MD, Hergueta-Redondo
M, Martínez-Fuentes AJ, Cordóba-Chacón J, Palacios J,
Gracia-Navarro F, Moreno-Bueno G, Malagón MM, Luque RM and Castaño
JP: The new truncated somatostatin receptor variant sst5TMD4 is
associated to poor prognosis in breast cancer and increases
malignancy in MCF-7 cells. Oncogene. 31:2049–2061. 2012. View Article : Google Scholar : PubMed/NCBI
|
|
7
|
Wang J, Lu Y, Wang J, Koch AE, Zhang J and
Taichman RS: CXCR6 induces prostate cancer progression by the
AKT/mammalian target of rapamycin signaling pathway. Cancer Res.
68:10367–10376. 2008. View Article : Google Scholar : PubMed/NCBI
|
|
8
|
Matsuoka T and Yashiro M: The role of
PI3K/Akt/mTOR signaling in gastric carcinoma. Cancers (Basel).
6:1441–1463. 2014. View Article : Google Scholar : PubMed/NCBI
|
|
9
|
Okawa T, Michaylira CZ, Kalabis J, Stairs
DB, Nakagawa H, Andl CD, Johnstone CN, Klein-Szanto AJ, El-Deiry
WS, Cukierman E, et al: The functional interplay between EGFR
overexpression, hTERT activation, and p53 mutation in esophageal
epithelial cells with activation of stromal fibroblasts induces
tumor development, invasion, and differentiation. Genes Dev.
21:2788–2803. 2007. View Article : Google Scholar : PubMed/NCBI
|
|
10
|
Hu N, Wang C, Clifford RJ, Yang HH, Su H,
Wang L, Wang Y, Xu Y, Tang ZZ, Ding T, et al: Integrative genomics
analysis of genes with biallelic loss and its relation to the
expression of mRNA and micro-RNA in esophageal squamous cell
carcinoma. BMC Genomics. 16:7322015. View Article : Google Scholar : PubMed/NCBI
|
|
11
|
Ashburner M, Ball CA, Blake JA, Botstein
D, Butler H, Cherry JM, Davis AP, Dolinski K, Dwight SS, Eppig JT,
et al: Gene ontology: Tool for the unification of biology. The Gene
Ontology Consortium. Nat Genet. 25:25–29. 2000. View Article : Google Scholar : PubMed/NCBI
|
|
12
|
Altermann E and Klaenhammer TR:
Pathwayvoyager: Pathway mapping using the kyoto encyclopedia of
genes and genomes (KEGG) database. BMC Genomics. 6:602005.
View Article : Google Scholar : PubMed/NCBI
|
|
13
|
Huang DW, Sherman BT, Tan Q, Kir J, Liu D,
Bryant D, Guo Y, Stephens R, Baseler MW, Lane HC and Lempicki RA:
DAVID bioinformatics resources: Expanded annotation database and
novel algorithms to better extract biology from large gene lists.
Nucleic Acids Res. 35:W169–W175. 2007. View Article : Google Scholar : PubMed/NCBI
|
|
14
|
Franceschini A, Szklarczyk D, Frankild S,
Kuhn M, Simonovic M, Roth A, Lin J, Minguez P, Bork P, von Mering C
and Jensen LJ: STRING v9.1: Protein-protein interaction networks,
with increased coverage and integration. Nucleic Acids Res.
41:D808–D815. 2013. View Article : Google Scholar : PubMed/NCBI
|
|
15
|
Bader GD and Hogue CW: An automated method
for finding molecular complexes in large protein interaction
networks. BMC Bioinformatics. 4:22003. View Article : Google Scholar : PubMed/NCBI
|
|
16
|
Tang Z, Li C, Kang B, Gao G, Li C and
Zhang Z: GEPIA: A web server for cancer and normal gene expression
profiling and interactive analyses. Nucleic Acids Res. 45:W98–W102.
2017. View Article : Google Scholar : PubMed/NCBI
|
|
17
|
Cui XB, Pang XL, Li S, Jin J, Hu JM, Yang
L, Liu CX, Li L, Wen SJ, Liang WH, et al: Elevated expression
patterns and tight correlation of the PLCE1 and NF-κB signaling in
Kazakh patients with esophageal carcinoma. Med Oncol. 31:7912014.
View Article : Google Scholar : PubMed/NCBI
|
|
18
|
Holzman LB, Marks RM and Dixit VM: A novel
immediate-early response gene of endothelium is induced by
cytokines and encodes a secreted protein. Mol Cell Biol.
10:5830–5838. 1990. View Article : Google Scholar : PubMed/NCBI
|
|
19
|
Abraham S, Knapp DW, Cheng L, Snyder PW,
Mittal SK, Bangari DS, Kinch M, Wu L, Dhariwal J and Mohammed SI:
Expression of EphA2 and Ephrin A-1 in carcinoma of the urinary
bladder. Clin Cancer Res. 12:353–360. 2006. View Article : Google Scholar : PubMed/NCBI
|
|
20
|
Nakamura R, Kataoka H, Sato N, Kanamori M,
Ihara M, Igarashi H, Ravshanov S, Wang YJ, Li ZY, Shimamura T, et
al: EPHA2/EFNA1 expression in human gastric cancer. Cancer Sci.
96:42–47. 2005. View Article : Google Scholar : PubMed/NCBI
|
|
21
|
Yamamoto H, Tei M, Uemura M, Takemasa I,
Uemura Y, Murata K, Fukunaga M, Ohue M, Ohnishi T, Ikeda K, et al:
Ephrin-A1 mRNA is associated with poor prognosis of colorectal
cancer. Int J Oncol. 42:549–555. 2013. View Article : Google Scholar : PubMed/NCBI
|
|
22
|
Wada H, Yamamoto H, Kim C, Uemura M, Akita
H, Tomimaru Y, Hama N, Kawamoto K, Kobayashi S, Eguchi H, et al:
Association between ephrin-A1 mRNA expression and poor prognosis
after hepatectomy to treat hepatocellular carcinoma. Int J Oncol.
45:1051–1058. 2014. View Article : Google Scholar : PubMed/NCBI
|
|
23
|
Désert R, Mebarki S, Desille M, Sicard M,
Lavergne E, Renaud S, Bergeat D, Sulpice L, Perret C, Turlin B, et
al: ‘Fibrous nests’ in human hepatocellular carcinoma express a
Wnt-induced gene signature associated with poor clinical outcome.
Int J Biochem Cell Biol. 81:195–207. 2016. View Article : Google Scholar : PubMed/NCBI
|
|
24
|
Salem O, Erdem N, Jung J, Münstermann E,
Wörner A, Wilhelm H, Wiemann S and Körner C: The highly expressed
5′isomiR of hsa-miR-140-3p contributes to the tumor-suppressive
effects of miR-140 by reducing breast cancer proliferation and
migration. BMC Genomics. 17:5662016. View Article : Google Scholar : PubMed/NCBI
|
|
25
|
Alabsi AM, Lim KL, Paterson IC, Ali-Saeed
R and Muharram BA: Cell cycle arrest and apoptosis induction via
modulation of mitochondrial integrity by Bcl-2 family members and
caspase dependence in Dracaena cinnabari-treated H400 human oral
squamous cell carcinoma. Biomed Res Int. 2016:49040162016.
View Article : Google Scholar : PubMed/NCBI
|
|
26
|
He Y, Liu J, Zhao Z and Zhao H:
Bioinformatics analysis of gene expression profiles of esophageal
squamous cell carcinoma. Dis Esophagus. 30:1–8. 2017. View Article : Google Scholar
|
|
27
|
Chan TF, Poon A, Basu A, Addleman NR, Chen
J, Phong A, Byers PH, Klein TE and Kwok PY: Natural variation in
four human collagen genes across an ethnically diverse population.
Genomics. 91:307–314. 2008. View Article : Google Scholar : PubMed/NCBI
|
|
28
|
Yue Y, Song M, Qiao Y, Li P, Yuan Y, Lian
J, Wang S and Zhang Y: Gene function analysis and underlying
mechanism of esophagus cancer based on microarray gene expression
profiling. Oncotarget. 8:105222–105237. 2017. View Article : Google Scholar : PubMed/NCBI
|
|
29
|
Abdel-Fatah TM, Middleton FK, Arora A,
Agarwal D, Chen T, Moseley PM, Perry C, Doherty R, Chan S, Green
AR, et al: Untangling the ATR-CHEK1 network for prognostication,
prediction and therapeutic target validation in breast cancer. Mol
Oncol. 9:569–585. 2015. View Article : Google Scholar : PubMed/NCBI
|
|
30
|
Kim MK, James J and Annunziata CM:
Topotecan synergizes with CHEK1 (CHK1) inhibitor to induce
apoptosis in ovarian cancer cells. BMC Cancer. 15:1962015.
View Article : Google Scholar : PubMed/NCBI
|
|
31
|
Parikh RA, Appleman LJ, Bauman JE,
Sankunny M, Lewis DW, Vlad A and Gollin SM: Upregulation of the
ATR-CHEK1 pathway in oral squamous cell carcinomas. Genes
Chromosomes Cancer. 53:25–37. 2014. View Article : Google Scholar : PubMed/NCBI
|
|
32
|
Xiang W, Wu X, Huang C, Wang M, Zhao X,
Luo G, Li Y, Jiang G, Xiao X and Zeng F: PTTG1 regulated by
miR-146-3p promotes bladder cancer migration, invasion, metastasis
and growth. Oncotarget. 8:664–678. 2017. View Article : Google Scholar : PubMed/NCBI
|
|
33
|
Feng W, Xiaoyan X, Shenglei L, Hongtao L
and Guozhong J: PTTG1 cooperated with GLI1 leads to
epithelial-mesenchymal transition in esophageal squamous cell
cancer. Oncotarget. 8:92388–92400. 2017. View Article : Google Scholar : PubMed/NCBI
|
|
34
|
Kaistha BP, Honstein T, Müller V, Bielak
S, Sauer M, Kreider R, Fassan M, Scarpa A, Schmees C, Volkmer H, et
al: Key role of dual specificity kinase TTK in proliferation and
survival of pancreatic cancer cells. Br J Cancer. 111:1780–1787.
2014. View Article : Google Scholar : PubMed/NCBI
|
|
35
|
Miao R, Wu Y, Zhang H, Zhou H, Sun X,
Csizmadia E, He L, Zhao Y, Jiang C, Miksad RA, et al: Utility of
the dual-specificity protein kinase TTK as a therapeutic target for
intrahepatic spread of liver cancer. Sci Rep. 6:331212016.
View Article : Google Scholar : PubMed/NCBI
|
|
36
|
Fu X, Chen G, Cai ZD, Wang C, Liu ZZ, Lin
ZY, Wu YD, Liang YX, Han ZD, Liu JC and Zhong WD: Overexpression of
BUB1B contributes to progression of prostate cancer and predicts
poor outcome in patients with prostate cancer. Onco Targets Ther.
9:2211–2220. 2016.PubMed/NCBI
|
|
37
|
Chen H, Lee J, Kljavin NM, Haley B, Daemen
A, Johnson L and Liang Y: Requirement for BUB1B/BUBR1 in tumor
progression of lung adenocarcinoma. Genes Cancer. 6:106–118.
2015.PubMed/NCBI
|
|
38
|
Zhang Y, Xu Y, Li Z, Zhu Y, Wen S, Wang M,
Lv H, Zhang F and Tian Z: Identification of the key transcription
factors in esophageal squamous cell carcinoma. J Thoracic Dis.
10:148–161. 2018. View Article : Google Scholar
|