Introduction
The liver is a unique organ with the capacity to
regenerate following the removal of two-thirds of liver mass
(1). Liver regeneration requires
the precisely coordinated proliferation of the two major hepatic
cell populations, hepatocytes and liver sinusoidal endothelial
cells to reconstitute liver structure and function (2). Liver regeneration also requires the
interaction between hepatocytes and other component cells, such as
Kupffer cells and hepatic stellate cells (1,3,4).
Numerous molecules, including hepatocyte growth factor and
epidermal growth factor have been demonstrated as mitogens produced
in nonparenchymal cells (5).
Suppressed liver regeneration is of major concern for small remnant
liver volume in adult living donor transplantation or in bacterial
infection after partial hepatectomy (PH), as this has been
associated with cholestasis and mortality (6).
Hepatocytes under physiological conditions
efficiently extract bile acids from sinusoids via the
sodium-dependent taurocholate cotransporting polypeptide (Ntcp) and
the sodium-independent organic anion transporting polypeptide
(Oatp1) (7). The extracted bile
acids are excreted into the bile canaliculi by ATP-dependent
transporters, such as the bile salt export pump (7). In our previous study, 90% PH in rats
resulted in high blood bile acids levels and the suppression of
Ntcp expression (6). Thus, lower
uptake of bile acids has been suggested to be partly involved in
cholestasis (6).
Infection is a frequent complication after living
donor liver transplantation (8).
Low-dose lipopolysaccharide (LPS) application after PH in mice was
reported to delay liver proliferation (9). As LPS is known to activate Kupffer
cells (10), this suggests that
activated Kupffer cells may inhibit liver proliferation; however,
it has been demonstrated that Kupffer cells stimulate liver
regeneration after PH (1);
depletion of Kupffer cells by clodronate delays liver regeneration
(11). Therefore, Kupffer cells
activated by LPS may lose their capacity to induce hepatocyte
proliferation after PH.
The present study examined whether LPS-induced
cholestasis is also due to the suppression of Ntcp expression, as
observed in 90% PH rats. It also examined whether Kupffer cells
activated by LPS inhibit or stimulate liver regeneration after PH.
The expression of anion transporters for the uptake from the
sinusoid was decreased in PH, but LPS did not further decrease
their expression. This suggested that decreases in these
transporters were not responsible, but a delay in hepatocyte
proliferation may be linked to LPS-induced cholestasis. LPS
treatment alone or in combination with PH induced Kupffer cell
activation with a CD163-positive phenotype, a marker for M2-type
macrophages (12); CD163-positive
cells were suggested to produce chemokine ligand 9 (Cxcl9), which
was determined to be involved in chronic inflammation (13) and M2 macrophage polarization
(14). As hematopoietic type
prostaglandin D2 synthetase (Ptgds2) is known to inhibit lymphocyte
proliferation (15), Ptgds2
staining was performed. Hepatocytes in the LPS + PH group were
stained and markedly stained at 24 h, a time point when cell
proliferation was notably inhibited. On the contrary, hepatocytes
in the LPS or the PH groups were not stained.
Materials and methods
Animals and animal treatment
Male Sprague-Dawley rats weighing 180–220 g and 6
weeks old were purchased from Charles River Laboratories Japan,
Inc. In total 39 rats were used and they were housed under routine
laboratory conditions at the animal laboratory of Hirosaki
University. The rats received standard laboratory chow, had free
access to food and water, and were kept in a thermostatically
controlled room (25°C) with a 12-h light-dark cycle. Before
undergoing surgical procedures, all rats were fasted for 24 h. The
rats were divided into five groups: Control group without any
treatment, sham group receiving laparotomy alone, LPS group
receiving intravenous LPS 75 µg/rat, PH group receiving 70% PH, and
LPS + PH group receiving intravenous LPS injection immediately
after PH. 70% PH was performed as reported previously (6). The rats of four groups except the
control group were sacrificed at 24, 72 and 168 h after laparotomy
or PH and/or LPS treatment. Those of the control group were
sacrificed at 0 h. Three rats each were used at respective time
points of each group. LPS (O55:B5, L2880) was purchased from
Sigma-Aldrich (Merck KGaA). After the surgical procedures, the rats
had free access to a 200 g/l glucose solution for 24 h to avoid
post-operative hypoglycemia after hepatectomy. The present study
was performed in accordance with the Guidelines for Animal
Experimentation, Hirosaki University, and all of the animals
received humane care according to the criteria outlined in the
‘Guide For The Care And Use Of Laboratory Animals’ prepared by the
National Academy of Sciences and published by the National
Institutes of Health (16).
Plasma total bilirubin and bile
acids
Blood from the hearts was collected in test tubes
containing EDTA and plasma was prepared after centrifugation at
2,500 × g, for 10 min at room temperature. Plasma total bilirubin,
aspartate aminotransferase (AST), and alanine aminotransferase
(ALT) were measured using Spotchem EZ (ARKRAY, Inc.) with SPOTCHEM
II Basic Panel 2 Test Strips (MT-7785; ARKRAY, Inc.), according to
the manufacturer's protocols. The plasma levels of total bile acids
were measured with an assay kit (Diazyme Laboratories), according
to the manufacturer's protocol.
Microarray analysis
Total RNA was extracted from frozen liver samples at
0, 24, 72 and 168 h after 70% hepatectomy and/or LPS injection with
TRIzol® reagent (Thermo Fisher Scientific, Inc.). Equal
amounts of RNA from three individual livers were combined, and 10
µg of RNA was used to produce biotin-labeled complementary RNA
(cRNA) with GeneChip IVT labeling kit (Affymetrix; Thermo Fisher
Scientific, Inc.). The labeled and fragmented cRNA was subsequently
hybridized to GeneChip® Rat Gene-ST 2.0 Array
(Affymetrix; Thermo Fisher Scientific, Inc.). Labeling,
hybridization, image scanning and data analysis were performed at
TOHOKU CHEMICAL Co., Ltd.
Reverse transcription-quantitative
polymerase chain reaction (RT-qPCR)
Complementary DNA (cDNA) was reverse-transcribed
from 1 µg of total RNA using the Omniscript RT kit (Qiagen, Inc.),
according to the manufacturer's protocols. A MiniOpticon Detection
System (Bio-Rad Laboratories, Inc.) and SYBR® Green
Supermix (Bio-Rad Laboratories, Inc.) were used for the
quantitation of specific mRNA. The amplification of ubiquitin
C cDNA was performed to standardize the levels of the target
cDNA, as reported previously (6).
Gene-specific primers were designed according to known rat
sequences (Table I). PCR
amplification consisted of 30 sec at 94°C, 30 sec at 55–60°C and 30
sec at 72°C for 30–35 cycles. No non-specific PCR products, as
detected by melting temperature curves, were found. After
normalizing the expression of the target gene to ubiquitin C
expression using the 2−ΔΔCt method reported by Livak and
Schmittgen (17) in triplicate;
the levels of mRNA expression in three samples at respective time
points (0, 24, 72, and 168 h after treatment) were expressed
relative to the control values.
 | Table I.Reverse transcription-quantitative
polymerase chain reaction primer sequences. |
Table I.
Reverse transcription-quantitative
polymerase chain reaction primer sequences.
| Gene | Forward primer
(5′→3′) | Reverse primer
(5′→3′) |
|---|
| Abcc2 |
CACAGGTTTGCCCATTATCC |
ATATTGAGGGCGTTGGACAG |
| Slc10a1 |
AGGCATGATCATCACCTTCC |
AAGTGGCCCAATGACTTCAG |
| Slc21a1 |
TACATGTCAGCTTGCCTTGC |
GCGGGAATACCAGCAAATAC |
| Slc21a2 |
CAATTCGGTATCCCCACATC |
GTTTGAGGACACGTTGCTTG |
| Rrm2 |
GCACTGGGAAGCTCTGAAAC |
GGCAATTTGGAAGCCATAGA |
| Pcna |
GGTGAAGTTTTCTGCGAGTG |
CTCAGAAGCGATCGTCAAAG |
| Cxcl9 |
TCGAGGAACCCTAGTGATAAGGAATCAG |
TTTGCTTTTTCTTTTGGCTGATCTTTTTC |
Western blotting
Crude liver membranes were prepared according to the
method of Gant et al (18)
and the samples (100 µg protein each) were dissolved in sample
buffer and separated via 7.5% SDS-PAGE with a 4.4% stacking gel.
Protein content was measured by Bradford's method (19) using a bovine serum albumin standard
curve. Following electrophoresis, the proteins were transferred to
polyvinylidene fluoride membranes (Hybond-P, GE Healthcare). After
blocking with 4% nonfat dry milk in Tris-buffered saline for 2 h at
room temperature, membranes were incubated overnight at 4°C with
primary anti-Ntcp antibody (sc-107029; 1:10,000, Santa Cruz
Biotechnology, Inc.) or anti-β-actin antibody (ab227387; 1:1,000,
Abcam). Immune complexes were detected using a horseradish
peroxidase conjugated anti-rabbit IgG secondary antibody (NA934;
1:2,000, GE Healthcare) and visualized with an enhanced
chemiluminescent kit (ECL Plus; GE Healthcare).
Immunostaining
Liver tissue samples were fixed in 10% neutral
buffered formaldehyde for two days at 4°C and embedded in paraffin.
These paraffin blocks were sliced into 4 µm sections and passed
through xylene and a graded alcohol series. The deparaffinized
sections were stained with hematoxylin solution at room temperature
for 5 min. Following washing with water and passing through a
graded alcohol series, the sections were stained with eosin
solution for 1 min. The deparaffinized sections were also stained
for CD68, CD163, Cxcl9, and Ptgds2 using a standard
avidin-biotin-peroxidase conjugate method (20) using an automated immunostaining
instrument (Benchmark XT; Ventana Medical System). The slides were
blocked with 0.3% hydrogen peroxide and then incubated for 1 h at
room temperature with the primary antibodies. The antibodies
employed were: Anti-CD68 antibody (MCA 341R; 1:100, Bio-Rad
Laboratories, Inc.), anti-CD 163 antibody (sc-58965; 1:500, Santa
Cruz Biotechnology, Inc.), anti-Cxcl9 antibody (bs-2551R; 1:500,
BIOSS Inc.), and anti-Ptgds2 antibody (PA 5-43217; 1:500,
Invitrogen; Thermo Fisher Scientific, Inc.). Non-immune γ-globulin
fractionated from rabbit sera by 20–40% saturation of ammonium
sulfate (21) was used as a
negative control instead of primary antibody. The biotinylated
anti-rabbit IgG or anti-mouse IgG antibodies and Vectastain ABC kit
(PK6101) were obtained from Vector Laboratories, Inc. The specific
binding was visualized with a 3,3′-diaminobenzidine
tetrahydrochloride solution. Sections were then lightly
counterstained with hematoxylin for microscopic examination. Images
were captured with an inverted FSX 100 microscope (Olympus
Corporation). Digital images were processed with Adobe Photoshop
(version 7.0, Adobe Systems, Inc.) and ImageJ software (v1.50,
National Institutes of Health).
Statistical analysis
Experiments for which a statistical analysis was
indicated were performed independently at least three times. Data
are presented as the mean ± standard deviation. Statistical
comparisons were analyzed using SPSS software (v22.0, IBM Corp.).
Differences between experimental groups were assessed for
significance using two-way ANOVA with a Tukey's post-hoc test.
P<0.05 was considered to indicate a statistically significant
difference.
Results
Elevated plasma bilirubin and bile
acid levels in the LPS + PH group
Bilirubin and bile acid levels in the plasma at 24 h
post-operation were significantly increased in the LPS + PH group
compared with those in the sham group. The bile acid level was
significantly higher in the LPS + PH group than that in the PH
group (Fig. 1). These results
indicated that LPS induced cholestasis in this rat model. AST and
ALT levels in the plasma at 24 h were significantly increased in
the LPS + PH group and PH group, compared with those in the sham
group.
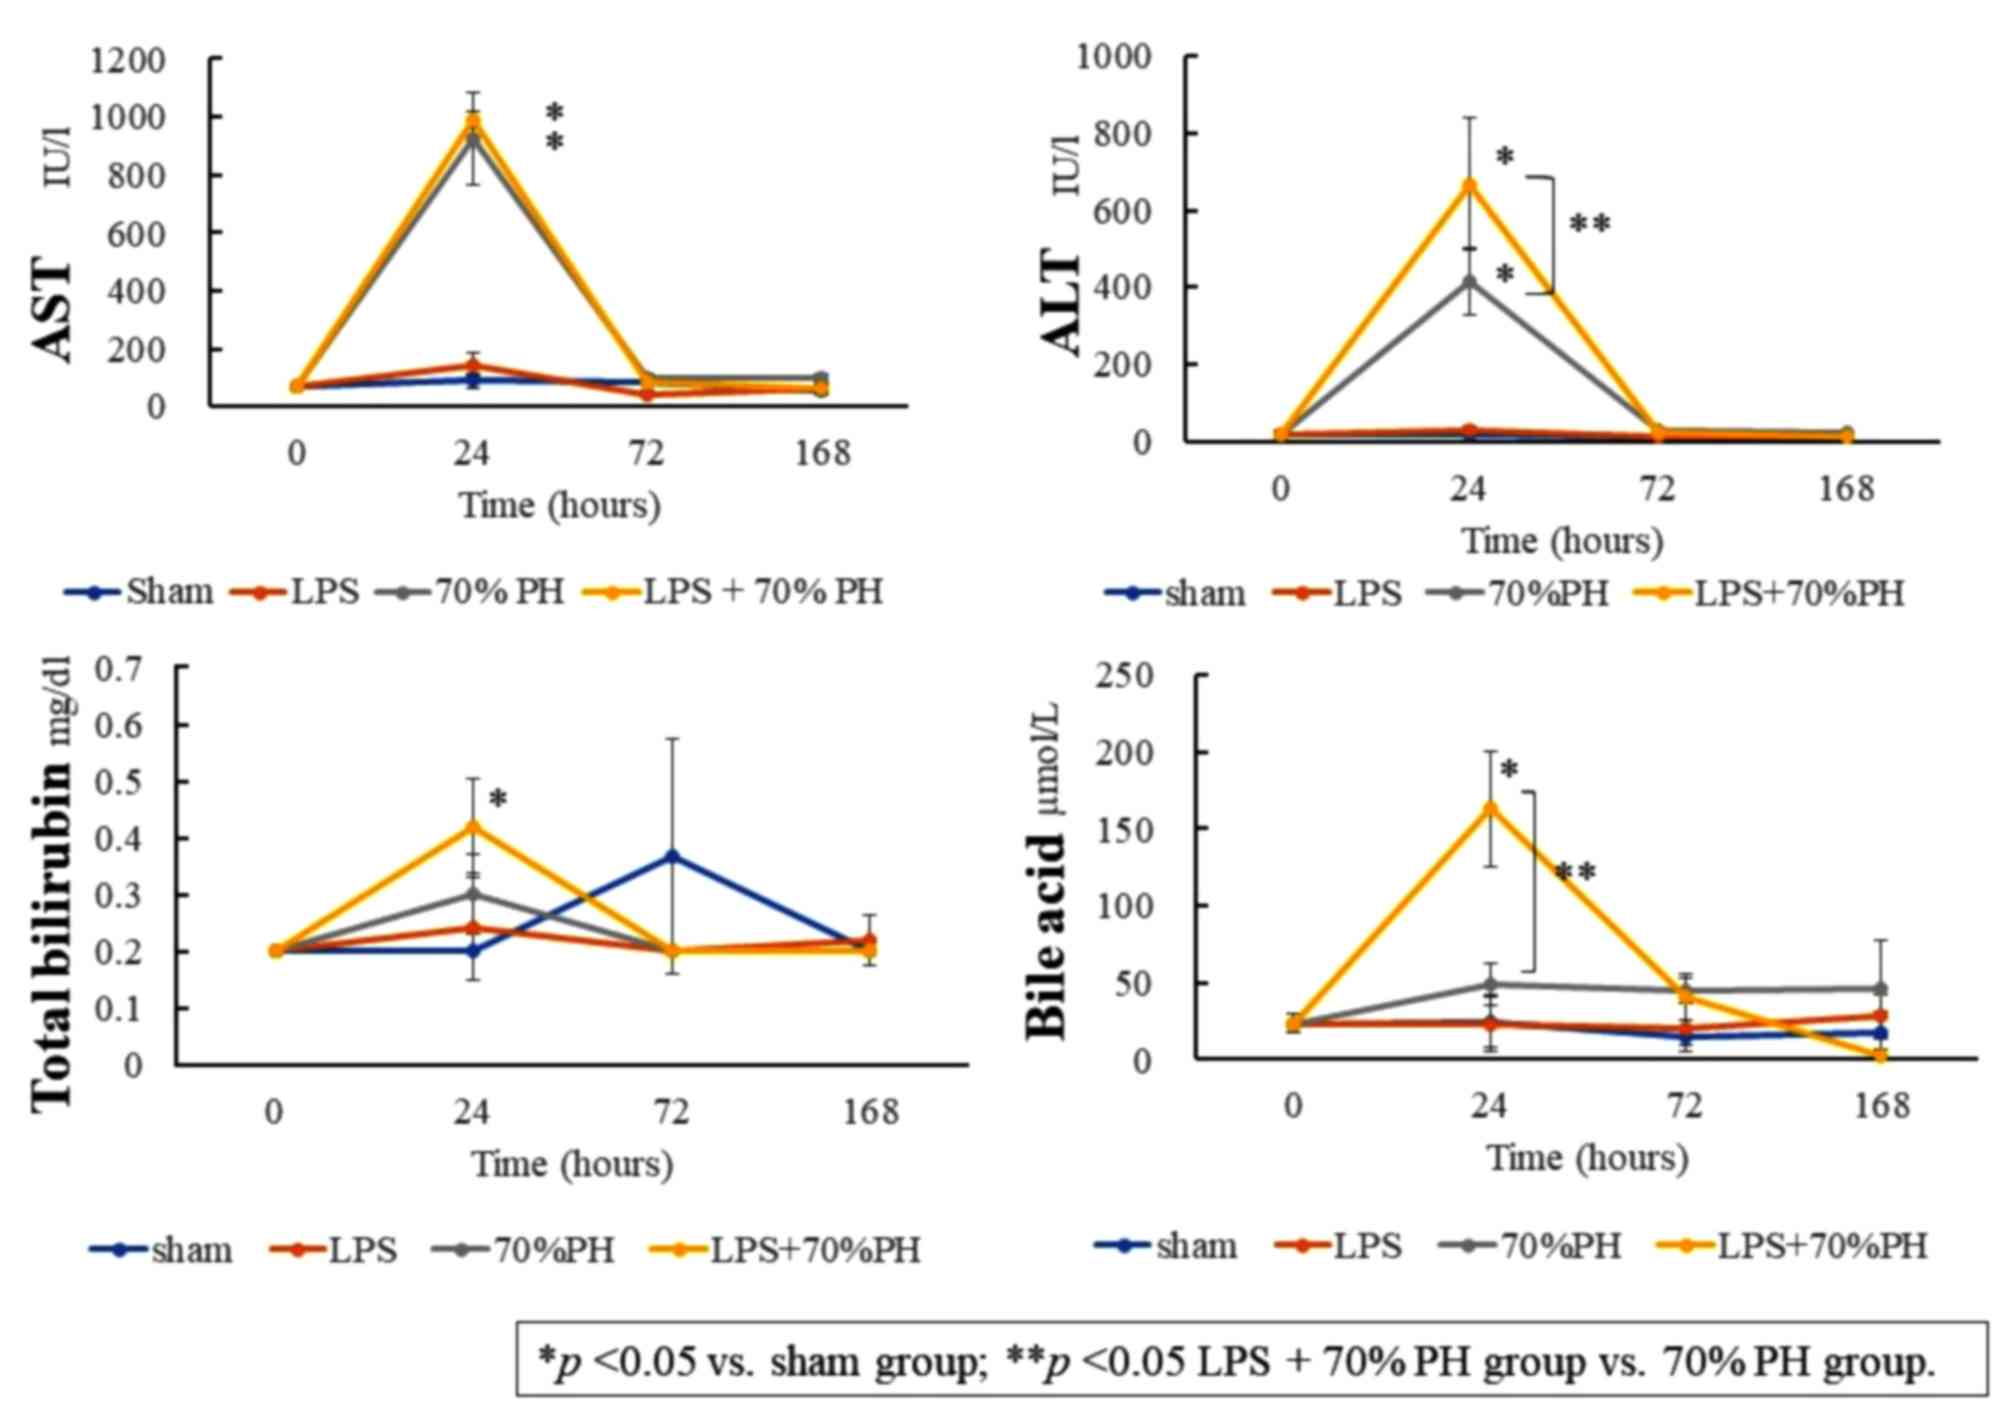 | Figure 1.Levels of plasma AST, ALT, total
bilirubin and bile acids at 0 (control), 24, 72, and 168 h after a
sham operation (blue), LPS administration (orange), 70% PH (gray),
and LPS + 70% PH (yellow). The biomarker levels were quantified
with a commercial kit. Data are presented as the mean ± standard
deviation from three rats. *P<0.05 vs. sham group; **P<0.05
LPS + 70% PH group vs. 70% PH group. ALT, alanine aminotransferase;
AST, aspartate aminotransferase; LPS, lipopolysaccharide; PH,
partial hepatectomy. |
Suppression and delay in DNA
replication in the LPS + PH group
Microarray analysis was performed to comprehensively
analyze alterations in liver gene expression. Data were expressed
as signal values, and changes of >2-fold or <1/2 from the
values in the control or sham groups were considered significant.
Ribonucleotide reductase regulatory subunit M2 (Rrm2), DNA
topoisomerase IIα and proliferating cell nuclear antigen
(Pcna), which are markers of DNA replication (6), reached a peak level of expression
after 24 h in the PH group and gradually decreased thereafter.
However, in the LPS + PH group, these replication signals were low
after 24 h and peaked after 72 h. The values at 72 h were lower
than those at 24 h in the PH group (Table II). These results suggested a
delay and suppression in DNA replication in the LPS + PH group. No
notable changes were observed in Cd68 or Cd163
expression, which are markers of Kupffer cells (12,22).
The chemokine Cxcl9 markedly increased in the LPS group and
LPS +PH group, compared with that in the sham at 24 h (Table II). For sinusoid transporters,
Ntcp (Slc10a1), Oatp1(Slc21a1) and Oatp2
(Slc21a2) were reduced in the LPS + PH and the PH groups at
24 h. These expression levels returned to control levels at 72 h in
both groups. No notable changes were observed in collagen 1α1 or
desmin, markers of hepatic stellate cells, or in cytokeratin19 or
epithelial cell adhesion molecule, markers of liver progenitor
cells (23) (Table II).
| Table II.Results of microarray analysis. |
Table II.
Results of microarray analysis.
|
|
|
Signal |
|---|
|
|
|
|
|---|
|
|
| Sham | LPS | 70% PH | LPS + 70% PH |
|---|
|
|
|
|
|
|
|
|---|
| Cellular function
and gene name (gene symbol) | Control (0 h) | 24 h | 72 h | 168 h | 24 h | 72 h | 168 h | 24 h | 72 h | 168 h | 24 h | 72 h | 168 h |
|---|
| DNA
replication |
|
|
|
|
|
|
|
|
|
|
|
|
|
|
Ribonucleotide reductase
subunit M2 (Rrm2) | 450 | 40 | 30 | 70 | 70 | 420 | 120 | 2,290a | 660 | 270 | 470 | 860 | 40 |
|
Topoisomerase (DNA)II α
(Top2a) | 250 | 30 | 40 | 70 | 70 | 190 | 70 | 750a | 260 | 120 | 190 | 390 | 30 |
|
Proliferating cell nuclear
antigen (Pcna) | 240 | 120 | 160 | 130 | 170 | 200 | 130 | 540a | 250 | 170 | 240 | 300 | 190 |
| DNA
ligase I (Lig1) | 60 | 30 | 40 | 60 | 50 | 70 | 60 | 120a | 80 | 50 | 60 | 110 | 40 |
| Kupffer cells |
|
|
|
|
|
|
|
|
|
|
|
|
|
| Cd68
molecule (Cd68) | 240 | 280 | 240 | 260 | 260 | 230 | 210 | 170 | 300 | 360 | 260 | 300 | 450 |
| Cd163
molecule (Cd163) | 260 | 320 | 250 | 260 | 200 | 270 | 250 | 230 | 310 | 350 | 270 | 300 | 380 |
| Mannose
receptor, C type 1 (Mrc1) | 450 | 550 | 440 | 490 | 420 | 580 | 490 | 400 | 510 | 520 | 370 | 570 | 570 |
|
Chemokine (C-X-C motif) ligand
1 (Cxcl1) | 50 | 110 | 120 | 70 | 120 | 50 | 60 | 470a | 250 a | 230a | 260a | 210a | 270a |
|
Chemokine (C-X-C motif) ligand
9 (Cxcl9) | 120 | 80 | 80 | 140 | 4,770a | 280a | 130 | 100 | 160 | 140 | 4,140a | 310a | 110 |
|
Chemokine (C-X-C motif)
receptor 3 (Cxcr3) | 40 | 30 | 40 | 40 | 30 | 30 | 30 | 30 | 40 | 20 | 30 | 30 | 40 |
| Stellate cells |
|
|
|
|
|
|
|
|
|
|
|
|
|
|
Collagen, typeI, α1
(Col1a1) | 110 | 90 | 470 | 120 | 130 | 190 | 160 | 110 | 250 | 210 | 150 | 350 | 220 |
| Desmin
(Des) | 50 | 40 | 60 | 50 | 60 | 60 | 40 | 50 | 60 | 50 | 60 | 60 | 60 |
| Liver progenitor
cells |
|
|
|
|
|
|
|
|
|
|
|
|
|
|
Cytokeratin 19
(Krt19) | 30 | 40 | 50 | 30 | 20 | 40 | 40 | 30 | 30 | 210 | 30 | 30 | 30 |
|
Epithelial cell adhesion
molecule (Epcam) | 80 | 80 | 100 | 70 | 90 | 80 | 90 | 50 | 70 | 50 | 60 | 70 | 90 |
| Sinusoid
transporter |
|
|
|
|
|
|
|
|
| ATP
binding cassette subfamily C member 1 (Abcc1) | 20 | 30 | 30 | 30 | 30 | 30 | 30 | 40 | 30 | 30 | 30 | 40 | 30 |
| ATP
binding cassette subfamily C member 3 (Abcc3) | 110 | 150 | 220 | 100 | 130 | 110 | 70 | 70 | 140 | 70 | 90 | 200 | 90 |
| Solute
carrier family 10 member 1 (Slc10a1, Ntcp) | 3,650 | 3,620 | 2,880 | 3,170 | 2,850 | 3,490 | 3,370 | 1,090b | 3,090 | 3,370 | 740b | 3,120 | 3,320 |
| Solute
carrier organic anion transporter family, member 1a1
(Slc21a1, Oatp1) | 1,170 | 1,150 | 840 | 830 | 680 | 880 | 850 | 530b | 610 | 850 | 380b | 770 | 770 |
| Solute
carrier organic anion transporter family, member 1a2
(Slc21a2, Oatp2) | 950 | 480 | 520 | 570 | 220b | 1,060 | 730 | 140b | 820 | 730 | 90b | 900 | 320 |
| Bile canaliculus
transporter |
|
|
|
|
|
|
|
| ATP
binding cassette subfamily C member 2 (Abcc2) | 1,870 | 1,510 | 1,880 | 30 | 1,510 | 2,570 | 2,910 | 1,030 | 1,860 | 2,910 | 760b | 2,000 | 2,690 |
| ATP
binding cassette subfamily B member 11 (Abcb11) | 2,190 | 2,260 | 2,030 | 100 | 1,610 | 2,260 | 2,450 | 1,630 | 2,310 | 2,450 | 1,470 | 2,260 | 2,480 |
| ATP
binding cassette subfamily G member 5 (Abcg5) | 340 | 240 | 260 | 3,170 | 190 | 290 | 190 | 100b | 120b | 190 | 130b | 160b | 80b |
| ATP
binding cassette subfamily G member 8 (Abcg8) | 170 | 100 | 110 | 830 | 70 | 110 | 70 | 50b | 50b | 70 | 70b | 60b | 40b |
| ATP
binding cassette subfamily B member 1A (Abcb1a) | 140 | 130 | 140 | 570 | 110 | 140 | 100 | 60 | 130 | 100 | 80 | 170 | 80 |
| ATP
binding cassette subfamily B (MDR/TAP) member 1B
(Abcb1b) | 140 | 30 | 180 | 30 | 60 | 130 | 40 | 820a | 280a | 40 | 160 | 500a | 60 |
| ATP
binding cassette subfamily B member 4 (Abcb4) | 670 | 750 | 620 | 100 | 880 | 680 | 650 | 710 | 950 | 650 | 1,030 | 940 | 530 |
To confirm these changes in gene expression, RT-qPCR
was performed. Abcc2, Oatp1, and Oatp2 mRNA levels
were significantly decreased at 24 h in the LPS + PH group and PH
group, compared with those in the sham group. These mRNA levels
except Oatp2 were not significantly different between the
LPS + PH and the PH groups (Fig.
2A). The Rrm2 mRNA levels at 24 h in the LPS + PH group
were lower than those in the PH group (Fig. 2B). Rrm2 and Pcna
peaked at 24 h in the PH group, whereas at 72 h, the levels
increased in the LPS + PH group (Fig.
2B), confirming the results obtained by microarray analysis.
Cxcl9 showed a significant rise after 24 h in the LPS and
LPS + PH groups compared with the control and PH groups,
respectively (Fig. 2B). These
findings suggested that Cxcl9 expression was dependent on
LPS treatment.
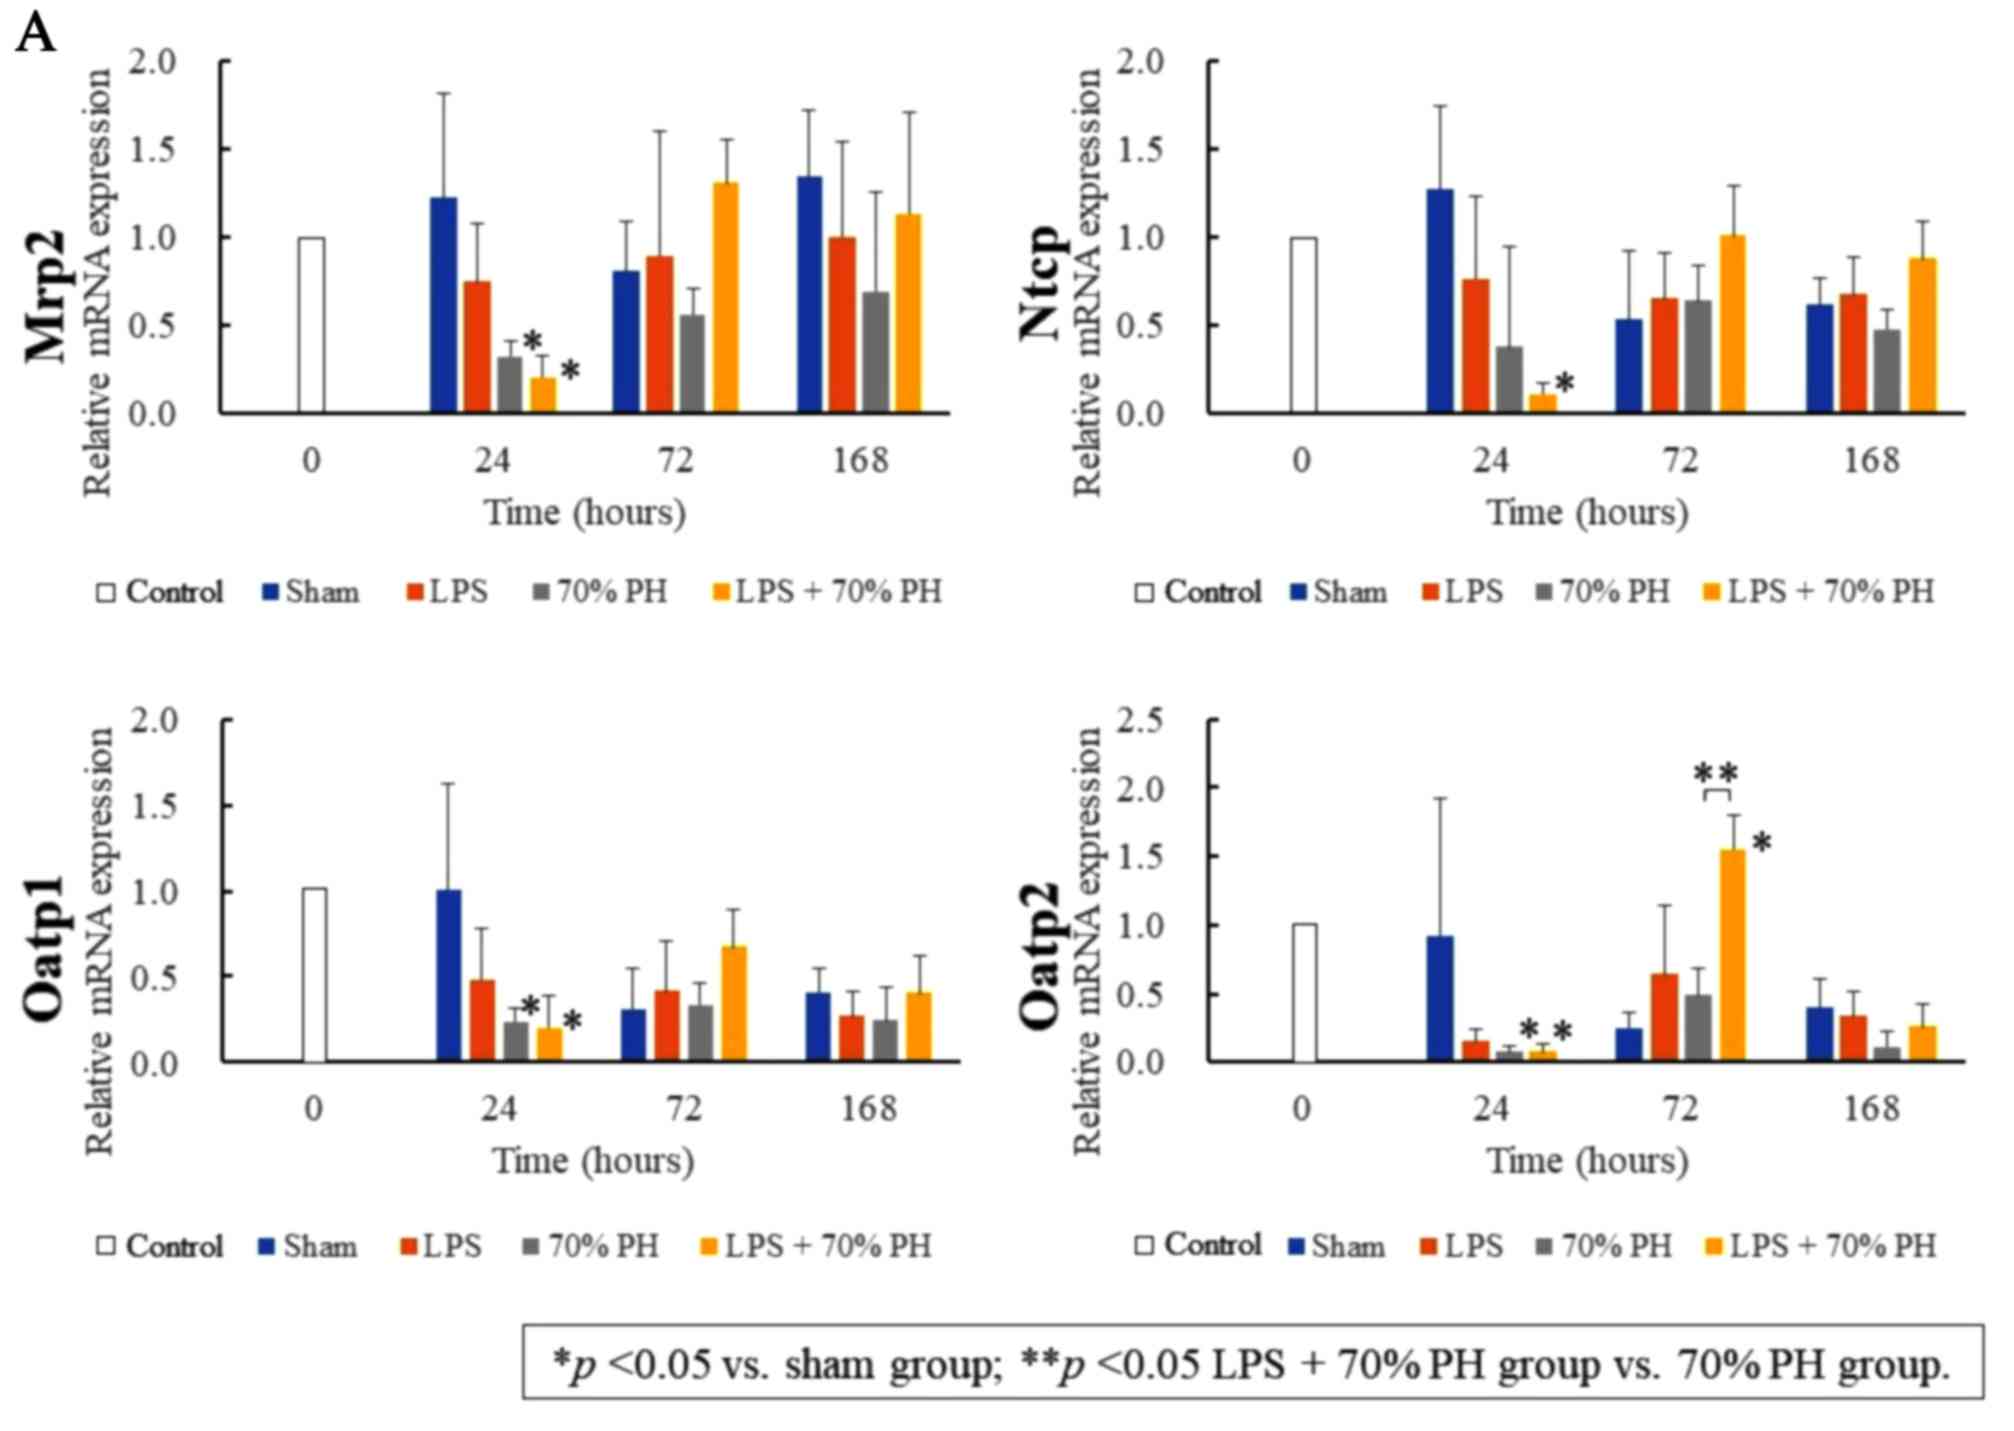 | Figure 2.Quantitation of mRNA expression. The
expression of (A) organic anion transporters, and (B) DNA
replication genes and Cxcl9 at 0, 24, 72, and 168 h after the sham
operation (blue), LPS administration (orange), PH (gray), and LPS +
PH (yellow). The quantification of Mrp2, Ntcp, Oatp1, Oatp2,
Rrm2, Pcna and Cxcl9 mRNA expression was conducted via
reverse transcription-quantitative polymerase chain reaction. The
mRNA expression levels at 24, 72 and 168 h are expressed relative
to the values of individual mRNA at 0 h. Data are presented as the
mean ± standard deviation from three rats. *P<0.05 vs. sham
group; **P<0.05 LPS + 70% PH group vs. 70% PH group. Mrp2, ATP
binding cassette subfamily C member 2; Ntcp, taurocholate
cotransporting polypeptide; Oatp1, solute carrier organic anion
transporters 1a1; Oatp2, solute carrier organic anion transporters
1a2; Rrm2, ribonucleotide reductase regulatory subunit M2; Pcna,
proliferating cell nuclear antigen; Cxcl9, chemokine ligand 9; LPS,
lipopolysaccharide; PH, partial hepatectomy. |
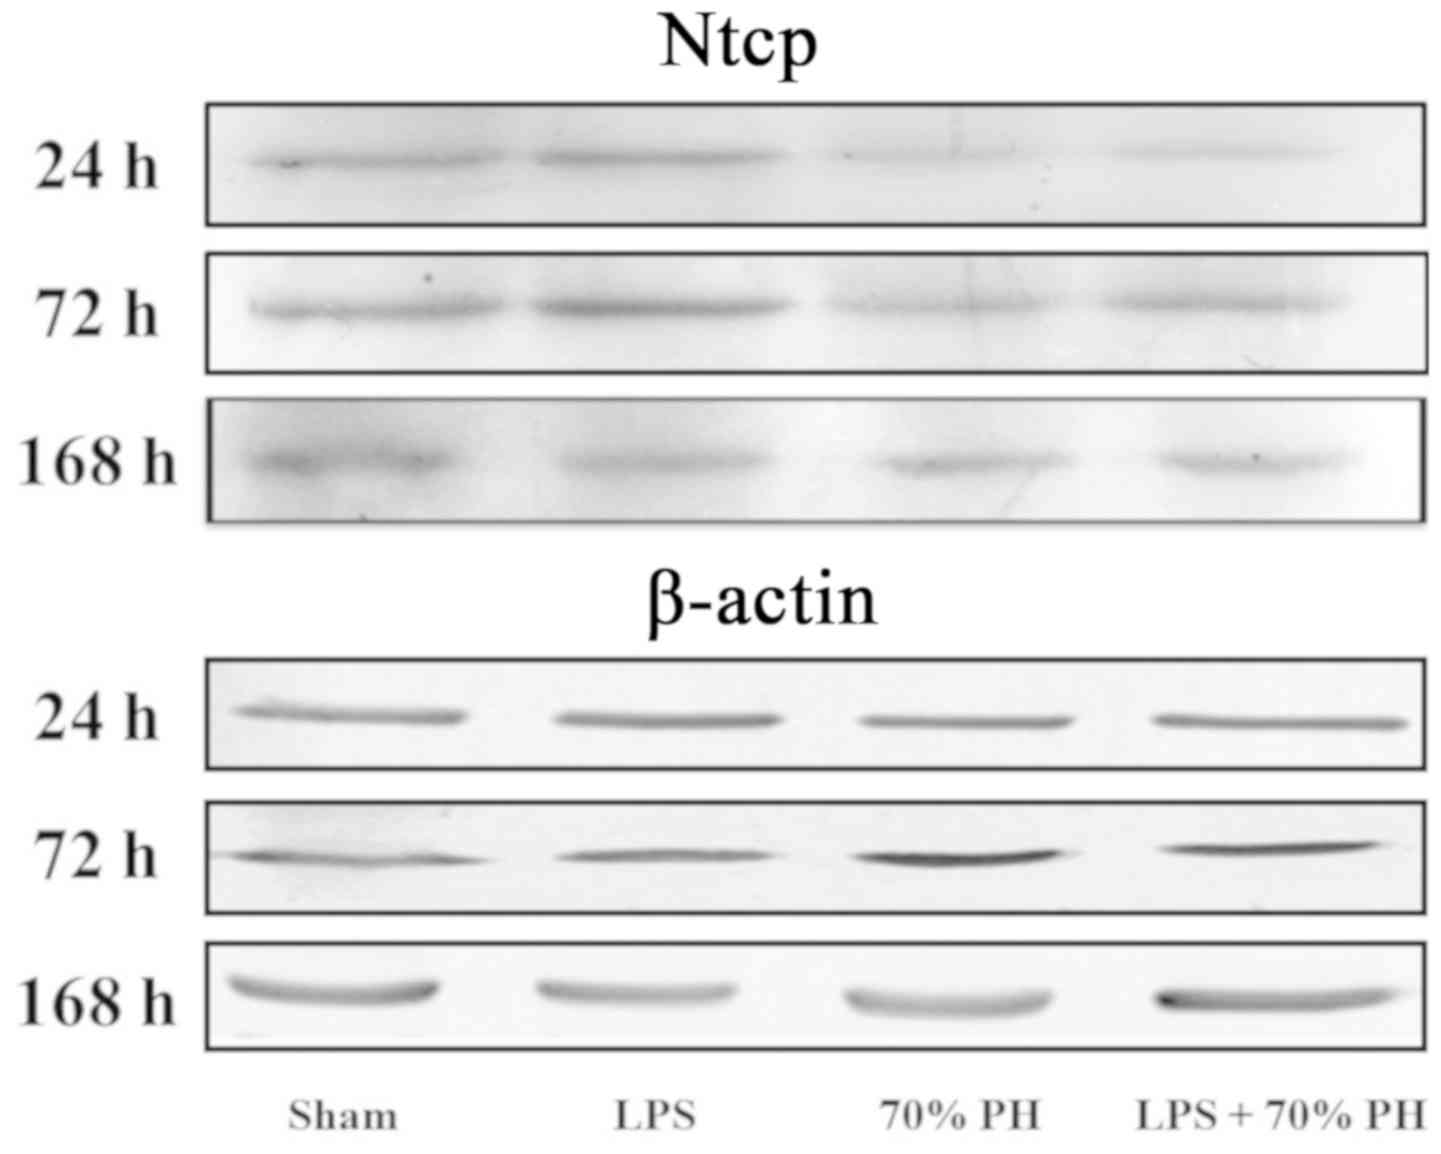
Ntcp protein levels were examined by western
blotting; Ntcp expression was decreased in the PH and LPS + PH
group at 24 h compared with the sham group (Fig. 3).
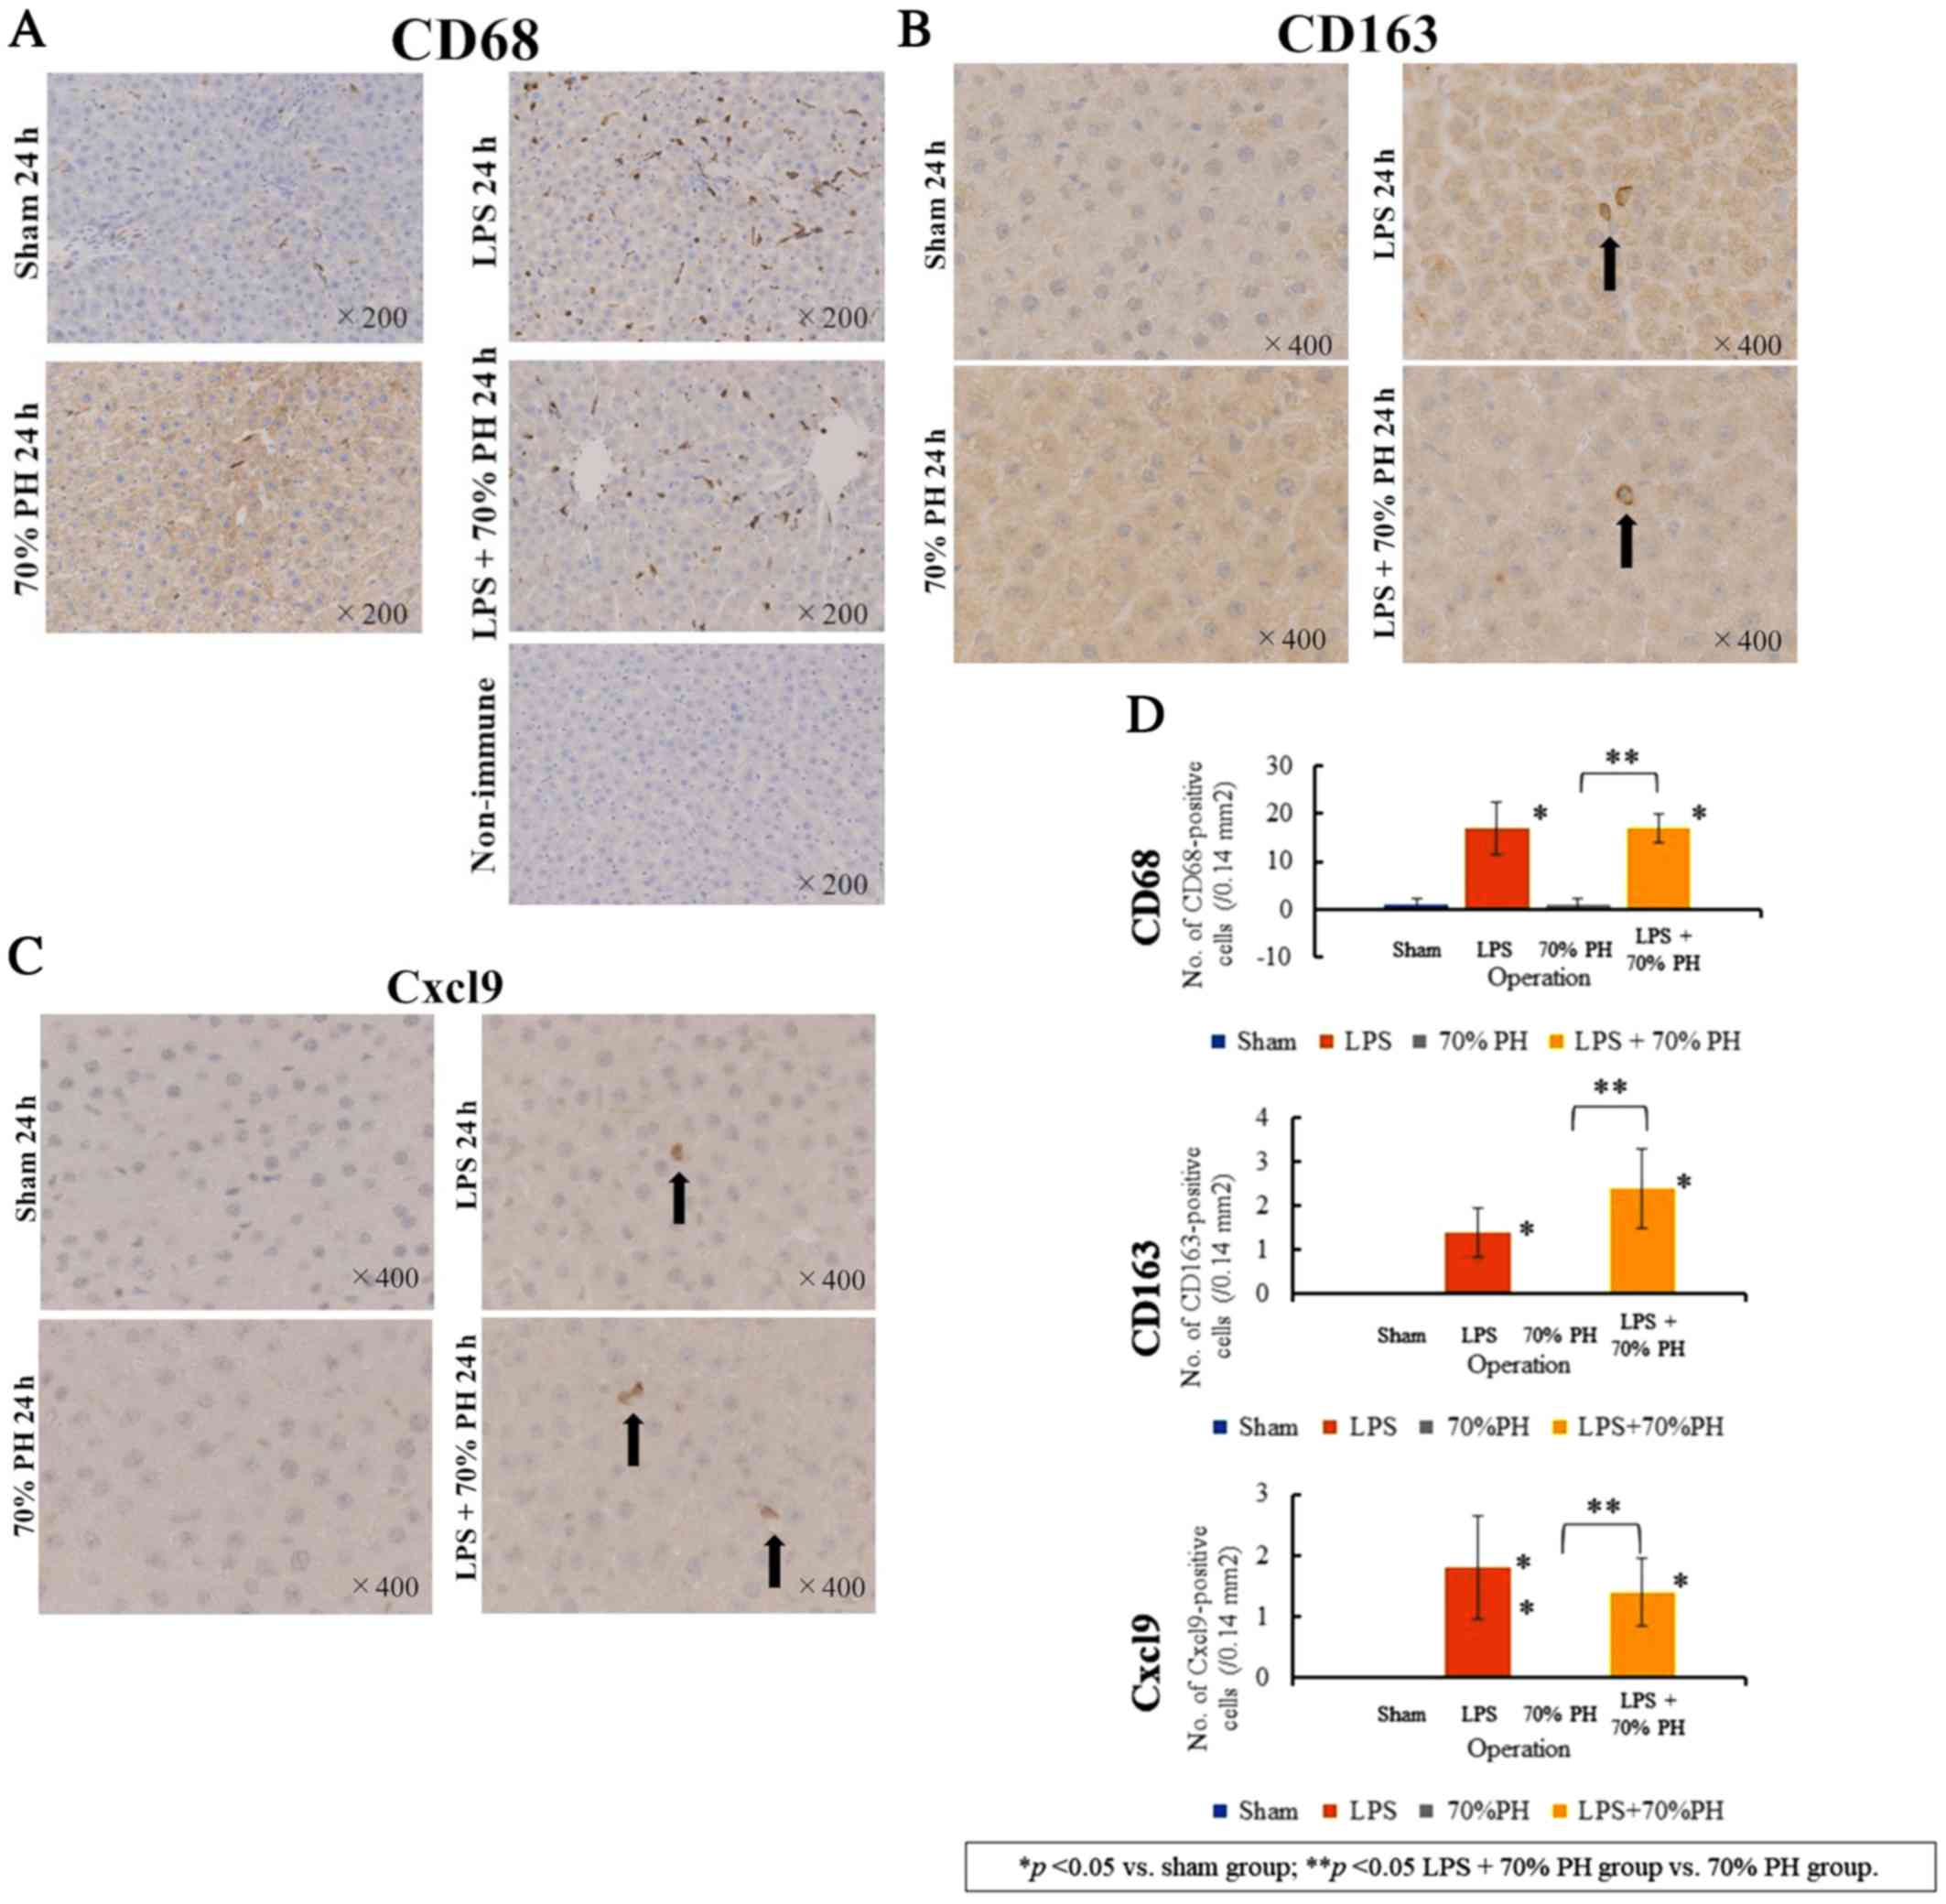
Expression of Cxcl9 in Kupffer cells
activated by LPS treatment
Although Cd68 mRNA or Cd163 mRNA
levels were unaltered as determined by microarray analysis
(Table II), staining for CD68, a
marker of Kupffer cells and macrophages (22), revealed a marked increase in
CD68-positive Kupffer cells in the LPS and LPS + PH groups,
compared with that in the sham and PH groups (Fig. 4A). CD163 staining, a marker for M2
macrophages and Kupffer cells (12) was positive in cells in the LPS and
LPS + PH groups (Fig. 4B). These
CD163-positive cells were not detected in the sham or PH groups.
There were fewer CD163-positive cells than CD68-positive cells, and
their cell shapes were different from each other. These results
suggested that CD163-positive cells detected after LPS treatment
denoted M2-type Kupffer cells (12). There were also Cxcl9-positive cells
in the LPS and LPS + PH groups (Fig.
4C), whereas Cxcl9-positive cells were not detected in the sham
or PH groups. The number of Cxcl9-positive cells was similar to
that of CD163-positive cells rather than CD68-positive cells
(Fig. 4D).
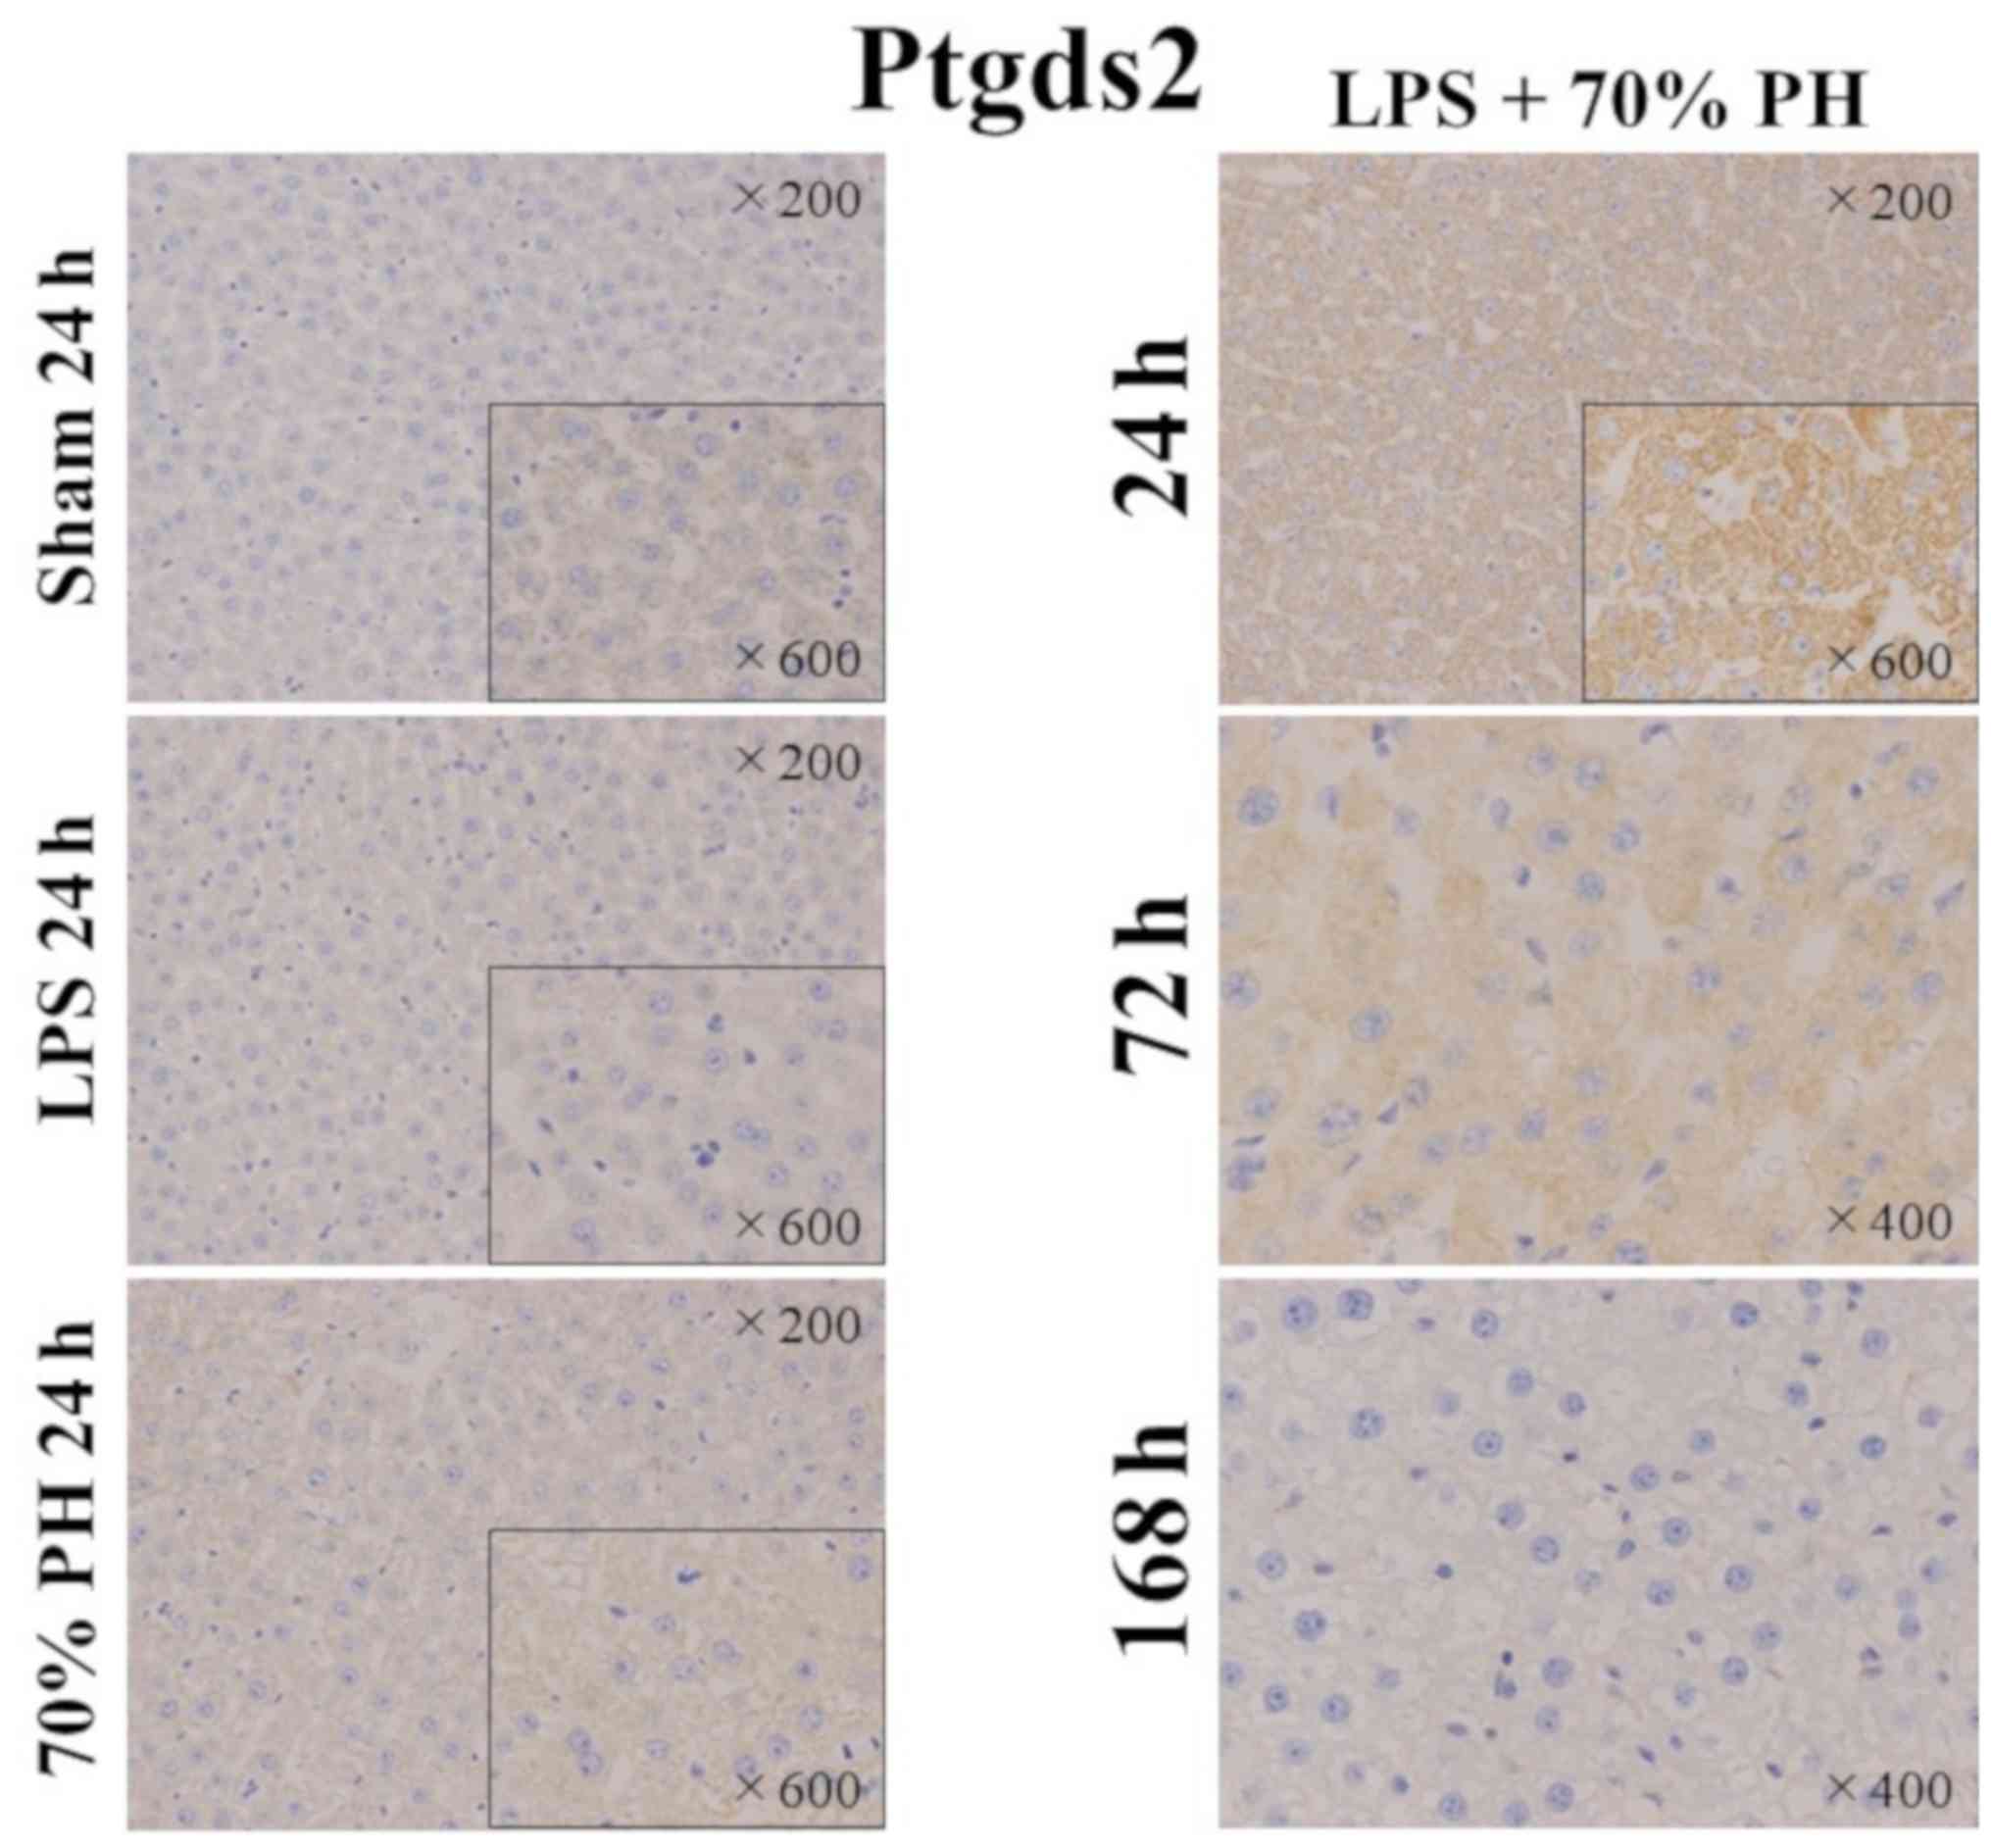
Expression of Ptgds2 in hepatocytes in
the LPS + PH group
As Ptgds2 inhibits cell proliferation (15), Ptgds2 staining was performed. A
positive reaction was only detected in hepatocytes of the LPS + PH
group, but not in other groups (Fig.
5). Kupffer cells were not stained in any groups. In the LPS +
PH group, Ptgds2 was markedly stained in hepatocytes at 24 h,
weakly stained at 72 h, but not at 168 h.
Discussion
In the rat PH model of the present study, LPS
treatment induced cholestasis and delayed cell proliferation.
Compared with the sham group, the expression of anion transporters
involved in the uptake from the sinusoid was downregulated at 24 h
in both the PH and the LPS + PH groups, but did not differ between
the latter two groups. Downregulation of these anion transporters
is a causative factor for cholestasis after 90% PH (6,7,24).
However, this was unlikely in the case of cholestasis in the LPS +
PH group; suppression or delays in cell proliferation may be the
responsible factor. Downregulation of marker genes of DNA
replication, such as Rrm2 was determined by RT-qPCR
analysis; however, delays in cell proliferation are not confirmed
by protein levels, as immunohistochemistry for Pcna was not
conducted. Hepatocyte proliferation is blocked by
2-acetylaminofluorene administration during PH in rats (25). In this case, biliary epithelial
cells and hepatic stellate cells become progenitor cells, and these
cells contribute to liver regeneration (25). In the case of LPS, activation of
these cells was not detected, and microarray and RT-qPCR data
suggested that hepatocyte proliferation was inhibited
transiently.
Our findings revealed that LPS treatment increased
the count of CD68-positive cells and CD163-positive cells. These
results confirmed the activation of Kupffer cells by LPS as
reported previously (26). From
microarray analysis, Cd68 and Cd163 expression was
determined to be unaffected by LPS treatment despite increases in
the number of CD68- and CD163-positive cells as detected by
immunostaining. This discrepancy may reflect a difference between
mRNA and protein expression; however, further investigation is
required. As CD163 is a marker of M2-type macrophages (12,22),
CD163-positive cells may belong to M2-Kupffer cells (22). Thus, CD68-positive cells may denote
M1-type macrophages or Kupffer cells (27). A marked increase in the number of
CD68-positive cells by LPS treatment raises two possibilities: The
proliferation of CD68-positive cells in the liver or the migration
of CD68-positive cells to the liver from bone marrow (28,29).
The absence of alterations in Cd68 mRNA levels by LPS
treatment suggests the latter explanation as a more likely
possibility.
In the present study, Cxcl9 was significantly
induced by LPS treatment. Immunohistochemistry suggested that Cxcl9
was expressed by CD163-positive cells. Double staining for Cxcl9
and CD163 should be conducted to establish this possibility. Cxcl9
is a member of a family of ligands for the Cxcr3 receptor, which is
involved in chronic inflammation and cancer (13). Cxcl9 is also a biomarker of acute
cellular rejection after liver transplantation (30). Endothelial cell growth is
stimulated or inhibited depending on alternatively spliced variants
of Cxcr3 (31). Cxcl9 is expressed
in macrophages (32,33) and C-X-C motif chemokine receptor 3
(Cxcr3) promotes M2 macrophage polarization in human liver cancer
(14). Prostaglandin E2
inhibits CXCR3 ligand secretion induced by interferon-γ treatment
in human breast cancer cells (34).
Ptgds2 is the hematopoietic-type Ptgds and is
expressed in mast cells and macrophages (35). Ptgds2 is also expressed in skeletal
muscle cells with muscular dystrophy (36). Inhibition of Ptgds2 stimulates the
survival of muscle cells via the suppression of muscular cell death
(37). Lymphocytes isolated from
Ptgds2 knock-out mice exhibit hyperproliferation (15). The time courses of Ptgds2 staining
and cell proliferation had opposite profiles in our study. Thus,
Ptgds2 was suggested to suppress hepatocyte proliferation. Ptgds2
was not detected in the LPS or PH groups, but was expressed in
hepatocytes of the LPS + PH group. These results indicated that LPS
and cell proliferation signals may be required for the induction of
Ptgds2 expression in hepatocytes. The findings indicating that LPS
alone did not alter cell proliferation suggested that a delay in
cell proliferation in the LPS + PH group may not be due to the
direct effects of LPS on hepatocytes, but due to Kupffer cells
activated by LPS. Cxcl9 may be a candidate signaling molecule
released from Kupffer cells for Ptgds2 expression in hepatocytes;
however, because Cxcl9 was produced by LPS alone, Cxcl9 may not be
sufficient for Ptgds2 expression. Ptgds2 may be a target to prevent
a delay in cell proliferation after PH induced by LPS or bacterial
infections.
Acknowledgements
The authors would like to thank Ms. Yukie Fujita and
Ms. Sayumi Kubo (Department of Pathology and Bioscience, Hirosaki
University Graduate School of Medicine) for their technical
assistance in immunostaining, and Ms. Ryoko Seito, Mr. Hitoshi Kudo
and Ms. Ikumi Shirahama (Institute for Animal Experimentation,
Hirosaki University Graduate School of Medicine) for their
technical assistance for animal treatment.
Funding
The present study was partly supported by the Japan
Society for the Promotion of Science KAKENHI (grant no. 15K20845;
Grant-in-Aid for Young Scientists B). No additional external
funding was received for this study.
Availability of data and materials
All data generated or analyzed during the present
study are included in this published article.
Authors' contributions
YW, NK and ST conceived the idea and design of the
present study. YW, NK, TY and TS performed the animal experiments.
YW, KH and ST wrote the manuscript. YW, NK and ST discussed the
results and contributed to the final version of the manuscript. KH
performed the statistical analyses. All authors approved the final
version of the manuscript to be published.
Ethics approval and consent to
participate
All animal experiments were conducted strictly
according to ethical standards and approved by the Animal Ethical
Committee of Hirosaki University Graduate School of Medicine
(approval ID: M15041).
Patient consent for publication
Not applicable.
Competing interests
The authors declare that they have no competing
interests.
References
|
1
|
Preziosi ME and Monga SP: Update on the
mechanisms of liver regeneration. Semin Liver Dis. 37:141–151.
2017. View Article : Google Scholar : PubMed/NCBI
|
|
2
|
Hu J, Srivastava K, Wieland M, Runge A,
Mogler C, Besemfelder E, Terhardt D, Vogel MJ, Cao L, Korn C, et
al: Endothelial cell-derived angiopoietin-2 controls liver
regeneration as a spatiotemporal rheostat. Science. 343:416–419.
2014. View Article : Google Scholar : PubMed/NCBI
|
|
3
|
Marrone G, Shah VH and Bracia-Sancho J:
Sinusoidal communication in liver fibrosis and regeneration. J
Hepatol. 65:608–617. 2016. View Article : Google Scholar : PubMed/NCBI
|
|
4
|
Mabuchi A, Mullaney I, Sheard PW, Hessian
PA, Mallard BL, Tawadrous MN, Zimmermann A, Senoo H and Wheatley
AM: Role of hepatic stellate cell/hepatocyte interaction and
activation of hepatic stellate cells in the early phase of liver
regeneration in the rat. J Hepatol. 40:910–916. 2004. View Article : Google Scholar : PubMed/NCBI
|
|
5
|
DeLeve LD: Liver sinusoidal endothelial
cells and liver regeneration. J Clin Invest. 123:1861–1866. 2013.
View Article : Google Scholar : PubMed/NCBI
|
|
6
|
Miura T, Kimura N, Yamada T, Shimizu T,
Nanashima N, Yamana D, Hakamada K and Tsuchida S: Sustained
repression and translocation of Ntcp and expression of Mrp4 for
cholestasis after rat 90% partial hepatectomy. J Hepatol.
55:407–414. 2011. View Article : Google Scholar : PubMed/NCBI
|
|
7
|
Cuperus FJ, Claudel T, Gautherot J,
Halilbasic E and Trauner M: The role of canalicular ABC
transporters in cholestasis. Drug Metab Dispos. 42:546–560. 2014.
View Article : Google Scholar : PubMed/NCBI
|
|
8
|
Abad CL, Lahr BD and Razonable RR:
Epidemiology and risk factors for infection after living donor
liver transplantation. Liver Transpl. 23:465–477. 2017. View Article : Google Scholar : PubMed/NCBI
|
|
9
|
Jörger AK, Liu L, Fehlner K, Weisser T,
Cheng Z, Lu M, Höchst B, Bolzer A, Wang B, Hartmann D, et al:
Impact of NKT cells and LFA-1 on liver regeneration under subseptic
conditions. PLoS One. 11:e01680012016. View Article : Google Scholar : PubMed/NCBI
|
|
10
|
Liu H, Liao R, He K, Zhu X, Li P and Gong
J: The SMAC mimetic birinapant attenuates
lipopolysaccharide-induced liver injury by inhibiting the tumor
necrosis factor receptor-associated factor 3 degradation in Kupffer
cells. Immunol Lett. 185:79–83. 2017. View Article : Google Scholar : PubMed/NCBI
|
|
11
|
Meijer C, Wiezer MJ, Diehl AM, Schouten
HJ, Schouten HJ, Meijer S, van Rooijen N, van Lambalgen AA,
Dijkstra CD and van Leeuwen PA: Kupffer cell depletion by
Cl2MDP-liposomes alters hepatic cytokine expression and delays
liver regeneration after partial hepatectomy. Liver. 20:66–77.
2000. View Article : Google Scholar : PubMed/NCBI
|
|
12
|
Edin S, Wikberg ML, Dahlin AM, Rutegard J,
Oberg A, Oldenborg PA and Palmqvist R: The distribution of
macrophages with a M1 or M2 phenotype in relation to prognosis and
the molecular characteristics of colorectal cancer. PLoS One.
7:e470452012. View Article : Google Scholar : PubMed/NCBI
|
|
13
|
Billottet C, Quemener C and Bikfalvi A:
CXCR3, a double-edged sword in tumor progression and angiogenesis.
Biochim Biophys Acta. 1836:287–295. 2013.PubMed/NCBI
|
|
14
|
Liu RX, Wei Y, Zeng QH, Chan KW, Xiao X,
Zhao XY, Chen MM, Ouyang FZ, Chen DP, Zheng L, et al: Chemokine
(C-X-C motif) receptor 3-positive B cells link interleukin-17
inflammation to protumorigenic macrophage polarization in human
hepatocellular carcinoma. Hepatology. 62:1779–1790. 2015.
View Article : Google Scholar : PubMed/NCBI
|
|
15
|
Trivedi SG, Newson J, Rajakariar R,
Jacques TS, Hannon R, Kanaoka Y, Eguchi N, Colville-Nash P and
Gilroy DW: Essential role for hematopoietic prostaglandin D2
synthase in the control of delayed type hypersensitivity. Proc Natl
Acad Sci USA. 103:5179–5184. 2006. View Article : Google Scholar : PubMed/NCBI
|
|
16
|
National Research Council (US) Committee
for the Update of the Guide for the Care and Use of Laboratory
Animals, . Guide for the Care and Use of Laboratory Animals8th.
National Academies Press; Washington, DC: 2011
|
|
17
|
Livak KJ and Schmittgen TD: Analysis of
relative gene expression data using real-time quantitative PCR and
the 2(-Delta Delta C(T)) method. Methods. 25:402–408. 2001.
View Article : Google Scholar : PubMed/NCBI
|
|
18
|
Gant TW, Silverman JA, Bisgaard HC, Burt
RK, Marino PA and Thorgeirsson SS: Regulation of
2-acetylaminofluorene- and 3-methylcholanthrene-mediated induction
of multidrug resistance and cytochrome P450IA gene family
expression in primary hepatocyte cultures and rat liver. Mol
Carcinog. 4:499–509. 1991. View Article : Google Scholar : PubMed/NCBI
|
|
19
|
Bradford MM: A rapid and sensitive method
for the quantitation of microgram quantities of protein utilizing
the principle of protein-dye binding. Anal Biochem. 72:248–254.
1976. View Article : Google Scholar : PubMed/NCBI
|
|
20
|
Hsu SM, Raine L and Fanger H: Use of
avidin-biotin-peroxidase complex (ABC) in immunoperoxidase
techniques: A comparison between ABC and unlabeled antibody (PAP)
procedures. J Histochem Cytochem. 29:577–580. 1981. View Article : Google Scholar : PubMed/NCBI
|
|
21
|
Hebert GA: Ammonium sulfate fractionation
of sera: Mouse, hamster, guinea pig, monkey, chimpanzee, swine,
chicken, and cattle. Appl Microbiol. 27:389–393. 1974.PubMed/NCBI
|
|
22
|
Dixon LJ, Barnes M, Tang H, Pritchard MT
and Nagy LE: Kupffer cells in the liver. Compr Physiol. 3:785–797.
2013.PubMed/NCBI
|
|
23
|
Yovchev MI, Grozdanov PN, Zhou H, Racherla
H, Guha C and Dabeva MD: Identification of adult hepatic progenitor
cells capable of repopulating injured rat liver. Hepatology.
47:636–647. 2008. View Article : Google Scholar : PubMed/NCBI
|
|
24
|
Chang TH, Hakamada K, Toyoki Y, Tsuchida S
and Sasaki M: Expression of MRP2 and MRP3 during liver regeneration
after 90% partial hepatectomy in rats. Transplantation. 77:22–27.
2004. View Article : Google Scholar : PubMed/NCBI
|
|
25
|
Kordes C, Sawitza I, Götze S, Herebian D
and Häussinger D: Hepatic stellate cells contribute to progenitor
cells and liver regeneration. J Clin Invest. 124:5503–5515. 2014.
View Article : Google Scholar : PubMed/NCBI
|
|
26
|
Suzuki S, Nakamura S, Serizawa A,
Sakaguchi T, Konno H, Muro H, Kosugi I and Baba S: Role of Kupffer
cells and the spleen in modulation of endotoxin-induced liver
injury after partial hepatectomy. Hepatology. 24:219–225. 1996.
View Article : Google Scholar : PubMed/NCBI
|
|
27
|
Tacke F and Zimmermann HW: Macrophage
heterogeneity in liver injury and fibrosis. J Hepatol.
60:1090–1096. 2014. View Article : Google Scholar : PubMed/NCBI
|
|
28
|
Aldeguer X, Debonera F, Shaked A,
Krasinkas AM, Gelman AE, Que X, Zamir GA, Hiroyasu S, Kovalovich
KK, Taub R and Olthoff KM: Interleukin-6 from intrahepatic cells of
bone marrow origin is required for normal murine liver
regeneration. Hepatology. 35:40–48. 2002. View Article : Google Scholar : PubMed/NCBI
|
|
29
|
Nishiyama K, Nakashima H, Ikarashi M,
Kinoshita M, Nakashima M, Aosasa S, Seki S and Yamamoto J: Mouse
CD11b+Kupffer cells recruited from bone marrow accelerate liver
regeneration after partial hepatectomy. PLoS One. 10:e01367742015.
View Article : Google Scholar : PubMed/NCBI
|
|
30
|
Asaoka T, Marubashi S, Kobayashi S, Hama
N, Eguchi H, Takeda Y, Tanemura M, Wada H, Takemasa I, Takahashi H,
et al: Intragraft transcriptome level of CXCL9 as biomarker of
acute cellular rejection after liver transplantation. J Surg Res.
178:1003–1014. 2012. View Article : Google Scholar : PubMed/NCBI
|
|
31
|
Lasagni L, Francalanci M, Annunziato F,
Lazzeri E, Giannini S, Cosmi L, Sagrinati C, Mazzinghi B, Orlando
C, Maggi E, et al: An alternatively spliced variant of CXCR3
mediates the inhibition of endothelial cell growth induced by
IP-10, Mig, and I-TAC, and acts as functional receptor for platelet
factor 4. J Exp Med. 197:1537–1549. 2003. View Article : Google Scholar : PubMed/NCBI
|
|
32
|
Farber JM: A macrophage mRNA selectively
induced by gamma-interferon encodes a member of the platelet factor
4 family of cytokines. Proc Natl Acad Sci USA. 87:5238–5242. 1990.
View Article : Google Scholar : PubMed/NCBI
|
|
33
|
Metzemaekers M, Vanheule V, Janssens R,
Struyf S and Proost P: Overview of the mechanisms that may
contribute to the non-redundant activities of interferon-inducible
CXC chemokine receptor 3 ligands. Front Immunol. 8:19702018.
View Article : Google Scholar : PubMed/NCBI
|
|
34
|
Bronger H, Kraeft S, Schwarz-Boeger U,
Cerny C, Stöckel A, Avril S, Kiechle M and Schmitt M: Modulation of
CXCR3 ligand secretion by prostaglandin E2 and cyclooxygenase
inhibitors in human breast cancer. Breast Cancer Res. 14:R302012.
View Article : Google Scholar : PubMed/NCBI
|
|
35
|
Gandhi UH, Kaushal N, Ravindra KC, Hegde
S, Nelson SM, Narayan V, Vunta H, Paulson RF and Prabhu KS:
Selenoprotein-dependent up-regulation of hematopoietic
prostaglandin D2 synthase in macrophages is mediated through the
activation of peroxisome proliferator-activated receptor (PPAR)
gamma. J Biol Chem. 286:27471–27482. 2011. View Article : Google Scholar : PubMed/NCBI
|
|
36
|
Okinaga T, Mohri I, Fujimura H, Imai K,
Ono J, Urade Y and Taniike M: Induction of hematopoietic
prostaglandin D synthase in hyalinated necrotic muscle fibers: Its
implication in grouped necrosis. Acta Neuropathol. 104:377–384.
2002.PubMed/NCBI
|
|
37
|
Mohri I, Aritake K, Taniguchi H, Sato Y,
Kamauchi S, Nagata N, Maruyama T, Taniike M and Urade Y: Inhibition
of prostaglandin D synthase suppresses muscular necrosis. Am J
Pathol. 174:1735–1744. 2009. View Article : Google Scholar : PubMed/NCBI
|