Introduction
Hepatocellular carcinoma (HCC) is one of the most
common malignancies worldwide, ranking fifth among all malignant
tumors. According to previous reports, it is estimated that
~500,000–1,000,000 new cases of HCC are diagnosed annually, and HCC
ranks third in terms of mortality rate among all types of cancer
(1). Invasion, metastasis and
postoperative recurrence are the main causes of mortality in
patients with HCC, and they are also the key factors affecting
clinical treatment and prognosis. Due to its aggressive course and
propensity for metastasis and invasion, HCC is often diagnosed at
an advanced stage and is associated with a high mortality rate
(2). Previous studies have
demonstrated that aberrant activation of epithelial-to-mesenchymal
transition (EMT) is important in tumor cell invasion and
metastasis. EMT allows normal hepatic epithelial cells to undergo
multiple biochemical changes that enable them to assume a
mesenchymal phenotype, which includes enhanced migratory capacity,
invasiveness, increased resistance to apoptosis and a marked
increase in the production of extracellular matrix components
(3). It has been gradually
realized that EMT involves multiple molecular mechanisms and signal
transduction pathways, the hallmark of which is the downregulation
of cell adhesion molecule epithelial cadherin (E-cadherin) and the
upregulation of mesenchymal molecule vimentin (VIM). In addition, a
number of transcriptional factors have been identified as crucial
inducers of EMT, including the Snail homologues, the basic
helix-loop-helix and the zinc-finger E-box-binding homeobox (ZEB)
(4). ZEB1, also referred to as
TCF8 or dEF1, is a member of the zinc-finger family of proteins.
The zinc finger clusters at both sides of ZEB1 can bind to specific
sequences of DNA, thereby regulating the transcription of targeted
genes (5,6), which has emerged as a key event in
cancer progression. Numerous studies have demonstrated that
abnormal expression of ZEB1 in endometrial, colorectal and prostate
cancer has been associated with disease aggressiveness, low
differentiation, development of metastases and poor prognosis
(7–9). It has been demonstrated that, by
interacting with the E-box element within the proximal region of
the E-cadherin promoter, ZEB1 can affect its expression (10), which is crucial in the occurrence
and development, and in the metastasis and invasion of most types
of cancer (11). However, few
studies have examined the correlation between ZEB1 and VIM in HCC,
and the specific regulatory mechanism remains to be fully
elucidated. The aim of the present study was to investigate the
association between the expression of ZEB1 and VIM in HCC tissues
and adjacent normal tissues by immunohistochemistry and western
blotting. The study also aimed to detect the changes in the
biological behavior of Huh7 cells upon downregulation of the
expression of ZEB1 by small interfering RNA, in order to evaluate
the clinical relevance of the expression status of ZEB1 and VIM and
provide data for the prognosis and targeted therapy of HCC.
Patients and methods
Patients and tumor samples
Fresh surgical resection specimens of HCC and
adjacent normal tissues were collected from 80 patients with HCC at
The Central Hospital of Enshi Autonomous Prefecture (Enshi, China)
from January 2012 to January 2013. Curative resection was defined
as the removal of all identifiable tumor tissue with a clear
microscopic margin. None of the patients received any preoperative
therapy, for example, transcatheter arterial chemoembolization,
radiofrequency ablation or percutaneous ethanol injection. The
patients included 63 men and 17 women, ranging in age between 33
and 76 years, with a mean age of 56 years. The clinicopathological
variables, including the size of the primary tumor, vascular
invasion, intrahepatic metastasis, serum α-fetoprotein (AFP)
levels, liver cirrhosis, differentiation and
tumor-necrosis-metastasis (TNM) stage, are listed in Table I. Follow-up data following surgery
were obtained from all patients by measurement of the AFP levels
and ultrasound or computed tomography at least every 3 months. All
patients provided written informed consent to participate in the
present study, and the study protocol was approved by the Ethics
Committee of The Central Hospital of Enshi Autonomous
Prefecture.
 | Table I.Clinicopathological variables and the
expression of ZEB1 and VIM in hepatocellular carcinoma. |
Table I.
Clinicopathological variables and the
expression of ZEB1 and VIM in hepatocellular carcinoma.
|
|
| ZEB1 | VIM |
|---|
|
|
|
|
|
|---|
| Variable | Total no. (n=80) | High expression
(n=38) | Low expression
(n=42) | P-value | High expression
(n=33) | Low expression
(n=47) | P-value |
|---|
| Sex |
|
|
|
|
|
|
|
| Male | 63 | 30 | 33 | 0.967 | 24 | 39 | 0.270 |
|
Female | 17 | 8 | 9 |
| 9 | 8 |
|
| Age (years) |
|
|
|
|
|
|
|
|
<60 | 46 | 24 | 22 | 0.330 | 20 | 26 | 0.638 |
| ≥60 | 34 | 14 | 20 |
| 13 | 21 |
|
| Size of primary tumor
(cm) |
|
|
|
|
|
|
|
|
<5 | 49 | 21 | 28 | 0.296 | 22 | 27 | 0.405 |
| ≥5 | 31 | 17 | 14 |
| 11 | 20 |
|
| Vascular
invasion |
|
|
|
|
|
|
|
|
Present | 30 | 20 | 10 | 0.008 | 16 | 14 | 0.089 |
|
Absent | 50 | 18 | 32 |
| 17 | 33 |
|
| Intrahepatic
metastasis |
|
|
|
|
|
|
|
|
Present | 22 | 14 | 8 | 0.075 | 15 | 7 | 0.003 |
|
Absent | 58 | 24 | 34 |
| 18 | 40 |
|
| Serum AFP
(ng/ml) |
|
|
|
|
|
|
|
|
<200 | 48 | 25 | 23 | 0.315 | 18 | 30 | 0.404 |
|
≥200 | 32 | 13 | 19 |
| 15 | 17 |
|
| Liver
cirrhosis |
|
|
|
|
|
|
|
|
Present | 38 | 16 | 22 | 0.358 | 13 | 25 | 0.224 |
|
Absent | 42 | 22 | 20 |
| 20 | 22 |
|
|
Differentiation |
|
|
|
|
|
|
|
|
Well | 14 | 6 | 8 | 0.630 | 7 | 7 | 0.746 |
|
Moderate | 55 | 28 | 27 |
| 22 | 33 |
|
|
Poor | 11 | 4 | 7 |
| 4 | 7 |
|
| TNM stage |
|
|
|
|
|
|
|
|
I–II | 43 | 14 | 29 | 0.004 | 13 | 30 | 0.031 |
|
III–IV | 37 | 24 | 13 |
| 20 | 17 |
|
Immunohistochemistry
The HCC tissues and the adjacent normal tissues were
fixed in 10% formalin and embedded in paraffin. Serial 4-µm
sections were cut from each block. Following deparaffinization and
rehydration, heat-induced antigen retrieval by autoclave
pretreatment (120°C for 10 min) in citrate buffer solution (pH 6.0)
was performed. Endogenous peroxidase activity was deactivated by
soaking the sections in absolute methanol solution containing 3%
H2O2 for 5 min at room temperature.
Subsequently, the sections were treated with 5% bovine serum
albumin (Beyotime Institute of Biotechnology, Shanghai, China) for
30 min to block non-specific reactions, and were then incubated
with anti-ZEB1 antibody (cat. no. ab180905; 1:150 dilution; Abcam,
Cambridge, MA, USA) or anti-VIM antibody (cat. no. sc-80975; 1:50
dilution; Santa Cruz Biotechnology, Inc., TX, USA) at 4°C overnight
and washed with phosphate-buffered saline (PBS). Subsequently, the
biotin-labeled secondary antibody (cat. no. ab6789; 1:200 dilution;
Abcam) was added, and the sections were incubated at room
temperature for 1 h. Following the addition of horseradish
peroxidase (HRP)-conjugated streptavidin working solution and
washing with PBS, the sections were stained with
3,3′-diaminobenzidine and counterstained with hematoxylin for 15
min, followed by successive steeping in an ethanol solution with
hydrochloric acid and dilute ammonia for several minutes. Finally,
the sections were dehydrated through gradient alcohol solutions and
mounted in neutral balsam. The immunohistochemical staining was
evaluated by two experienced pathologists using an inverted
microscope. The results were assessed using a double-blind method
and were repeated at least three times.
Cell lines and culture
Two human HCC cell lines (Hep3B and Huh-7) and a
hepatoblastoma cell line (HepG2) (12) were obtained from American Type
Tissue Collection (Manassas, VA, USA). The HCCLM9 cell line was
obtained from the Liver Cancer Institute, Fudan University
(Shanghai, China) (13). All cells
were cultured in RPMI-1640 medium supplemented with 10% fetal
bovine serum (Gibco; Thermo Fisher Scientific, Inc., Waltham, MA,
USA) and 1% penicillin and streptomycin in a humidified atmosphere
of 5% CO2 at 37°C.
Western blot analysis
Proteins (20 µg) from the clinical HCC specimens and
cell lines were extracted with lysate buffer (Beyotime Institute of
Biotechnology), separated by 7.5% (for ZEB1) and 10% (for VIM)
SDS-PAGE and transferred onto PVDF membranes; protein concentration
was determined via a BCA kit (Beyotime Institute of Biotechnology).
Subsequently, the PVDF membrane was blocked with 5% skimmed milk
powder in TBST [10 mM Tris-HCl (pH 7.5), 150 mM NaCl and 0.1%
Tween-20] at room temperature for 1 h. The anti-ZEB1 antibody (cat.
no. sc-515797; 1:200 dilution) and the anti-VIM antibody (cat. no.
sc-66001; 1:200 dilution; both Santa Cruz Biotechnology, Inc.) were
added and incubated overnight at 4°C. Following washing with TBST
buffer, the HRP-labeled goat secondary antibody (cat. no. ab6789;
1:2,000 dilution; Abcam) was added and the membrane was incubated
at room temperature for 1 h. The proteins were visualized by
autoradiography using the ECL chemiluminescence reagent (PeptBio,
Wuhan, China). The relative expression of the protein of interest
was represented as the grayscale ratio of the protein to GAPDH, and
the results were analyzed by GraphPad Prism 5.0 software (GraphPad
Software, Inc., La Jolla, CA, USA).
Reverse transcription-quantitative
polymerase chain reaction (RT-qPCR) analysis
Total RNA was extracted utilizing TRIzol reagent
(Invitrogen; Thermo Fisher Scientific, Inc.), according to the
manufacturer's protocol. The RNA was reverse transcribed to cDNA
using a Takara RNA PCR kit (Takara Bio, Inc, Otsu, Japan). The qPCR
procedure was performed with iQ SYBR-Green Supermix (Bio-Rad
Laboratories, Inc., Hercules, CA, USA). A reaction volume of 20 µl
containing 1 µl of forward and reverse primers each, 2 µl cDNA, 6
µl ddH2O and 10 µl Supermix. All reactions were run in
triplicate on the iCycler IQ multi-color detection system (Bio-Rad
Laboratories, Inc.). The amplification profile was denaturation at
95°C for 5 min, followed by 40 cycles of denaturation at 95°C for
20 sec, annealing at 60°C for 20 sec and extension at 72°C for 20
sec. The PCR primers used were as follows: ZEB1 forward,
5′-TGCACTGAGTGTGGAAAAGC-3′ and reverse, 5′-TGGTGATGCTGAAAGAGACG-3′;
VIM forward, 5′-AAAACACCCTGCAATCTTTCAGA-3′, and reverse,
5′-GATTCCACTTTGCGTTCAAGGT-3′; β-actin forward,
5′-AGTTGCGTTACACCCTTTCTTGAC-3′, and reverse,
5′-GCTCGCTCCAACCGACTGC-3′. The comparative quantification cycle
(Cq) method (14) was applied to
quantify the expression levels of mRNA. The relative quantity was
calculated using the equation 2−∆Cq method where ΔCq =
(CqmRNA of interest-Cqβ-actin). For the
conventional PCR, the relative amount was represented as the
grayscale ratio of mRNA of interest to β-actin.
ZEB1 small interfering (si)RNA and
cell transfection
ZEB1 siRNA (siRNA-ZEB1) and negative control siRNA
(siRNA-NC) were purchased from Santa Cruz Biotechnology, Inc. and
were transfected into Huh-7 cells during the logarithmic growth
phase using Lipofectamine 2000 liposome (Invitrogen; Thermo Fisher
Scientific, Inc.) following the manufacturer's protocol. The cells
were incubated with the siRNA transfection complex for 12 h at
37°C, and were then harvested for mRNA and protein expression
changes, which were assayed via RT-qPCR and western blot analyses,
at 12 h.
In vitro cell proliferation assay
Using a 96-well plate, a total of 8×10³
Huh-7 cells were seeded into each well and incubated for 18 h.
WST-8 (10 µl) from the Cell Counting kit-8 (CCK-8; Boster
Biological Technology, Wuhan, China) was then added to each well.
Following incubation at 37°C in 5% CO2 for 0.5, 1, 2, 3
and 4 h, the absorbance of each sample was measured at a wavelength
of 450 nm.
Bromodeoxyuridine (BrdU)-labeling
assay
The Huh-7 cells were seeded on a slide and incubated
in culture medium with or without siRNA-ZEB1 transfection for 1
day. BrdU (10 µM; Sigma-Aldrich; Merck KgaA, Darmstadt, Germany)
was added to the culture for 1 h. The cells were fixed with 4%
paraformaldehyde and were then exposed to ice-cold methanol for 2
min, incubated in freshly prepared 2 M HCl for 1 h at room
temperature, and then incubated in 0.1 M sodium borate for 2 min.
Finally, immunocytochemistry for the BrdU-labeling of proliferative
Huh-7 cells was performed, and images were captured using a Zeiss
epifluorescence microscope with a charge-coupled device camera and
processed using Axiovert software (v 4.9.1; both Zeiss AG,
Oberkochen, Germany).
In vitro invasion assay
Transwell chambers precoated with Matrigel (BD
Biosciences, San Jose, CA, USA) were used to perform the invasion
assay. The Huh-7 cells were cultured in serum-free medium in the
upper chambers of a Transwell plate (Corning Inc., Corning, NY,
USA), separated from the lower chambers with permeable 8.0-µm
polycarbonate membranes. Medium supplemented with 10% fetal bovine
serum was added into the lower chambers as a chemoattractant. After
24 h of incubation at 37°C, those cells which had invaded through
the membrane were fixed with 75% ethanol and stained with 0.1%
crystal violet solution. The numbers of stained cells were manually
counted under an inverted microscope in five different fields of
each filter. At least three independent experiments were
performed.
In vitro migration assay
The Huh-7 cells were cultured in 6-well plates
(seeded at a density of 1×10⁶ cells/well). A wound was
created in the confluent cell monolayer using a sterile 10-µl
pipette tip and incubated in serum-free medium for 60 h. The
migration of cells into the wound and recovery of the monolayer
were assessed and images were captured every 12 h up to 60 h using
a phase contrast microscope.
Construction of recombinant
plasmid
The section containing the VIM promoter region was
obtained by PCR as aforementioned using VIM-promoter forward and
VIM-promoter reverse primers (Table
II). The putative binding sites for ZEB1 were predicted using
the JASPAR database (http://jaspar.genereg.net/) and the results are shown
in Table III. The primers were
designed to amplify these predicted sites, and the restriction
sites for EcoRI and BamHI were added into these
sequences (Table II). The
thermocycling conditions comprised denaturation at 95°C for 10 min,
followed by 40 cycles of denaturation at 95°C for 30 sec, annealing
at 60°C for 30 sec and extension at 72°C for 30 sec. The PCR
products were digested by EcoRI and BamHI and ligated
into the pEZX-PG02 vector (GeneCopoeia, Inc., Rockville, MD, USA)
using T4 DNA ligase (Takara Bio, Inc.). Subsequently, E.
coli DH5α cells were transformed with these products and
cultured on Luria-Bertani medium containing kanamycin (all Cwbio
Biotechnology, Inc., Beijing, China), and the plates were incubated
at 37°C for 20 h. Individual colonies were screened and grown in
the kanamycin-containing liquid medium overnight. Subsequently, the
plasmids were extracted, followed by purification and further
sequencing of the inserted sequences. A QuikChange Multi
Site-Directed Mutagenesis kit (Stratagene; Agilent Technologies,
Inc., La Jolla, CA, USA) was utilized to construct the mutant
pEZX-PG02-VIM promoter plasmids prior to the sequencing
analysis.
| Table II.Primers used in the present
study. |
Table II.
Primers used in the present
study.
| Name | Sequence
(5′-3′) |
|---|
|
EcorI-VIM-promoterFor |
cggaattcAGATCTTGTTTAAAAAGTTGGGT |
|
VIM-mut1-promoterRev |
GTCCGCCCCAGACCCGCGGGCAAAGGAGCGGGAAG |
|
VIM-mut1-promoterFor |
TGCCCGCGGGTCTGGGGCGGACACCGCAGCCCCGAGACCGCC |
|
BamHI-VIM-promoterRev |
cgcggatccGGCTGCGGAGGGTGGCGATGGCCT |
|
VIM-mut2-promoterRev |
GCCCACCCCTGGGGGCGCCCTCGAGCCTT |
|
VIM-mut2-promoterFor |
GAGGGCGCCCCCAGGGGTGGGCCCCACCCTCCCCGCTTCTCGCT |
|
VIM-promoterFor |
AGTTACTTAAGCTCGGGCCC |
|
VIM-promoterRev |
TTGTTCTCGGTGGGCTTGGC |
| Table III.Results of prediction. |
Table III.
Results of prediction.
| Model ID | Model name | Score | Relative score | Start | End | Strand | Predicted site
sequence |
|---|
| MA0103.2 | ZEB1 | 4.883 |
0.828309335350541 | 768 | 776 | 1 | CCCCGCCTG |
| MA0103.2 | ZEB1 | 4.883 |
0.828309335350541 | 1,023 | 1,031 | 1 | CCCCACCCG |
Plasmid transfection and luciferase
reporter assay
The Huh-7 cells were seeded on 48-well plates
(5×10⁴ cells/ml). After 24 h, the cells were treated
with Opti-MEM reduced serum medium (Invitrogen; Thermo Fisher
Scientific, Inc.) in preparation for transfection. Lipofectamine
2000 reagent was used according to the manufacturer's protocol.
After 48 h, the cells were harvested for luciferase detection using
the GLuc Assay kit (GeneCopoeia, Inc.). All values were obtained
from at least three independent repetitions of the
transfection.
Statistical analysis
Continuous variables were compared using the
Kruskal-Wallis test and categorical data were compared using the
χ2 or Fisher's exact tests. The Kaplan-Meier method was
used for survival analysis, and differences in survival were
estimated using the log-rank test. Multivariate analysis of
prognostic factors for survival was performed using a Cox logistic
regression model. All statistical analyses were performed with
GraphPad Prism 5.0 software. P<0.05 was considered to indicate a
statistically significant difference.
Results
Expression of ZEB1 and VIM in HCC
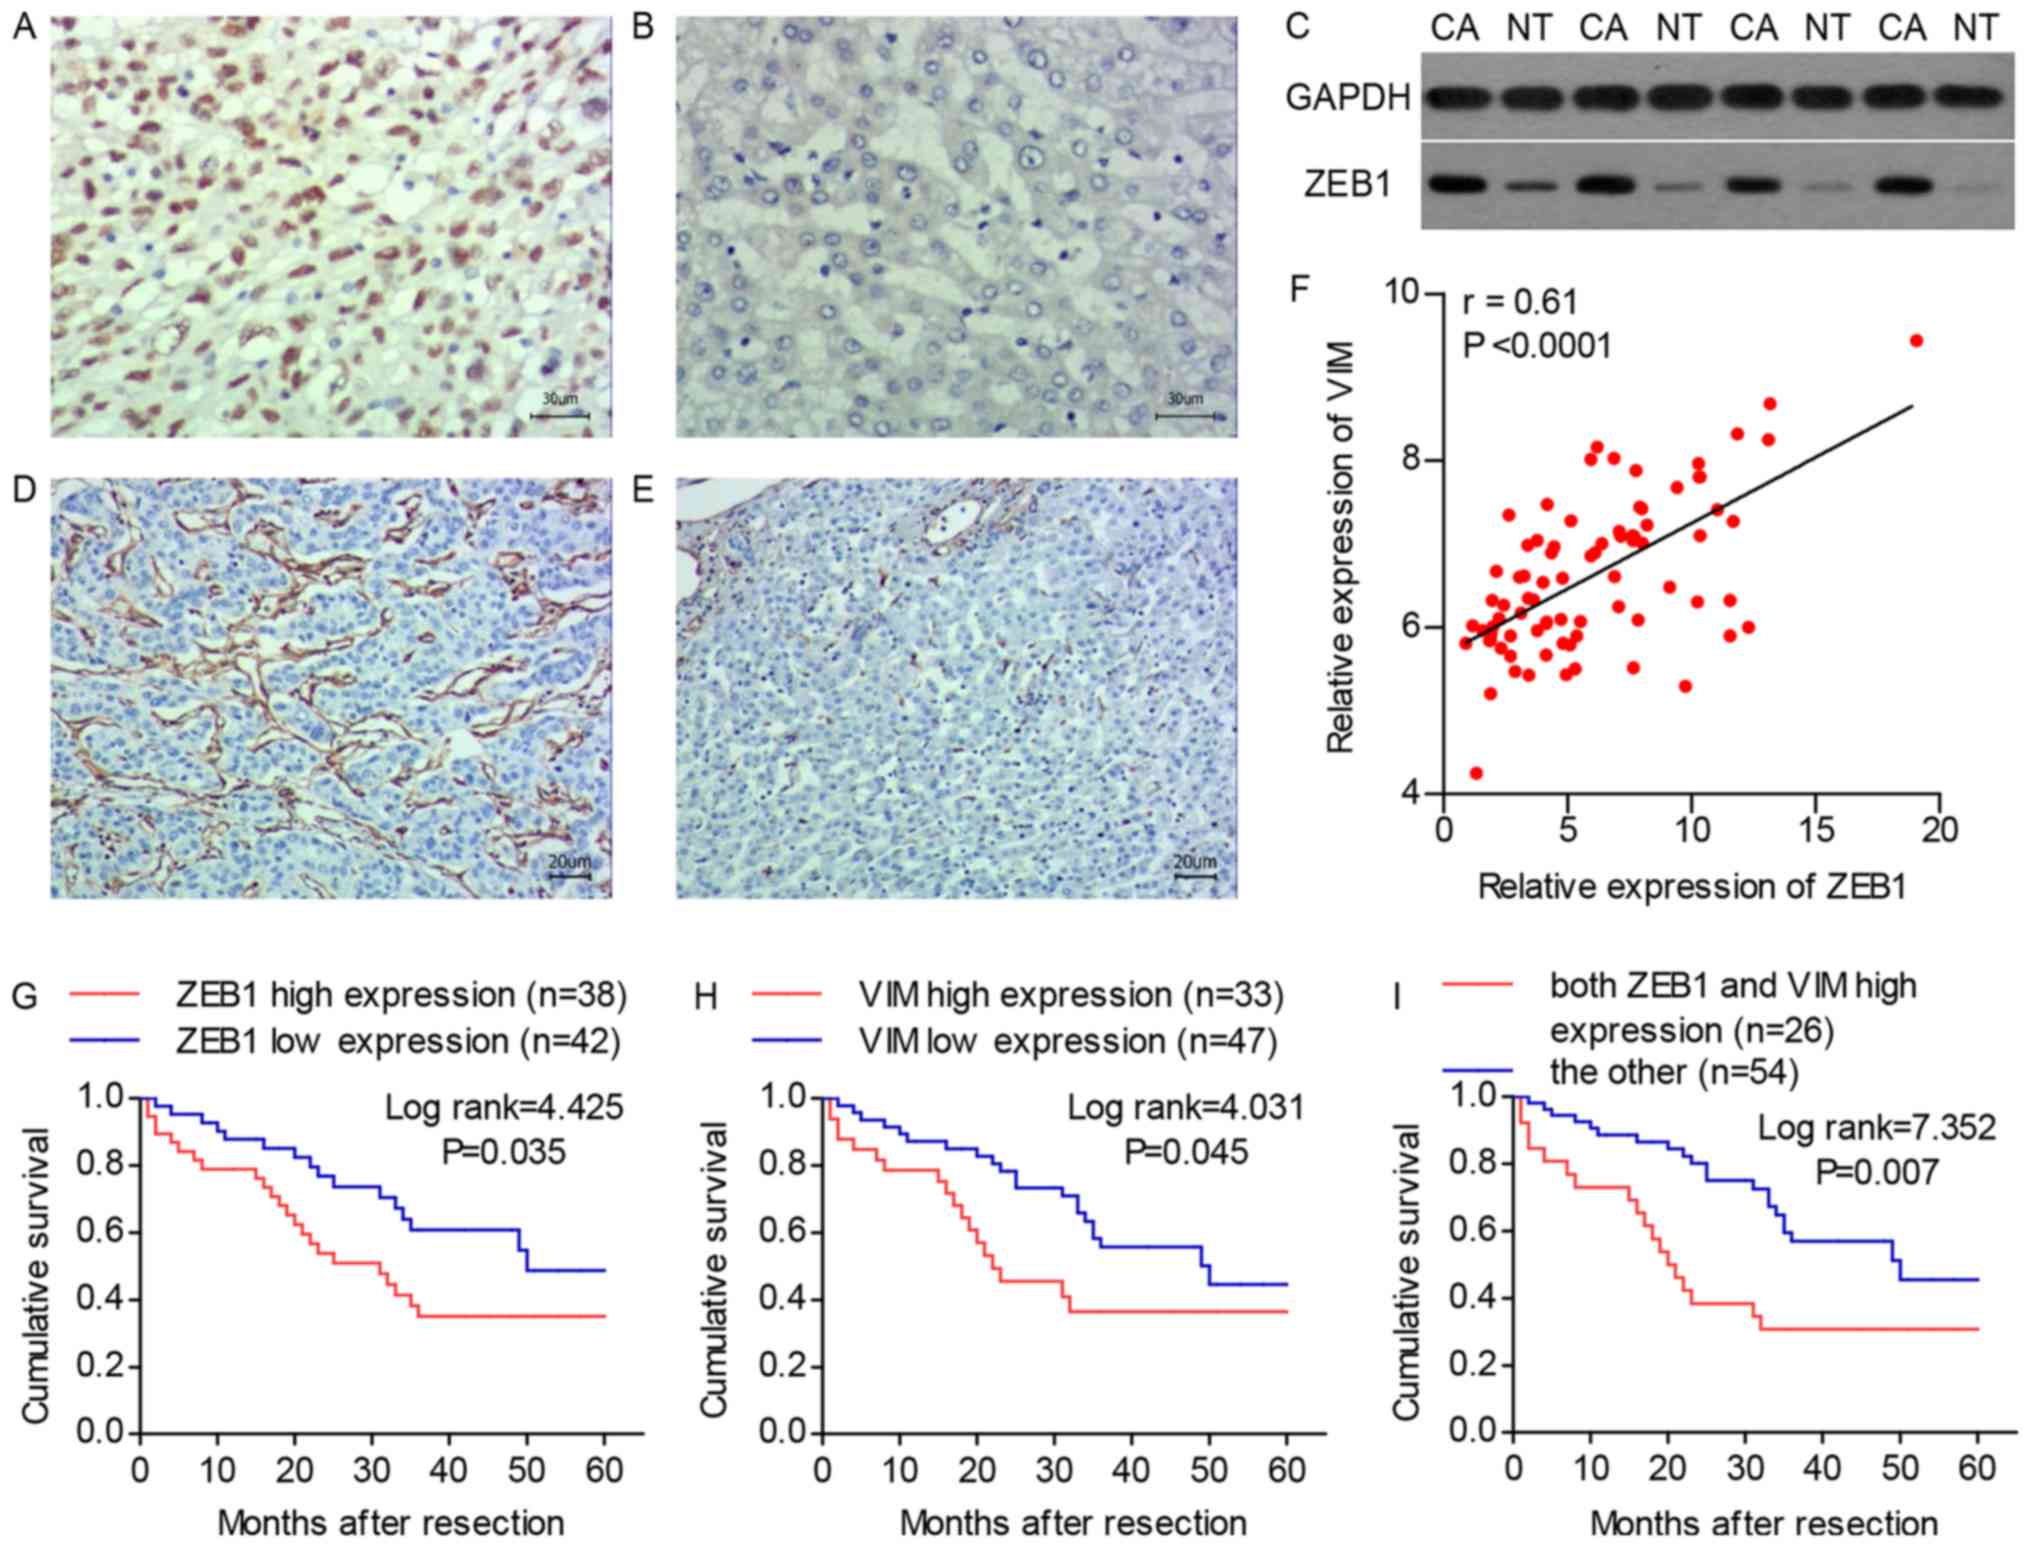
The results of the immunohistochemistry revealed
that the protein expression level of the ZEB1 was higher in the
tumor tissues compared with that in the adjacent normal tissues and
was primarily localized in the nucleus (Fig. 1A and B). This result was confirmed
by western blot analysis (Fig.
1C). According to the expression level of ZEB1, the HCC tissue
specimens were divided into four groups: Absent (n=42), 1–5%
(n=25), 6–10% (n=10) and >10% (n=3). The expression of ZEB1 was
defined as high if at least 1% of HCC cells exhibited nuclear
staining (n=38; 47.5%), or as low if there were no stained HCC
cells (n=42; 52.5%). The expression of VIM was detected in the
extracellular matrix and categorized by comparing its level in HCC
tissues with that in adjacent normal tissues. The HCC tissues with
a higher staining intensity compared with that of adjacent normal
tissues were deemed to have high expression (n=33; 41.3%; Fig. 1D), whereas those with a staining
intensity equal to or weaker than that in the adjacent normal
tissues were deemed to have low expression (n=47; 58.7%; Fig. 1E). The RT-qPCR analysis
demonstrated that the expression of ZEB1 was significantly
correlated with the expression of VIM (Fig. 1F). The correlations between
immunohistochemical expression and clinicopathological variables
are shown in Table I. A high
expression of ZEB1 was significantly associated with vascular
invasion (P=0.008) and TNM stage (P=0.004). Similarly, a high
expression of VIM was significantly correlated with intrahepatic
metastasis (P=0.003) and TNM stage (P=0.031). The overall survival
rates following surgery based on the expression of ZEB1 and VIM are
shown in Fig. 1G and H.
Kaplan-Meier analysis demonstrated that a high expression of ZEB1
was significantly associated with a poor overall survival rate (log
rank=4.425; P=0.035) and the overall survival rate was
significantly higher in the low-VIM expression group compared with
that in the high-VIM expression group (log rank=4.031; P=0.045). In
addition, a high expression of both ZEB1 and VIM was compared with
other expression pattern combinations, and the former group
exhibited a significantly poorer overall survival rate (log
rank=7.352; P=0.007; Fig. 1I).
Protein and mRNA expression of VIM and
of ZEB1 in different liver cancer cell lines
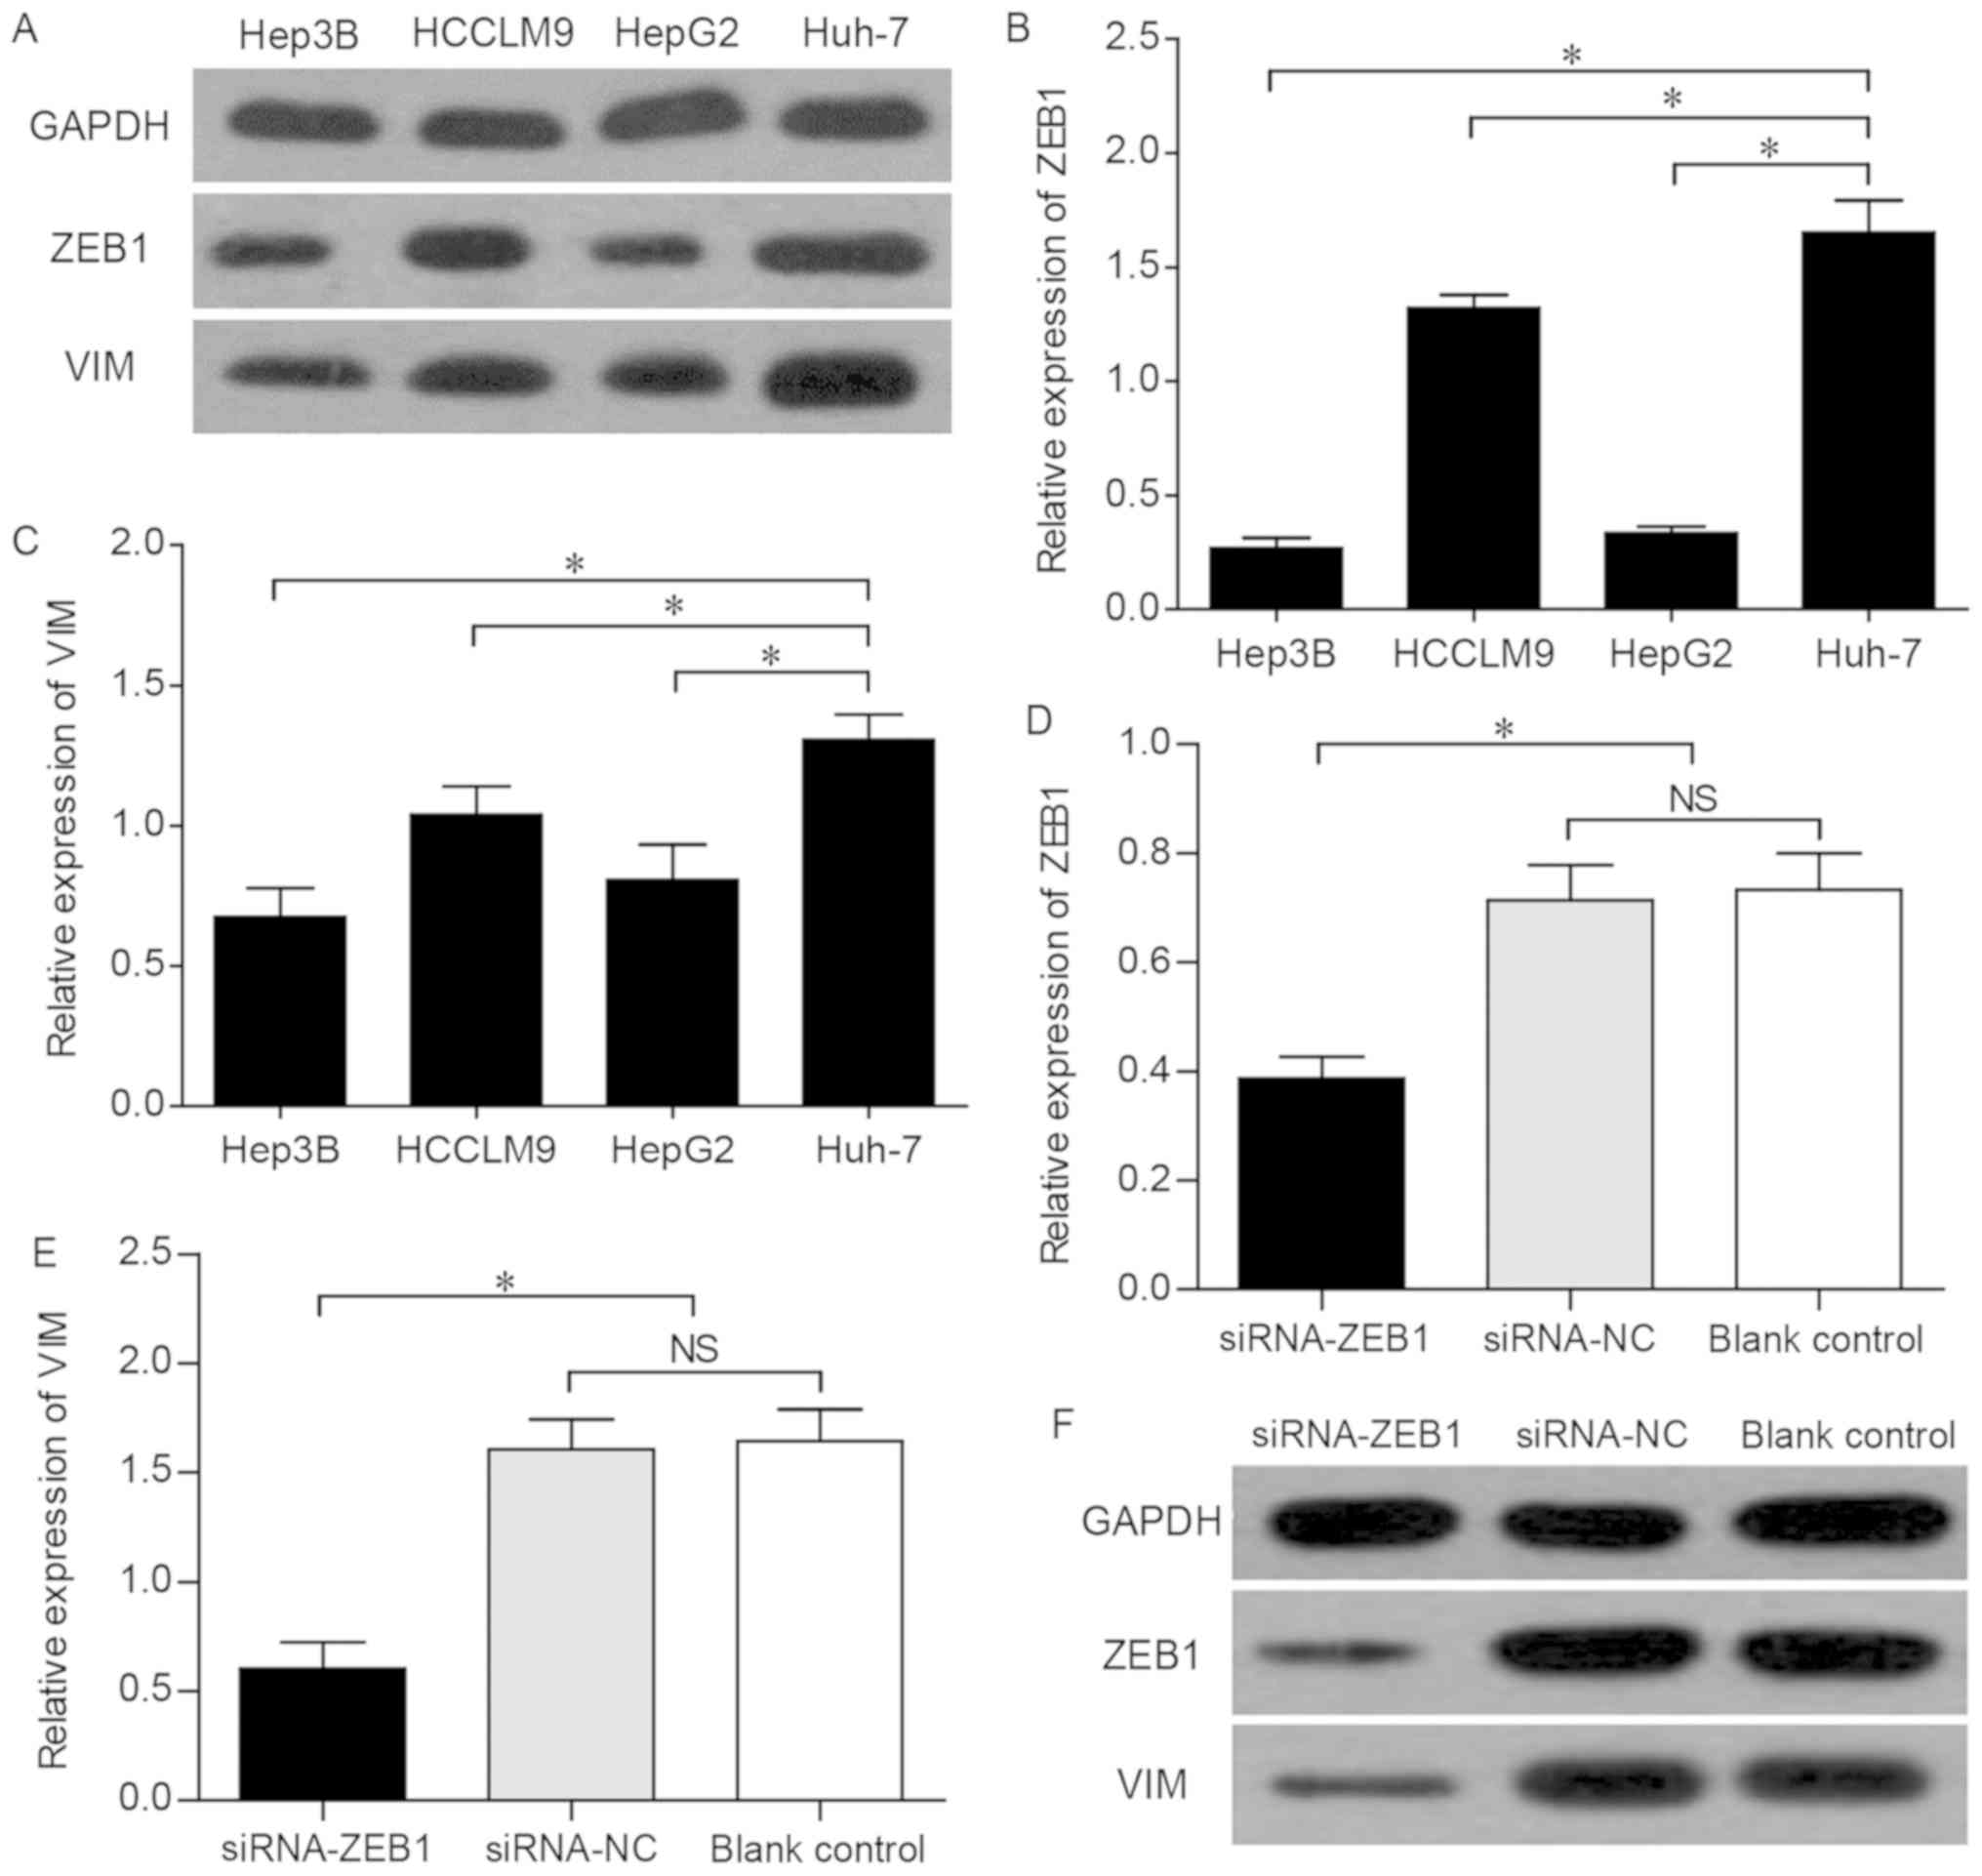
The western blot analysis revealed that ZEB1 and VIM
exhibited the highest expression levels in Huh-7 cells (Fig. 2A). In addition, the RT-qPCR
analysis revealed that Huh-7 cells expressed significantly higher
levels of ZEB1 and VIM compared with other HCC cell lines (Fig. 2B and C). These data confirmed that
the expression trend of VIM was consistent with that of ZEB1 in
different liver cancer cell lines.
Effects of ZEB1 interference on the
expression of VIM
To assess the possible effect of ZEB1 on the
expression of VIM, siRNAs were used to knockdown ZEB1 in Huh-7
cells, in which the expression of ZEB1 was found to be high, as
mentioned above. The Huh-7 cells were divided into three groups:
The siRNA-ZEB1 transfected group, the siRNA-NC group and the blank
control group. The knockdown of ZEB1 was confirmed by conventional
PCR, which revealed that, compared with that in the siRNA-NC and
the blank control groups, the mRNA expression level of ZEB1 in the
Huh-7 cells of the siRNA-ZEB1-transfected group was significantly
decreased (P<0.05; Fig. 2D),
indicating that the interference effect of siRNA on ZEB1 was
effective and specific. Subsequently, the siRNA-ZEB1-transfected
group was found to be associated with a significantly lower mRNA
expression of VIM compared with that in the two other groups
(P<0.05; Fig. 2E). Furthermore,
western blot analysis demonstrated that the successful interference
led to marked downregulation of the expression of ZEB1 and VIM
(P<0.05; Fig. 2F), suggesting
that the expression of VIM was subject to regulation by ZEB1.
Effects of ZEB1 interference on cell
proliferation in vitro
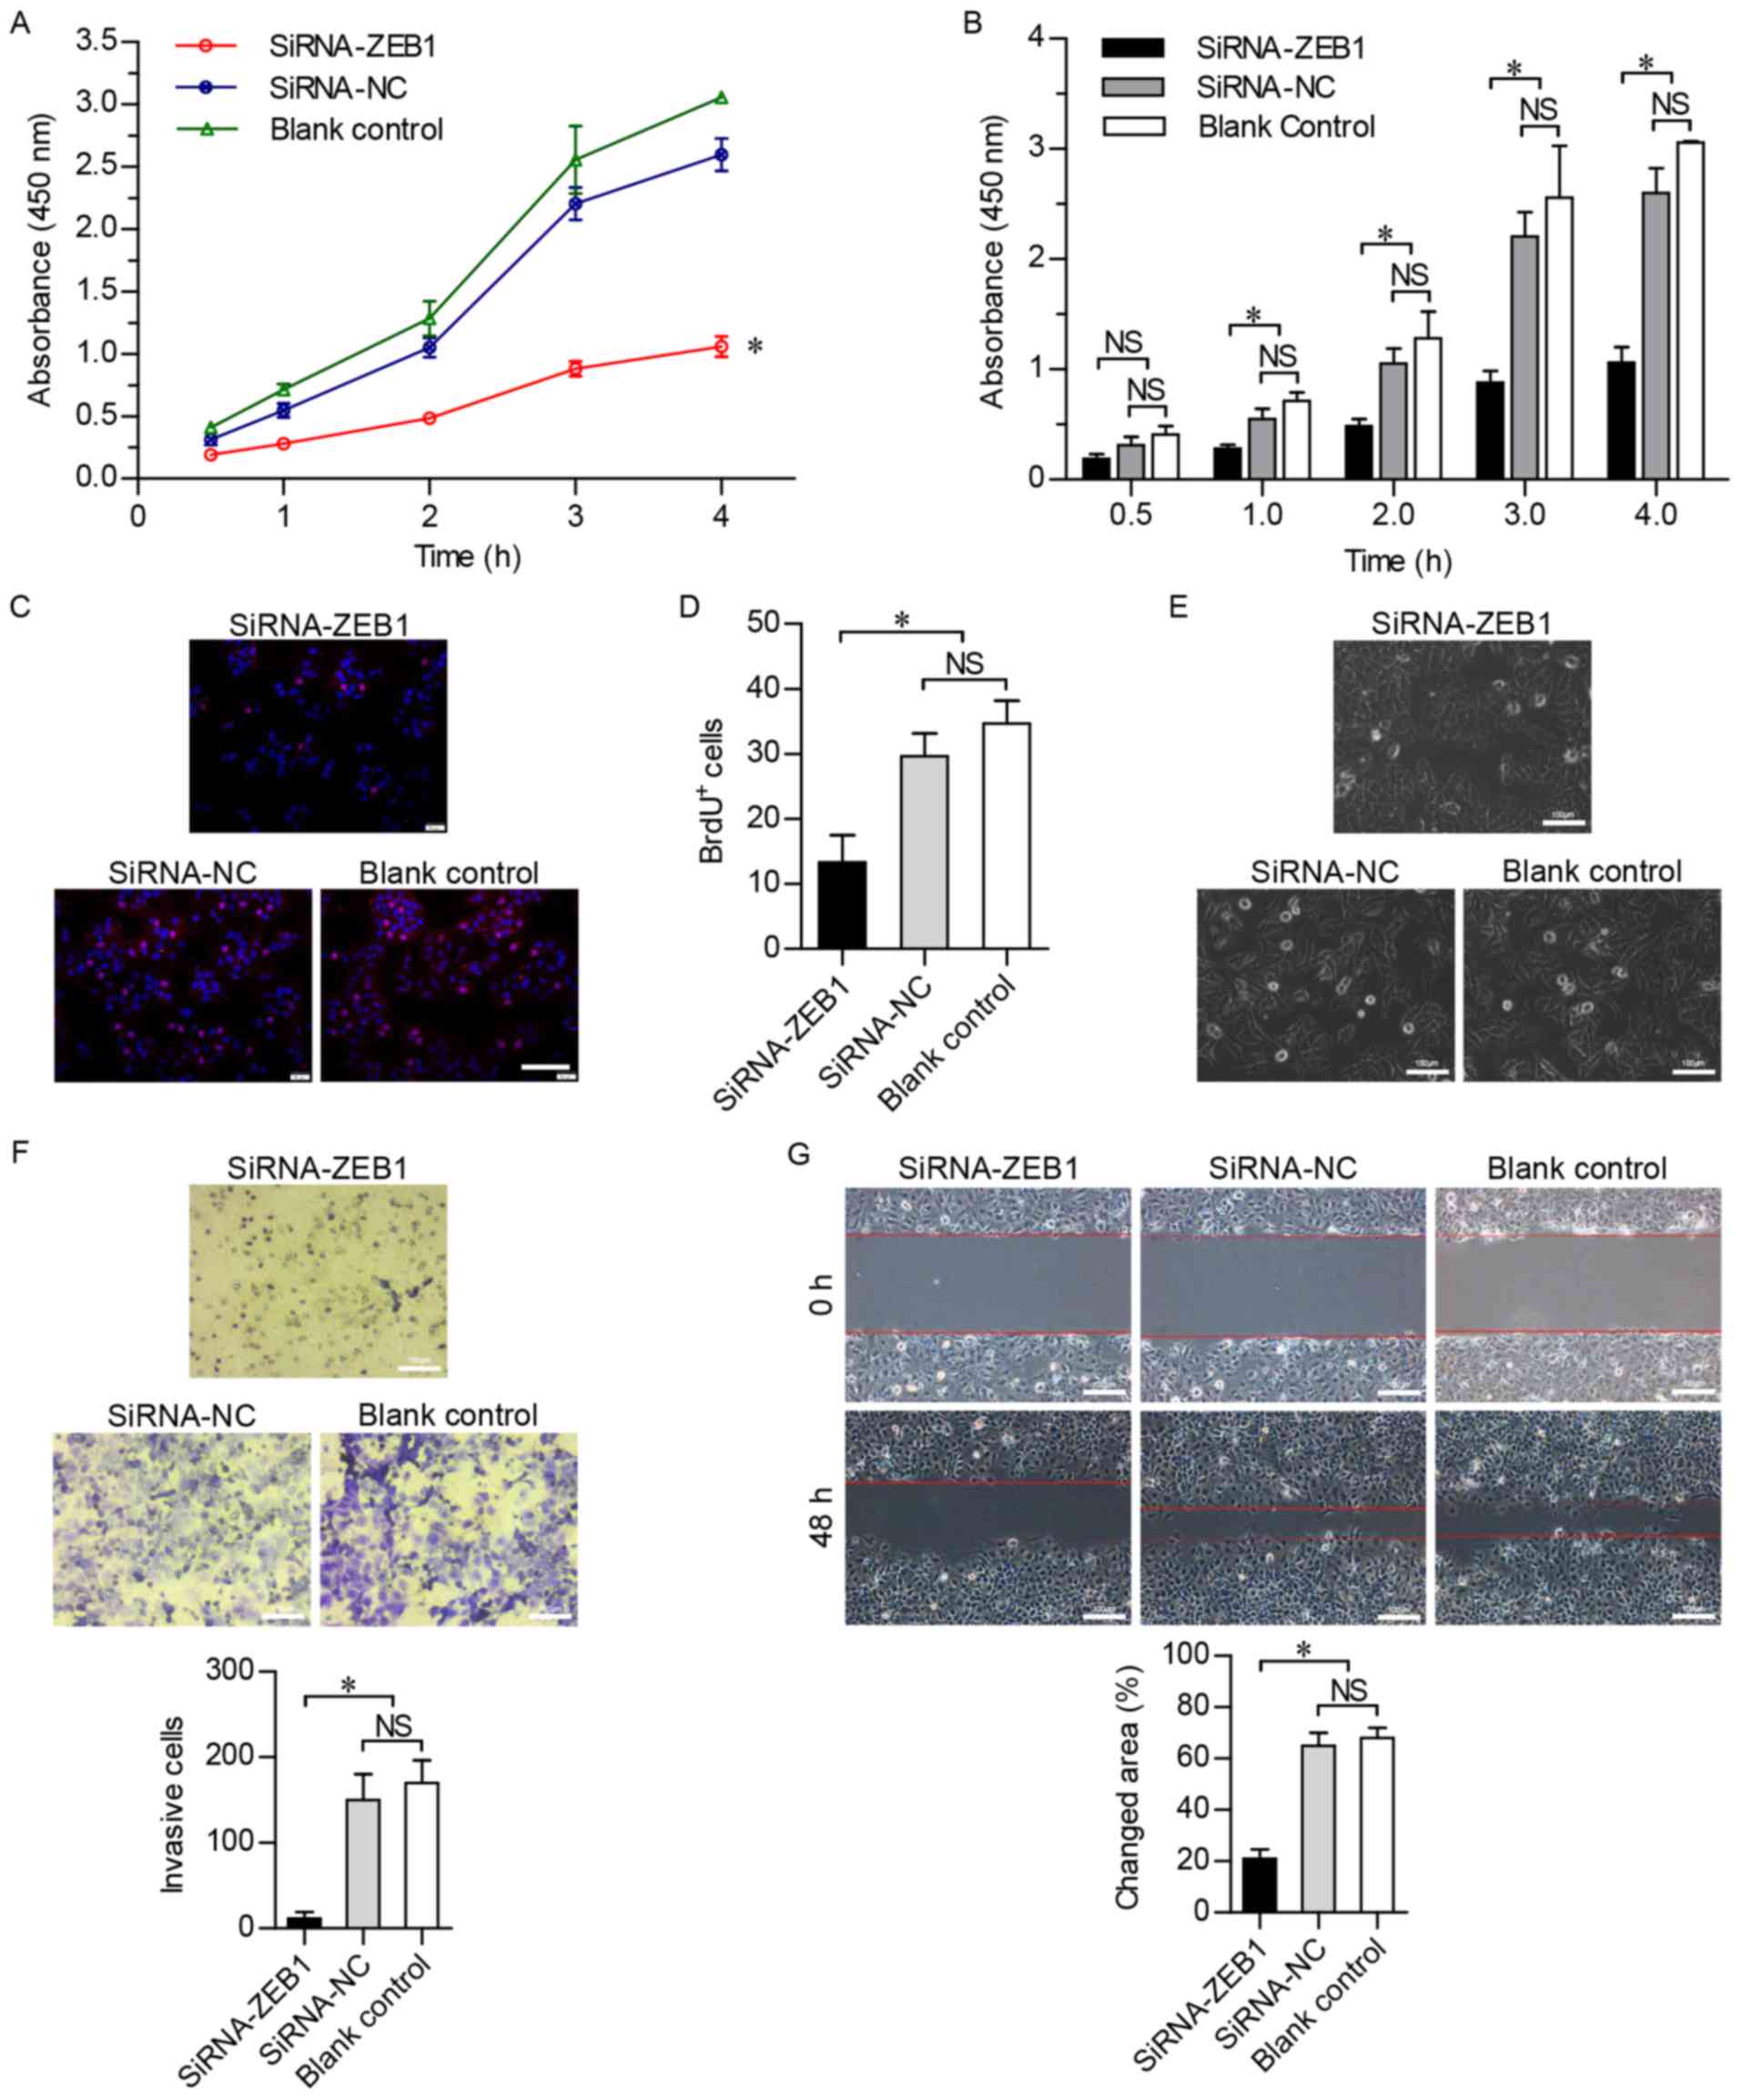
To investigate the effect of the suppression of ZEB1
on cell viability, a CCK-8 assay was used over a period of 4 h, and
cell viability was found to be significantly lower in the
siRNA-ZEB1-transfected group compared with that in the other two
groups (P<0.05; Fig. 3A and B),
indicating that cell viability was suppressed by the knockdown of
ZEB1. In addition, the BrdU-labeling assay revealed that DNA
synthesis was inhibited in the siRNA-ZEB1-transfected Huh-7 cells
(P<0.05; Fig. 3C and D). These
results confirmed that cell proliferation was markedly inhibited by
silencing ZEB1.
Effects of ZEB1 interference on
invasion and migration in vitro
The Huh-7 cells transfected with siRNA-ZEB1 had an
oval shape (Fig. 3E), suggesting
that the knockdown of ZEB1 prevented the HCC cells from undergoing
EMT. To further verify whether ZEB1 inhibited the invasion and
migration of HCC cells, the in vitro invasiveness of Huh-7
cells was detected using the Transwell invasion chamber assay.
Crystal violet staining revealed that the number of Huh-7 cells
invading through the polycarbonate membrane of the Transwell
invasion chamber was significantly lower in the
siRNA-ZEB1-transfected group (P<0.05). No significant difference
in invasiveness was found between the siRNA-NC and the blank
control groups (Fig. 3F). In
addition, wound-healing assays were performed to investigate the
cell migration ability in the three groups, revealing that the
migration of the siRNA-ZEB1-transfected cells was significantly
slower compared with that in the other two groups at 48 h
post-wounding (Fig. 3G). These
results demonstrated that downregulation of the ZEB1 gene
suppressed the motility of Huh-7 cells.
Construction and identification of the
recombinant plasmid
According to the results of prediction (Table III), two types of mutational
pEZX-PG02-VIM promoter plasmids (pEZX-PG02-VIM-mut1 and
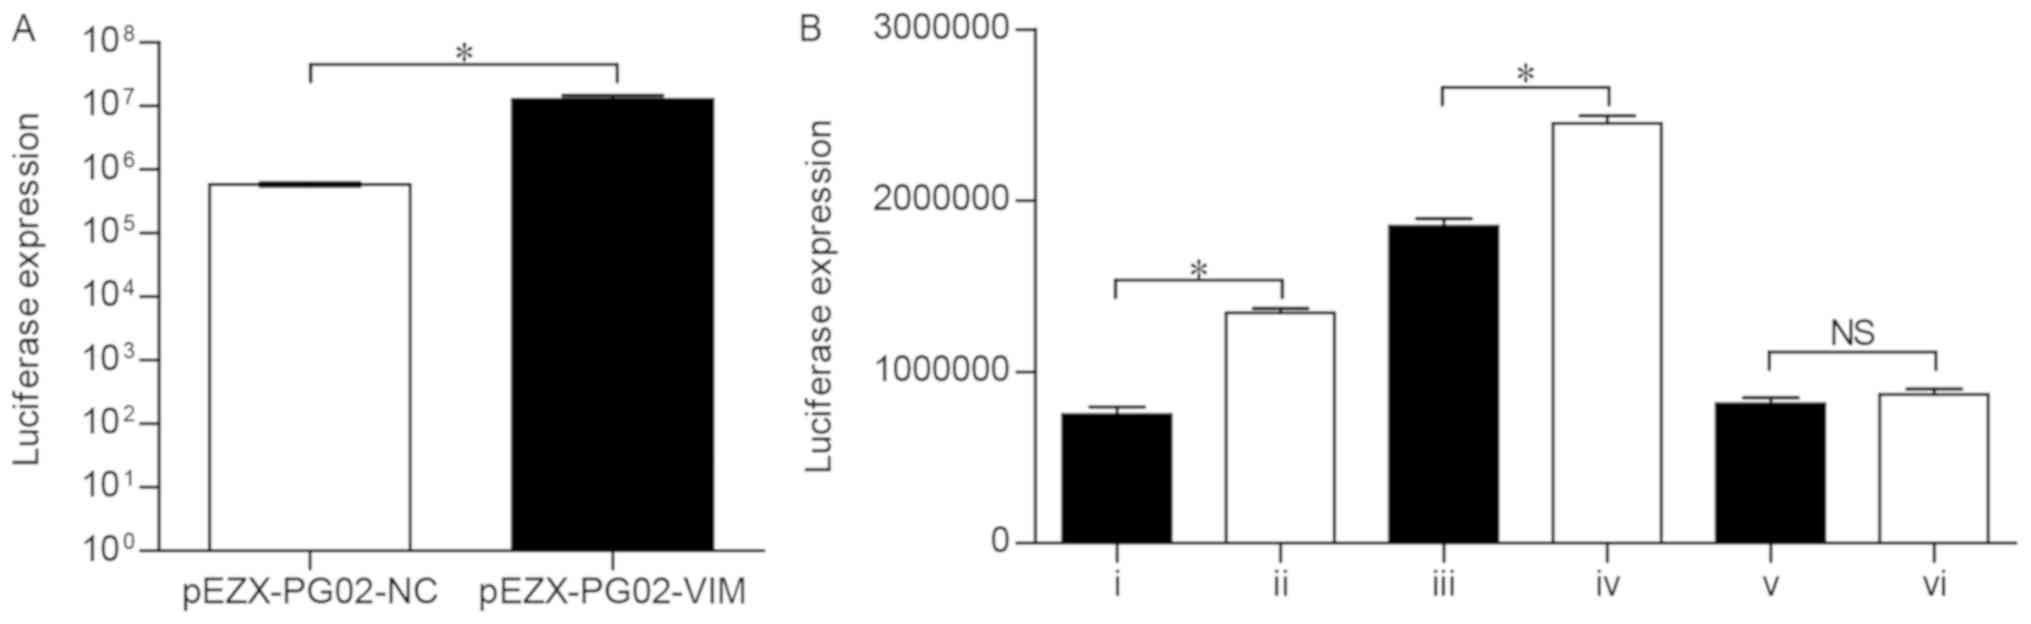
pEZX-PG02-VIM-mut2) were constructed. To verify the activity of the
pEZX-PG02-VIM promoter vector, the recombinant plasmid was
transfected into Huh-7 cells and the luciferase expression was
detected using a fluorescent microscope. Compared with the
pEZX-PG02-NC group, the cells containing the pEZX-PG02-VIM
recombinant plasmid exhibited significantly higher luciferase
activity (P<0.05; Fig. 4A),
indicating that the VIM promoter sequence can be bound and
activated in Huh-7 cells.
Effects of ZEB1 interference on VIM
promoter activity
To confirm that ZEB1 has the ability to regulate the
expression of VIM and simultaneously identify the binding sites in
the VIM promoter sequence, six categories of co-transfection were
conducted: i) siRNA-ZEB1+pEZX-PG02-VIM; ii) siRNA-NC+pEZX-PG02-VIM;
iii) siRNA-ZEB1+pEZX-PG02-VIM-mut1; iv)
siRNA-NC+pEZX-PG02-VIM-mut1; v) siRNA-ZEB1+pEZX-PG02-VIM-mut2; vi)
siRNA-NC+pEZX-PG02-VIM-mut2; subsequently, the luciferase
expression was detected three times in each group (Table IV). The luciferase activity in the
siRNA-ZEB1+pEZX-PG02-VIM group was significantly lower than that in
the siRNA-NC+pEZX-PG02-VIM group (P<0.0001; Fig. 4B), which demonstrated that, when
the Huh-7 cells were transfected with siRNA-ZEB1, the VIM promoter
activity markedly decreased. Therefore, the downregulation of ZEB1
markedly reduced the transcription of the VIM gene. Compared with
the siRNA-ZEB1+pEZX-PG02-VIM-mut1 group, the
siRNA-NC+pEZX-PG02-VIM-mut1 group was associated with significantly
higher luciferase activity (P<0.0001; Fig. 4B). More specifically, ZEB1 was able
to regulate the VIM-mut1 promoter activity. However, the results
revealed no statistically significant difference in luciferase
activity between the siRNA-ZEB1+pEZX-PG02-VIM-mut2 and
siRNA-NC+pEZX-PG02-VIM-mut2 groups (P>0.05; Fig. 4B), indicating that ZEB1 did not
lead to activation of the VIM-mut2 promoter.
| Table IV.Luciferase activity of the
co-transfection groups. |
Table IV.
Luciferase activity of the
co-transfection groups.
|
| Luciferase
expression (AU) |
|---|
|
|
|
|---|
| Group | Test 1 | Test 2 | Test 3 |
|---|
|
siRNA-ZEB1+PG02-VIM | 707,230 | 753,450 | 794,160 |
|
siRNA-NC+PG02-VIM | 1,320,010 | 1,370,250 | 1,344,110 |
|
siRNA-ZEB1+PG02-VIM-mut1 | 18,51,070 | 1,894,100 | 1,803,880 |
|
siRNA-NC+PG02-VIM-mut1 | 2,454,300 | 2,401,670 | 2,495,070 |
|
siRNA-ZEB1+PG02-VIM-mut2 | 833,960 | 836,770 | 774,770 |
|
siRNA-NC+PG02-VIM-mut2 | 877,170 | 897,260 | 831,260 |
Discussion
EMT is considered to be a crucial step in tumor
aggressiveness, oncogenic progression and cancer metastasis
(15). ZEB1 has been identified to
serve a decisive role in the induction of EMT and enhancement of
the invasive and migratory phenotype in various tumor cell lines
(16–18). The present study investigated the
role of ZEB1 in HCC and reported a correlation between ZEB1 and
VIM. The results of immunohistochemistry, western blotting, cell
proliferation, invasion and migration assays in vitro
revealed that a high expression of ZEB1 was significantly
associated with the malignant progression of HCC. Simultaneously,
ZEB1 silencing led to attenuation of the malignant biological
behavior of HCC cells. Therefore, it may be concluded that the
expression of ZEB1 is closely associated with tumorigenesis and it
may be a biomarker for the malignant phenotype of HCC, which is of
considerable value in the monitoring of tumor progression,
treatment evaluation and prediction of prognosis. With regard to
its clinical application, a series of scientific and clinical
trials is warranted for the assessment of this biomarker. Few
studies have investigated the association between the expression of
ZEB1 and VIM, and the specific regulatory relationship remains to
be elucidated at present. The present study demonstrated a
significant positive correlation between the expression of ZEB1 and
VIM in the immunohistochemical analysis. Subsequently, the
expression levels of ZEB1 and VIM were detected in liver cancer
cell lines, including three HCC cell lines (Hep3B, HCCLM9 and
Huh-7) and a hepatoblastoma cell line (HepG2). It was observed that
the expression trend of VIM was entirely consistent with that of
ZEB1 in the liver cancer cell lines at the mRNA and protein levels.
As ZEB1 and VIM exhibited the highest expression levels in Huh-7
HCC cells, the subsequent experiments were performed using Huh-7
cells. Mechanistically, a significant downregulation of VIM was
observed following the successful silencing of ZEB1, which
indicated that the expression of VIM was strictly subject to
regulation by ZEB1. A promoter analysis assay was conducted to
investigate and identify the specific binding site. The luciferase
reporter assay is one of the key techniques for investigating the
regulation of gene expression in mammalian cell cultures (19). More specifically, the
transcriptional activity can be evaluated by detecting the
luciferase activity of recombinant plasmid-transfected cells. Based
on the prediction of binding sites in the JASPAR database, two
mutational pEZX-PG02-VIM promoter plasmids, which contained
different mutation sites, were designed and constructed. The
results of the luciferase assay demonstrated that the
transcriptional activity of VIM was affected by ZEB1 at the gene
expression level. In addition, the results of subsequent
experiments suggested that ZEB1 was able to regulate VIM-mut1
promoter activity, but did not lead to activation of the VIM-mut2
promoter. The putative binding site sequence for ZEB1 in the VIM
promoter was found to be CCCCACCCG (1023–1031). Therefore, ZEB1 was
considered to preferentially bind to the second putative site
(1023–1031) of the VIM promoter (Table III) to regulate the
transcriptional activity of VIM.
In conclusion, the present study demonstrated that
ZEB1 and VIM were concomitantly upregulated in HCC tissues, and
ZEB1 was crucial in the tumorigenesis and metastasis of HCC.
Finally, the data revealed that ZEB1 was able to bind to and
regulate the transcription of the VIM gene, suggesting that one of
the mechanisms through which ZEB1 induces tumorigenesis is
regulation of the expression of VIM.
Acknowledgements
Not applicable.
Funding
No funding was received.
Availability of data and materials
All the datasets generated and analyzed in the
present study are included in this published article.
Authors' contributions
YQ performed all experiments. JY performed all data
analysis. MZ collected clinical samples. FQ provided experimental
support for IHC and luciferase report assays. XL designed the
project. JY contributed to manuscript revision. All authors have
read and approved the final version of this manuscript.
Ethics approval and consent to
participate
All patients provided written informed consent to
participate in the present study, and the study protocol was
approved by the Ethics Committee of The Central Hospital of Enshi
Autonomous Prefecture.
Patient consent for publication
Not applicable.
Competing interests
The authors declare that they have no competing
interests.
References
|
1
|
El-Serag HB and Rudolph KL: Hepatocellular
carcinoma: Epidemiology and molecular carcinogenesis.
Gastroenterology. 132:2557–2576. 2007. View Article : Google Scholar : PubMed/NCBI
|
|
2
|
Lau WY and Lai EC: Hepatocellular
carcinoma: Current management and recent advances. Hepatobiliary
Pancreat Dis Int. 7:237–257. 2008.PubMed/NCBI
|
|
3
|
Kalluri R and Weinberg RA: The basics of
epithelial-mesenchymal transition. J Clin Invest. 119:1420–1428.
2009. View
Article : Google Scholar : PubMed/NCBI
|
|
4
|
Iwatsuki M, Mimori K, Yokobori T, Ishi H,
Beppu T, Nakamori S, Baba H and Mori M: Epithelial-mesenchymal
transition in cancer development and its clinical significance.
Cancer Sci. 101:293–299. 2010. View Article : Google Scholar : PubMed/NCBI
|
|
5
|
Remacle JE, Kraft H, Lerchner W, Wuytens
G, Collart C, Verschueren K, Smith JC and Huylebroeck D: New mode
of DNA binding of multi-zinc finger transcription factors: DeltaEF1
family members bind with two hands to two target sites. EMBO J.
18:5073–5084. 1999. View Article : Google Scholar : PubMed/NCBI
|
|
6
|
Postigo AA, Depp JL, Taylor JJ and Kroll
KL: Regulation of Smad signaling through a differential recruitment
of coactivators and corepressors by ZEB proteins. EMBO J.
22:2453–2462. 2003. View Article : Google Scholar : PubMed/NCBI
|
|
7
|
Singh M, Spoelstra NS, Jean A, Howe E,
Torkko KC, Clark HR, Darling DS, Shroyer KR, Horwitz KB, Broaddus
RR and Richer JK: ZEB1 expression in type I vs type II endometrial
cancers: A marker of aggressive disease. Mod Pathol. 21:912–923.
2008. View Article : Google Scholar : PubMed/NCBI
|
|
8
|
Sanchez-Tillo E, de Barrios O, Siles L,
Amendola PG, Darling DS, Cuatrecasas M, Castells A and Postigo A:
ZEB1 Promotes invasiveness of colorectal carcinoma cells through
the opposing regulation of uPA and PAI-1. Clin Cancer Res.
19:1071–1082. 2013. View Article : Google Scholar : PubMed/NCBI
|
|
9
|
Graham TR, Zhau HE, Odero-Marah VA,
Osunkoya AO, Kimbro KS, Tighiouart M, Liu T, Simons JW and O'Regan
RM: Insulin-like growth factor-I-dependent up-regulation of ZEB1
drives epithelial-to-mesenchymal transition in human prostate
cancer cells. Cancer Res. 68:2479–2488. 2008. View Article : Google Scholar : PubMed/NCBI
|
|
10
|
Eger A, Aigner K, Sonderegger S, Dampier
B, Oehler S, Schreiber M, Berx G, Cano A, Beug H and Foisner R:
DeltaEF1 is a transcriptional repressor of E-cadherin and regulates
epithelial plasticity in breast cancer cells. Oncogene.
24:2375–2385. 2005. View Article : Google Scholar : PubMed/NCBI
|
|
11
|
Putzke AP, Ventura AP, Bailey AM, Akture
C, Opoku-Ansah J, Celiktaş M, Hwang MS, Darling DS, Coleman IM,
Nelson PS, et al: Metastatic progression of prostate cancer and
e-cadherin regulation by zeb1 and SRC family kinases. Am J Pathol.
179:400–410. 2011. View Article : Google Scholar : PubMed/NCBI
|
|
12
|
Lopez-Terrada D, Cheung SW, Finegold MJ
and Knowles BB: Hep G2 is a hepatoblastoma-derived cell line. Hum
Pathol. 40:1512–1515. 2009. View Article : Google Scholar : PubMed/NCBI
|
|
13
|
Li Y, Tang ZY, Ye SL, Liu YK, Chen J, Xue
Q, Chen J, Gao DM and Bao WH: Establishment of cell clones with
different metastatic potential from the metastatic hepatocellular
carcinoma cell line MHCC97. World J Gastroenterol. 7:630–636. 2001.
View Article : Google Scholar : PubMed/NCBI
|
|
14
|
Livak KJ and Schmittgen TD: Analysis of
relative gene expression data using real-time quantitative PCR and
the 2(-Delta Delta C(T)) method. Methods. 25:402–408. 2001.
View Article : Google Scholar : PubMed/NCBI
|
|
15
|
Polyak K and Weinberg RA: Transitions
between epithelial and mesenchymal states: Acquisition of malignant
and stem cell traits. Nat Rev Cancer. 9:265–273. 2009. View Article : Google Scholar : PubMed/NCBI
|
|
16
|
Bae GY, Choi SJ, Lee JS, Jo J, Lee J, Kim
J and Cha HJ: Loss of E-cadherin activates EGFR-MEK/ERK signaling,
which promotes invasion via the ZEB1/MMP2 axis in non-small cell
lung cancer. Oncotarget. 4:2512–2522. 2013. View Article : Google Scholar : PubMed/NCBI
|
|
17
|
Wang Y, Wen M, Kwon Y, Xu Y, Liu Y, Zhang
P, He X, Wang Q, Huang Y, Jen KY, et al: CUL4A induces
epithelial-mesenchymal transition and promotes cancer metastasis by
regulating ZEB1 expression. Cancer Res. 74:520–531. 2014.
View Article : Google Scholar : PubMed/NCBI
|
|
18
|
Siebzehnrubl FA, Silver DJ, Tugertimur B,
Deleyrolle LP, Siebzehnrubl D, Sarkisian MR, Devers KG, Yachnis AT,
Kupper MD, Neal D, et al: The ZEB1 pathway links glioblastoma
initiation, invasion and chemoresistance. EMBO Mol Med.
5:1196–1212. 2013. View Article : Google Scholar : PubMed/NCBI
|
|
19
|
Yun C and Dasgupta R: Luciferase reporter
assay in Drosophila and mammalian tissue culture cells. Curr Protoc
Chem Biol. 6:7–23. 2014. View Article : Google Scholar : PubMed/NCBI
|