Introduction
Head and neck cancers are the sixth most common
cancer type affecting 650,000 people and causing 350,000
mortalities per year, worldwide (1). Oral cancer is the most common type of
head and neck cancer (2).
Annually, ~7% of cancer-associated mortality in males and 4% in
females is attributed to oral cancer (2). Oral squamous cell carcinoma (OSCC) is
one of the most common malignant oral cancers. In recent years, the
rapid development of the cancer stem cell (CSC) theory provided a
novel understanding of tumorigenesis (3). The CSC population possesses
characteristics associated with stem cells, including self-renewal
and exhibits high in vivo tumorigenicity and differentiation
potential, in addition to multidrug and apoptotic resistance
(4–6). CSCs additionally have the capacity to
promote tumor metastasis and progression, and have been identified
in multiple types of cancer (7,8).
Side population (SP) cells exhibit low fluorescence characteristics
following staining of CSCs with Hoechst 33342 and flow cytometry
analysis, and thus may be sorted (8). Kondo et al (9) isolated SP cells from C6 glioma cells
(0.4%), B104 neuroblastoma cells (0.4%), HeLa carcinoma cells
(1.2%) and MCF7 breast cancer cells (2.0%), suggesting a small
population of SP cells in multiple cancer cell lines. Additionally,
the sorted C6 SP cells were found to generate SP and non-SP cells
under certain conditions and share a number of characteristics with
CSCs; in particular, they possess the capacity for tumor initiation
and express stem-like genes. The SP cells in OSCC have been
investigated previously in certain studies. The percentage of SP
cells vary in different OSCC cell lines, ranging between 0.2 and
9.8% of the total cell population in the cell lines (10–14).
The SP cells isolated from Tca/cisplatin, SCC-25, SCC-55, SAS or
OECM1 cell lines have tumor stem cell phenotypes, including high
tumorigenicity, differentiation ability and/or chemoresistance
(10–13). However, to the best of our
knowledge, the role of SP cells in the Tca8113 cell line has not
been assessed.
Aldehyde dehydrogenase-1 (ALDH1), CD44 antigen
(CD44) and CD133 antigen (CD133) are the most common markers of
CSCs. CD44 is highly expressed in numerous types of CSCs (10,15).
The transcription factor Nanog is activated when CD44 binds to
hyaluronic acid, promoting cell self-renewal and pluripotency
(16). Additionally, Nanog
activates the downstream multidrug resistance gene 1 (15). The expression of CD133 in OSCC is
significantly higher than in normal tissue and benign tumor
(11). Furthermore, Zhang et
al (17) identified a small
subpopulation (1-2%) of CD133+ CSCs that may confer
chemo-resistance in OSCC. ALDH1 is a cytoplasmic enzyme that is
able to oxidize acetaldehyde to carboxylic acids (18). Elevated ALDH1 expression in OSCC
tissue is associated with local recurrence (19). ALDH1 is also a potential marker of
CSCs in numerous solid tumors that are associated with poor
clinical outcome (20–23). However, it is not clear whether
ALDH1 is one of the CSCs markers of oral cancer. It has been
reported that ALDH combines with CD133 to confer a high
tumorigenicity in liver or ovarian CSCs (22,24).
In addition, patients with oral leukoplakia harboring co-expression
of ALDH1 and CD133 exhibited a high risk of malignant
transformation to oral cancer (25). As documented, different CSCs
markers are expressed in the SP cells derived from different OSCC
cell lines (10–13). Therefore, it is necessary to detect
the specific markers in Tca8113 SP cells.
In addition, microRNA (miRNA/miR) are non-coding
single-strand RNA molecules of 19–25 nucleotides, which are
involved in a series of important processes, including cell
proliferation, differentiation and apoptosis. An increasing number
of studies have demonstrated that miRNA is involved in various
tumors development process, including OSCC. miR-375, miR-127,
miR-137 (hypermethylation), the miR-200 family and miR-205 are
promising candidates associated with OSCC (26). Overexpression of miR-155, let-7i
and miR-146a are associated with tumor progression and metastases
(27). However, the involvement of
miRNAs in SP cells is unclear.
In the present study, the proliferation ability,
expression of stem genes and CSCs markers were compared between SP
cells and non-SP cells. Differential miRNA expression profiles in
Tca8113 tumor stem cells were detected by microarray analysis.
These experiments provided a more comprehensive understanding of
the biological characteristics of SP cells.
Materials and methods
Cell lines and cell culture
The human OSCC Tca8113 cell line [provided by the
cell bank of the Chinese Academy of Sciences (Beijing, China)] was
cultured in Dulbecco's modified Eagle's medium (DMEM)/F12 (Gibco;
Thermo Fisher Scientific, Inc.) containing 10% fetal bovine serum
[termed serum-supplemented medium (SSM); Gibco; Thermo Fisher
Scientific, Inc.] in 5% CO2 and saturated humidity at
37°C (28). The cells were
digested with 0.25% trypsin (Hyclone; GE Healthcare Life Sciences)
containing 0.02% EDTA for 5 min followed by centrifugation
(Eppendorf) at 400 × g for 5 min at 4°C. Subsequently, the cells
were cryopreserved and stored in a freezer (Sanyo Electric Co.,
Ltd.) at −80°C containing 10% dimethyl sulfoxide (MP Biomedicals,
LLC), 20% fetal bovine serum and 70% DMEM/F12 culture medium
(29). Prior to use, cells were
resuspended in a 37°C water bath for 1 min and cultured in 4 ml SSM
overnight.
Isolation of SP cells by Hoechst 33342
fluorescence activated cell sorting
Tca8113 cells were washed with PBS, digested by
trypsin, and 1×10⁶/ml cells were collected.
Subsequently, 5 µg/ml Hoechst 33342 (Sigma-Aldrich; Merck KGaA) was
added at 37°C for 90 min. In total, 25 µg/ml ATP-binding cassette
(ABC) sub-family G member 2 inhibitor verapamil (30) was added in advance as the negative
control. Upon staining, the cells were centrifuged for 10 min at
4°C at 150 × g to discard the supernatant, added to 500 µl PBS with
10 µg/ml propidium iodide and sorted by flow cytometry. The dye was
excited at 351–364 nm and the fluorescence measured with a 515 nm
SP filter and a 608 long pass edge optical filter. The SP and
non-SP cells were collected and counted under a light microscope
(×200).
Sphere culture
Following sorting, SP and non-SP cells were placed
in ultra-low attachment plates under stem cell conditions by
culturing in serum-free medium (SFM) containing 10 ng/ml epidermal
growth factor (EGF), 10 ng/ml basic fibroblast growth factor (bFGF)
and 1× B27 with 5% CO2 and saturated humidity at
37°C.
Cell proliferation and scratch-wound
assays in vitro
The SP and non-SP cells were digested by 0.25%
trypsin, and filtered using 40-µm nylon mesh. Subsequently, cells
were seeded in 96-well plates (5×10³ cells/well in the
cell proliferation assay; 2.5×10⁴ cells/well in the
wound scratch assay), and 200 µl DMEM/F12 was added in complete
medium in an incubator with 5% CO2 at 37°C. A 96-well
wound maker was used to test the wound-healing rate (31). Data from the cell proliferation and
scratch-wound assays were collected every 2 h for 42 h and analyzed
using the IncuCyte Zoom Live-Cell Analysis System (Essen
Bioscience).
Colony formation assay
The SP and non-SP cells were digested in 0.25%
trypsin and filtered using 40-µm nylon mesh. Subsequently, cells
were seeded in 6-well plates at a density of 200 cells/well and
incubated at 5% CO2 and 37°C for 14 days. Following the
formation of colonies visible to the naked eye, the cell colonies
were washed with PBS and subsequently fixed with 4% methanol at
room temperature for 15 min, followed by incubation with 0.5%
crystal violet at room temperature for 30 min and rinsed with
deionized distilled water. The number of colonies was counted.
Flow cytometry to detect stem
marker-positive cells
Sphere-forming SP cells and non-SP cells at
1×10⁶/ml were collected and washed with PBS. After
centrifugation at 400 × g for 15 min at 4°C, cells were fixed in
pre-cooled ethanol at 4°C overnight. On the next day, cells were
washed with PBS, and incubated with FITC-conjugated anti-ALDH1
antibodies (1:100, Beijing Biosynthesis Biotechnology Co., Ltd.;
cat. no. bs-10162R-FITC); PE-conjugated anti-CD133 antibodies
(1:100, Miltenyi Biotech, Inc.; cat. no. 130-111-079);
APC-conjugated anti-CD44 antibodies (1:100, eBioscience; Thermo
Fisher Scientific, Inc.; cat. no. 17-0441-81) at 37°C for 1 h in
the dark. Subsequently, flow cytometric analysis was performed to
detect the CD44, CD133 and ALDH1 positive cells in the
sphere-forming SP cells and non-SP cells using a flow cytometry
(FACSCalibur; BD Biosciences). Additionally, the sphere-forming SP
cells at 3×10⁵/ml were seeded in SSM for 14 days to
induce differentiation. Furthermore, the proportions of CD44, CD133
and ALDH1 positive cells were determined following
differentiation.
Reverse transcription-quantitative
polymerase chain reaction (RT-qPCR)
Total RNA from SP cells and non-SP cells was
extracted using TRIzol® reagent (Invitrogen; Thermo
Fisher Scientific, Inc.). An ultraviolet (UV) spectrophotometer was
used to detect the concentration of RNA by measuring the optical
density (OD)260. The OD260/OD280 ratios of 1.8–3.0 were required.
In total, 1 µl 500 ng/µl RNA was used for cDNA synthesis, according
to the manufacturer's protocol. RT was performed for one cycle
under the following conditions; 37°C for 15 min and 85°C for 5 sec
using the RT System (Promega Corporation). The RT reactions
contained 1 µl RNA, 2 µl 5X PrimeScript Buffer, 0.5 µl PrimeScript
RT Enzyme Mix, 0.5 µl Oligo dT Primer, 0.5 µl Random 6-mers and 5.5
µl RNase Free dH2O.
qPCR was performed using a StepOne Real-Time PCR
System (Applied Biosystems; Thermo Fisher Scientific, Inc.) with
One Step SYBR PrimeScript RT-qPCR kit II (Takara Bio, Inc.). The
primer sequences for POU class 5 homeobox 1 (Oct4), nanog homeobox
(Nanog), SRY-box 2 (Sox2), ALDH1 and CD133 are presented in
Table I. qPCR was performed under
the following conditions: 95°C for 10 sec; 40 cycles of 95°C for 5
sec; and 60°C for 30 sec. The qPCR reactions contained 2 µl cDNA,
10 µl FastStart SYBR Green Master, 0.8 µl forward primer, 0.8 µl
PCR forward primer and 6.4 µl RNase Free dH2O. To
quantify alterations in gene expression, the 2−∆∆Cq
method (32) was used to calculate
the relative gene expression following normalization using the
expression of GAPDH.
 | Table I.Primers for the polymerase chain
reaction assays. |
Table I.
Primers for the polymerase chain
reaction assays.
| Gene | Primer (5′-3′) | Size (bp) |
|---|
| OCT4 | Forward:
CTTGAATCCCGAATGGAAAGGG | 206 |
|
| Reverse:
CCTTCCCAAATAGAACCCCCA |
|
| NANOG | Forward:
AAGGTCCCGGTCAAGAAACAG | 237 |
|
| Reverse:
CTTCTGCGTCACACCATTGC |
|
| SOX2 | Forward:
TACAGCATGTCCTACTCGCAG | 110 |
|
| Reverse:
GAGGAAGAGGTAACCACAGGG |
|
| ALDH1A1 | Forward:
CTGCTGGCGACAATGGAGT | 89 |
|
| Reverse:
CGCAATGTTTTGATGCAGCCT |
|
| CD133 | Forward:
GGCCCAGTACAACACTACCAA | 75 |
|
| Reverse:
ATTCCGCCTCCTAGCACTGAA |
|
| GAPDH | Forward:
GGTGAAGGTCGGAGTCAACG |
|
|
| Reverse:
CAAAGTTGTCATGGATGHACC |
|
The SP cells were placed under SSM condition for 14
days to induce differentiation. The gene expressions were examined
in non-SP cells and in SP cells prior to and following
differentiation.
Western blot analysis
Cells were first lysed with radioimmunoprecipitation
buffer (Cell Signaling Technology) and 5 µg of proteins were
separated using 10% SDS-PAGE gels and transferred to a
polyvinylidene difluoride membranes subsequent to cell protein
concentration quantification with a Bio-Rad assay kit (cat. no.
5000002; Bio-Rad Laboratories, Inc.). The membranes were blocked in
5% non-fat milk at room temperature for 1 h and incubated with
primary antibodies; rabbit polyclonal anti-ALDH1 (1:200; Santa Cruz
Biotechnology, Inc., cat. cat. no. sc-50385), rabbit polyclonal
anti-Oct4 (1:200; Cell Signaling Technologies Biological Reagents,
Co., Ltd., cat. no. 2750), rabbit polyclonal anti-Nanog (1:200;
Santa Cruz Biotechnology, Inc., cat. no. sc-33759) rabbit
polyclonal anti-Sox2 (1:200; Santa Cruz Biotechnology, Inc., cat.
no. sc-20088), and GAPDH (internal control; 1:200 Santa Cruz
Biotechnology, Inc., cat. no. sc-20358) at 4°C overnight (33). Following washing three times in
TBS/0.1% Tween-20, the membranes underwent hybridization with a
horseradish peroxidase-conjugated ant-rabbit secondary antibody
(1:1,000; Thermo Fisher Scientific, Inc., cat. no. A24531) for 1 h
at room temperature. Signals were subsequently visualized with the
Beyo Enhanced Chemiluminescent Plus detection kit (Beyotime
Institute of Biotechnology). The relative level of protein
expression was measured based on densitometry using Gel-Pro
Analyzer version 3.0 (Media Cybernetics, Inc.).
The SP cells were cultured under SSM condition for
14 days to induce differentiation. The protein expressions were
tested in non-SP cells and in SP cells prior to and following
differentiation.
miRNA expression profiles in Tca8113
SP cells
Total RNA was isolated using TRIzol®
(Invitrogen; Thermo Fisher Scientific, Inc.) and miRNeasy mini kit
(Qiagen GmbH) according to the manufacturer's protocol, which
efficiently recovered all RNA species, including miRNAs. RNA
quality and quantity were measured using nanodrop spectrophotometer
(ND-1000; NanoDrop Technologies; Thermo Fisher Scientific, Inc.)
and RNA Integrity was determined by gel electrophoresis. The
miRCURY™ Hy3™/Hy5™ Power labeling kit (Exiqon A/S) was used,
according to the manufacturer's protocol, for miRNA labelling. The
Hy3™-labeled samples were hybridized on the miRCURY™ LNA™ Array
(v18.0; Exiqon A/S) according to the manufacturer's protocol. In
total, 25 µl mixture from Hy3™-labeled samples with 25 µl
hybridization buffer were denatured for 2 min at 95°C, incubated on
ice for 2 min and subsequently hybridized to the microarray for
16–20 h at 56°C in a 12-Bay Hybridization Systems (NimbleGen
Systems, Inc.). Scanned images were imported into Axon GenePix Pro
6.0 software (Molecular Devices, LLC) for grid alignment and data
extraction. Replicated miRNAs were averaged and miRNAs of which
intensities ≥30 in all samples were selected for calculating the
normalization factor. Expressed data were normalized using the
Median normalization (34).
Following normalization, significant differentially expressed
miRNAs between SP and non-SP cells were identified by Volcano Plot
filtering. Hierarchical clustering was performed using
MultiExperiment Viewer software (v4.6; The Institute for Genomic
Research, Rockville, MA, USA) (35). The genes targeted by the
differentially expressed miRNAs were predicted, and the
protein-protein interactions (PPIs) between these proteins/genes
were further predicted based on text-mining and public databases
including Gene Ontology, KEGG, Pfam and InterPro. The predicted
miRNA-gene relationships and PPIs were utilized to establish a
miRNA-gene-gene regulatory network. The PPIs in the network was
statistically analyzed by computing centered Pearson correlation
coefficient (36), and the PPI
number of each gene (that is, the number of genes interacting with
a certain gene) in this network was counted.
Statistical analysis
Data were derived from at least three independent
repeats for each experiment. Statistical analysis was performed
using a Student's t-test or χ2 test to compare
differences in values between the SP and non-SP cells using SPSS
20.0 (IBM, Corp., Armonk, NY, USA). The results are presented as
the mean ± standard deviation. P<0.05 was considered to indicate
a statistically significant difference.
Results
SP cells in Tca8113 cell line
SP cells were sorted by flow cytometry following
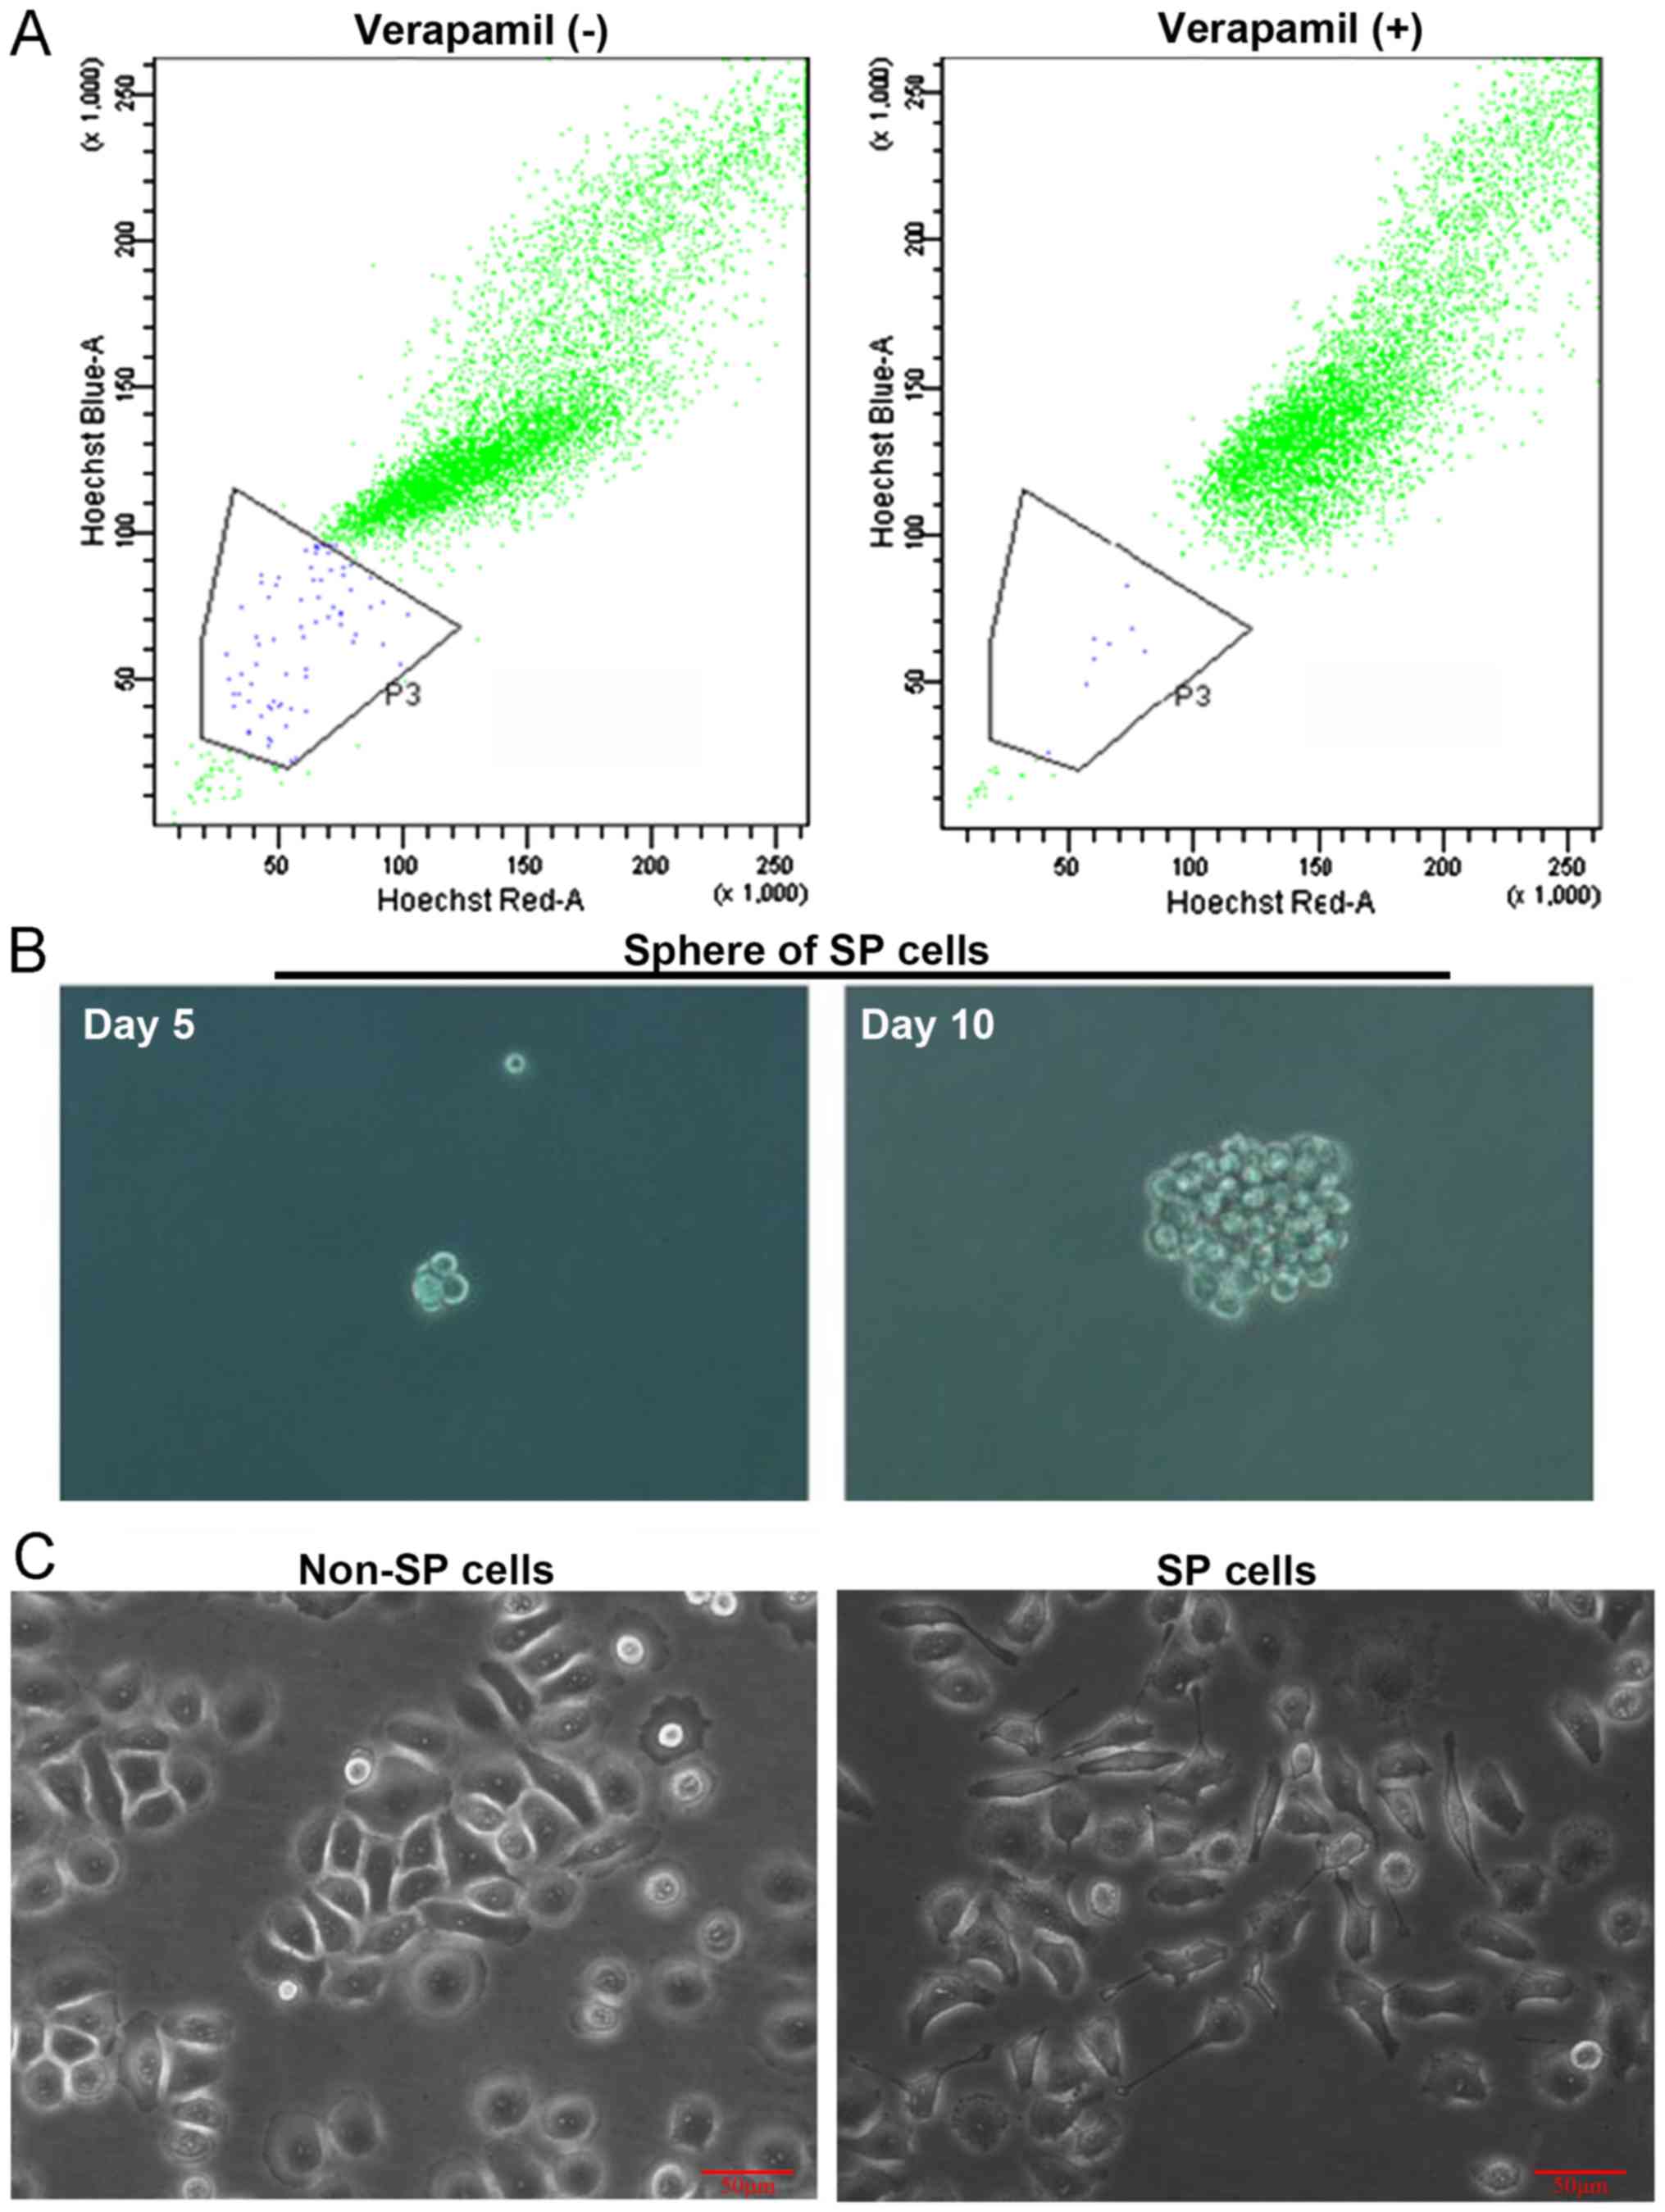
Hoechst 33342 fluorescence staining. As demonstrated in Fig. 1A, SP cells in Tca8113 cells
accounted for 0.70±0.22%, significantly increased compared with
0.10±0.03% following treatment with verapamil, a selective ABC
transporter inhibitor (P<0.05). Verapamil, a calcium channel
blocker and non-specific inhibitor of ABC transporters, has been
shown to inhibit SP generation (37).
Sorted SP and non-SP cells were cultured under stem
cell conditions (SFM containing EGF, bFGF and B27). After 10 days,
the SP cells formed obvious spheres (Fig. 1B); however, non-SP cells were
barely able to survive. Therefore, for the biological morphology
observation, SP spheres were collected, resuspended and cultured in
SSM for differentiation; whereas, sorted non-SP cells were directly
cultured in SSM. Following culture for one day, the SP cells
demonstrated slender protrusions and loose connections between
cells compared with the non-SP cells (Fig. 1C).
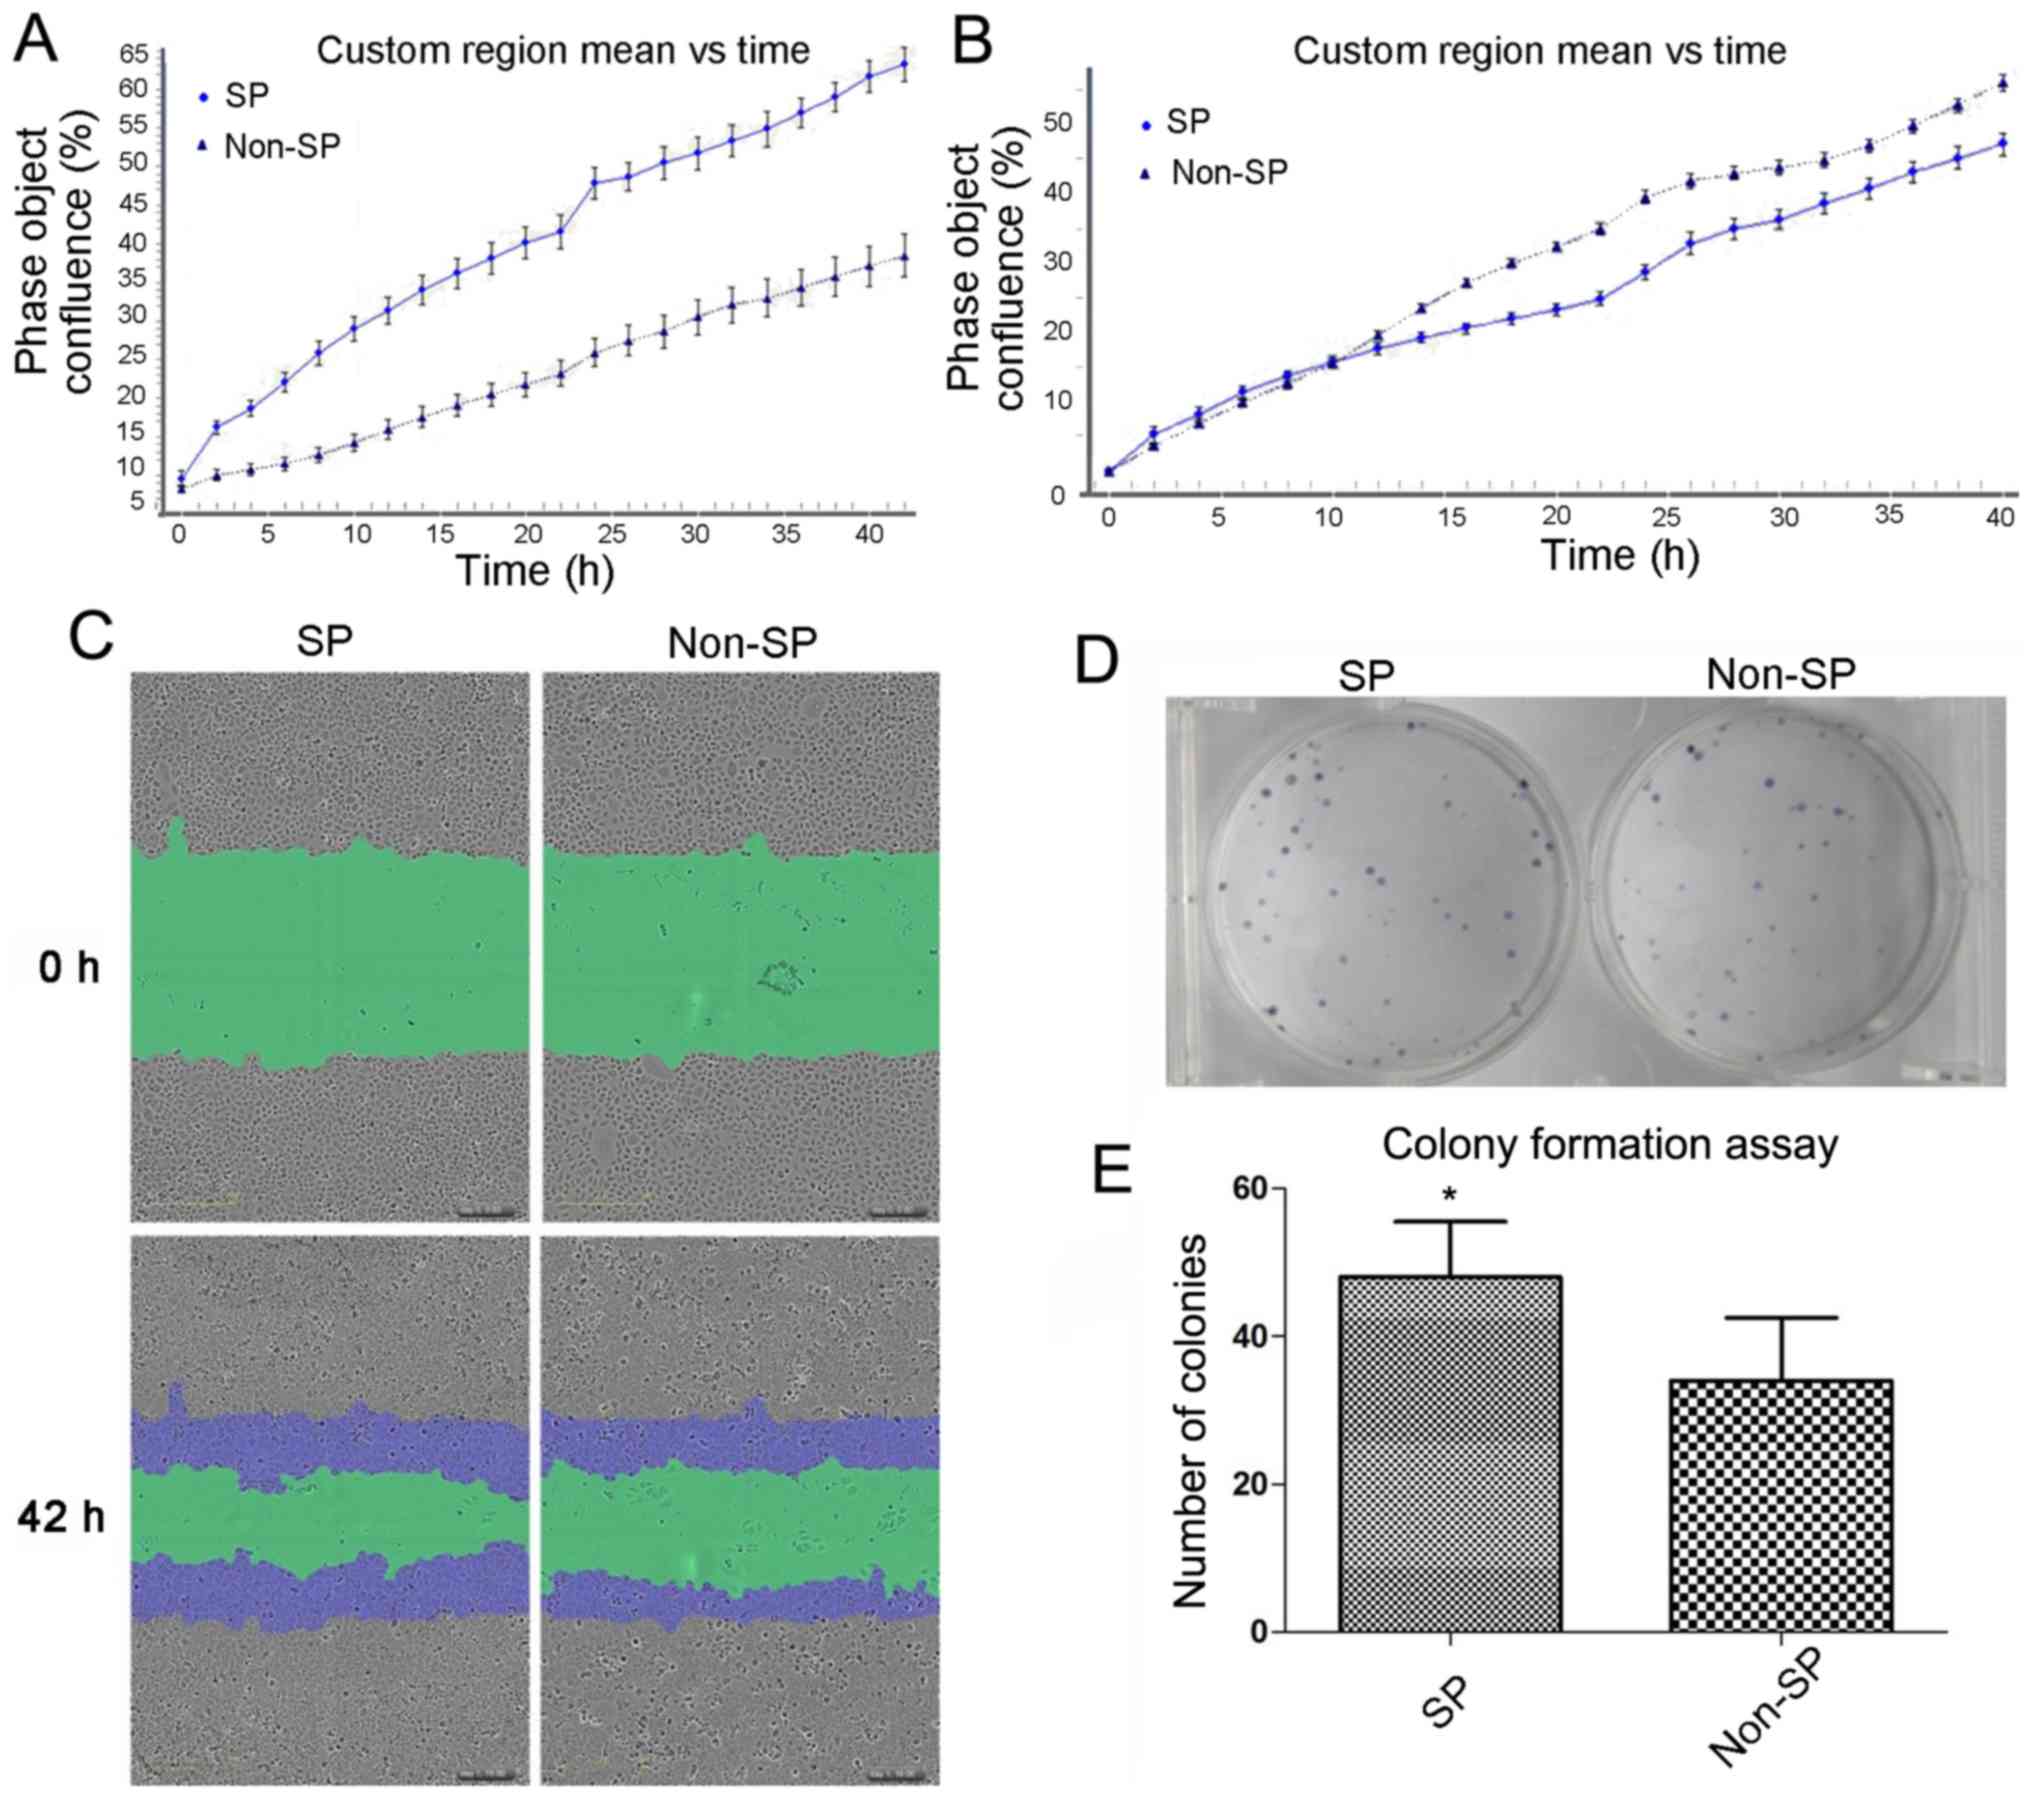
Proliferation, migration and colony
formation ability of SP cells
The results of IncuCyte Zoom demonstrated that the
proliferative capability of SP cells was increased compared with
the non-SP cells (60.0% confluence compared with 35.1% confluence
after 40 h growth; P<0.05; Fig.
2A). The scratch-wound assay demonstrated that SP cells
migrated to the center after 42 h, and the wound density was 55.2%,
significantly increased compared with non-SP cells (47.5%;
P<0.05; Fig. 2B and C). To
further evaluate the proliferative capacity of SP cells and non-SP
cells, the colony formation assay was applied to detect the
reproductive capacity of the cells. The number of colonies formed
from SP cells was significantly increased compared with non-SP
cells, which was 43.1±9.2 and 33.0±8.2, respectively (P<0.05;
Fig. 2D and E).
Expression of stem cell markers
CD44+, CD133+ and ALDH1+
As presented in Fig.
3A, cultured SP or non-SP cells were incubated with anti-ALDH1,
anti-CD133 and anti-CD44 antibodies together, and subjected to flow
cytometry analysis. The results revealed that there were no
significant differences, regarding the percentage of
CD44+ and CD133+ cells between SP and non-SP
cells. Fig. 3B demonstrated the
percentage of only ALDH+ cells of cultured SP or non-SP
cells following incubation of anti-ALDH1, anti-CD133 and anti-CD44
antibodies together. The percentage of ALDH1+ cells was
markedly higher in SP cells compared with in non-SP cells at day 0
(7.1% vs. 0.5%). When SP cells were placed into the SSM
differentiation condition for 14 days, the percentage of
ALDH1+ cells decreased to 0.5%, which was similar to the
non-SP cells (0.6%). Similar results were obtained following three
independent experiments. There were a significantly higher
percentage of ALDH1+ cells in SP cells compared with
non-SP cells prior to differentiation (P<0.01; Fig. 3C).
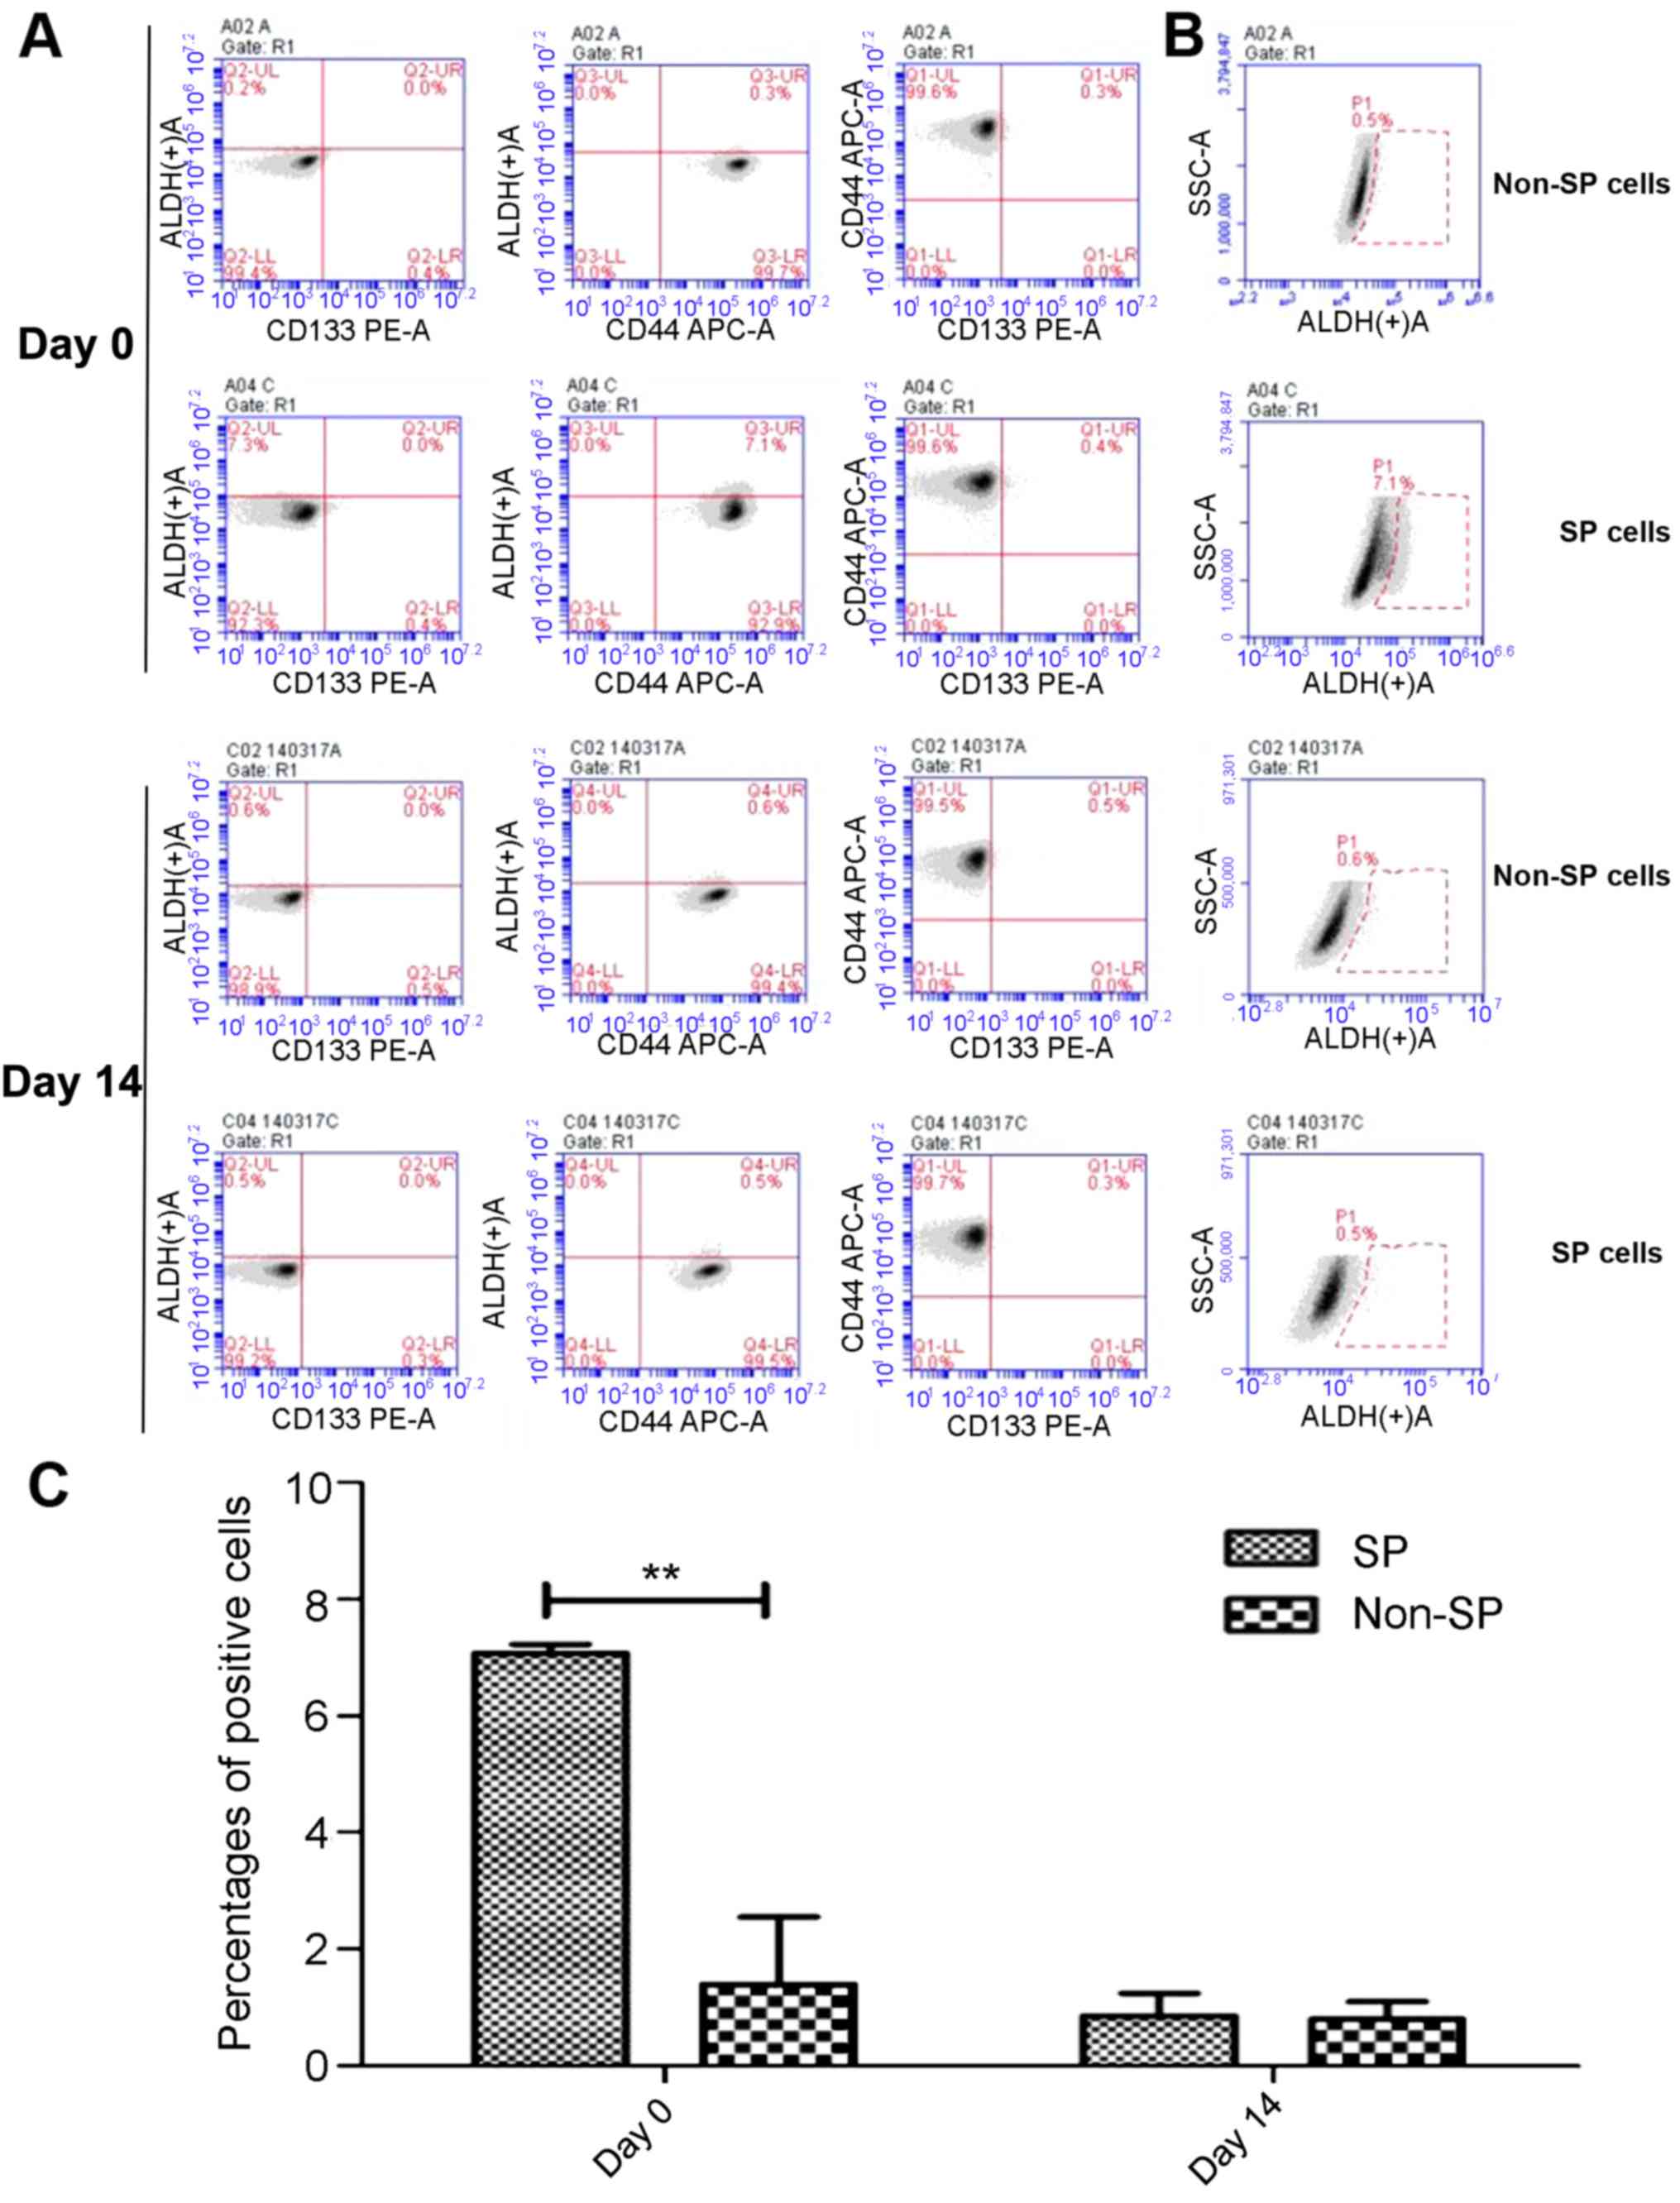 | Figure 3.Expression of ALDH1, CD133 and CD44
prior to and following induction of differentiation in SP cells. SP
or non-SP cells were incubated with anti-ALDH1, anti-CD133 and
anti-CD44 antibodies together, and subjected to flow cytometry
analysis. (A) Percentage of ALDH1+, CD133+ or
CD44+ cells in non-SP and SP cells prior to (day 0) and
following differentiation (day 14). During flow cytometry analysis,
Left, cells were analyzed for the expression of ALDH1 and CD133;
Middle, cells were analyzed for the expression of ALDH1 and CD44;
Right, cells were analyzed for the expression of CD133 and CD44.
All these were conducted in the same population of SP or non-SP
cells. (B) Percentage of only ALDH1+ cells in the same
population of non-SP and SP cells in A prior to (day 0) and
following differentiation (day 14). (C) Percentage of
ALDH1+ cells in non-SP and SP cells prior to (day 0) and
following differentiation (day 14) after three independent
experiments. **P<0.01. ALDH1, aldehyde dehydrogenase-1; CD44,
CD44 antigen; CD133, CD133 antigen; PE, phycoerythrin; APC,
allophycocyanin; SSC, side scatter; SP, side population. |
Evaluation of expression of stem genes
and CSCs surface markers by RT-qPCR and western blotting
The mRNA expression of Sox2, Oct4, Nanog, CD133 and
ALDH1 were detected by RT-qPCR. The results demonstrated higher
mRNA expression levels of ALDH1, Sox2, Oct4 and Nanog in the SP
cells (P<0.05; Fig. 4A), and
the expression of CD133 exhibited no significant difference from
the non-SP cells (P>0.05; Fig.
4A). This was further confirmed by western blotting. Compared
with the non-SP cells, the protein expression levels of ALDH1,
Nanog, Oct4 and Sox2 were higher in the SP cells (Fig. 4B). When the SP cells were placed
into the SSM differentiation condition for 14 days, SP cells seeded
in SSM and non-SP cells had the same mRNA (P>0.05) and protein
expression levels (Fig. 4C and
D).
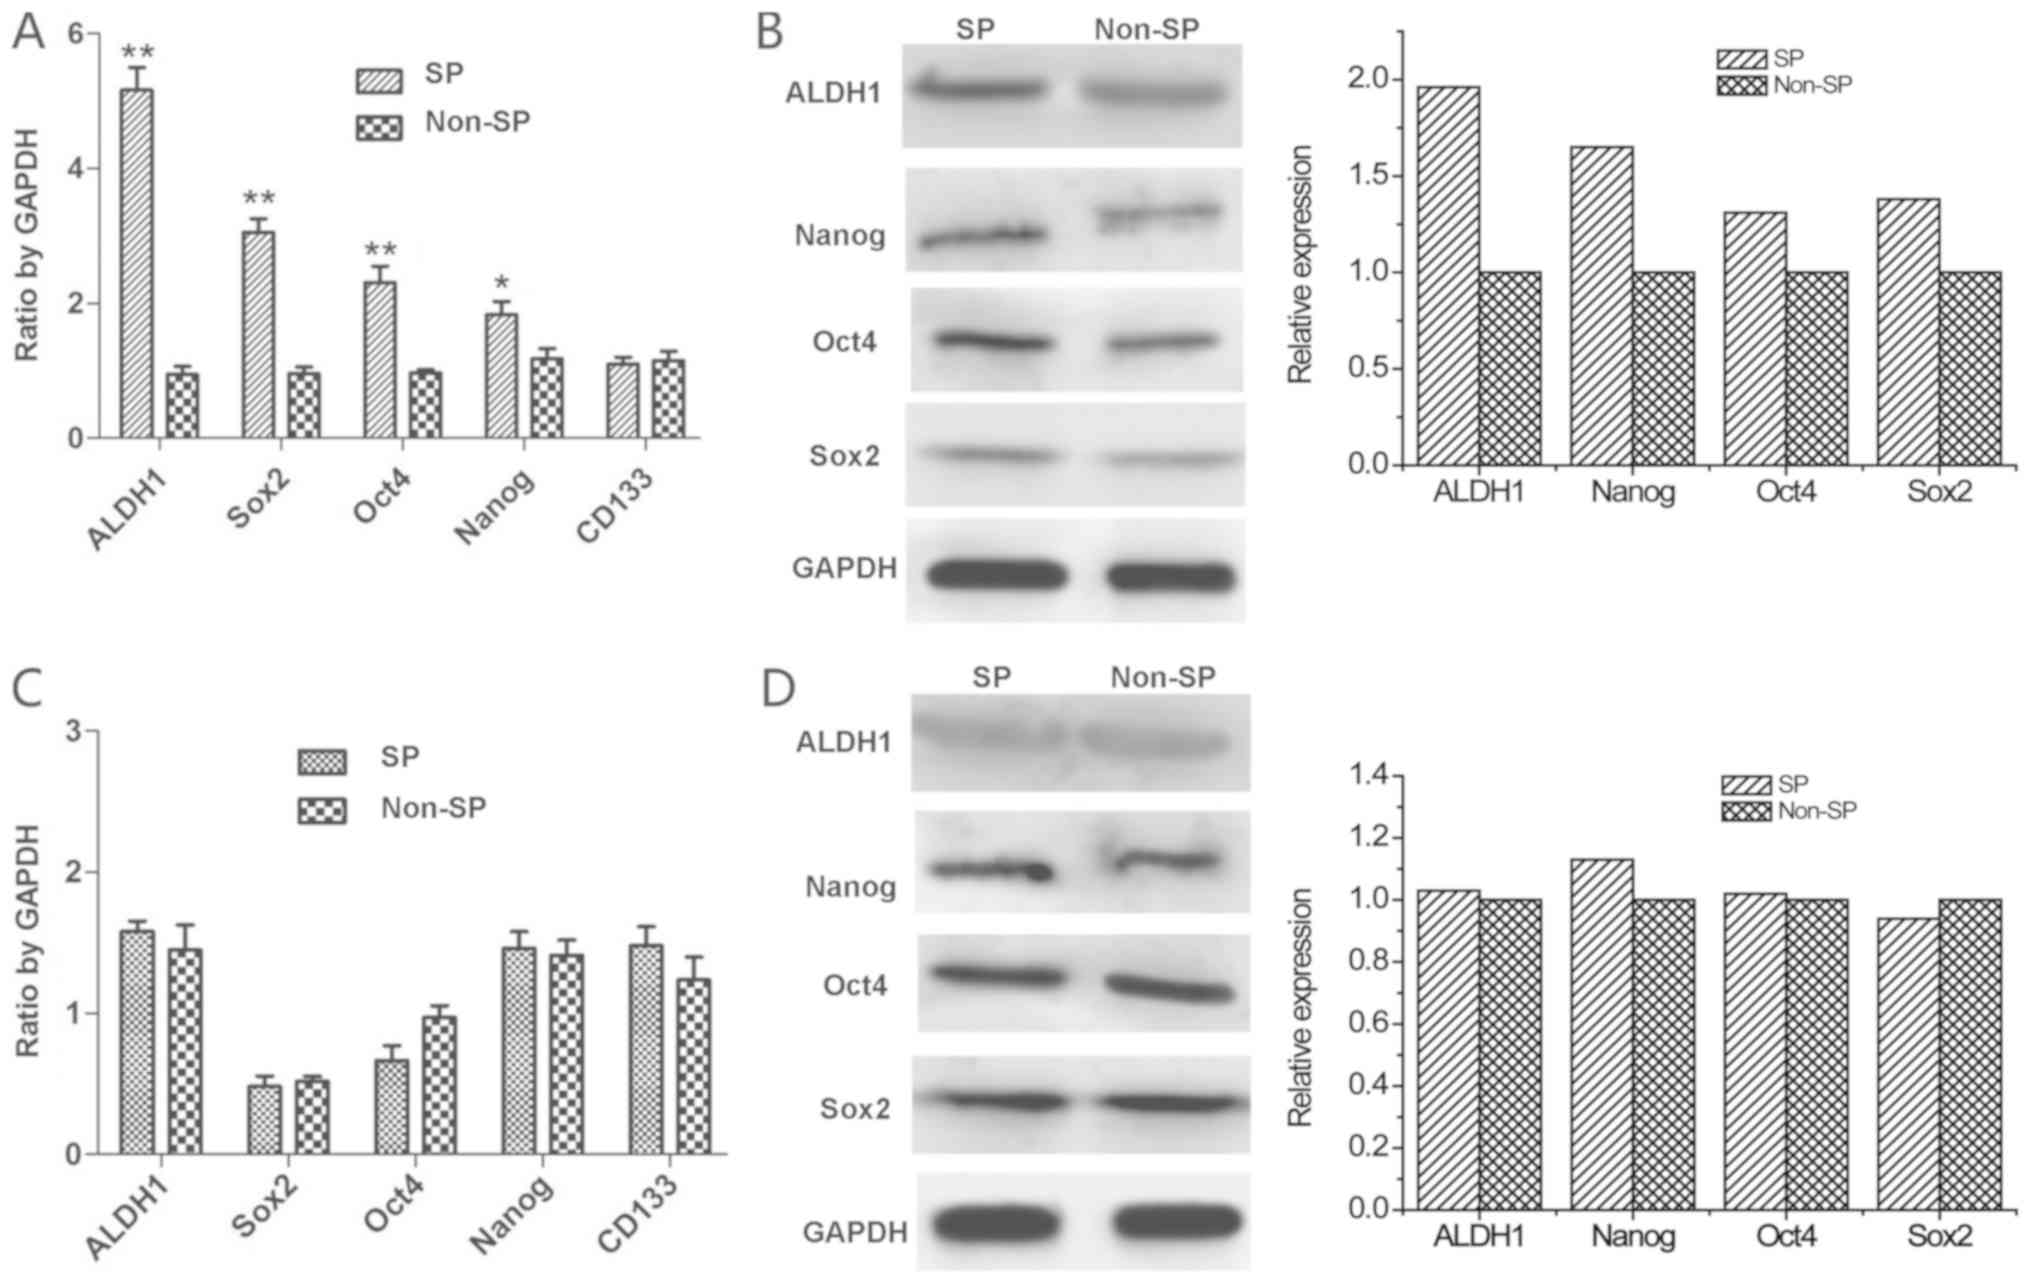 | Figure 4.Expression of stem genes detected by
RT-qPCR and western blotting. (A) Expressions of ALDH1, Sox2, Oct4,
Nanog and CD133 mRNA by RT-qPCR in SP and non-SP cells. (B)
Expressions of ALDH1, Sox2, Oct4 and Nanog protein by western
blotting in SP and non-SP cells. (C) Expressions of ALDH1, Sox2,
Oct4, Nanog and CD133 mRNA by RT-qPCR in SP and non-SP cells
following differentiation by culturing in serum-supplemented medium
for 14 days. (D) Expressions of ALDH1, Sox2, Oct4 and Nanog protein
by western blotting in SP and non-SP cells following
differentiation by culturing in serum-supplemented medium for 14
days. *P<0.05, **P<0.01 vs. respective non-SP. RT-qPCR,
reverse transcription-quantitative polymerase chain reaction;
ALDH1, aldehyde dehydrogenase-1; Sox2, SRY-box 2; Oct4, POU class 5
homeobox 1; Nanog, nanog homeobox; CD133, CD133 antigen; SP, side
population. |
Differential expression of miRNAs in
SP and non-SP cells
Prior to miRNA expression profiling, the
quantitative detection was conducted using a UV spectrophotometer.
The OD260/280 values of the SP and non-SP cell samples (each type
of sample had three repeats) were about 2.0, and the values of
OD260/230 were >1.8 (Table
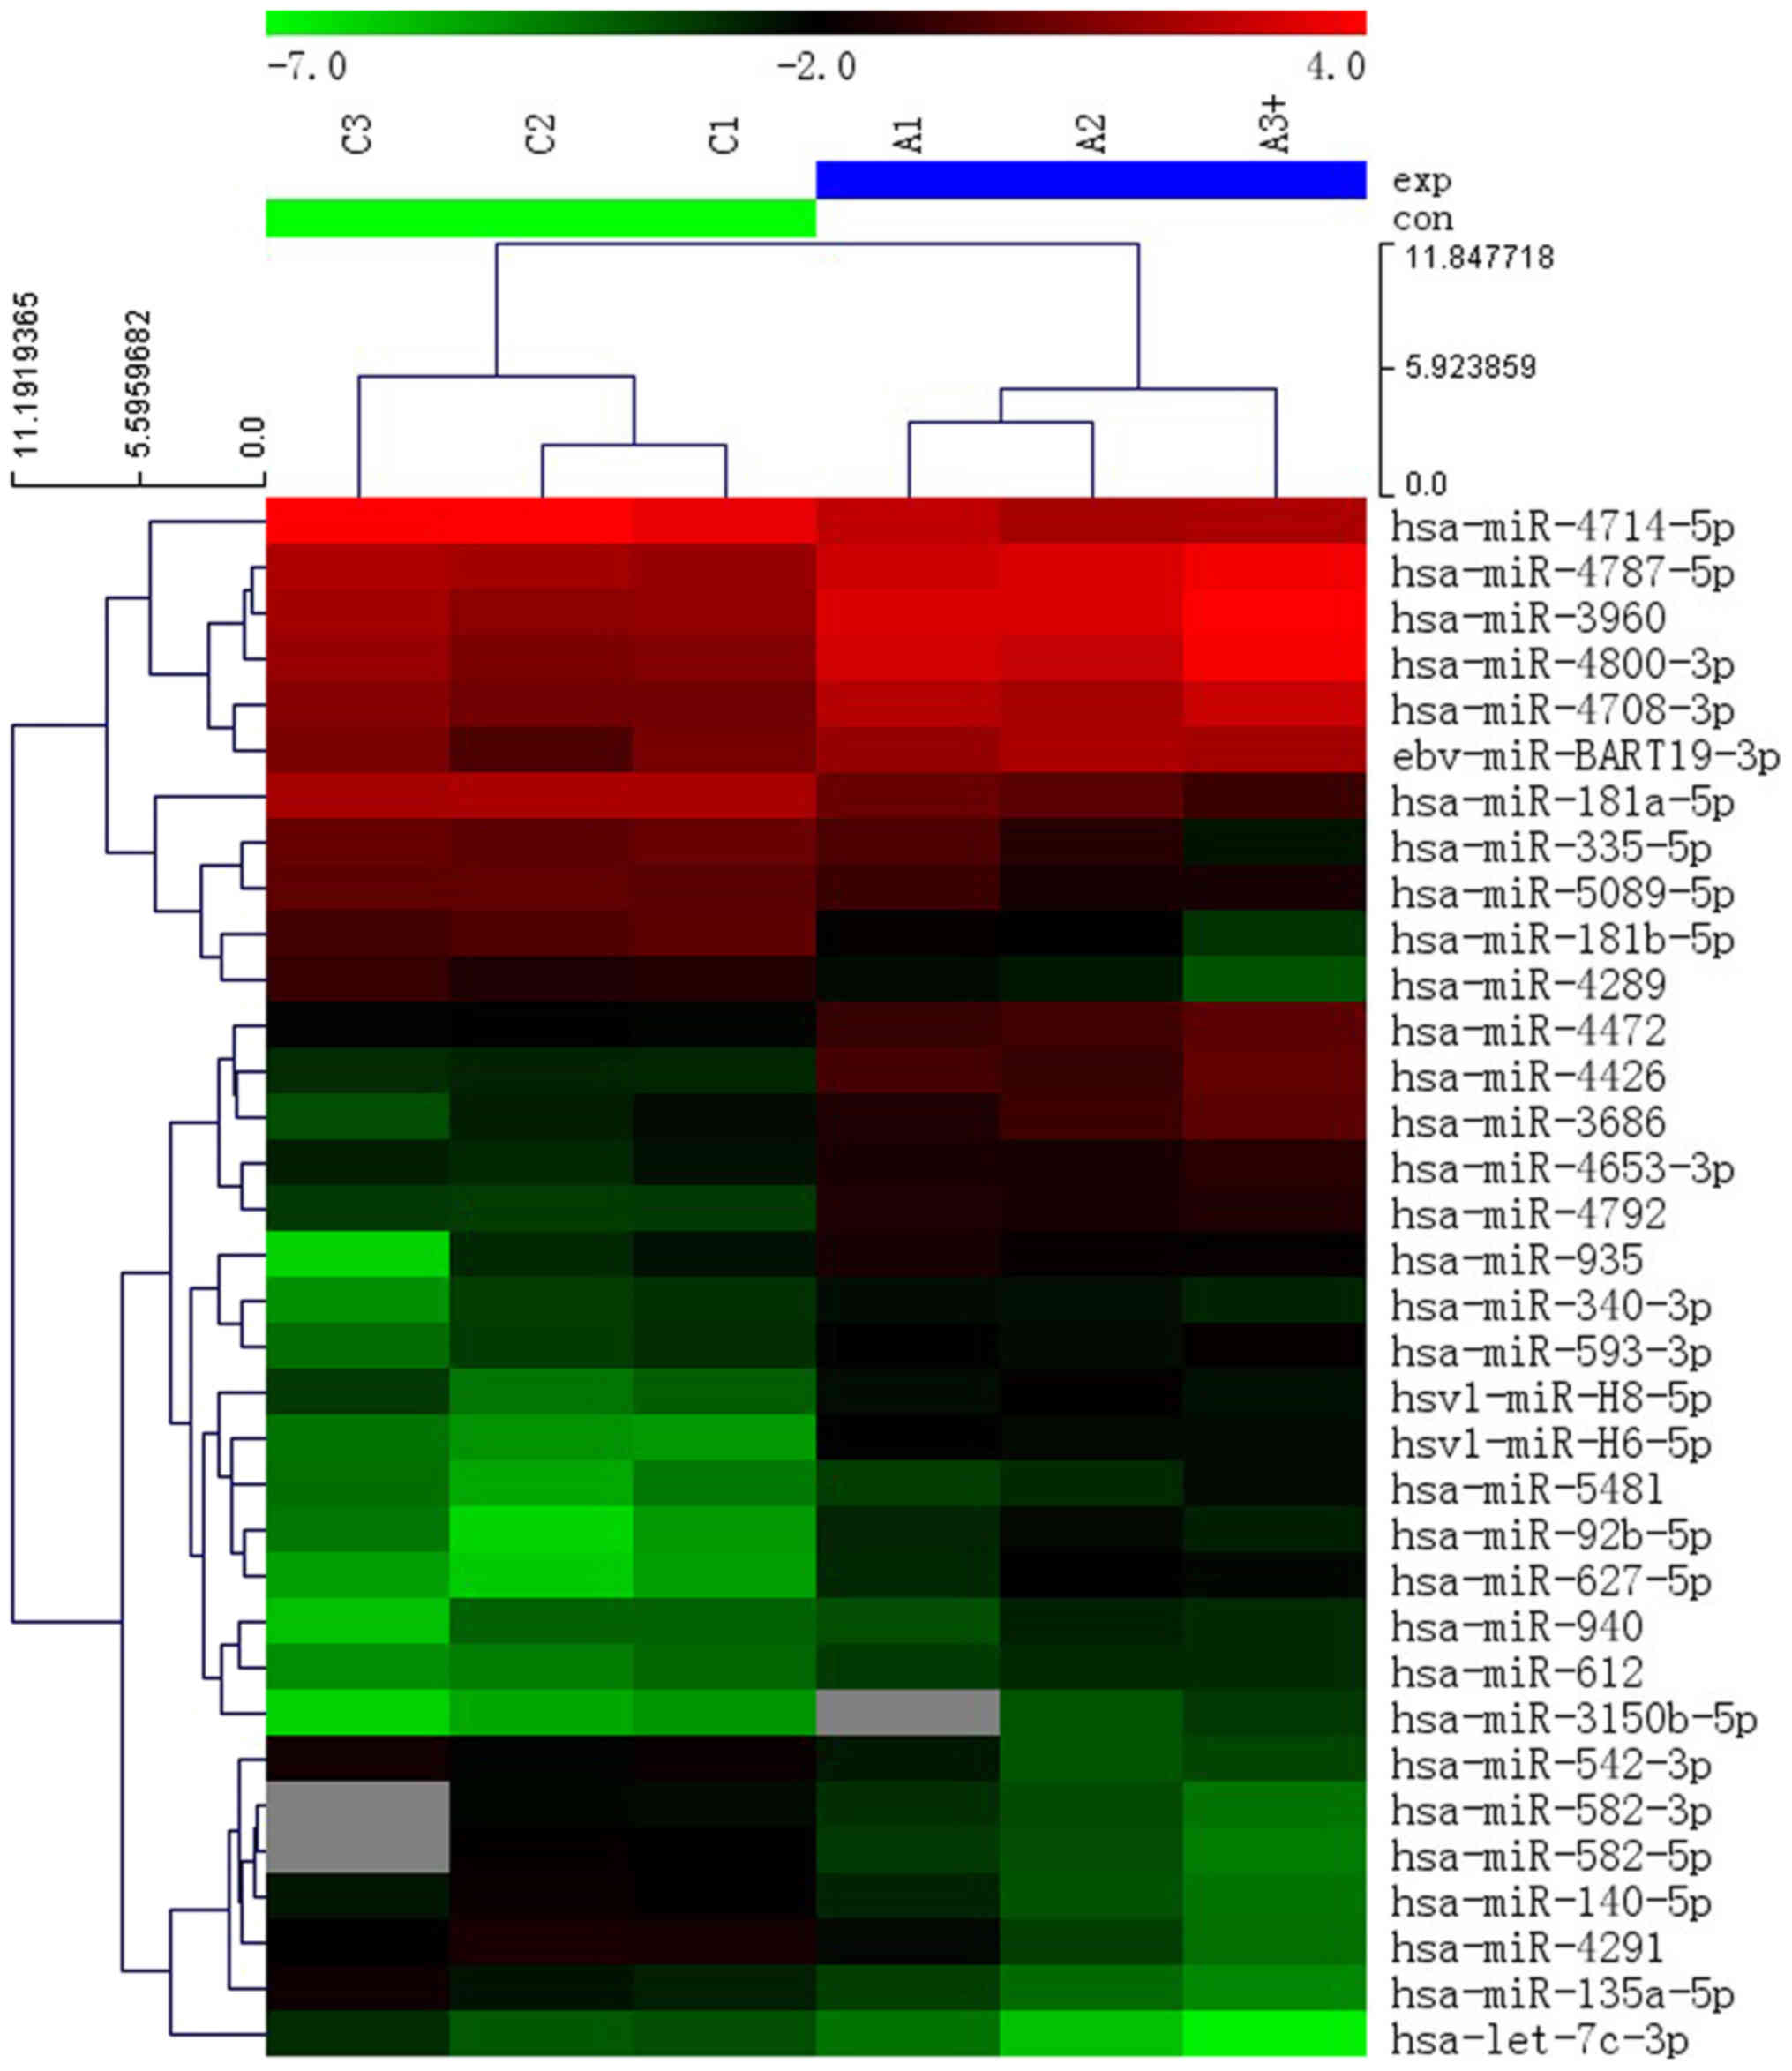
II). GenePix Pro 6.0 was used to identify 34 miRNAs that were
significantly differentially expressed, of which, 21 miRNAs were
upregulated and 13 miRNAs were downregulated, based on a fold
change >2.0 and P<0.05 threshold in SP cells compared with
the non-SP cells (Fig. 5). The
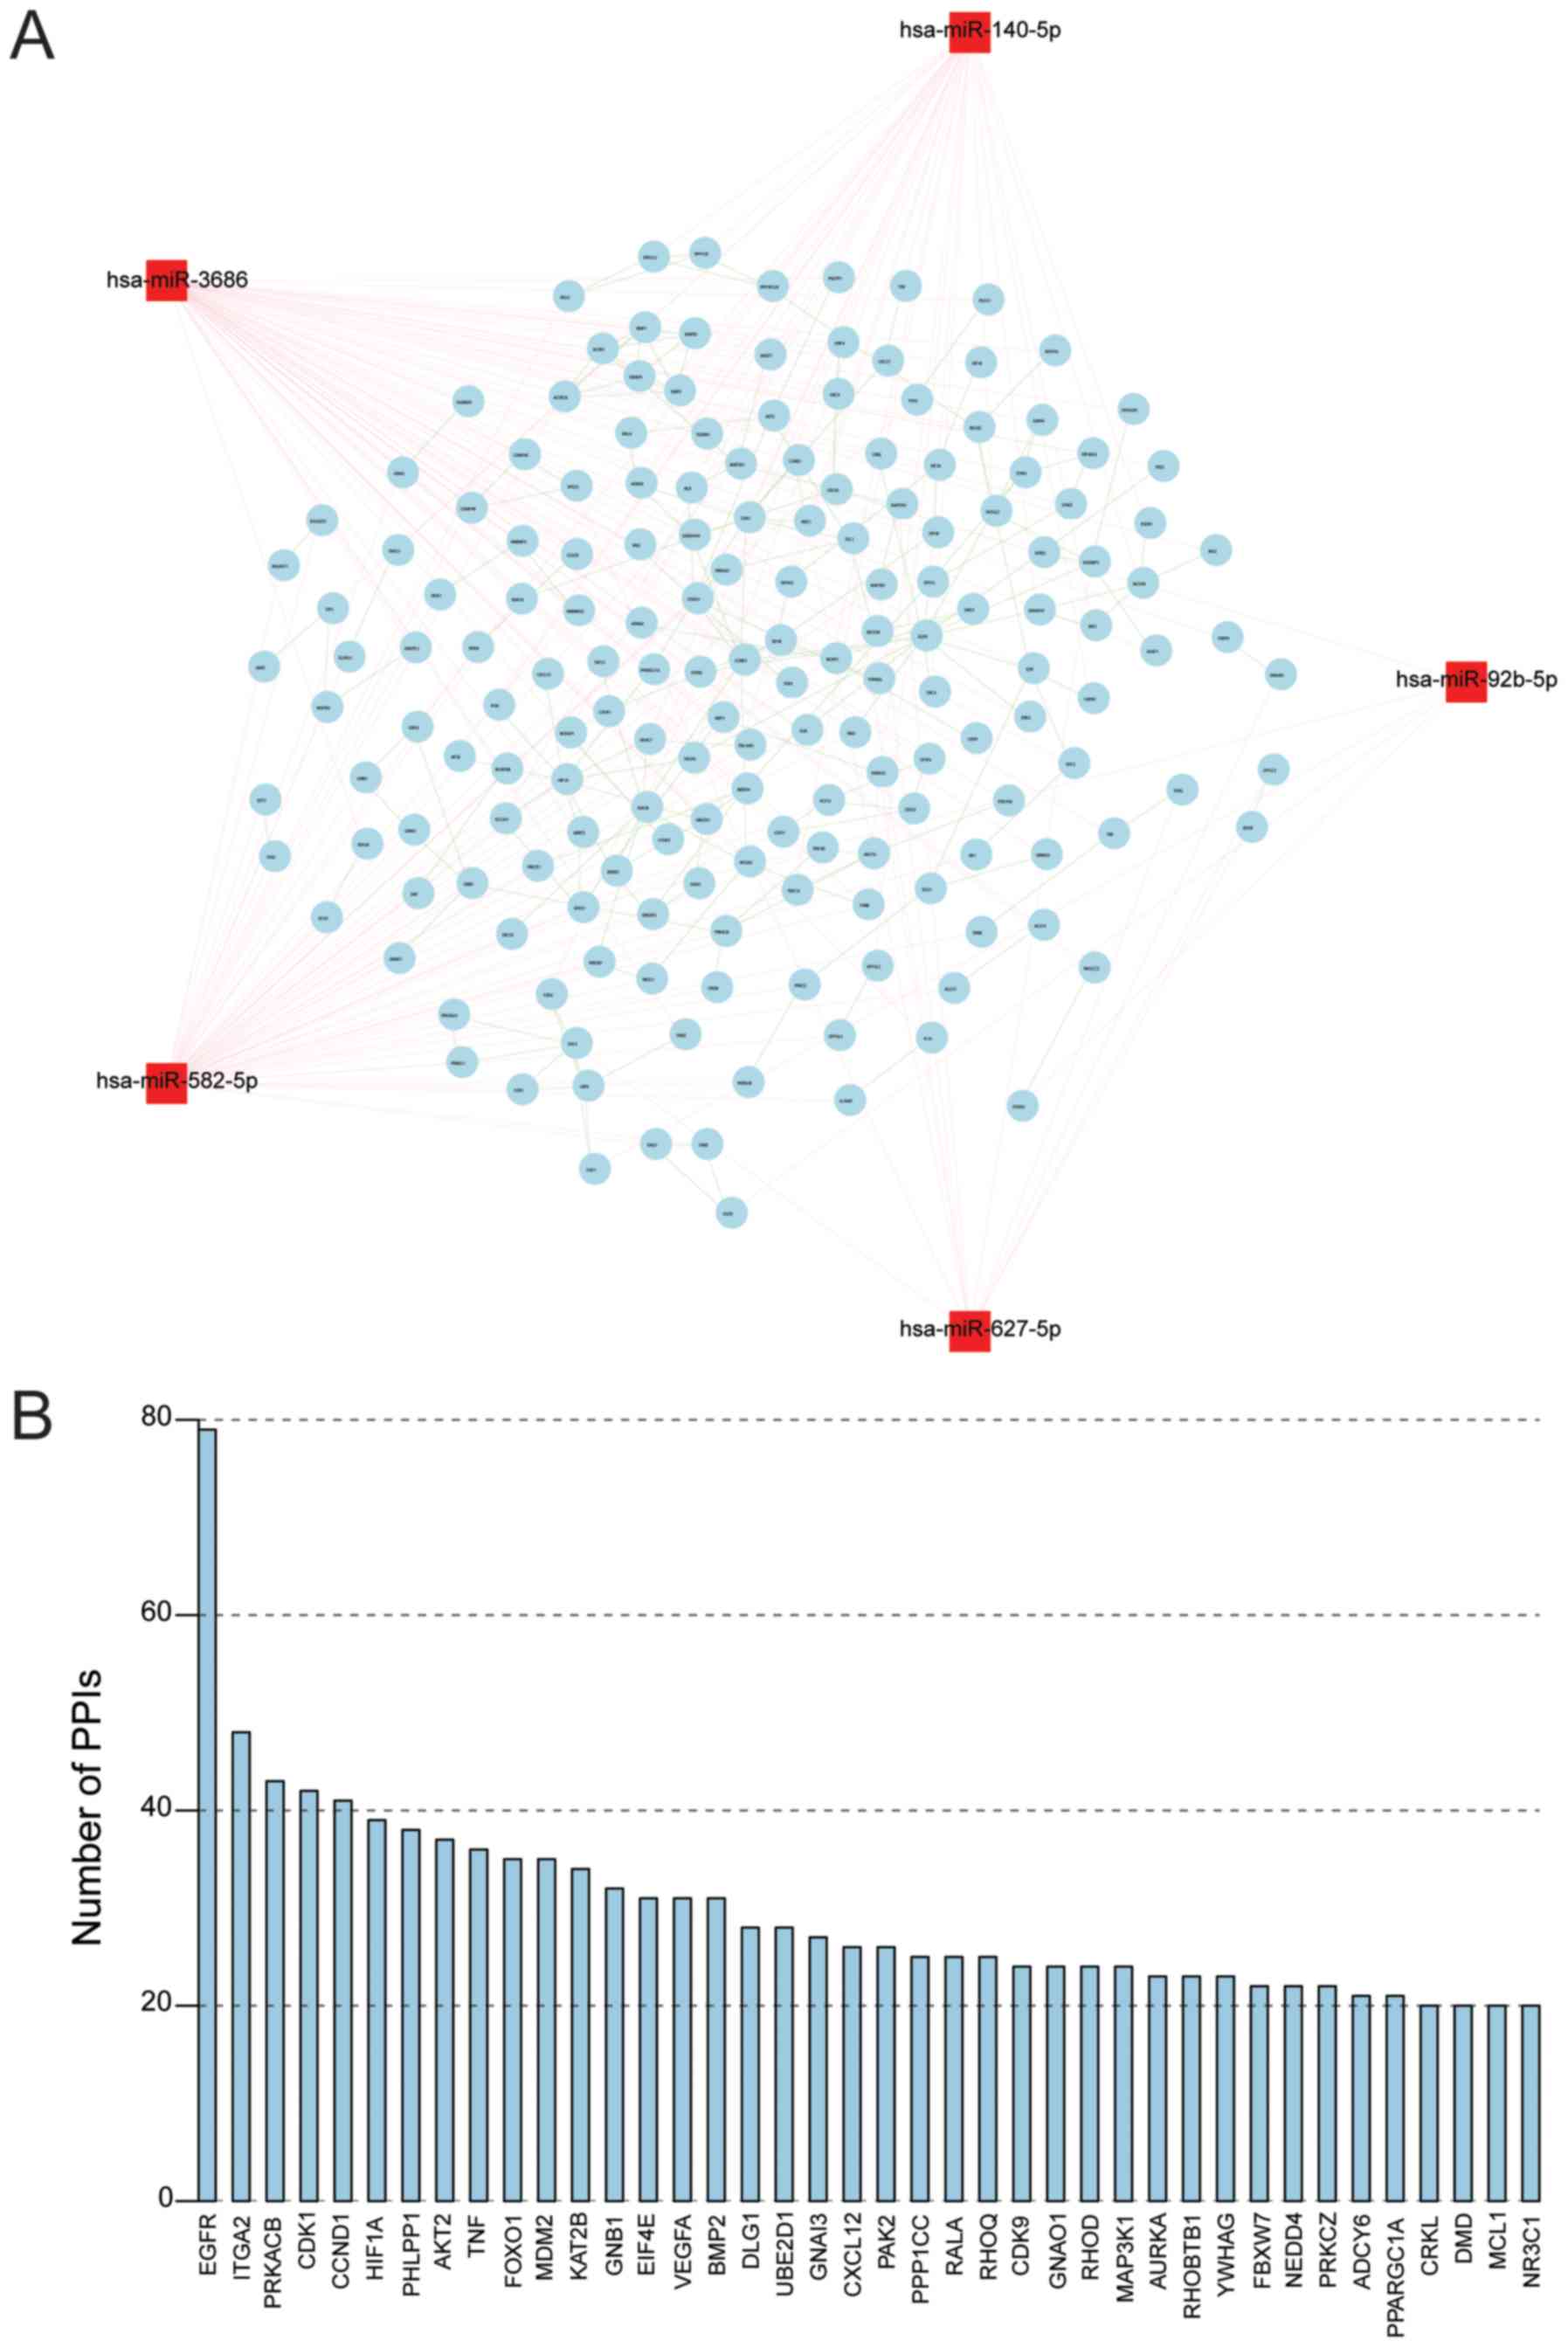
miRNA-gene-gene regulatory network was constructed, involving 5
miRNAs (has-miR-140-5p, has-miR-3686, has-miR-92b-5p,
has-miR-582-5p and has-miR-627-5p) and 176 genes (Fig. 6A). The number of genes in this
network was obtained (Fig. 6B).
The PPI number of each gene in this network was counted, and the
top five genes with high PPI numbers were epidermal growth factor
receptor (EGFR), integrin subunit α 2 (ITGA2), protein kinase
cAMP-activated catalytic subunit β (PRKACB), cyclin dependent
kinase (CDK1) and cyclin D1 (CCND1), which require further
investigation.
| Table II.Prior to microRNA expression
profiling, the RNA quantification and quality assurance were
determined. |
Table II.
Prior to microRNA expression
profiling, the RNA quantification and quality assurance were
determined.
| Samples | OD260/280
ratio | OD260/230
ratio | Concentration
(ng/µl) | Volume (µl) | Quantity (ng) | QC result (pass or
fail) |
|---|
| SP cells | 1.95 | 2.05 | 641.82 | 40 | 25,672.80 | Pass |
|
| 1.90 | 2.15 | 387.47 | 40 | 15,498.80 | Pass |
|
| 1.94 | 2.28 | 398.44 | 40 | 15,937.60 | Pass |
| Non-SP cells | 2.04 | 2.24 | 818.34 | 40 | 32,733.60 | Pass |
|
| 2.06 | 2.22 | 990.04 | 40 | 39,601.60 | Pass |
|
| 2.08 | 1.97 | 888.39 | 50 | 44,419.50 | Pass |
Discussion
During the last decades, the existence of CSCs has
been identified in hematopoietic cancers in addition to a variety
range of solid tumors, including breast, brain, lung, colon,
prostate, head and neck, and other cancer types (38,39).
Mackenzie (40) identified that
only a small number of cells in the OSCC had the ability to clone.
Locke et al (41) observed
that even the long-term culture of human OSCC additionally contains
different types of cell subsets in vitro with normal oral
epithelial stem cells and transient amplifying cells, which
correspond to a small group of cells with stem cell-like
characteristics. Although the study of CSC in hematological
malignancies and specific solid tumors has progressed, the methods
of isolation and identification of CSCs still require optimization
as a number of CSCs surface markers have not been identified.
The percentage of SP cells vary in different OSCC
cell lines, ranging between 0.2 and 9.8% of the total cell
populations in the cell lines (10–14).
With regards to the Tca8113 cell line, Zhang et al (10) reported a percentage of 0.2%. In the
present study, the Hoechst 33342 staining demonstrated that <1%
Tca8113 SP cells were sorted, confirming only a small fraction of
the number of SP cells is present in the Tca8113 cell line.
Cell proliferation and migration ability were
recorded using IncuCyte Zoom, thus enabling the determination of
cell growth with high accuracy during live cell imaging, and
eliminating the requirement for destroying cellular structures for
other methods. The results of the imaging demonstrated that
compared with the non-SP cells, SP cells derived from the Tca8113
OSCC cell line exhibited increased proliferation, colony-forming
and migration ability. In the present study, the expression of CSC
markers, including CD133, CD44 and ALDH1, were investigated in the
sorted SP cells. A small subpopulation of CD133+ CSCs in
OSCC cell lines (including SCC-016, SCC-076 and SCC-29B) had been
isolated in a previous study, and CD133+ CSCs
demonstrated high clonogenicity, invasiveness and tumorigenicity
(17). The stem-like SP cells
derived from the Tca/cisplatin OSCC cell line exhibited a higher
expression level of CD44 compared with the non-SP cells (10). Chiou et al (13) additionally identified SP cells in
the SCC-55 OSCC cell line that overexpressed CD44 (11). However, the present results
demonstrated that there was no significant difference in CD133 and
CD44 between SP cells and non-SP cells derived from the Tca8113
cell line. This different expression pattern of surface CSC markers
may be due to the different cell lines of OSCC. Notably, the
results of flow cytometry demonstrated that the ratio of
ALDH1+ in SP cells was increased ~10 times compared with
non-SP cells. Additionally, overexpression of ALDH1 mRNA and
protein in SP cells was detected by RT-qPCR and western blot
analysis. To the best of our knowledge, this is the first study
demonstrating the overexpression of ALDH1 in the stem-like OSCC SP
cells. When the SP cells were incubated with SSM for 14 days, the
percentage of ALDH1 was decreased between 7% and >1%, similar to
the ordinary tumor cells. These results suggested that following
culture in SSM for 14 days, the cancer stem-like SP cells were
differentiated and, thus, no longer exhibited CSC properties.
Furthermore, the Sox2, Oct4 and Nanog gene regulatory network have
a role in the negative feedback loop in maintaining human embryonic
stem cells (42,43). The present study used cell
proliferation, scratch and colony formation assays, flow cytometry,
and RT-qPCR to detect mRNA and protein expression; the present
results demonstrated that SP cells possess characteristics of
CSCs.
Microarray analysis of miRNAs identified 34 miRNAs
associated with SP cells in Tca8113 cell lines. The microarray
results suggested that 21 miRNAs exhibited high expression of tumor
stem cells and 13 miRNAs exhibited low expression, and they may
serve a role in the regulation of cell differentiation. There are
specific miRNA expression profiles in CSCs, which provided relevant
information for the establishment of a novel miRNA-based approach
for diagnosis and treatment of OSCC (44). miRNAs are an abundant class of
small non-coding RNAs, consisting of ~22 nucleotides that
negatively regulate gene expression at the post-transcriptional
level by blocking mRNA translation or degrading target mRNAs
(45). The interaction between the
genes in the network was statistically analyzed, and EGFR, ITGA2,
PRKACB, CDK1 and CCND1 genes were in the top five genes in the
miRNA regulatory network. EGFR is most notably regarded as a
cancer-associated molecule. Overexpression of EGFR activated a
number of principal pathways that were crucial for tumor growth,
progression and survival (46).
Elevated expression of EGFR has been demonstrated in oral cancer
and is frequently associated with poor clinical outcome (47), thus representing a potential target
for treatment. ITGA2 is one of the integrins involved in
epithelial-mesenchymal transitions (EMT) (48). EMT is an important process
associated with tumor metastasis (49). ITGA2 has been reported to have a
role in multiple cancer types (50,51).
It has been reported that expression of ITGA11 in cancer-associated
fibroblasts alters the tumor behavior of OSCC cells (52); however, the role of ITGA2 in OSCC
has not been investigated previously, to the best of our knowledge.
Targeting ITGA2 may improve the efficacy of treatment for patients
with OSCC. Future studies may aim to investigate the 34 genes
investigated.
There are a number of limitations of the present
study. SP and non-SP cells were cultured in individual conditions
(SFM and SSM), which may affect results. To describe the
characteristics of SP and non-SP cells further, the cells require
culturing in the same conditions following sorting and subjected to
further analysis. Secondly, the results of the miRNA array have not
been validated by PCR, which should be conducted in vitro
and in vivo in further studies. Thirdly, although there was
no significant difference in CD133 mRNA expression level between SP
and non-SP cells, the expression of CD133 at the protein expression
level requires investigation.
In conclusion, SP cells in Tca8113 demonstrated
increased capability of proliferation and colony formation compared
with non-SP cells in vitro. Stem cell markers were
overexpressed in SP cells compared with non-SP cells. In total, 21
miRNAs were upregulated and 13 miRNAs were downregulated in SP
cells compared with non-SP.
Acknowledgements
The authors would like to thank Dr Yan Lv (Institute
and Department of Stomatology, Chinese People's Liberation Army
General Hospital, Beijing, China) for assistance.
Funding
The present study is supported by Beijing Municipal
Natural Science Foundation of China (grant no. 7122174) and the
National Natural Science Foundation of China (grant no.
81271180).
Availability of data and materials
The datasets used and/or analyzed during the current
study are available from the corresponding author on reasonable
request.
Authors' contributions
WL and RSL designed the present study. WL, LLE, YB,
XPK and HCL performed the experiments. HWL and HW performed the
statistical analysis. WL and HCL wrote the manuscript. RSL, LLE and
YB revised the manuscript. All authors approved the final version
of the manuscript for publication.
Ethics approval and consent to
participate
Not applicable.
Patient consent for publication
Not applicable.
Competing interests
The authors declare that they have no competing
interests.
References
|
1
|
Argiris A, Karamouzis MV, Raben D and
Ferris RL: Head and neck cancer. Lancet. 371:1695–1709. 2008.
View Article : Google Scholar : PubMed/NCBI
|
|
2
|
Mascolo M, Siano M, Ilardi G, Russo D,
Merolla F, De Rosa G and Staibano S: Epigenetic disregulation in
oral cancer. Int J Mol Sci. 13:2331–2353. 2012. View Article : Google Scholar : PubMed/NCBI
|
|
3
|
Clevers H: The cancer stem cell: Premises,
promises and challenges. Nat Med. 17:313–319. 2011. View Article : Google Scholar : PubMed/NCBI
|
|
4
|
Reya T, Morrison SJ, Clarke MF and
Weissman IL: Stem cells, cancer, and cancer stem cells. Nature.
414:105–111. 2001. View
Article : Google Scholar : PubMed/NCBI
|
|
5
|
Chen K, Huang YH and Chen JL:
Understanding and targeting cancer stem cells: Therapeutic
implications and challenges. Acta Pharmacol Sin. 34:732–740. 2013.
View Article : Google Scholar : PubMed/NCBI
|
|
6
|
Donnenberg VS and Donnenberg AD: Multiple
drug resistance in cancer revisited: The cancer stem cell
hypothesis. J Clin Pharmacol. 45:872–877. 2005. View Article : Google Scholar : PubMed/NCBI
|
|
7
|
Setoguchi T, Taga T and Kondo T: Cancer
stem cells persist in many cancer cell lines. Cell Cycle.
3:414–415. 2004. View Article : Google Scholar : PubMed/NCBI
|
|
8
|
Hadnagy A, Gaboury L, Beaulieu R and
Balicki D: SP analysis may be used to identify cancer stem cell
populations. Exp Cell Res. 312:3701–3710. 2006. View Article : Google Scholar : PubMed/NCBI
|
|
9
|
Kondo T, Setoguchi T and Taga T:
Persistence of a small subpopulation of cancer stem-like cells in
the C6 glioma cell line. Proc Natl Acad Sci USA. 101:781–786. 2004.
View Article : Google Scholar : PubMed/NCBI
|
|
10
|
Zhang P, Zhang Y, Mao L, Zhang Z and Chen
W: Side population in oral squamous cell carcinoma possesses tumor
stem cell phenotypes. Cancer Lett. 277:227–234. 2009. View Article : Google Scholar : PubMed/NCBI
|
|
11
|
Liu Y, Cui P, Chen J and Li W: Isolation
and phenotypic characterization of side population cells in oral
squamous cell carcinoma. Mol Med Rep. 11:3642–3646. 2015.
View Article : Google Scholar : PubMed/NCBI
|
|
12
|
Yu CC, Hu FW, Yu CH and Chou MY: Targeting
CD133 in the enhancement of chemosensitivity in oral squamous cell
carcinoma-derived side population cancer stem cells. Head Neck. 38
Suppl 1:E231–E238. 2016. View Article : Google Scholar : PubMed/NCBI
|
|
13
|
Chiou SH, Yu CC, Huang CY, Lin SC, Liu CJ,
Tsai TH, Chou SH, Chien CS, Ku HH and Lo JF: Positive correlations
of Oct-4 and Nanog in oral cancer stem-like cells and high-grade
oral squamous cell carcinoma. Clin Cancer Res. 14:4085–4095. 2008.
View Article : Google Scholar : PubMed/NCBI
|
|
14
|
Hayashi S, Tanaka J, Okada S, Isobe T,
Yamamoto G, Yasuhara R, Irie T, Akiyama C, Kohno Y, Tachikawa T and
Mishima K: Lin28a is a putative factor in regulating cancer stem
cell-like properties in side population cells of oral squamous cell
carcinoma. Exp Cell Res. 319:1220–1228. 2013. View Article : Google Scholar : PubMed/NCBI
|
|
15
|
Bourguignon LY, Peyrollier K, Xia W and
Gilad E: Hyaluronan-CD44 interaction activates stem cell marker
Nanog, Stat-3-mediated MDR1 gene expression, and ankyrin-regulated
multidrug efflux in breast and ovarian tumor cells. J Biol Chem.
283:17635–17651. 2008. View Article : Google Scholar : PubMed/NCBI
|
|
16
|
Zöller M: CD44: Can a cancer-initiating
cell profit from an abundantly expressed molecule? Nat Rev Cancer.
11:254–267. 2011. View
Article : Google Scholar : PubMed/NCBI
|
|
17
|
Zhang Q, Shi S, Yen Y, Brown J, Ta JQ and
Le AD: A subpopulation of CD133(+) cancer stem-like cells
characterized in human oral squamous cell carcinoma confer
resistance to chemotherapy. Cancer Lett. 289:151–160. 2010.
View Article : Google Scholar : PubMed/NCBI
|
|
18
|
Resetkova E, Reis-Filho JS, Jain RK, Mehta
R, Thorat MA, Nakshatri H and Badve S: Prognostic impact of ALDH1
in breast cancer: A story of stem cells and tumor microenvironment.
Breast Cancer Res Treat. 123:97–108. 2010. View Article : Google Scholar : PubMed/NCBI
|
|
19
|
Ota N, Ohno J, Seno K, Taniguchi K and
Ozeki S: In vitro and in vivo expression of aldehyde dehydrogenase
1 in oral squamous cell carcinoma. Int J Oncol. 44:435–442. 2014.
View Article : Google Scholar : PubMed/NCBI
|
|
20
|
Ginestier C, Hur MH, Charafe-Jauffret E,
Monville F, Dutcher J, Brown M, Jacquemier J, Viens P, Kleer CG,
Liu S, et al: ALDH1 is a marker of normal and malignant human
mammary stem cells and a predictor of poor clinical outcome. Cell
Stem Cell. 1:555–567. 2007. View Article : Google Scholar : PubMed/NCBI
|
|
21
|
Huang EH, Hynes MJ, Zhang T, Ginestier C,
Dontu G, Appelman H, Fields JZ, Wicha MS and Boman BM: Aldehyde
dehydrogenase 1 is a marker for normal and malignant human colonic
stem cells (SC) and tracks SC overpopulation during colon
tumorigenesis. Cancer Res. 69:3382–3389. 2009. View Article : Google Scholar : PubMed/NCBI
|
|
22
|
Silva IA, Bai S, McLean K, Yang K,
Griffith K, Thomas D, Ginestier C, Johnston C, Kueck A, Reynolds
RK, et al: Aldehyde dehydrogenase in combination with CD133 defines
angiogenic ovarian cancer stem cells that portend poor patient
survival. Cancer Res. 71:3991–4001. 2011. View Article : Google Scholar : PubMed/NCBI
|
|
23
|
Chen YC, Chen YW, Hsu HS, Tseng LM, Huang
PI, Lu KH, Chen DT, Tai LK, Yung MC, Chang SC, et al: Aldehyde
dehydrogenase 1 is a putative marker for cancer stem cells in head
and neck squamous cancer. Biochem Biophys Res Commun. 385:307–313.
2009. View Article : Google Scholar : PubMed/NCBI
|
|
24
|
Ma S, Chan KW, Lee TK, Tang KH, Wo JY,
Zheng BJ and Guan XY: Aldehyde dehydrogenase discriminates the
CD133 liver cancer stem cell populations. Mol Cancer Res.
6:1146–1153. 2008. View Article : Google Scholar : PubMed/NCBI
|
|
25
|
Liu W, Wu L, Shen XM, Shi LJ, Zhang CP, Xu
LQ and Zhou ZT: Expression patterns of cancer stem cell markers
ALDH1 and CD133 correlate with a high risk of malignant
transformation of oral leukoplakia. Int J Cancer. 132:868–874.
2013. View Article : Google Scholar : PubMed/NCBI
|
|
26
|
Wiklund ED, Gao S, Hulf T, Sibbritt T,
Nair S, Costea DE, Villadsen SB, Bakholdt V, Bramsen JB, Sørensen
JA, et al: MicroRNA alterations and associated aberrant DNA
methylation patterns across multiple sample types in oral squamous
cell carcinoma. PLoS One. 6:e278402011. View Article : Google Scholar : PubMed/NCBI
|
|
27
|
Scapoli L, Palmieri A, Lo Muzio L,
Pezzetti F, Rubini C, Girardi A, Farinella F, Mazzotta M and
Carinci F: MicroRNA expression profiling of oral carcinoma
identifies new markers of tumor progression. Int J Immunopathol
Pharmacol. 23:1229–1234. 2010. View Article : Google Scholar : PubMed/NCBI
|
|
28
|
Zhang X, Su Y, Zhang M and Sun Z: Opposite
effects of arsenic trioxide on the Nrf2 pathway in oral squamous
cell carcinoma in vitro and in vivo. Cancer Lett. 318:93–98. 2012.
View Article : Google Scholar : PubMed/NCBI
|
|
29
|
Wang W, Li X, Wang F and Sun XY: Effect of
TET1 regulating MGMT on chemotherapy resistance of oral squamous
cell carcinoma stem cells. J Cell Biochem. 119:723–735. 2018.
View Article : Google Scholar : PubMed/NCBI
|
|
30
|
Scharenberg CW, Harkey MA and Torok-Storb
B: The ABCG2 transporter is an efficient Hoechst 33342 efflux pump
and is preferentially expressed by immature human hematopoietic
progenitors. Blood. 99:507–512. 2002. View Article : Google Scholar : PubMed/NCBI
|
|
31
|
Pandey S, Walpole C, Cabot PJ, Shaw PN,
Batra J and Hewavitharana AK: Selective anti-proliferative
activities of Carica papaya leaf juice extracts against prostate
cancer. Biomed Pharmacother. 89:515–523. 2017. View Article : Google Scholar : PubMed/NCBI
|
|
32
|
Livak KJ and Schmittgen TD: Analysis of
relative gene expression data using real-time quantitative PCR and
the 2(-Delta Delta C(T)) method. Methods. 25:402–408. 2001.
View Article : Google Scholar : PubMed/NCBI
|
|
33
|
Wang X, Liu Q, Hou B, Zhang W, Yan M, Jia
H, Li H, Yan D, Zheng F, Ding W, et al: Concomitant targeting of
multiple key transcription factors effectively disrupts cancer stem
cells enriched in side population of human pancreatic cancer cells.
PLoS One. 8:e739422013. View Article : Google Scholar : PubMed/NCBI
|
|
34
|
Park T, Yi SG, Kang SH, Lee S, Lee YS and
Simon R: Evaluation of normalization methods for microarray data.
BMC Bioinformatics. 4:332003. View Article : Google Scholar : PubMed/NCBI
|
|
35
|
Saeed AI, Sharov V, White J, Li J, Liang
W, Bhagabati N, Braisted J, Klapa M, Currier T, Thiagarajan M, et
al: TM4: A free, open-source system for microarray data management
and analysis. Biotechniques. 34:374–378. 2003. View Article : Google Scholar : PubMed/NCBI
|
|
36
|
Eisen MB, Spellman PT, Brown PO and
Botstein D: Cluster analysis and display of genome-wide expression
patterns. Proc Natl Acad Sci USA. 95:14863–14868. 1998. View Article : Google Scholar : PubMed/NCBI
|
|
37
|
Ho MM, Ng AV, Lam S and Hung JY: Side
population in human lung cancer cell lines and tumors is enriched
with stem-like cancer cells. Cancer Res. 67:4827–4833. 2007.
View Article : Google Scholar : PubMed/NCBI
|
|
38
|
Tirino V, Desiderio V, Paino F, De Rosa A,
Papaccio F, La Noce M, Laino L, De Francesco F and Papaccio G:
Cancer stem cells in solid tumors: An overview and new approaches
for their isolation and characterization. FASEB J. 27:13–24. 2013.
View Article : Google Scholar : PubMed/NCBI
|
|
39
|
Bonnet D and Dick JE: Human acute myeloid
leukemia is organized as a hierarchy that originates from a
primitive hematopoietic cell. Nat Med. 3:730–737. 1997. View Article : Google Scholar : PubMed/NCBI
|
|
40
|
Mackenzie IC: Growth of malignant oral
epithelial stem cells after seeding into organotypical cultures of
normal mucosa. J Oral Pathol Med. 33:71–78. 2004. View Article : Google Scholar : PubMed/NCBI
|
|
41
|
Locke M, Heywood M, Fawell S and Mackenzie
IC: Retention of intrinsic stem cell hierarchies in
carcinoma-derived cell lines. Cancer Res. 65:8944–8950. 2005.
View Article : Google Scholar : PubMed/NCBI
|
|
42
|
Narayan S, Bryant G, Shah S, Berrozpe G
and Ptashne M: OCT4 and SOX2 work as transcriptional activators in
reprogramming human fibroblasts. Cell Rep. 20:1585–1596. 2017.
View Article : Google Scholar : PubMed/NCBI
|
|
43
|
Marucci L: Nanog dynamics in mouse
embryonic stem cells: Results from systems biology approaches. Stem
Cells Int. 2017:71604192017. View Article : Google Scholar : PubMed/NCBI
|
|
44
|
Polyak K and Weinberg RA: Transitions
between epithelial and mesenchymal states: Acquisition of malignant
and stem cell traits. Nat Rev Cancer. 9:265–273. 2009. View Article : Google Scholar : PubMed/NCBI
|
|
45
|
Shenouda SK and Alahari SK: MicroRNA
function in cancer: Oncogene or a tumor suppressor? Cancer
Metastasis Rev. 28:369–378. 2009. View Article : Google Scholar : PubMed/NCBI
|
|
46
|
Lo HW and Hung MC: Nuclear EGFR signalling
network in cancers: Linking EGFR pathway to cell cycle progression,
nitric oxide pathway and patient survival. Br J Cancer. 96
Suppl:R16–R20. 2007.PubMed/NCBI
|
|
47
|
Ribeiro FA, Noguti J, Oshima CT and
Ribeiro DA: Effective targeting of the epidermal growth factor
receptor (EGFR) for treating oral cancer: A promising approach.
Anticancer Res. 34:1547–1552. 2014.PubMed/NCBI
|
|
48
|
Liu X, Liang Z, Gao K, Li H, Zhao G, Wang
S and Fang J: MicroRNA-128 inhibits EMT of human osteosarcoma cells
by directly targeting integrin α2. Tumor Biol. 6:7951–7957. 2016.
View Article : Google Scholar
|
|
49
|
Yang J and Weinberg RA:
Epithelial-mesenchymal transition: At the crossroads of development
and tumor metastasis. Dev Cell. 14:818–829. 2008. View Article : Google Scholar : PubMed/NCBI
|
|
50
|
Chin SP, Marthick JR, West AC, Short AK,
Chuckowree J, Polanowski AM, Thomson RJ, Holloway AF and Dickinson
JL: Regulation of the ITGA2 gene by epigenetic mechanisms in
prostate cancer. Prostate. 75:723–734. 2015. View Article : Google Scholar : PubMed/NCBI
|
|
51
|
Ding W, Fan XL, Xu X, Huang JZ, Xu SH,
Geng Q, Li R, Chen D and Yan GR: Epigenetic silencing of ITGA2 by
MiR-373 promotes cell migration in breast cancer. PLoS One.
10:e01351282015. View Article : Google Scholar : PubMed/NCBI
|
|
52
|
Parajuli H, Sapkota D, Suleiman S, Cormack
EM, Johannessen AC, Gullberg D and Costea DE: 28 Expression of
integrin α-11 by carcinoma associated fibroblasts modulates oral
squamous cell carcinoma behavior. Oral Oncol. 51:e362015.
View Article : Google Scholar
|