Introduction
Alzheimer's disease (AD) is the most common form of
senile dementia characterized by neuronal death, loss of synaptic
function and atrophy in areas of the brain that affect cognitive
functions and memory (1,2). The prevalence of AD is estimated to
triple by 2050, increasing significant economic and social burden
on patients and society (3).
Currently, cognitive testing and neuroimaging remain the gold
standard for the diagnosis of AD (4); however, these clinical techniques are
complicated and expensive (5).
Thus, simple and convenient biomarkers are critically required to
improve diagnosis of early stage AD (6). Screening for biomarkers in patients
with AD is predominantly reported for cerebrospinal fluid, blood
and other biological samples, such as urine, breath and saliva
(7,8). Increasing evidence has demonstrated
that detection of biomarkers in peripheral blood is minimally
invasive, low-cost and easily applied for mass screening (9,10).
MicroRNAs (miRNAs/miRs) are 22–23 nucleotide long
small non-coding RNAs, which suppress gene expression through
binding to the 3′-untranslated region of corresponding mRNAs
(11). It has been reported that
miRNAs are ideal biomarkers due to their stability in body fluids,
and can be attributed to specific organs and pathologies in AD
(12). For example, Hara et
al (13) demonstrated that
hsa-miR-501-3p may be a serum biomarker that could correspond to
pathological events occurring in the brain of patients with AD.
Additionally, Jia and Liu (14)
reported that downregulated hsa-miR-223 serum may serve as a
biomarker in AD, as demonstrated by quantitative PCR analysis of
serum samples from 84 probable sporadic patients with AD and 62
healthy individuals in China.
Currently, a number of studies have identified
several miRNAs or mRNAs that are significantly differentially
expressed (DE) in the blood from patients with AD compared with
normal control samples, indicating their key functions in the
pathogenesis of AD (13,14). However, the comparability of these
studies is particularly challenging due to their small sample size,
as well as differences in their quantification methods and
protocols. There is a need to combine the study results using a
meta-analysis approach to improve the understanding of the
molecular mechanisms underlying AD. Chen et al (15) analyzed nine representative miRNA
datasets of AD samples, which originated from tissues, serum,
extracellular or cerebrospinal fluid, and identified 13 key miRNAs
associated with AD. Cătană et al (16) evaluated the diagnostic value of
miRNAs expressed in different body fluids of patients with AD using
two meta-analytical approaches with different statistic indicators.
However, a detailed map of specific biomarkers in the blood of
patients with AD is still lacking.
The present study systematically analyzed 15
representative miRNA and mRNA datasets of the blood from patients
with AD using a series of bioinformatics methods. The present study
identified several key miRNAs, mRNAs and pathways affecting the
pathogenesis of AD, providing novel insights into the molecular
mechanisms underlying AD.
Materials and methods
miRNA and mRNA expression
datasets
The miRNA and mRNA expression profiles of patients
with AD were downloaded from the Gene Expression Omnibus (GEO)
database (http://www.ncbi.nlm.nih.gov/geo), which is a public
repository for high-throughput gene expression datasets (17). The present study collected 12
representative miRNA and three mRNA expression profiles of blood
samples from patients with AD and normal control samples. All
datasets contained at least three AD samples and had age-matched
normal control samples in each group. Among the 12 miRNA expression
datasets, seven focused on serum (9,10,13,14,18–20),
three on plasma (21–23), one on both serum and plasma
(24), and one focused on whole
blood (25). The three mRNA
expression datasets all focused on whole blood (5). Detailed information of these datasets
are presented in Table I.
 | Table I.Summary of the microRNA and mRNA
datasets analyzed. |
Table I.
Summary of the microRNA and mRNA
datasets analyzed.
| Author (year) | Study ID | RNA type | Patient count | Control count | Blood
component | Upregulated | Downregulated | (Refs.) |
|---|
| Tan et al
(2014) | 1 | miRNA | 105 | 150 | Serum | hsa-miR-9 | hsa-miR-125b,
hsa-miR-181c | (9) |
| Galimberti et
al (2014) | 2 | miRNA | 7 | 6 | Serum |
| hsa-miR-125b,
hsa-miR-23a, hsa-miR-26b | (10) |
| Tan et al
(2014) | 3 | miRNA | 50 | 50 | Serum |
| hsa-miR-98-5p,
hsa-miR-885-5p, hsa-miR-483-3p, hsa-miR-342-3p, hsa-miR-191-5p,
hsa-let-7d-5p | (18) |
| Dong et al
(2015) | 4 | miRNA | 127 | 123 | Serum |
| hsa-miR-31,
hsa-miR-93, hsa-miR-143, hsa-miR-146a | (19) |
| Zhu et al
(2014) | 5 | miRNA | 26 | 42 | Serum |
| hsa-miR-210 | (20) |
| Jia et al
(2016) | 6 | miRNA | 84 | 62 | Serum | hsa-miR-519 | hsa-miR-29,
hsa-miR-125b, hsa-miR-223 | (14) |
| Hara et al
(2017) | 7 | miRNA | 27 | 18 | Serum |
| hsa-miR-501-3p,
has-miR-26b-5p | (13) |
| Kumar et al
(2013) | 8 | miRNA | 11 | 20 | Plasma |
| hsa-let-7d-5p,
hsa-let-7g-5p, hsa-miR-15b-5p, hsa-miR-142-3p, hsa-miR-191-5p,
hsa-miR-301a-3p, hsa-miR-545-3p | (21) |
| Kiko et al
(2014) | 9 | miRNA | 10 | 10 | Plasma |
| hsa-miR-34a,
hsa-miR-146a | (22) |
| Wang et al
(2015) | 10 | miRNA | 97 | 81 | Plasma |
| hsa-miR-107 | (23) |
| Liu et al
(2014) | 11 | miRNA | 7 | 7 | Serum, plasma |
| hsa-miR-384 | (24) |
| Leidinger et
al (2013) | 12 | miRNA | 48 | 22 | Whole blood | hsa-miR-151a-3p,
hsa-miR-161, hsa-let-7d-3p, hsa-miR-112, hsa-miR-5010-3p | hsa-miR-103a-3p,
hsa-miR-107, hsa-miR-532-5p, hsa-miR-26b-5p, hsa-let-7f-5p | (25) |
| GSE63060 | 13 | mRNA | 145 | 104 | Whole blood | – | – | (5) |
| GSE63061 | 14 | mRNA | 140 | 135 | Whole blood | – | – | (5) |
| GSE18309 | 15 | mRNA | 3 | 3 | Whole blood | – | – | (5) |
Data processing and differential
expression analysis
The DEmiRNA information was manually extracted from
the publications of 12 miRNA datasets. Only the miRNAs validated by
previous reverse transcription-quantitative PCR analysis were
retained and categorized into upregulated and downregulated miRNAs
in patients with AD compared with normal control samples (Table I). The miRNAs identified in at
least one dataset were integrated as high-confidence DEmiRNAs.
The raw data of three mRNA expression profiles
(GSE63060, GSE63061 and GSE18309) were downloaded from the GEO
database and preprocessed with background correction. Subsequently,
the Limma package in R language (version 3.40.6; http://bioconductor.org/packages/limma)
was used to normalize the datasets and identify the significantly
DEmRNAs with the following cut-off criteria: Adjusted P<0.05 and
|log fold change (logFC)|>0.5. In the case where multiple probes
corresponded to the same gene, the probe with the maximal value was
selected as the expression of that particular gene. The DEmRNAs
were clustered using hierarchical clustering and implemented by
pheatmap package in R language (version 1.0.12) (26). Euclidean distance was selected as a
measure of distance between the samples.
Prediction of miRNA-mRNA
interactions
The putative target mRNAs of high-confidence
DEmiRNAs were predicted using six bioinformatic algorithms
[DIANA-microT (27), miRanda
(28), miRDB (29), miRWalk (30), PICTAR (31) and TargetScan (32)]; the default parameters were used
for all software programs, and target mRNAs identified by at least
four algorithms were retained. Subsequently, target mRNAs
identified in the miRWalk database (http://www.umm.uni-heidelberg.de/apps/zmf/mirwalk)
were selected, which collects data on experiment supported
miRNA-mRNA interactions (30).
Considering miRNAs suppress expression of their target mRNAs, the
DEmRNAs whose expression were inversely associated with the miRNAs
were regarded as the miRNA target.
Construction of miRNA-mRNA network and
identification of hub nodes
The high-confidence DEmiRNA-mRNA interactions were
used to construct the miRNA-mRNA network using Cytoscape software
(version 3.5.0; http://www.cytoscape.org). The hub nodes in the
network were nodes with high scores of network topology property
indictors, which were analyzed using CytoNCA (version 2.1.6) within
Cytoscape, including degree centrality, betweenness centrality and
closeness centrality. In general, a high score of network topology
property indictors indicates important roles in the network.
Functional annotation
Gene Ontology (GO) analysis, which organizes genes
into hierarchical categories and determines the gene regulatory
network on the basis of biological process (BP), molecular function
(MF) and cellular component (CC), was applied to analyze the
functions of genes. Kyoto Encyclopedia of Genes and Genomes (KEGG)
pathway analysis was used to determine which signaling pathways the
genes were enriched in. The Database for Annotation, Visualization
and Integrated Discovery (DAVID; https:/david.ncifcrf.gov) was used for both GO and
KEGG enrichment analyses where a false discovery rate (FDR)
<0.05 was considered to indicate a statistically significant
difference (33).
Results
Differential analysis of miRNAs and
mRNAs in patients with AD
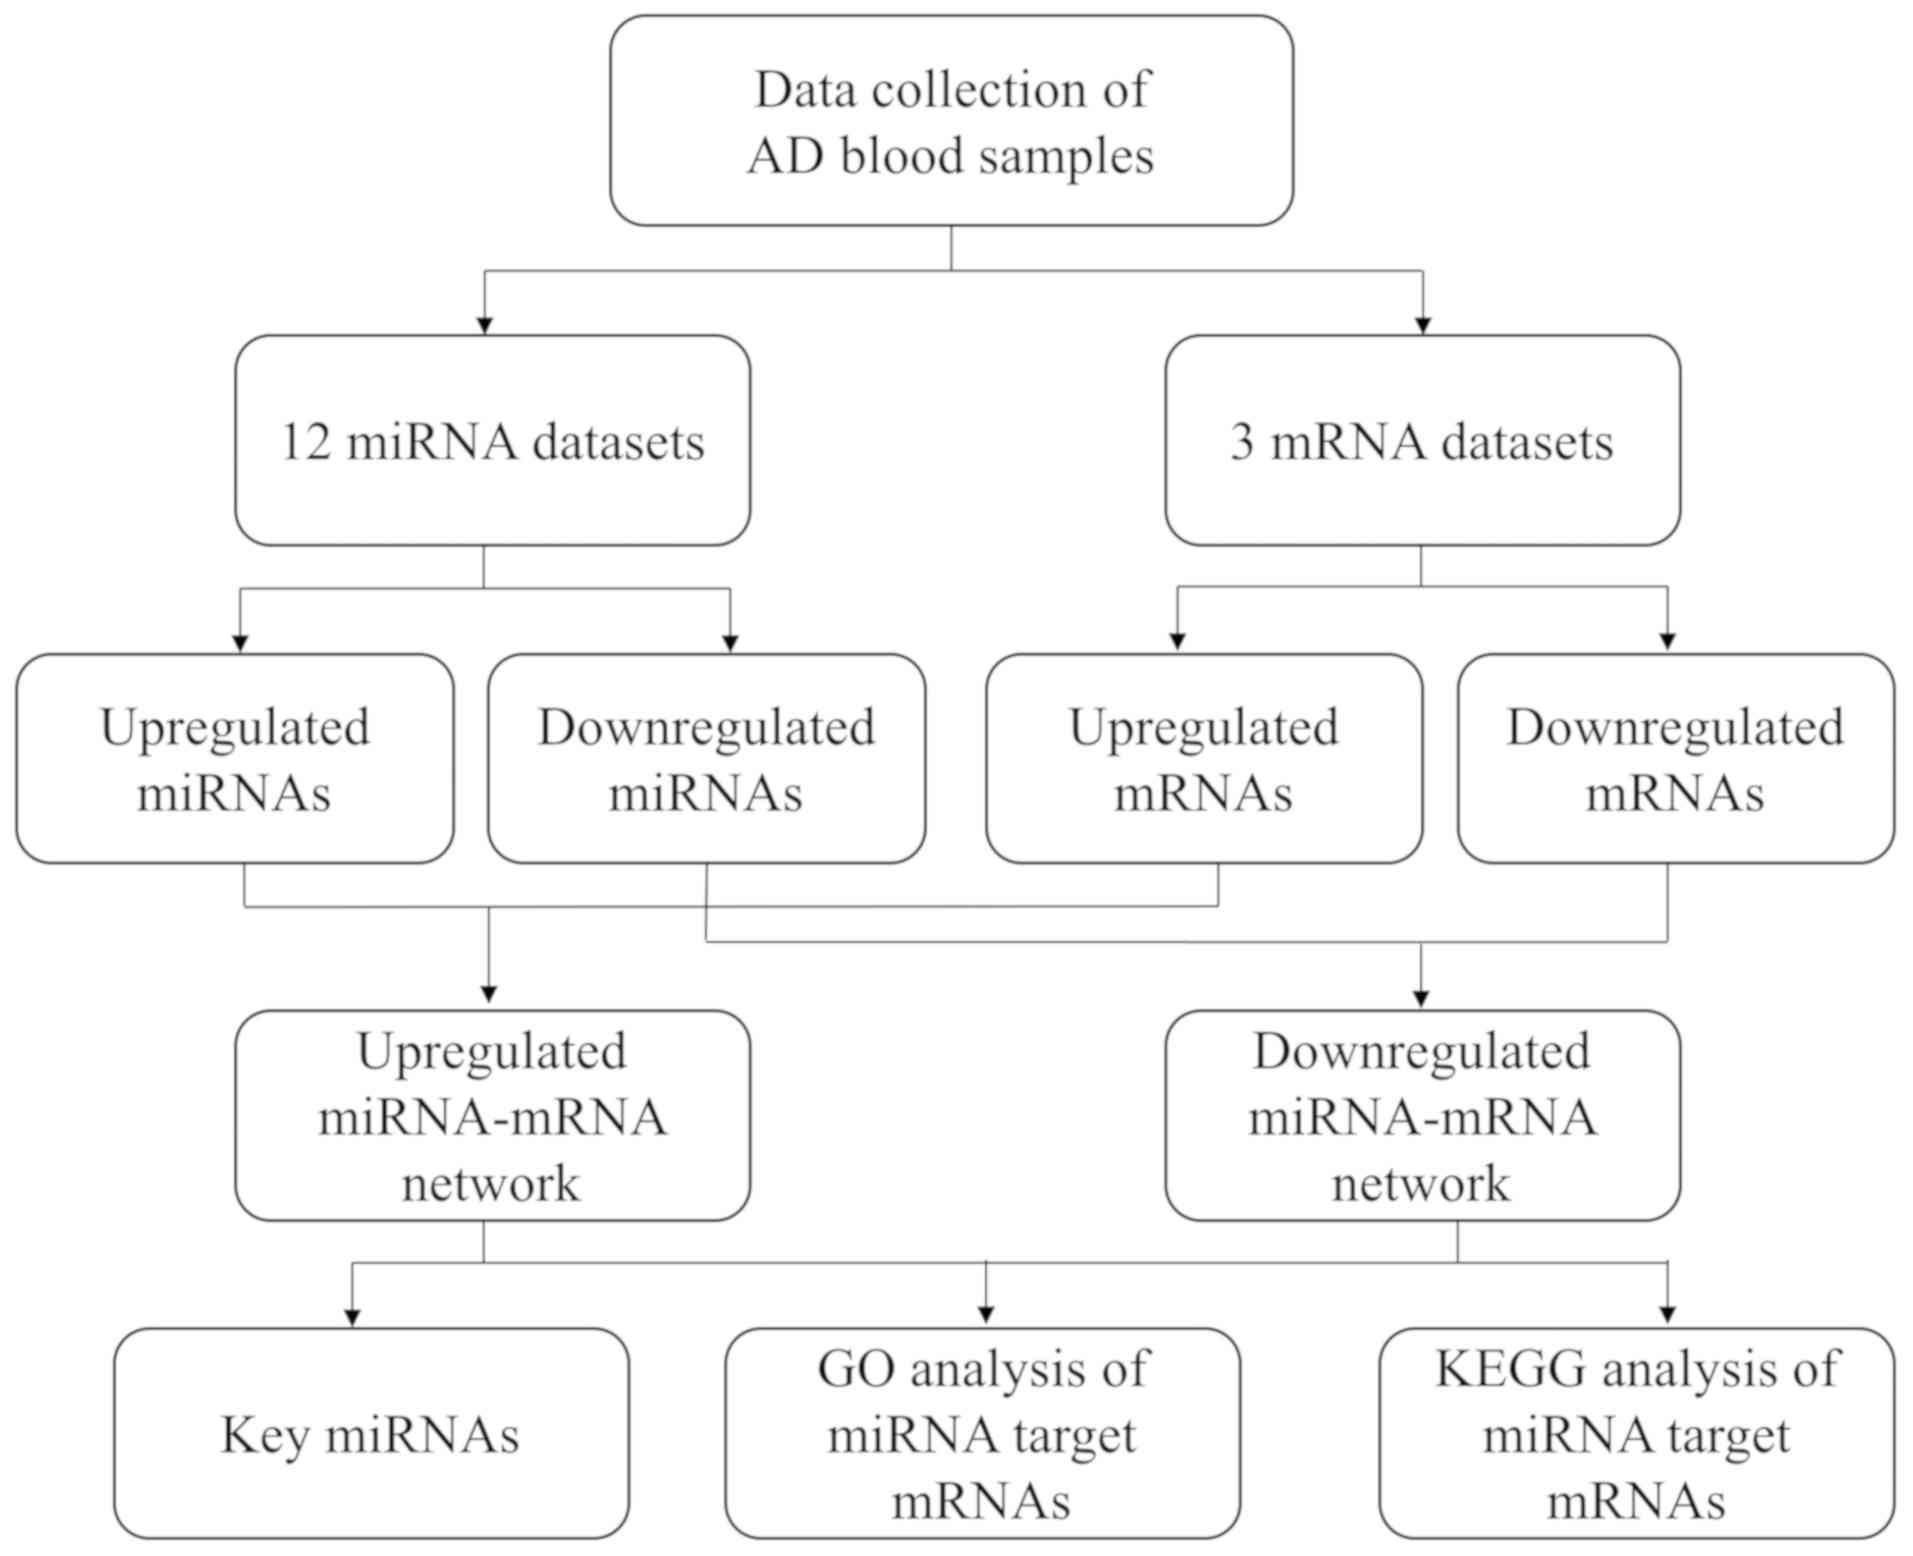
The workflow of the present study is presented in
Fig. 1. The present study
downloaded 12 separate miRNA expression profiling datasets of blood
samples from patients with AD and normal control samples. Detailed
information on sample size, blood component and experimentally
supported DEmiRNAs were manually extracted from the references of
the datasets (Table I). miRNAs
identified in at least one dataset were integrated as
high-confidence DEmiRNAs. A total of 37 miRNAs were identified to
be significant DEmiRNAs, among which seven miRNAs were upregulated
and 30 miRNAs were downregulated in patients with AD compared with
normal control samples.
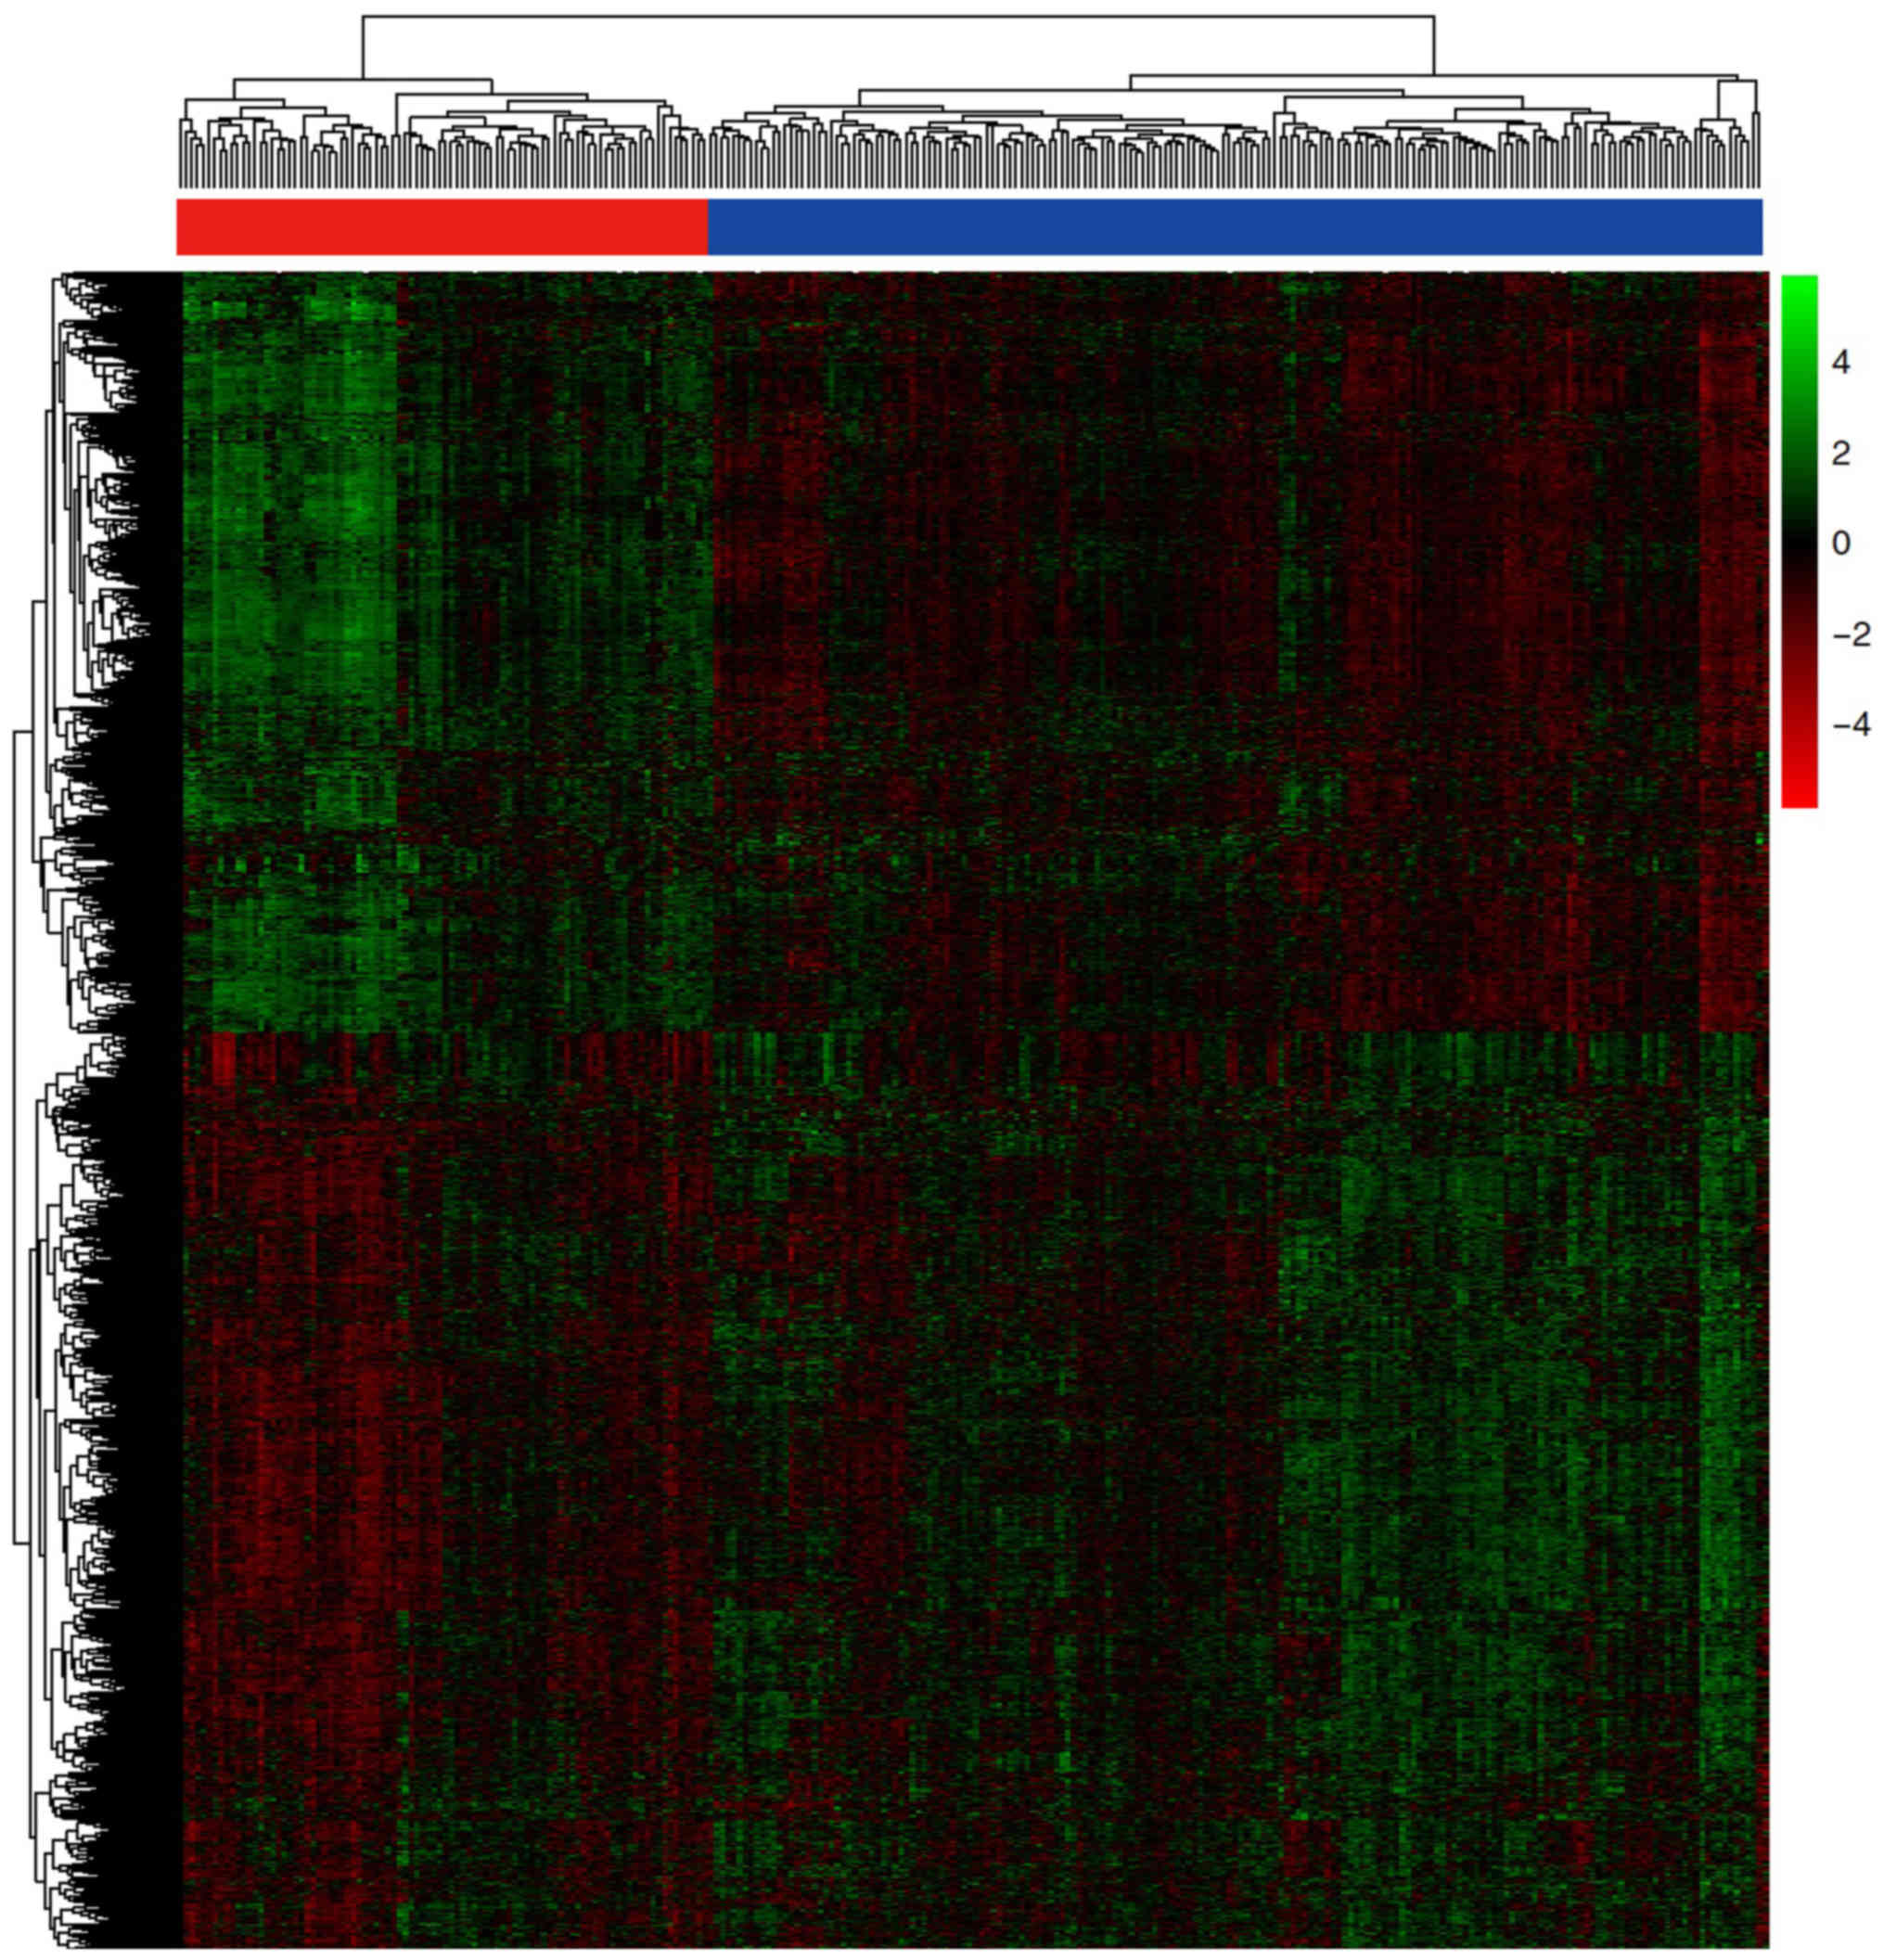
A total of three mRNA expression profiles of whole
blood samples from patients with AD and normal control samples were
downloaded from the publicly accessible database GEO (Table I). Following background correction
and normalization, 2,011 DEmRNAs were identified using the Limma
package, under the following cut-off criteria; adjusted P<0.05
and |logFC|>0.5. Among these, 911 mRNAs were upregulated and
1,100 were downregulated in patients with AD compared with normal
control samples. Subsequently, hierarchical clustering of the
DEmRNAs was performed, which is displayed in the heatmap (Fig. 2).
Construction of the miRNA-mRNA network
and identification of hub nodes
The DEmiRNAs-mRNA interactions were identified using
four algorithms and validated by subsequent experimentation in the
miRWalk database. Target mRNAs of the DEmiRNAs were inversely
associated with the expression of corresponding miRNAs between
patients with AD and normal control samples. In total, 853
high-confidence DEmiRNA-mRNA interactions were identified, of which
17 were upregulated miRNAs-mRNA and 836 were downregulated
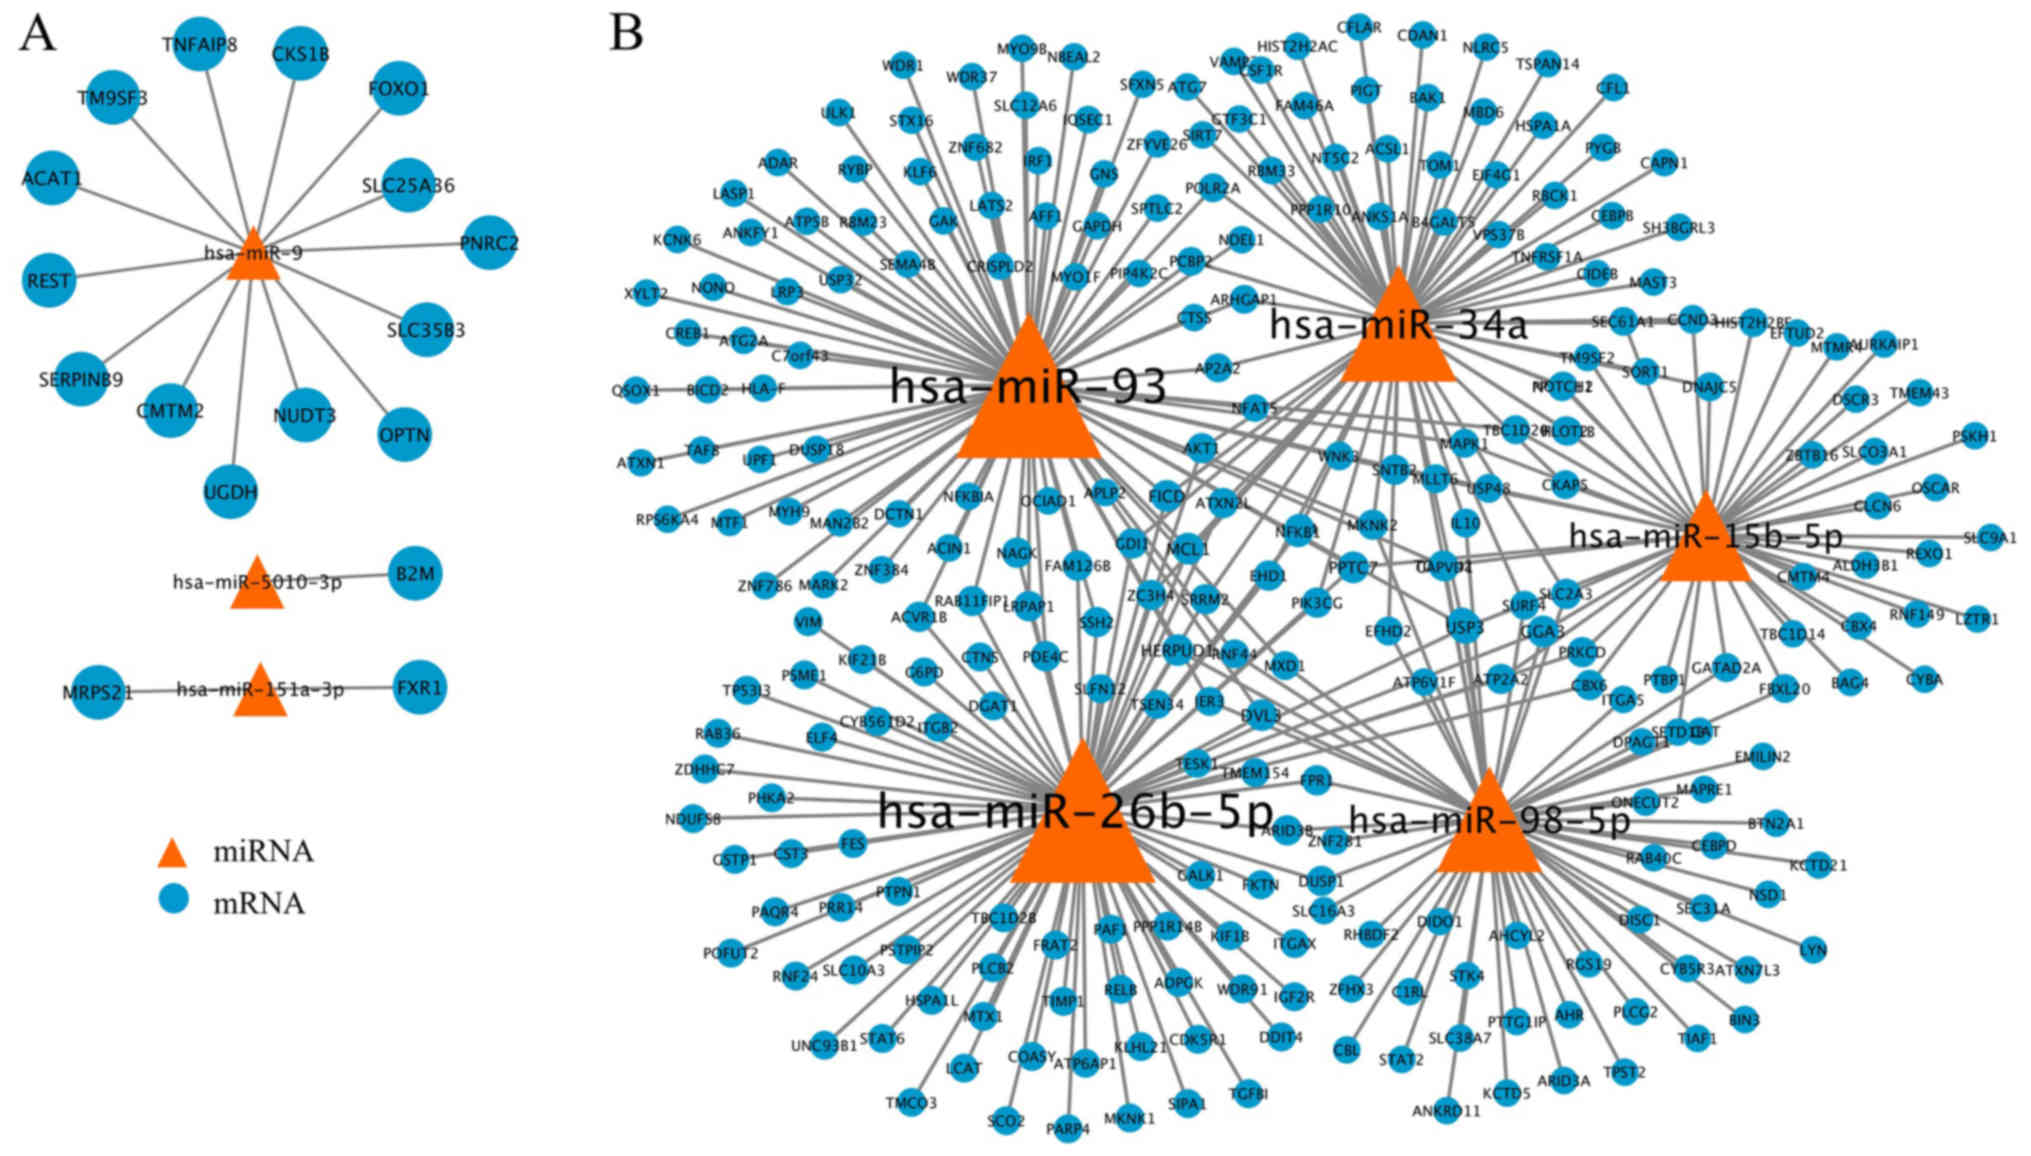
miRNAs-mRNA interactions. The upregulated miRNAs-mRNA network and
downregulated miRNAs-mRNA network were constructed based on these
miRNA-mRNA interactions using Cytoscape software. The upregulated
miRNAs-mRNA network consisted of 20 nodes and 17 edges (Fig. 3A). Of these, hsa-miR-9 had the
highest connectivity and was demonstrated to negatively interact
with 14 target mRNAs. A high score of network topology property
indictors suggests a notable role in the network. According to the
rankings of network topology property indictors, including degree
centrality, betweenness centrality and closeness centrality, the
top five nodes of the downregulated miRNAs-mRNA network, which
consisted of 413 nodes and 836 edges, are listed in Table II. A total of five miRNAs,
including hsa-miR-93, hsa-miR-26b, hsa-miR-34a, hsa-miR-98-5p and
hsa-miR-15b-5p were among the top nodes for all topology property
indictors, suggesting their critical roles in the pathogenesis of
AD. The interactions of these five key miRNAs and their target
mRNAs are presented in Fig.
3B.
| Table II.Top five nodes in the downregulated
miRNA-mRNA network according to the score of network topology
property indictors. |
Table II.
Top five nodes in the downregulated
miRNA-mRNA network according to the score of network topology
property indictors.
| Rank | Node | Degree | Betweenness | Closeness |
|---|
| 1 | hsa-miR-93 | 87 | 197.28 | 46,730.89 |
| 2 | hsa-miR-26b | 87 | 194.30 | 25,361.43 |
| 3 | hsa-miR-34a | 66 | 180.78 | 32,132.43 |
| 4 | hsa-miR-98-5p | 58 | 173.52 | 21,099.35 |
| 5 | hsa-miR-15b-5p | 48 | 170.25 | 20,266.93 |
GO terms annotation of the target
mRNAs of DEmiRNAs
The online tool DAVID was used to identify
significantly enriched GO terms for the target mRNAs of DEmiRNAs
between patients with AD and normal control samples (Table III). The results indicated that
the target mRNAs were predominantly enriched in BP terms, including
‘regulation of transcription’ and ‘apoptotic process’. Regarding
CC, the target mRNAs were enriched in the ‘nucleus’ and
‘intracellular’. In addition, MF analysis displayed that the target
mRNAs were significantly enriched in ‘metal ion binding’ and ‘DNA
binding’.
| Table III.Significantly enriched Gene Ontology
terms of the target mRNAs of differentially expressed microRNAs
identified by The Database for Annotation, Visualization and
Integrated Discovery. |
Table III.
Significantly enriched Gene Ontology
terms of the target mRNAs of differentially expressed microRNAs
identified by The Database for Annotation, Visualization and
Integrated Discovery.
| GO ID | GO terms | FDR |
|---|
| Biological
process |
|
|
|
GO:0006355 | Regulation of
transcription, DNA-dependent |
4.41×10⁻⁵ |
|
GO:0006915 | Apoptotic
process |
6.38×10⁻⁵ |
|
GO:0006954 | Inflammatory
response |
7.75×10⁻³ |
|
GO:0007165 | Signal
transduction |
2.34×10⁻⁵ |
|
GO:0006468 | Protein
phosphorylation |
4.63×10⁻⁸ |
|
GO:0008360 | Regulation of cell
shape |
4.84×10⁻² |
|
GO:0008283 | Cell
proliferation |
9.85×10⁻⁴ |
|
GO:0044419 | Interspecies
interaction between organisms |
1.64×10⁻⁷ |
|
GO:0006810 | Transport |
1.62×10⁻² |
|
GO:0045944 | Positive regulation
of transcription from RNA polymerase II promoter |
5.45×10⁻⁶ |
| Molecular
function |
|
|
|
GO:0046872 | Metal ion
binding |
1.12×10⁻⁹ |
|
GO:0003677 | DNA binding |
1.53×10⁻⁴ |
|
GO:0008270 | Zinc ion
binding |
4.04×10⁻⁴ |
|
GO:0003700 | Sequence-specific
DNA binding transcription factor activity |
4.85×10⁻⁴ |
|
GO:0016740 | Transferase
activity |
3.39×10⁻² |
|
GO:0005524 | ATP binding |
1.81×10⁻¹² |
|
GO:0005515 | Protein
binding |
1.42×10⁻³⁵ |
|
GO:0000166 | Nucleotide
binding |
1.12×10⁻¹⁵ |
|
GO:0043565 | Sequence-specific
DNA binding |
2.33×10⁻³ |
|
GO:0016301 | Kinase
activity |
6.54×10⁻⁴ |
| Cellular
component |
|
|
|
GO:0005634 | Nucleus |
1.54×10⁻²¹ |
|
GO:0005622 | Intracellular |
1.40×10⁻⁶ |
|
GO:0016607 | Nuclear speck |
2.21×10⁻³ |
|
GO:0016021 | Integral to
membrane |
8.15×10⁻⁵ |
|
GO:0005625 | Soluble
fraction |
6.85×10⁻³ |
|
GO:0005794 | Golgi
apparatus |
7.52×10⁻⁵ |
|
GO:0016020 | Membrane |
7.88×10⁻¹⁶ |
|
GO:0005783 | Endoplasmic
reticulum |
3.40×10⁻⁵ |
|
GO:0005737 | Cytoplasm |
5.10×10⁻²⁶ |
|
GO:0005739 | Mitochondrion |
7.82×10⁻⁵ |
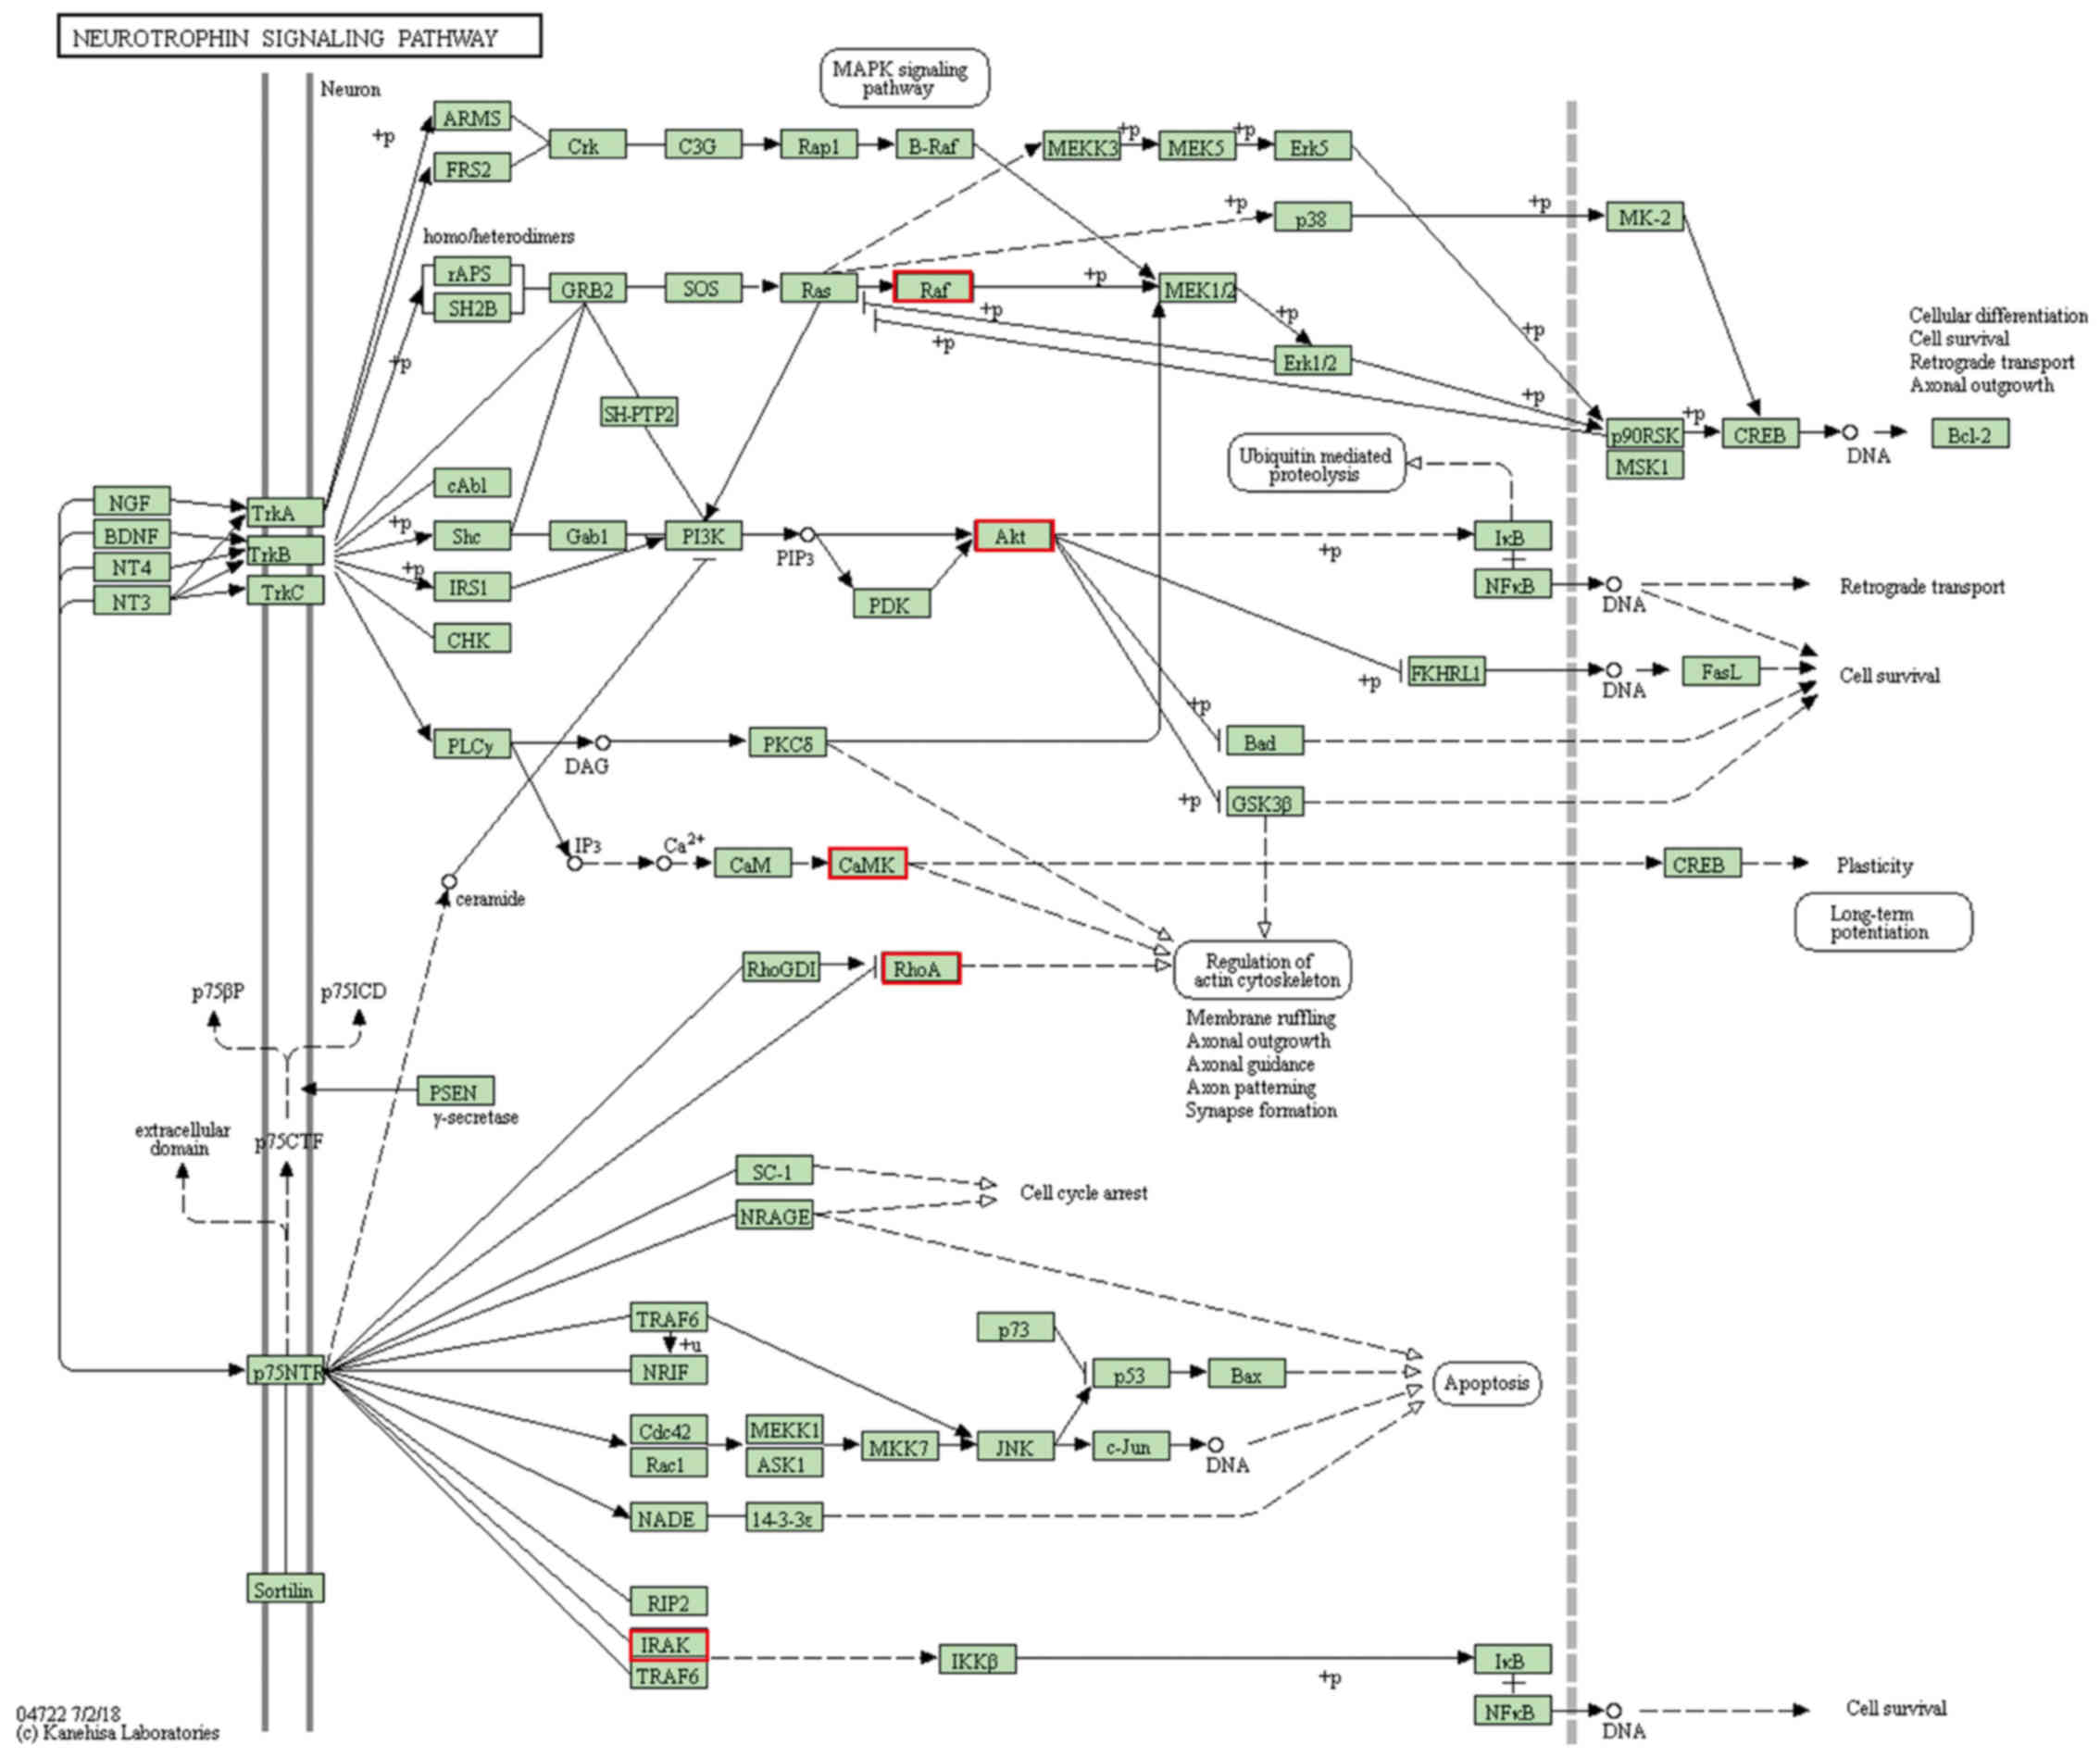
KEGG pathway enrichment of the target
mRNAs of DEmiRNAs
The significantly enriched pathways of the target
mRNAs of DEmiRNAs between patients with AD and normal control
samples are presented in Table
IV. The results demonstrated that the target mRNAs were
enriched in the ‘neurotrophin signaling pathway’, ‘insulin
signaling pathway’, ‘MAPK signaling pathway’, ‘lysosome’,
‘Alzheimer's disease’ and ‘Huntington's disease’ (Fig. 4).
| Table IV.Significantly enriched KEGG pathways
of the target mRNAs of differentially expressed miRNAs identified
by The Database for Annotation, Visualization and Integrated
Discovery. |
Table IV.
Significantly enriched KEGG pathways
of the target mRNAs of differentially expressed miRNAs identified
by The Database for Annotation, Visualization and Integrated
Discovery.
| KEGG ID | KEGG pathway | FDR | Gene count | Genes | Related key
miRNAs |
|---|
| Kegg:04722 | Neurotrophin
signaling pathway |
1.05×10⁻⁹ | 15 | MAPK1, PRKCD,
PLCG2, NFKBIA, RHOA, IRAK1, MAP3K5, AKT1, NFKB1, RAF1, SORT1,
RPS6KA4, CAMK2G, PIK3CG, RPS6KA1 | hsa-miR-34a,
hsa-miR-93, hsa-miR-26b, hsa-miR-15b-5p, hsa-miR-98-5p |
| Kegg:04910 | Insulin signaling
pathway |
2.43×10⁻⁸ | 14 | EXOC7, MAPK1, PYGB,
FOXO1, PTPN1, PHKA2, FLOT2, SREBF1, MKNK2, AKT1, RAF1, MKNK1,
PIK3CG, CBL | hsa-miR-34a,
hsa-miR-93, hsa-miR-26b, hsa-miR-15b-5p, hsa-miR-98-5p |
| Kegg:04010 | MAPK signaling
pathway |
1.54×10⁻⁶ | 16 | MAPK1, IKBKG,
DUSP1, RELB, TNFRSF1A, MAP3K11, MKNK2, MAP3K5, AKT1, NFKB1, RAF1,
MKNK1, MAPK8IP3, RPS6KA4, RPS6KA1, STK4 | hsa-miR-34a,
hsa-miR-93, hsa-miR-26b, hsa-miR-15b-5p, hsa-miR-98-5p |
| Kegg:04142 | Lysosome |
2.62×10⁻⁶ | 11 | GGA3, CTSS, TPP1,
PSAP, LAMP1, ATP6AP1, GNS, SORT1, IDS, IGF2R, CTNS | hsa-miR-34a,
hsa-miR-93, hsa-miR-26b, hsa-miR-15b-5p, hsa-miR-98-5p |
| Kegg:04210 | Apoptosis |
8.35×10⁻⁶ | 9 | IKBKG, NFKBIA,
TNFRSF1A, CAPN1, IRAK1, AKT1, NFKB1, PIK3CG, CFLAR | hsa-miR-93,
hsa-miR-26b, hsa-miR-34a |
| Kegg:05010 | Alzheimer's
disease |
1.43×10⁻⁴ | 10 | MAPK1, ATP2A2,
NDUFS8, TNFRSF1A, CAPN1, ERN1, PLCB2, GAPDH, CDK5R1, ATP5B | hsa-miR-15b-5p,
hsa-miR-26b, hsa-miR-93, hsa-miR-34a |
| Kegg:04150 | mTOR signaling
pathway |
1.85×10⁻⁴ | 6 | MAPK1, AKT1, DDIT4,
ULK1, PIK3CG, RPS6KA1 | hsa-miR-15b-5p,
hsa-miR-26b, hsa-miR-93, hsa-miR-34a |
| Kegg:05016 | Huntington's
disease |
1.20×10⁻³ | 9 | DCTN1, NDUFS8,
CREB1, AP2A2, PLCB2, CREBBP, REST, SP1, ATP5B | hsa-miR-93,
hsa-miR-26b, hsa-miR-34a |
| Kegg:04310 | Wnt signaling
pathway |
1.54×10⁻³ | 8 | RHOA, PLCB2, FRAT2,
NFAT5, CAMK2G, CCND3, CREBBP, DVL3 | hsa-miR-34a,
hsa-miR-93, hsa-miR-26b, hsa-miR-15b-5p, hsa-miR-98-5p |
| Kegg:04330 | Notch signaling
pathway |
3.83×10⁻² | 3 | NOTCH2, CREBBP,
DVL3 | hsa-miR-34a,
hsa-miR-93, hsa-miR-26b, hsa-miR-15b-5p, hsa-miR-98-5p |
Discussion
Increasing evidence has demonstrated that
identifying biomarkers using meta-analysis is helpful to the
diagnosis and targeted therapy of patients with AD at an early
stage (15,16). However, previous studies have used
datasets that originate from different samples, for example, Chen
et al (15) combined
datasets of tissues, serum, extracellular and cerebrospinal fluid,
and Cătană et al (16)
evaluated datasets from different body fluids. Conversely, the
present study focused on datasets from the blood. In addition, the
strategies of these previous studies only considered miRNAs,
whereas the present study identified key miRNAs, mRNAs and pathways
affecting the pathogenesis of AD by integrating the miRNA and mRNA
expression profiling datasets. Although different strategies were
used, some of the key miRNAs identified in the present study were
in agreement with previous studies, for example, hsa-miR-26b,
hsa-miR-15b and hsa-miR-93 were also identified by Chen et
al (15). In the present
study, the DEmiRNA-mRNA crosstalk was assessed between the blood
from patients with AD and normal control samples, by integrating
the largest count of miRNA and mRNA datasets. Topological analysis
of the AD-specific miRNA-mRNA network identified five miRNAs,
including hsa-miR-93, hsa-miR-26b, hsa-miR-34a, hsa-miR-98-5p and
hsa-miR-15b-5p as hub nodes, suggesting their critical roles in the
pathogenesis of AD. Functional enrichment analysis demonstrated
that the target mRNAs of DEmiRNAs were enriched in AD-associated
pathways, such as the ‘neurotrophin signaling pathway’ and ‘insulin
signaling pathway’.
hsa-miR-93 was the hub node with the highest
topology property indictors, which was demonstrated to negatively
regulate 87 DEmRNAs in the AD-specific downregulated miRNA-mRNA
network, including GADPH, ATP synthase F1 subunit β (ATP5B) and
MAPK1. These protein-coding genes were significantly upregulated in
patients with AD and enriched in the AD-associated pathway in the
present study. Dong et al (19) reported that hsa-miR-93 was markedly
decreased in the serum of patients with AD compared with controls,
while screening the expression profile of serum miRNAs by Solexa
sequencing. In addition, it was demonstrated that the panel of
hsa-miR-93, along with hsa-miR-31 and miR-146a, may be used to
discriminate AD from vascular dementia. Takashima et al
(34) reported that hsa-miR-93 may
be a potential prognostic biomarker in primary central nervous
system lymphoma. GAPDH is a family of abundantly expressed
oxidoreductases that are known for their role in glucose metabolism
(35). It has been reported that
GAPDH is able to interact with various small molecules (proteins
and membranes) that serve key roles in normal and pathological cell
functions, including AD-associated proteins and the β-amyloid
precursor protein (36). It was
therefore hypothesized that decreased hsa-miR-93 expression may
serve vital roles in the pathological process of AD by targeting
GADPH, ATP5B and MAPK1.
hsa-miR-26b was another hub node identified in the
present study that negatively regulated 80 DEmRNAs in the AD
downregulated miRNA-mRNA network, including cyclin-dependent kinase
5 regulatory subunit 1 (CDK5R1), ATPase sarcoplasmic/endoplasmic
reticulum Ca2+ transporting 2, AKT1 and NF-kB1, which
were enriched in the AD pathway and ‘neurotrophin signaling
pathway’. Consistent with previous findings, the results of the
present study demonstrated that hsa-miR-26b was significantly
downregulated in patients with AD compared with the normal control
samples, whereas the corresponding mRNAs were upregulated in
patients with AD (25,37). CDK5R1 encodes for p35, a protein
required for the main activation of CDK5 (38). The active p35/CDK5 complex has been
reported to be involved in several aspects of brain development and
function, and its deregulation is closely associated with AD onset
and progression (39). Taken
together, the results of the present study suggested that
hsa-miR-26b may negatively regulate CDK5R1 expression in AD.
The ‘neurotrophin signaling pathway’ and ‘insulin
signaling pathway’ were the most significantly enriched pathways of
the target mRNAs of DEmiRNAs between patients with AD and normal
control samples. The neurotrophin signaling pathway is activated by
neurotrophins through binding to the tyrosine protein kinase
receptor family, which results in a series of neuronal functions,
such as axonal growth, cell survival, cell differentiation,
dendritic arborization, synapse formation, plasticity and axonal
guidance (40,41). The insulin signaling pathway, which
is the main signal transduction pathway in insulin physiological
function, serves a vital role in the metabolism, nerve protection
and regulation of cognitive dysfunction (42). Increasing evidence has demonstrated
that the symptoms of patients with AD are consistently accompanied
with a disordered insulin signaling pathway or other symptoms,
suggesting that the insulin signaling pathway may be closely
associated with the pathogenesis of AD (43).
In conclusion, availably representative miRNA and
mRNA expression profiling datasets of the blood from patients with
AD were collected and subjected to comprehensive analysis though a
series of bioinformatics methods in the present study. The
AD-specific miRNA-mRNA crosstalk network was constructed and
several key dysregulated miRNAs, mRNAs and signaling pathways
affecting the pathogenesis of AD were identified. However, further
experimental studies testing these results would be desirable.
Taken together, the results of the present study provided a
valuable resource for depicting the complexity of AD, and may
contribute to the development of diagnostic biomarkers and
therapeutic targets for AD.
Acknowledgements
Not applicable.
Funding
No funding was received.
Availability of data and materials
The datasets used and/or analyzed during the present
study are available from the corresponding author on reasonable
request.
Authors' contributions
SH and ZW conceived and designed the study; SH, ZW
and LS analyzed and interpreted the data; YW acquired the data and
wrote the manuscript; and SH, ZW and LS reviewed and edited the
manuscript. All authors read and approved the final manuscript.
Ethics approval and consent to
participate
Not applicable.
Patient consent for publication
Not applicable.
Competing interests
The authors declare that they have no competing
interests.
References
|
1
|
Patel H, Dobson RJB and Newhouse SJ: A
Meta-analysis of Alzheimer's disease brain transcriptomic data. J
Alzheimers Dis. 68:1635–1656. 2019. View Article : Google Scholar : PubMed/NCBI
|
|
2
|
Takousis P, Sadlon A, Schulz J, Wohlers I,
Dobricic V, Middleton L, Lill CM, Perneczky R and Bertram L:
Differential expression of microRNAs in Alzheimer's disease brain,
blood, and cerebrospinal fluid. Alzheimers Dement. 15:1468–1477.
2019. View Article : Google Scholar : PubMed/NCBI
|
|
3
|
Readhead B, Haure-Mirande JV, Funk CC,
Richards MA, Shannon P, Haroutunian V, Sano M, Liang WS, Beckmann
ND, Price ND, et al: Multiscale analysis of independent Alzheimer's
cohorts finds disruption of molecular, genetic, and clinical
networks by human Herpesvirus. Neuron. 99:64–82.e7. 2018.
View Article : Google Scholar : PubMed/NCBI
|
|
4
|
Swarbrick S, Wragg N, Ghosh S and Stolzing
A: Systematic review of miRNA as biomarkers in Alzheimer's disease.
Mol Neurobiol. 56:6156–6167. 2019. View Article : Google Scholar : PubMed/NCBI
|
|
5
|
Sood S, Gallagher IJ, Lunnon K, Rullman E,
Keohane A, Crossland H, Phillips BE, Cederholm T, Jensen T, van
Loon LJ, et al: A novel multi-tissue RNA diagnostic of healthy
ageing relates to cognitive health status. Genome Biol. 16:1852015.
View Article : Google Scholar : PubMed/NCBI
|
|
6
|
Liang WS, Reiman EM, Valla J, Dunckley T,
Beach TG, Grover A, Niedzielko TL, Schneider LE, Mastroeni D,
Caselli R, et al: Alzheimer's disease is associated with reduced
expression of energy metabolism genes in posterior cingulate
neurons. Proc Natl Acad Sci USA. 105:4441–4446. 2008. View Article : Google Scholar : PubMed/NCBI
|
|
7
|
Cheng L, Doecke JD, Sharples RA,
Villemagne VL, Fowler CJ, Rembach A, Martins RN, Rowe CC, Macaulay
SL, Masters CL, et al: Prognostic serum miRNA biomarkers associated
with Alzheimer's disease shows concordance with neuropsychological
and neuroimaging assessment. Mol Psychiatry. 20:1188–1196. 2015.
View Article : Google Scholar : PubMed/NCBI
|
|
8
|
McKeever PM, Schneider R, Taghdiri F,
Weichert A, Multani N, Brown RA, Boxer AL, Karydas A, Miller B,
Robertson J and Tartaglia MC: MicroRNA expression levels are
altered in the cerebrospinal fluid of patients with young-onset
Alzheimer's disease. Mol Neurobiol. 55:8826–8841. 2018. View Article : Google Scholar : PubMed/NCBI
|
|
9
|
Tan L, Yu JT, Liu QY, Tan MS, Zhang W, Hu
N, Wang YL, Sun L, Jiang T and Tan L: Circulating miR-125b as a
biomarker of Alzheimer's disease. J Neurol Sci. 336:52–56. 2014.
View Article : Google Scholar : PubMed/NCBI
|
|
10
|
Galimberti D, Villa C, Fenoglio C,
Serpente M, Ghezzi L, Cioffi SM, Arighi A, Fumagalli G and Scarpini
E: Circulating miRNAs as potential biomarkers in Alzheimer's
disease. J Alzheimers Dis. 42:1261–1267. 2014. View Article : Google Scholar : PubMed/NCBI
|
|
11
|
Fei Y, Guo P, Wang F, Li H, Lei Y, Li W,
Xun X and Lu F: Identification of miRNA-mRNA crosstalk in laryngeal
squamous cell carcinoma. Mol Med Rep. 16:4179–4186. 2017.
View Article : Google Scholar : PubMed/NCBI
|
|
12
|
Lau P, Bossers K, Janky R, Salta E,
Frigerio CS, Barbash S, Rothman R, Sierksma AS, Thathiah A,
Greenberg D, et al: Alteration of the micro RNA network during the
progression of Alzheimer's disease. EMBO Mol Med. 5:1613–1634.
2013. View Article : Google Scholar : PubMed/NCBI
|
|
13
|
Hara N, Kikuchi M, Miyashita A, Hatsuta H,
Saito Y, Kasuga K, Murayama S, Ikeuchi T and Kuwano R: Serum
microRNA miR-501-3p as a potential biomarker related to the
progression of Alzheimer's disease. Acta Neuropathol Commun.
5:102017. View Article : Google Scholar : PubMed/NCBI
|
|
14
|
Jia LH and Liu YN: Downregulated serum
miR-223 servers as biomarker in Alzheimer's disease. Cell Biochem
Funct. 34:233–237. 2016. View
Article : Google Scholar : PubMed/NCBI
|
|
15
|
Chen J, Qi Y, Liu CF, Lu JM, Shi J and Shi
Y: MicroRNA expression data analysis to identify key miRNAs
associated with Alzheimer's disease. J Gene Med. 20:e30142018.
View Article : Google Scholar : PubMed/NCBI
|
|
16
|
Cătană CS, Crişan CA, Opre D and
Berindan-Neagoe I: Diagnostic and prognostic value of microRNAs for
Alzheimer's disease: A comprehensive meta-analysis. Med Pharm Rep.
93:53–61. 2020.PubMed/NCBI
|
|
17
|
Barrett T, Suzek TO, Troup DB, Wilhite SE,
Ngau WC, Ledoux P, Rudnev D, Lash AE, Fujibuchi W and Edgar R: NCBI
GEO: Mining millions of expression profiles-database and tools.
Nucl Acids Res. 33((Database Issue)): D562–D566. 2005.PubMed/NCBI
|
|
18
|
Tan L, Yu JT, Tan MS, Liu QY, Wang HF,
Zhang W, Jiang T and Tan L: Genome-Wide Serum microRNA expression
profiling identifies serum biomarkers for Alzheimer's disease. J
Alzheimers Dis. 40:1017–1027. 2014. View Article : Google Scholar : PubMed/NCBI
|
|
19
|
Dong H, Li J, Huang L, Chen X, Li D, Wang
T, Hu C, Xu J, Zhang C, Zen K, et al: Serum MicroRNA profiles serve
as novel biomarkers for the diagnosis of Alzheimer's disease. Dis
Markers. 2015:6256592015. View Article : Google Scholar : PubMed/NCBI
|
|
20
|
Zhu Y, Li C, Sun A, Wang Y and Zhou S:
Quantification of microRNA-210 in the cerebrospinal fluid and
serum: Implications for Alzheimer's disease. Exp Ther Med.
9:1013–1017. 2015. View Article : Google Scholar : PubMed/NCBI
|
|
21
|
Kumar P, Dezso Z, MacKenzie C, Oestreicher
J, Agoulnik S, Byrne M, Bernier F, Yanagimachi M, Aoshima K and Oda
Y: Circulating miRNA Biomarkers for Alzheimer's disease. PLoS One.
8:e698072013. View Article : Google Scholar : PubMed/NCBI
|
|
22
|
Kiko T, Nakagawa K, Tsuduki T, Furukawa K,
Arai H and Miyazawa T: MicroRNAs in plasma and cerebrospinal fluid
as potential markers for Alzheimer's disease. J Alzheimers Dis.
39:253–259. 2014. View Article : Google Scholar : PubMed/NCBI
|
|
23
|
Wang T, Chen K, Li H, Dong S, Su N, Liu Y,
Cheng Y, Dai J, Yang C and Xiao S: The feasibility of utilizing
plasma MiRNA107 and BACE1 messenger RNA gene expression for
clinical diagnosis of amnestic mild cognitive impairment. J Clin
Psychiatry. 76:135–141. 2015. View Article : Google Scholar : PubMed/NCBI
|
|
24
|
Liu CG, Wang JL, Li L and Wang PC:
MicroRNA-384 regulates both amyloid precursor protein and
β-secretase expression and is a potential biomarker for Alzheimer's
disease. Int J Mol Med. 34:160–166. 2014. View Article : Google Scholar : PubMed/NCBI
|
|
25
|
Leidinger P, Backes C, Deutscher S,
Schmitt K, Mueller SC, Frese K, Haas J, Ruprecht K, Paul F, Stähler
C, et al: A blood based 12-miRNA signature of Alzheimer disease
patients. Genome Biol. 14:R782013. View Article : Google Scholar : PubMed/NCBI
|
|
26
|
Kimes PK, Liu Y, Neil Hayes D and Marron
JS: Statistical significance for hierarchical clustering.
Biometrics. 73:811–821. 2017. View Article : Google Scholar : PubMed/NCBI
|
|
27
|
Paraskevopoulou MD, Georgakilas G,
Kostoulas N, Vlachos IS, Vergoulis T, Reczko M, Filippidis C,
Dalamagas T and Hatzigeorgiou AG: DIANA-microT web server v5.0:
Service integration into miRNA functional analysis workflows.
Nucleic Acids Res. 41:W169–W173. 2013. View Article : Google Scholar : PubMed/NCBI
|
|
28
|
Enright AJ, John B, Gaul U, Tuschl T,
Sander C and Marks DS: MicroRNA targets in Drosophila. Genome Biol.
5:R12003. View Article : Google Scholar : PubMed/NCBI
|
|
29
|
Liu W and Wang X: Prediction of functional
microRNA targets by integrative modeling of microRNA binding and
target expression data. Genome Biol. 20:182019. View Article : Google Scholar : PubMed/NCBI
|
|
30
|
Dweep H, Sticht C, Pandey P and Gretz N:
miRWalk-database: Prediction of possible miRNA binding sites by
‘walking’ the genes of three genomes. J Biomed Inform. 44:839–847.
2011. View Article : Google Scholar : PubMed/NCBI
|
|
31
|
Krek A, Grün D, Poy MN, Wolf R, Rosenberg
L, Epstein EJ, MacMenamin P, da Piedade I, Gunsalus KC, Stoffel M
and Rajewsky N: Combinatorial microRNA target predictions. Nat
Genet. 37:495–500. 2005. View
Article : Google Scholar : PubMed/NCBI
|
|
32
|
Agarwal V, Bell GW, Nam J and Bartel DP:
Predicting effective microRNA target sites in mammalian mRNAs.
Elife. 4:e050052015. View Article : Google Scholar
|
|
33
|
Huang DW, Sherman BT and Lempicki RA:
Systematic and integrative analysis of large gene lists using DAVID
bioinformatics resources. Nat Protoc. 4:44–57. 2009. View Article : Google Scholar : PubMed/NCBI
|
|
34
|
Takashima Y, Kawaguchi A, Iwadate Y,
Hondoh H, Fukai J, Kajiwara K, Hayano A and Yamanaka R: MicroRNA
signature constituted of miR-30d, miR-93, and miR-181b is a
promising prognostic marker in primary central nervous system
lymphoma. PLoS One. 14:e02104002019. View Article : Google Scholar : PubMed/NCBI
|
|
35
|
Allen M, Cox C, Belbin O, Ma L, Bisceglio
GD, Wilcox SL, Howell CC, Hunter TA, Culley O, Walker LP, et al:
Association and heterogeneity at the GAPDH locus in Alzheimer's
disease. Neurobiol Aging. 33:203.e25–e33. 2012. View Article : Google Scholar
|
|
36
|
Butterfield DA, Hardas SS and Lange MLB:
Oxidatively modified Glyceraldehyde-3-phosphate dehydrogenase
(GAPDH) and Alzheimer's disease: Many pathways to
neurodegeneration. J Alzheimers Dis. 20:369–393. 2010. View Article : Google Scholar : PubMed/NCBI
|
|
37
|
Chang WS, Wang YH, Zhu XT and Wu CJ:
Genome-wide profiling of miRNA and mRNA expression in Alzheimer's
disease. Med Sci Monit. 23:2721–2731. 2017. View Article : Google Scholar : PubMed/NCBI
|
|
38
|
Mateo I, Vázquez-Higuera JL, Sánchez-Juan
P, Rodríguez- Rodríguez E, Infante J, García-Gorostiaga I, Berciano
J and Combarros O: Epistasis between tau phosphorylation regulating
genes (CDK5R1 and GSK-3beta) and Alzheimer's disease risk. Acta
Neurol Scand. 120:130–133. 2009. View Article : Google Scholar : PubMed/NCBI
|
|
39
|
Spreafico M, Grillo B, Rusconi F,
Battaglioli E and Venturin M: Multiple layers of CDK5R1 regulation
in Alzheimer's disease implicate long non-coding RNAs. Int J Mol
Sci. 19(pii): E20222018. View Article : Google Scholar : PubMed/NCBI
|
|
40
|
Puglielli L: Aging of the brain,
neurotrophin signaling, and Alzheimer's disease: Is IGF1-R the
common culprit? Neurobiol Aging. 29:795–811. 2008. View Article : Google Scholar : PubMed/NCBI
|
|
41
|
Karki R, Kodamullil AT and Hofmann-Apitius
M: Comorbidity Analysis between Alzheimer's disease and type 2
diabetes mellitus (T2DM) based on shared pathways and the role of
T2DM drugs. J Alzheimers Dis. 60:721–731. 2017. View Article : Google Scholar : PubMed/NCBI
|
|
42
|
Jasmin B: Impairment of insulin signalling
pathway in Alzheimer´s disease. University of Wuzburg, Faculty of
Science. 1–13. 2012.
|
|
43
|
Liu Y, Liu F, Grundke-Iqbal I, Iqbal K and
Gong CX: Deficient brain insulin signalling pathway in Alzheimer's
disease and diabetes. J Pathol. 225:54–62. 2011. View Article : Google Scholar : PubMed/NCBI
|