Type 2 diabetes mellitus (T2DM) has become the third
main chronic non-infectious disease following tumors and
cardiovascular disease, and threatens human health worldwide
(1). In total, ~425 million adults
are currently living with diabetes in the world, with the majority
of cases being T2DM (2). The
International Diabetes Federation reported that in 2045, ~629
million individuals globally will suffer from diabetes, of which
~90% will be T2DM (2). It is well
known that insulin resistance and pancreatic β-cell dysfunction are
major pathophysiological characteristics of T2DM. Pancreatic
β-cells are needed to yield more insulin to meet mounting
requirements when insulin resistance occurs (3). Previous studies of pancreatic β-cells
provide a basis for improved insight into the pathogenesis and
pathophysiology of T2DM, as pancreatic β-cells help in the
regulation of the blood glucose level (4,5).
T2DM is a complex, polygenic disease that results from the
interplay of environmental and genetic factors. Candidate gene
association high-throughput methods have been carried out to
uncover the genetic aspects of the pathogenesis of T2DM (6–8).
In recent years, single gene research and
genome-wide association studies have determined genetic
susceptibility genes for the increased risk of T2DM (9–11).
Previous studies of gene expression in T2DM demonstrated that
decreased expression of insulin (12,13),
and a reduced expression of syntaxin 1A and transcription factor 7
like 2 contributed to impaired insulin secretion (12,14,15).
The downregulation of FXYD domain containing ion transport
regulator 2-stimulated β-cell proliferation (13) and the upregulation of genes δ like
non-canonical Notch ligand 1, diacylglycerol kinase β and zinc
finger MIZ-type containing 1 were implicated in T2DM (11,16).
Previous genetic studies identified several dozen genes leading to
monogenic diabetes due to impaired insulin secretion (17,18).
These genes play a key role in pancreatic β-cell lineage, phenotype
and function. How genetic and epigenetic factors are involved in
β-cell development, proliferation, differentiation and function
requires further investigation. Understanding of the underlying
mechanisms is vital to the development of new therapeutic methods
to prevent β-cell dysfunction and failure in the development of
T2DM. The identification of T2DM candidate genes has been
challenging in biomedical research and the majority of the genes
have yet to be discovered. The aim of the present study was to
contribute to research efforts to identify the biological markers
and signaling pathways associated with T2DM. These molecular
mechanisms may provide insight for aspects of T2DM pathogenesis or
pathophysiology.
High-throughput sequencing is becoming an important
tool, extensively applied in life sciences, including in cancer
detection (19–21) and for identifying global gene
expression changes in T2DM (22).
Knowledge of the subcellular localization of proteins provides new
insight into protein function and the complex pathways that
modulate biological processes on a sub-cellular level, contributing
to the current understanding of the proteins that interact with
each other and with other molecules in the cellular environment
(23). Accordingly, subcellular
proteomics, as an important step to functional proteomics, has been
the focus of the prediction of subcellular protein location, which
is associated with molecular cell biology, proteomics, systems
biology and drug discovery (24–26);
it is used to better understand complex diseases (27), such as breast cancer (28), ovarian carcinoma (29), ischemic dilated cardiomyopathy
(30), esophageal squamous cell
carcinoma (31) and asthma
(32). It was previously
demonstrated that an integrative analysis of gene expression and a
protein-protein interaction (PPI) network could offer insight of
the molecular mechanisms of a variety of diseases (33–35).
Consequently, the present study proposed a comprehensive
bioinformatics analysis of gene expression data combining protein
subcellular localization information and the construction of a
layered PPI network (as opposed to a traditional PPI network) to
identify candidate genes. Functional enrichment analyses were
performed for candidate genes. A microRNA (miRNA/miR)-target gene
regulatory network and transcription factor (TF)-target gene
regulatory network were also constructed to identify miRNAs and
TFs, which could be involved in T2DM development. The findings of
the present study may help in the discovery of potentially novel
predictive and prognostic markers for T2DM, and provide insight
into the underlying molecular mechanisms of T2DM.
The PPI data were retrieved from the Human Protein
Reference Database v9.0 (HPRD) (37), BioGRID v3.5 (38), IntACT v4.2 (39) and STRING v10.5 (40) databases. First, single nodes,
self-loops and duplicates were removed from the PPI data. Second,
the total DEGs were mapped to the PPI data. To improve the
reliability, only the direct interaction proteins of these DEGs
were matched. Third, the integrated PPI network was visualized and
analyzed using Cytoscape v3.6.1 (41). Then, the subcellular localization
information for each protein in the integrated PPI network obtained
from the HPRD, the UniProt database (http://www.uniprot.org/help/uniprotkb) and the Human
Protein Atlas database (http://www.proteinatlas.org/) (42) was input as a node attribute. The
Cerebral plug-in in Cytoscape was applied to redistribute nodes on
the basis of subcellular localization without changing their
interactions (43). The layered
PPI network was split into five layers: Extracellular, plasma
membrane, cytoplasm, nucleus and mitochondria. Hub protein nodes
that encoded DEGs in the layered network with a connectivity degree
>8 were screened as candidate genes.
To investigate the functions of the candidate genes,
functional enrichment analysis was performed using the ClueGO and
the CluePedia plug-ins (44) for
Cytoscape v3.6.1 software (45).
ClueGO was used to decipher functionally grouped Gene Ontology (GO)
(46) and pathway annotation
networks to understand their implication in three different
classifications; biological process (BP), molecular function (MF)
and cell component (CC), in addition to the Kyoto Encyclopedia of
Genes and Genomes (KEGG) (47)
signaling pathway. The relationship between the terms was
calculated using κ statistics and the ClueGO network was built
based on the similarity of their related genes. The CluePedia
plug-in is a search tool for new markers potentially associated to
pathways, and can provide a broad viewpoint of a pathway using
integrated experimental and in silico data. In the present
study, the enrichment analysis of gene-BP and gene-pathway was
statistically validated using the Cytoscape plug-ins ClueGO and
CluePedia. BPs/signaling pathways were functionally split into
several groups with κ score ≥0.4 and a network was constructed,
where the node represents a BP/pathway and the edge between two
nodes indicates that the two BPs/pathways share common genes.
Genes need to interact to react to the environment
of an organism, as they cannot alone to regulate the organism. Gene
expression is modulated by TFs and miRNAs at the transcriptional
and post-transcriptional levels. Information on TFs, miRNAs and
their corresponding target genes could provide insight into the
processes of T2DM. miRNet v2.0 (http://www.mirnet.ca/) (48) was used to predict the miRNAs
associated with candidate genes noted in miRTarBase v7.6 (49) and miRecords (50). The 8 most captivating groups (top
15) and a minimum of two genes for each of the groups were picked
as the threshold. Then, the TFs encoded by candidate genes were
used for prediction coupled with human TF information
(NetworkAnalyst v3.0; http://www.networkanalyst.ca) (51) noted in Binding and Expression
Target Analysis v1.0.7 (BETA) (http://cistrome.org/BETA/) (52). The miRNA-target gene regulatory
network and TF-target gene regulatory network were visualized using
Cytoscape.
Following data preprocessing, 108 DEGs were
identified to be differentially expressed in 10 control subjects
and 10 T2DM subjects, with 66 upregulated and 42 downregulated
genes, as presented in the heat map of the cluster analysis of
DEGs, according to the cut-off criteria of fold change >1.5 and
fdr_BH <0.1 (Fig. 1A; Table SI). The PCA plot demonstrated that
the DEGs could roughly divide the majority of T2DM subjects from
the non-diabetic controls (Fig.
1B).
The identification of proteins that interact
directly with proteins encoded by the 108 DEGs could help
understand the molecular mechanism underlying T2DM pathophysiology.
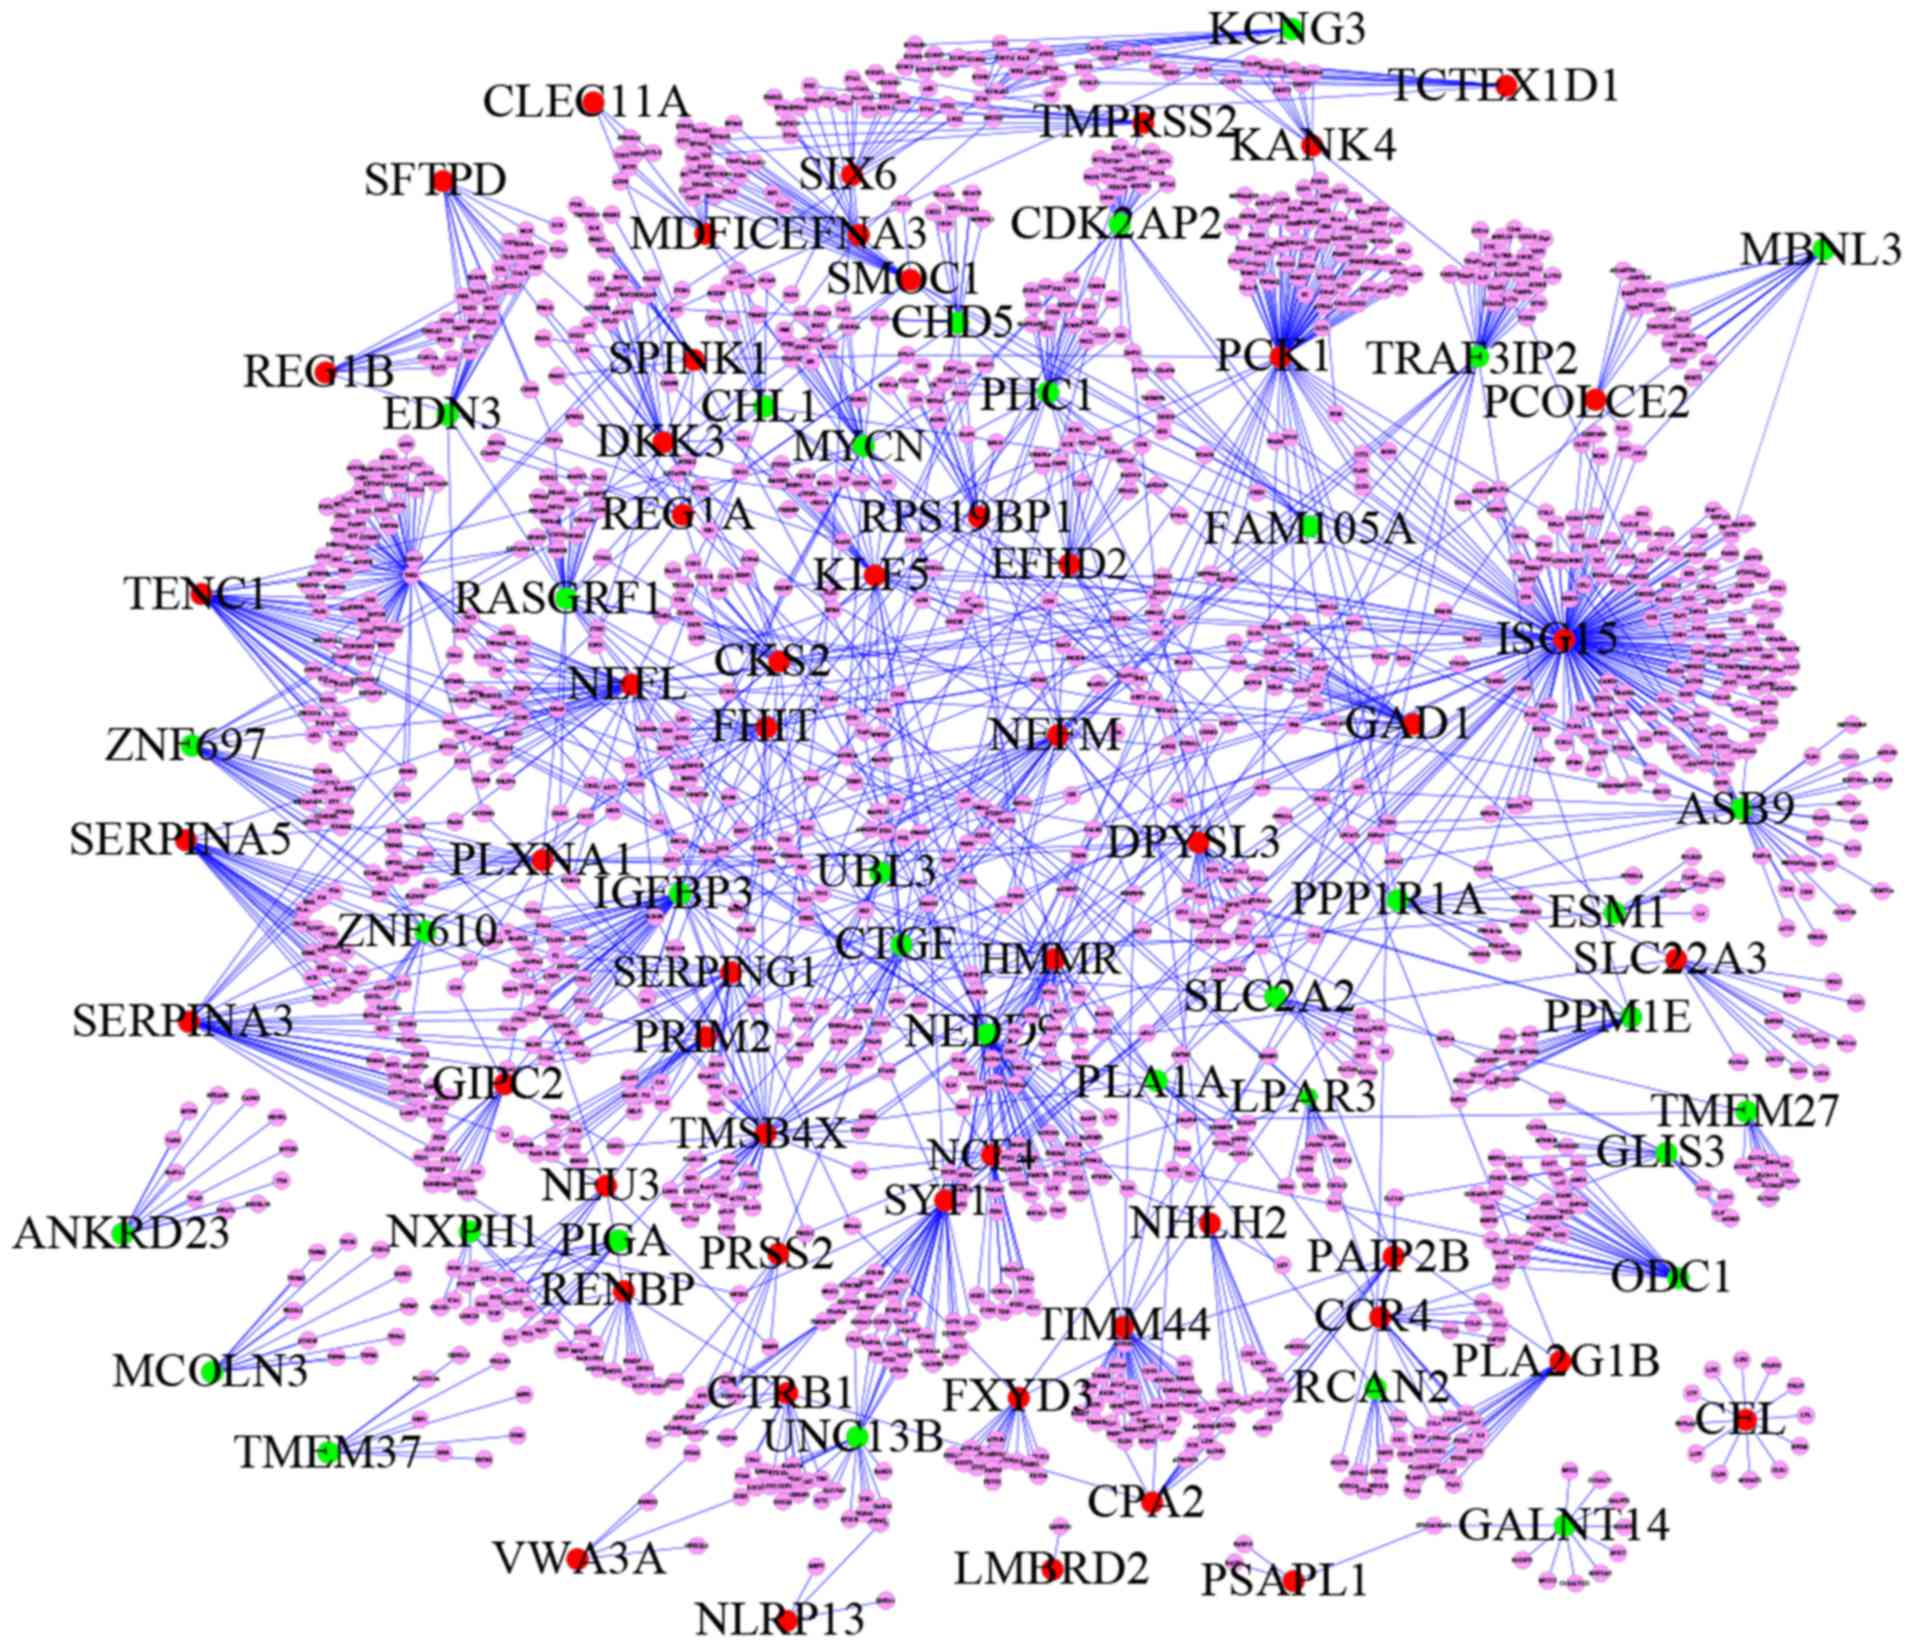
In the present study, a PPI network was built from the 108 DEGs
with Cytoscape and was composed of 1,546 nodes and 1,842 edges,
including 52 proteins that were encoded by upregulated genes, 36
that were encoded by downregulated genes and 1,458 nodes marking
proteins that were not encoded by DEGs (Fig. 2; Table
I).
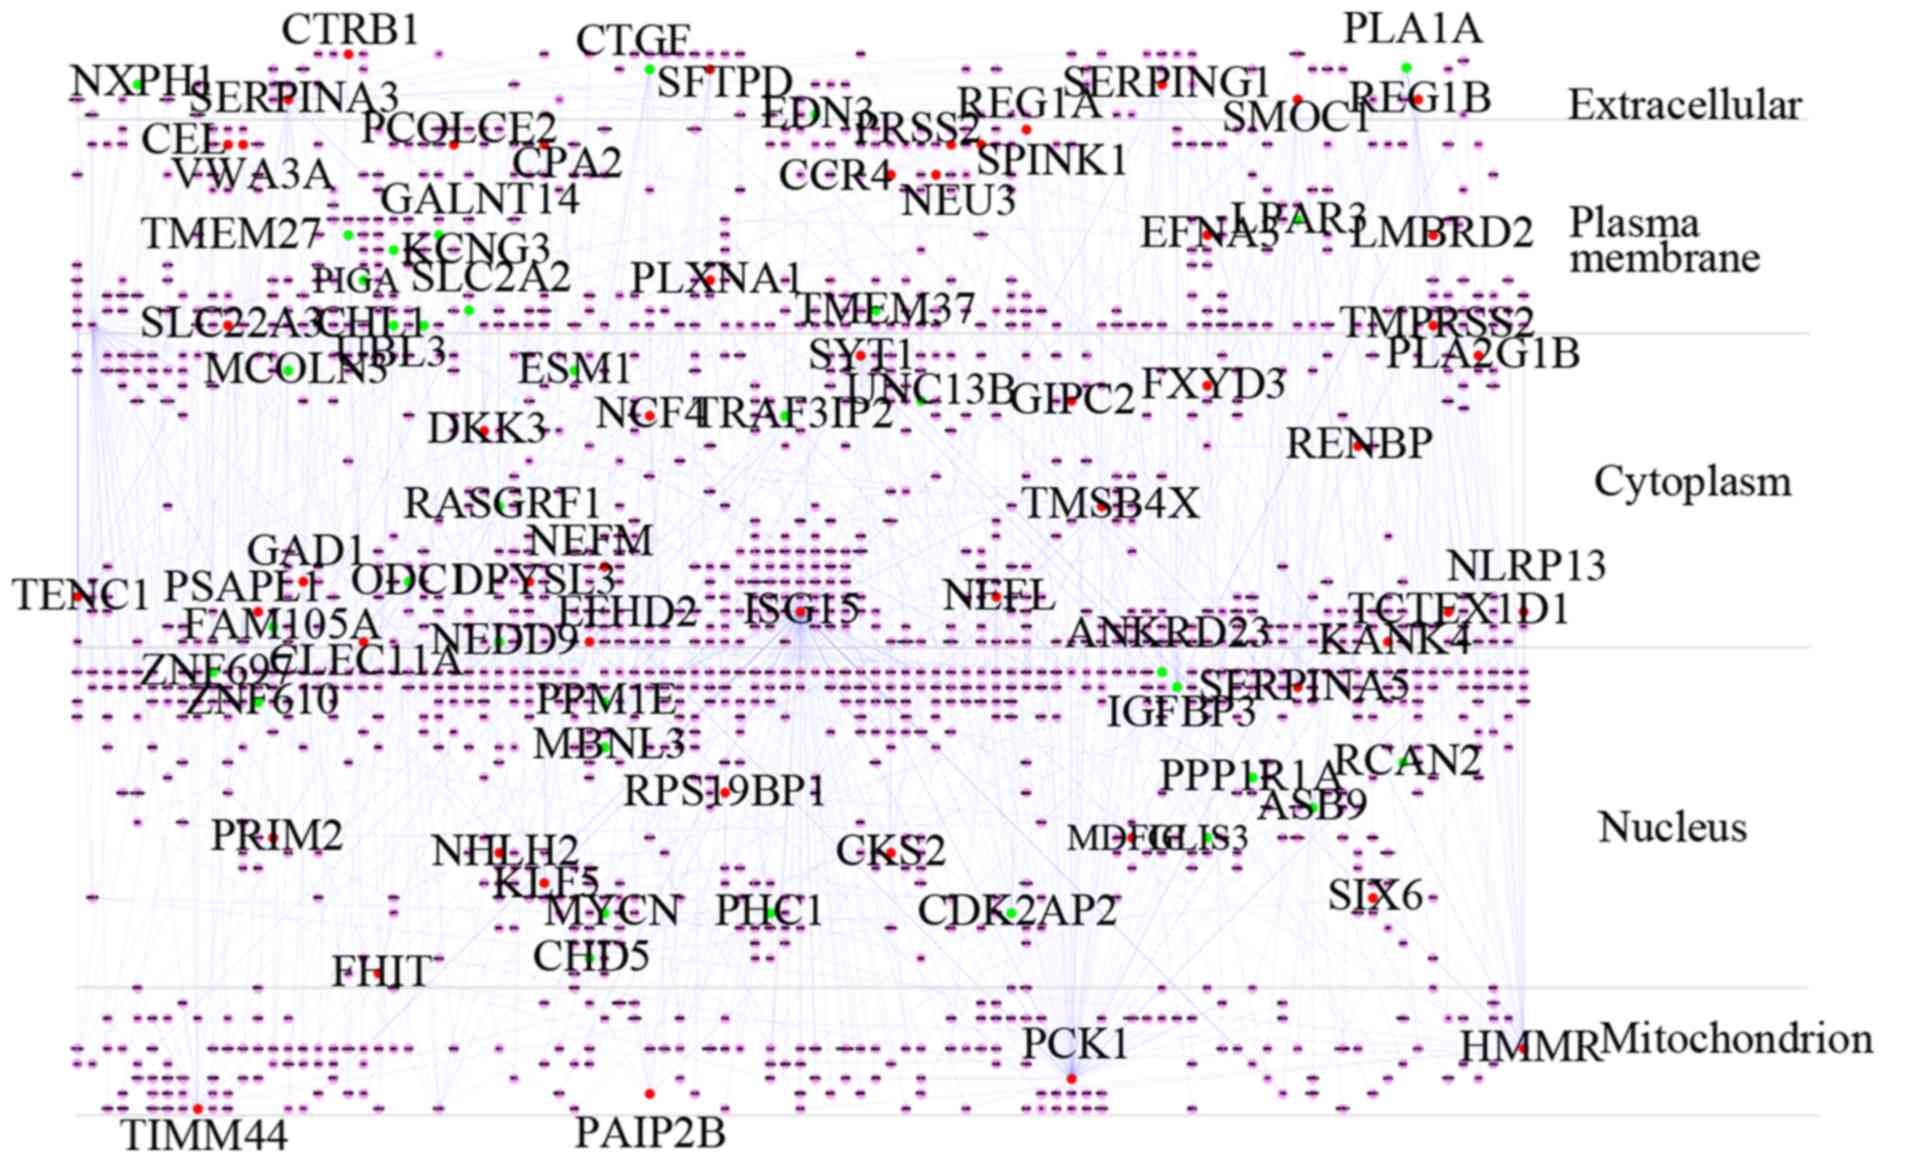
Subcellular protein localization is a crucial
process in numerous cells. Following synthesis, proteins are
transported to distinct compartments depending on their molecular
function within the cell. Certain proteins are even transported to
distant sites. Protein localization data can contribute to the
elucidation of protein functions. The subcellular localization
information for each protein in the integrated PPI network obtained
from the HPRD, the UniProt database (http://www.uniprot.org/help/uniprotkb) and the Human
Protein Atlas database (http://www.proteinatlas.org/) (42), was input as a node attribute. Then,
the layered network was created from the PPI network using the
Cerebral plug-in (43) of
Cytoscape, according to the subcellular localization information of
1,546 proteins, which was split into five layers as follows:
Extracellular, plasma membrane, cytoplasm, nucleus and
mitochondrion (Fig. 3).
The degree distribution of a network is a standard
feature of scale-free networks. The degree distributions of the
layered network closely followed the power law distribution, with
an R2=0.865. This suggested that the integrated PPI network is a
true cellular complex biological network and scale-free. The other
topological parameters of the network are presented in Table II. The results also suggested that
a small number of nodes are hubs with a number of links to nodes. A
total of 83 DEGs were identified as hub genes with an interaction
degree ≥8 and were selected as candidate genes (Table SII). The top 20 candidate genes
are presented in Table III. Of
these candidate genes, ISG15 ubiquitin like modifier (ISG15)
had the highest degree (185), followed by phosphoenolpyruvate
carboxykinase 1 (PCK1) (85) and neural precursor cell expressed,
developmentally downregulated 9 (NEDD9) (50). The present study identified 83
candidate genes for T2DM (Table
IV). The identified candidate genes may serve as biological
markers for future T2DM treatment research.
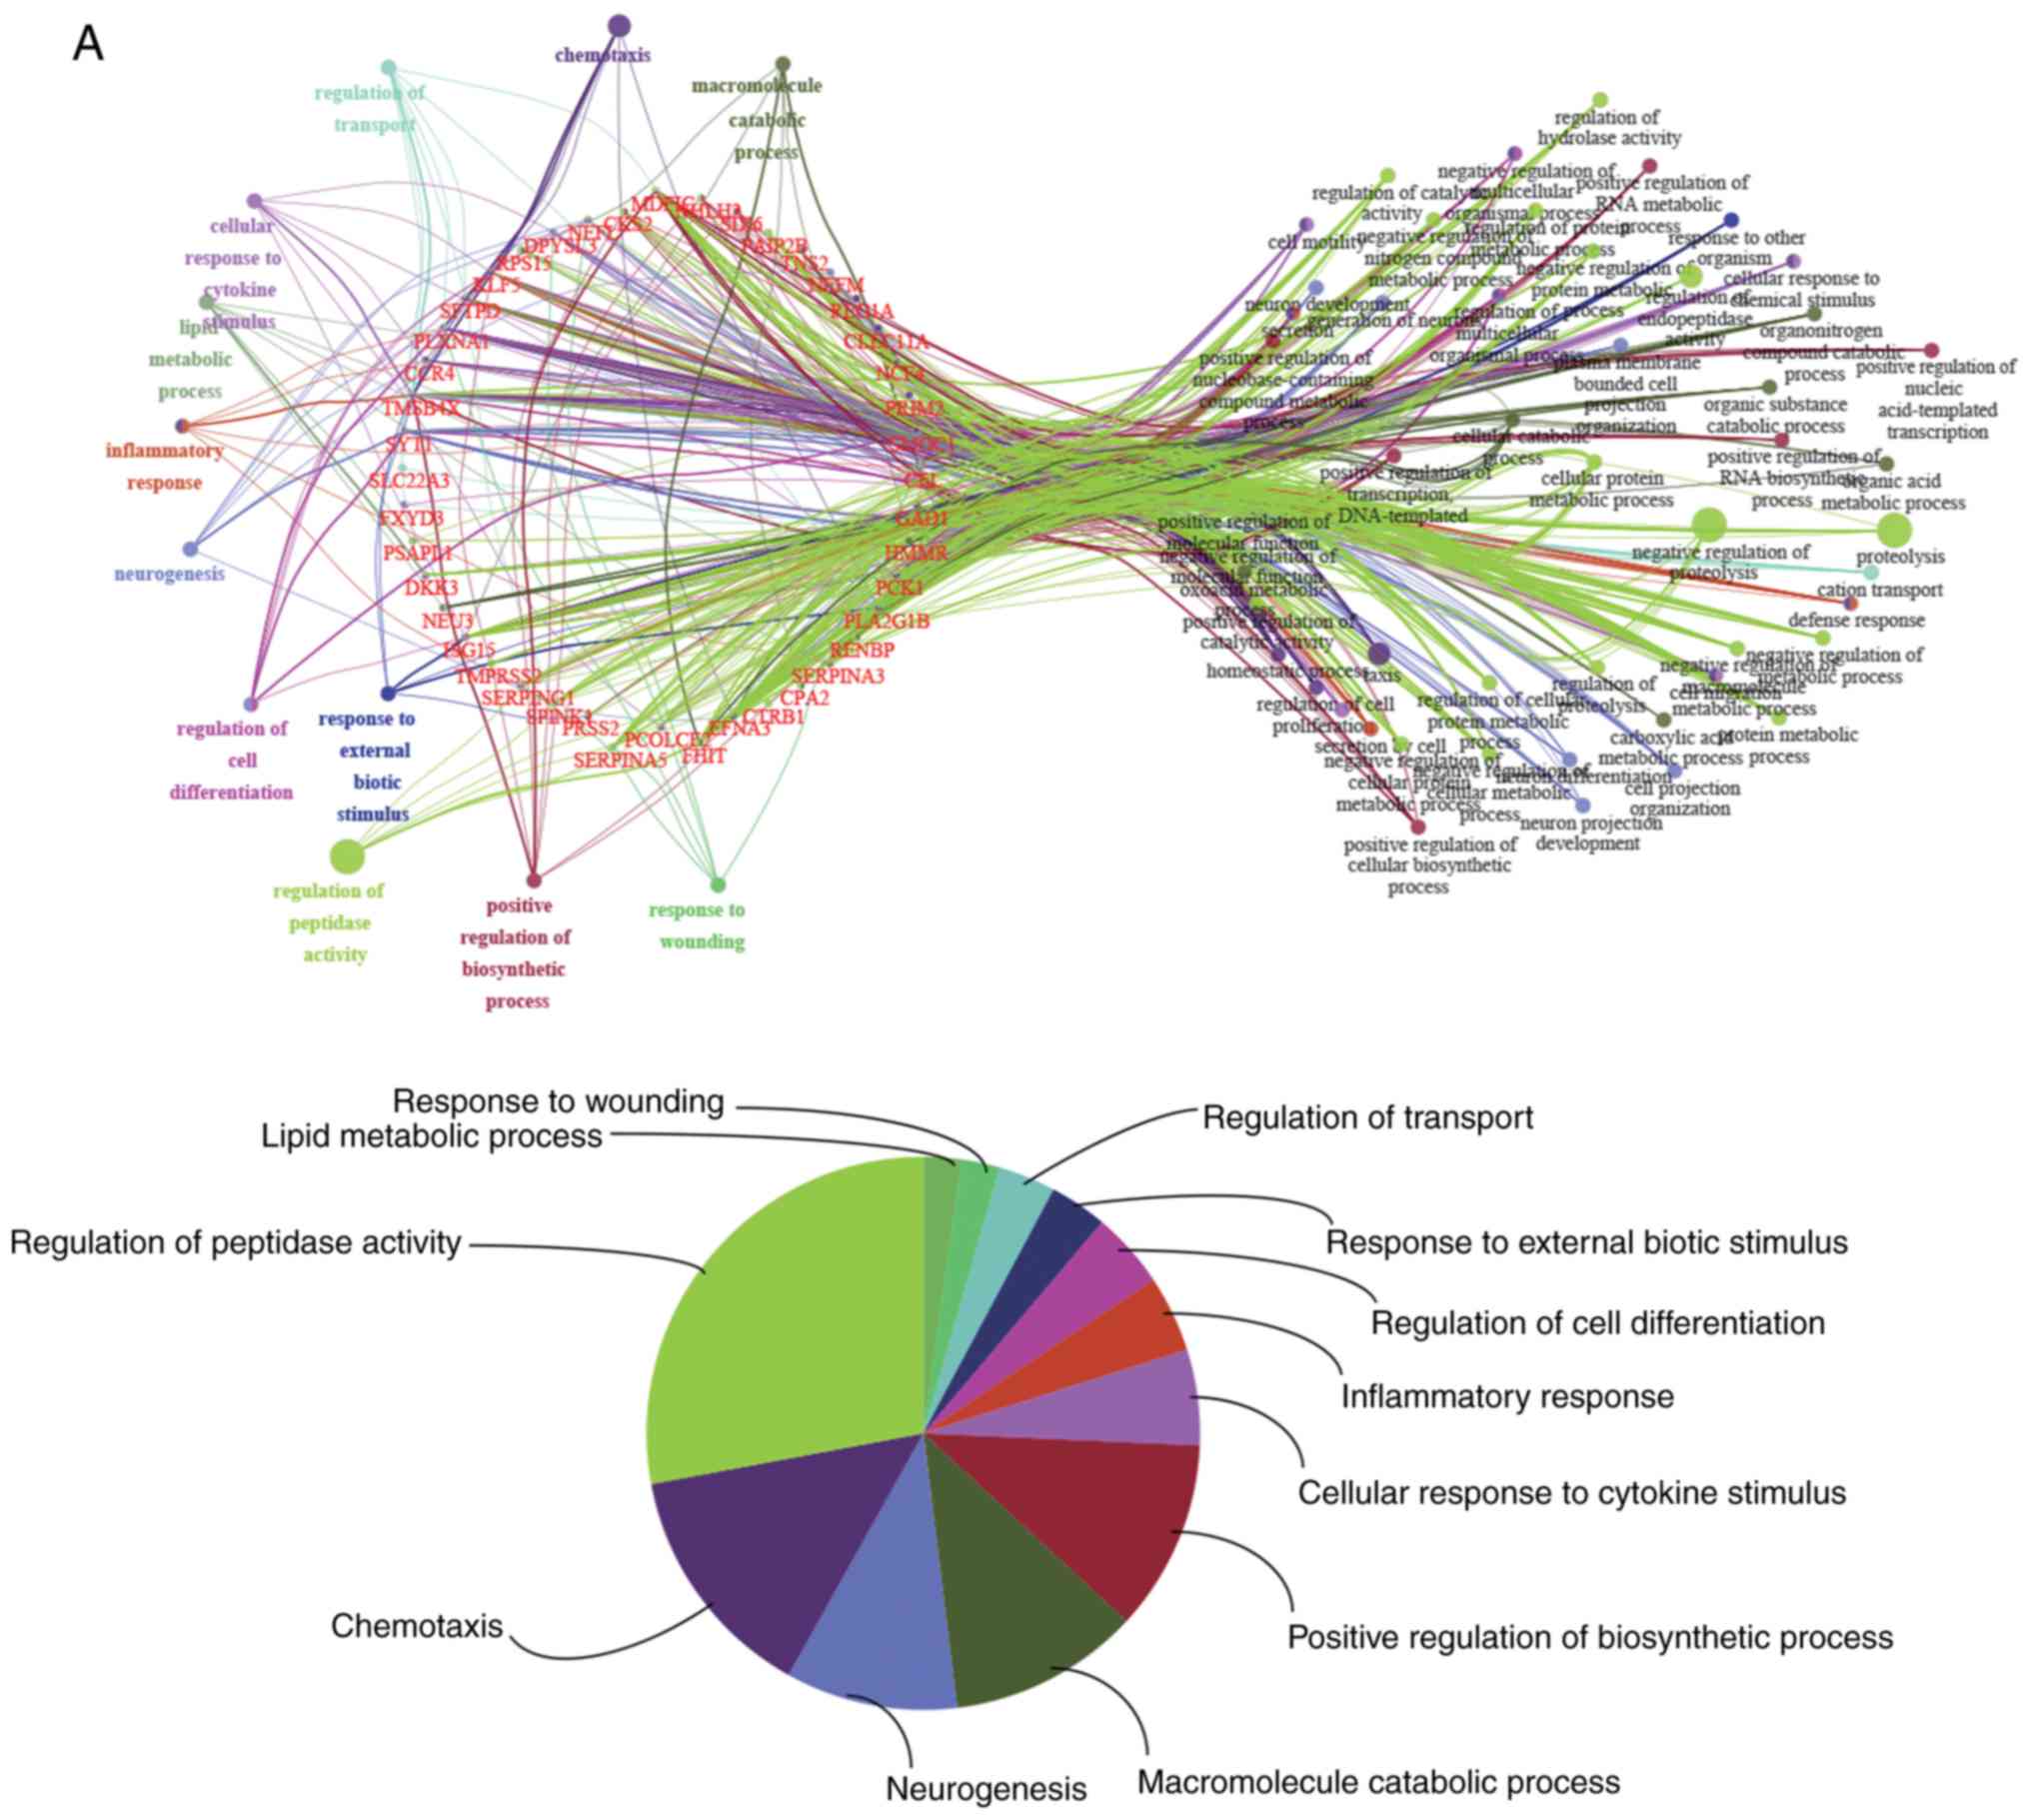
To clarify possible biological functions of
candidate genes, and examine the relationship between the
functional groups and their underlying annotations in the networks,
BP enrichment analyses were performed for the 46 upregulated and 37
downregulated candidate genes using ClueGO and CluePedia. A κ score
>0.4 was set as the criterion. The results are presented in
Fig. 4. Specifically, for the
upregulated groups, the results yielded BPs related to the
activation of ‘cellular response to cytokine stimulus’,
‘chemotaxis’, ‘inflammatory response’, ‘lipid metabolic process’,
‘macromolecule catabolic process’, ‘positive regulation of
biosynthetic process’, ‘neurogenesis’, ‘regulation of cell
differentiation’, ‘regulation of peptidase activity’, ‘regulation
of transport’, ‘response to external biotic stimulus’ and ‘response
to wounding’ (Fig. 4A). For the
downregulated groups, the results yielded BPs related to the
activation of ‘ion transport’, ‘neuron differentiation’, ‘positive
regulation of cell death’, ‘positive regulation of cell
proliferation’, ‘positive regulation of cellular component
biogenesis’, ‘positive regulation of signaling’, ‘regulation of
cell cycle process’ and ‘regulation of ion transport’ (Fig. 4B).
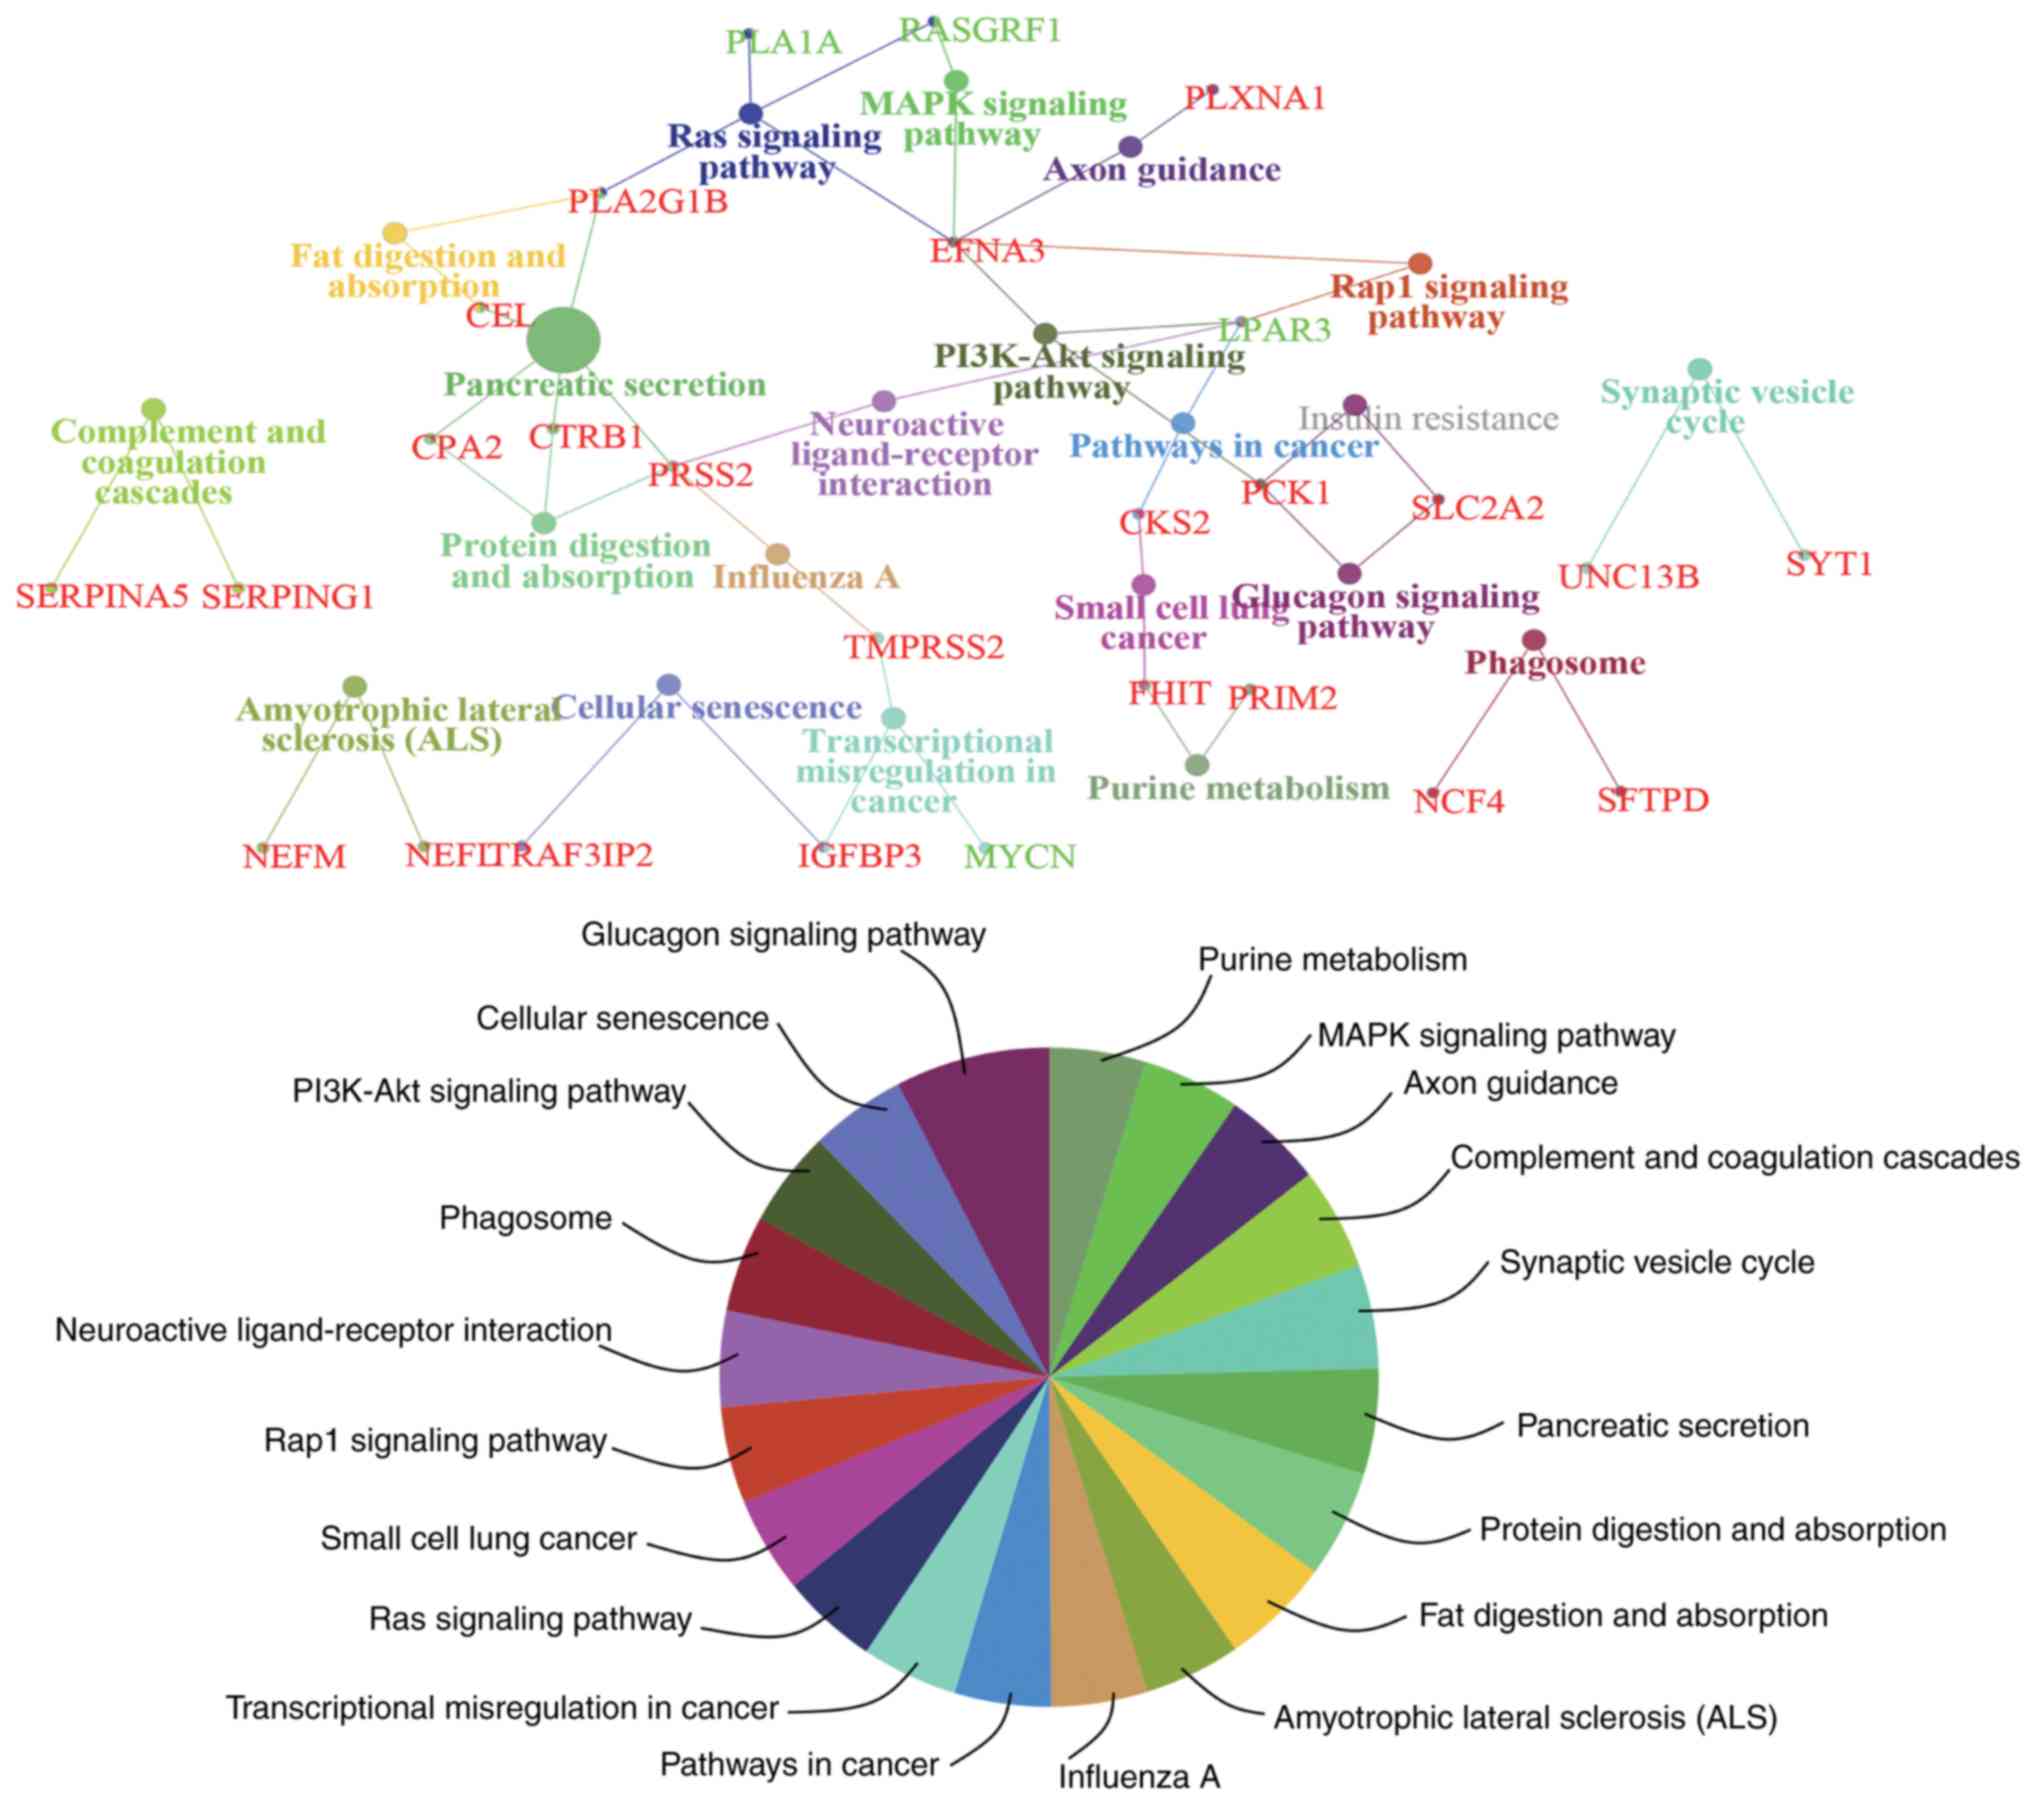
To obtain an improved understanding of the
functional involvement of these candidate genes, pathway-based
functional enrichment analyses was performed using ClueGO and
CluePedia. A κ score >0.4 was set as the criterion. These genes
were involved in pathways associated with ‘amyotrophic lateral
sclerosis (ALS)’ [neurofilament light (NEFL) neurofilament
medium], ‘axon guidance’ [ephrin A3 (EFNA3) and plexin A1
(PLXNA1)], ‘cellular senescence’ [insulin like growth factor
binding protein 3 (IGFBP3) and TRAF3 interacting protein 2
(TRAF3IP2)], ‘complement and coagulation cascades’ [serpin
family A member 5 (SERPINA5) and serpin family G member 1
(SERPING1)], ‘fat digestion and absorption’ [carboxyl ester
lipase (CEL) and phospholipase A2 group IB
(PLA2G1B)], ‘glucagon signaling pathway’ (PCK1 and
solute carrier family 2 member 2), ‘influenza A’ [serine protease 2
(PRSS2) and transmembrane serine protease 2
(TMPRSS2)], ‘MAPK signaling pathway’ [EFNA3 and Ras
protein specific guanine nucleotide releasing factor 1
(RASGRF1)], ‘neuroactive ligand-receptor interaction’
[lysophosphatidic acid receptor 3 (LPAR3) and PRSS2],
‘PI3K-Akt signaling pathway’ (EFNA3, LPAR3 and PCK1),
‘pancreatic secretion’ [CEL, carboxypeptidase A2
(CPA2), chymotrypsinogen B1 (CTRB1), PLA2G1B
and PRSS2], ‘pathways in cancer’ [CDC28 protein kinase
regulatory subunit 2 (CKS2) and LPAR3), ‘phagosome’
[neutrophil cytosolic factor 4 (NCF4) and surfactant protein
D (SFTPD)], ‘protein digestion and absorption’ (CPA2,
CTRB1 and PRSS2), ‘purine metabolism’ [fragile histidine
triad diadenosine triphosphatase (FHIT) and DNA primase
subunit 2), ‘Rap1 signaling pathway’ (EFNA3 and
LPAR3), ‘Ras signaling pathway’ (EFNA3, phospholipase
A1 member A, PLA2G1B and RASGRF1), ‘small cell lung
cancer’ (CKS2 and FHIT), ‘synaptic vesicle cycle’ [synaptotagmin
(SYT1) and unc-13 homolog B (UNC13B)] and
‘transcriptional misregulation in cancer’ (IGFBP3, MYCN
proto-oncogene, bHLH transcription factor and TMPRSS2)
(Fig. 5).
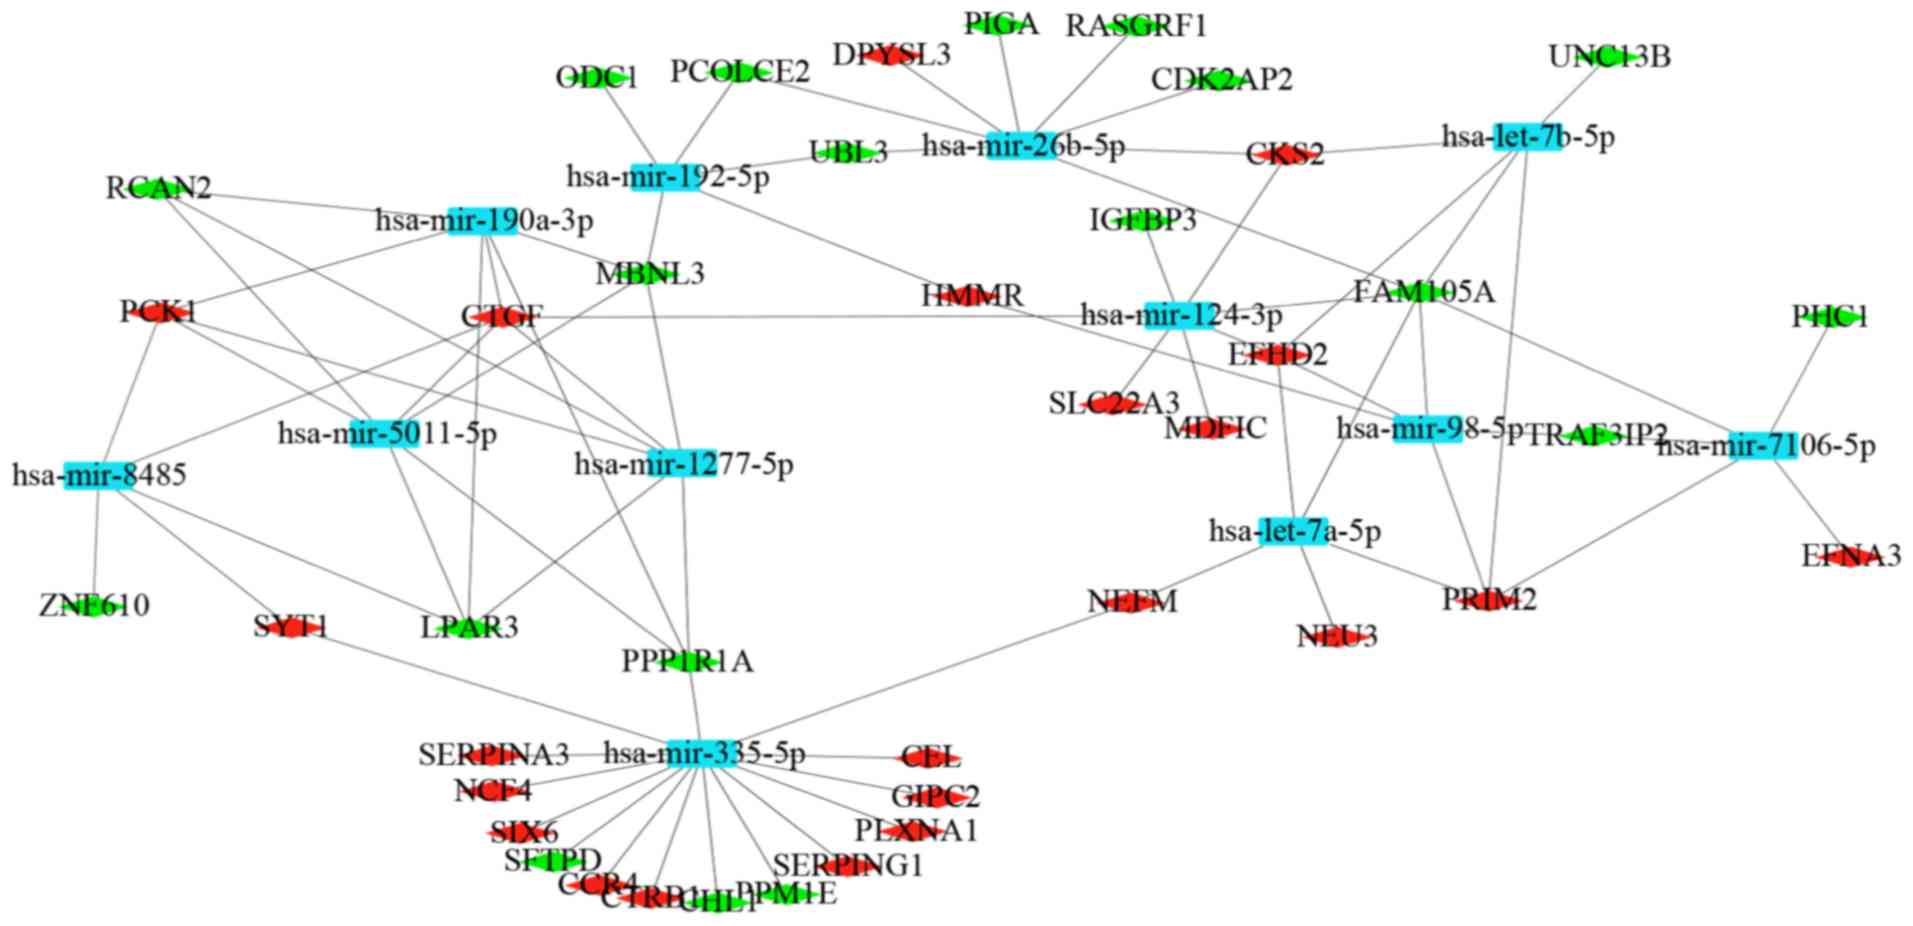
The miRNAs for DEGs were predicted using the two
microRNA prediction tools through miRNet. The miRNA-gene regulatory
network was built, which included 22 upregulated target genes, 19
downregulated target genes and 12 miRNAs (Fig. 6). A total of 12 miRNAs were
selected, including hsa-mir-335-5p (degree=15), hsa-mir-8485
(degree=4), hsa-mir-1277-5p (degree=5), hsa-mir-190a-3p (degree=5),
hsa-mir-5011-5p (degree=5), hsa-mir-124-3p (degree=6),
hsa-mir-7106-5p (degree=5), hsa-let-7a-5p (degree=5),
hsa-mir-192-5p (degree=5), hsa-mir-26b-5p (degree=6), hsa-let-7b-5p
(degree=5) and hsa-mir-98-5p (degree=5).
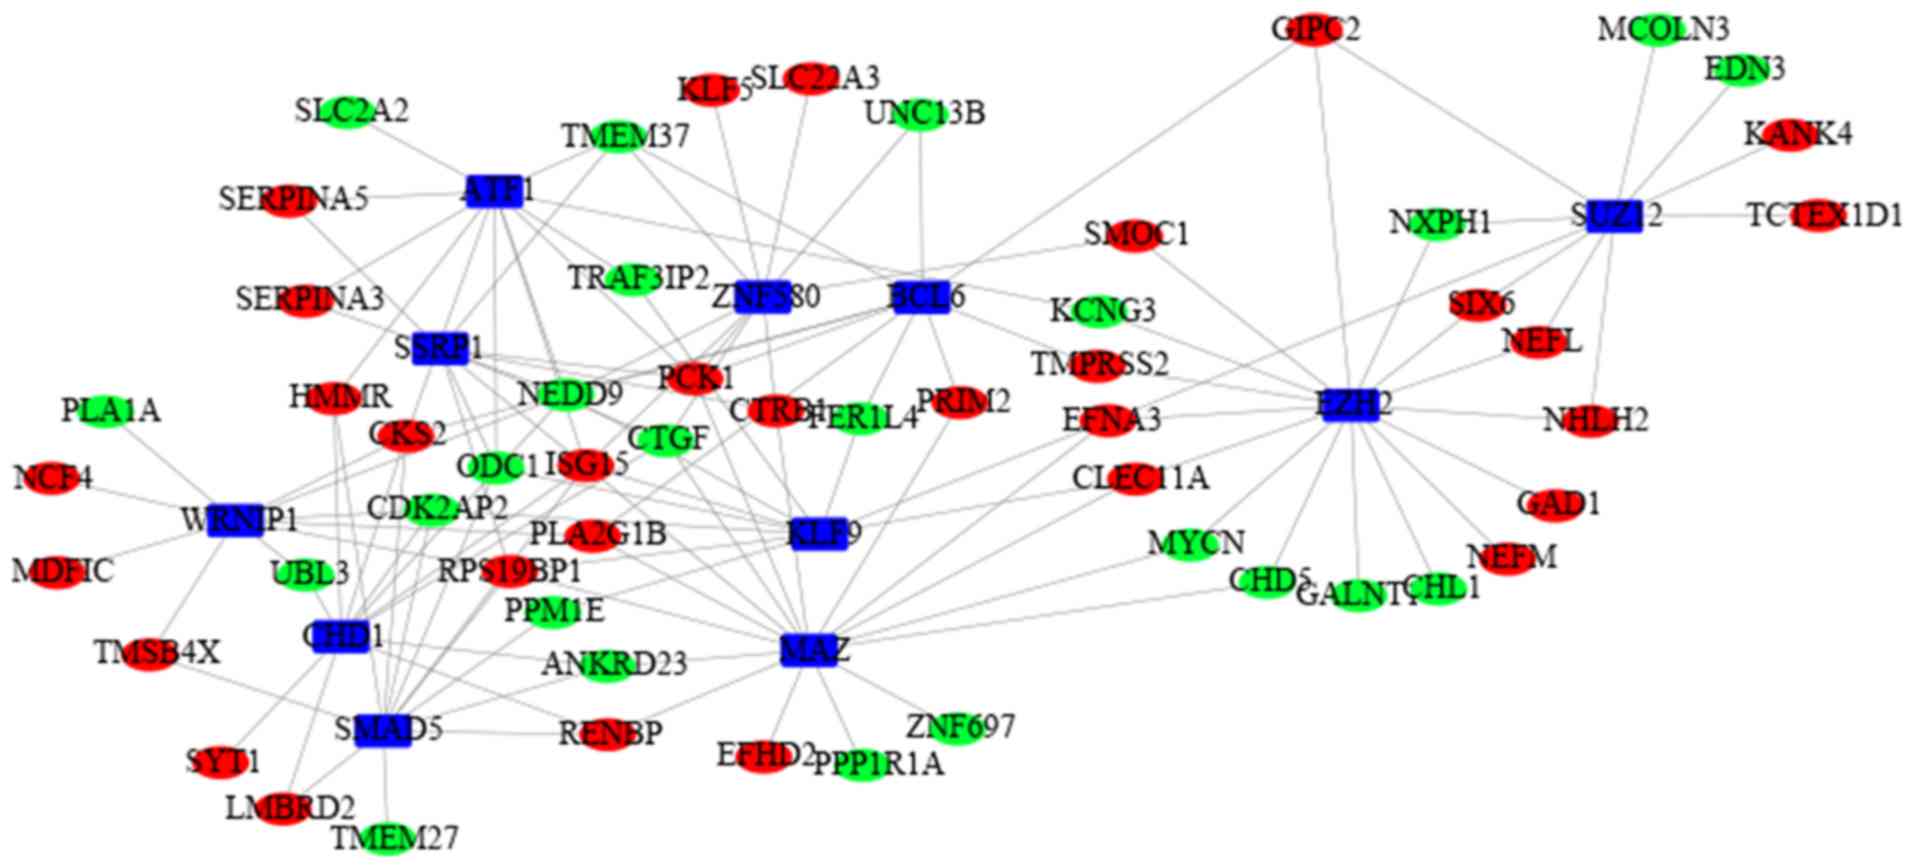
In order to understand the topology and dynamics of
the transcriptional regulatory network, TFs with a P<0.05 in
BETA with its target genes via network analysis were built into a
TF-target gene regulatory network using Cytoscape. The network
consisted of 127 edges and 66 nodes (Fig. 7). Based on the degree, the top 8
TFs were selected to be enhancers of SUZ12 polycomb repressive
complex 2 subunit (SUZ12; degree=10), enhancer of zeste 2
polycomb repressive complex 2 subunit (EZH2; degree=15),
BCL6 transcription repressor (BCL6; degree=9), zinc finger
protein 580 (ZNF580; degree=10), Kruppel like factor 9
(KLF9; degree=8), MYC associated zinc finger protein
(MAZ; degree=15), activating transcription factor 1
(ATF1; degree=12), structure specific recognition protein 1
(SSRP1; degree=10), WRN helicase interacting protein 1
(WRNIP1; degree=10), chromodomain helicase DNA binding
protein 1 (CHD1; degree=10) and SMAD5
(degree=11).
T2DM is a multifactorial and multigenetic disease,
and its pathogenesis is complex and largely unknown. A PPI network
and a layered network for DEGs were constructed and it was observed
that the majority of the proteins were localized in the cytoplasm,
followed by the nucleus. The modules were mined from the PPI
network and ISG15, PCK1, NEDD9, thymosin β 4 X-linked
(TMSB4X), SYT1, IGFBP3, NEFL, tensin 2, translocase
of inner mitochondrial membrane 44 (TIMM44), hyaluronan
mediated motility receptor (HMMR), ankyrin repeat and SOCS
box containing 9 and TRAF3IP2 were screened as the candidate
genes with the highest degree of connectivity.
The functional assay for candidate genes using
ClueGO and CluePedia in GO terms or KEGG pathways identified
several molecular mechanisms, widely known to underlie the
pathogenesis of T2DM. A number of vital processes/signaling
pathways and key factors connected with the pathogenesis of T2DM
were identified from the functional enrichment analyses. In the
upregulated group, a number of the corresponding encoded proteins
were distributed in the extracellular and cytoplasmic layers. In
particular, it was identified that the majority of BPs were
associated with ‘inflammatory response’, ‘cellular response to
cytokine stimulus’ and ‘lipid metabolic process’. In previous
years, a number of studies have suggested that T2DM may be a
chronic inflammatory response modulated by inflammatory factors
(66–69). Immune cell infiltration and high
levels of cytokines were observed in the pancreas islets of T2DM
(70,71), which caused differing degrees of
impairment to pancreatic β-cell activity, resulting in β-cell
failure (72,73). Lipotoxic effects lead to impaired
insulin secretion and apoptosis of β-cells, which can give rise to
the β-cell functional loss in the pathogenesis of T2DM (74). In the downregulated group, more
corresponding encoded proteins were distributed in the plasma
membrane and nucleus layers, and BPs were related to the ‘positive
regulation of cell death’ and ‘positive regulation of cell
proliferation’. Previous studies demonstrated that glucotoxic
conditions are used to elevate β-cell proliferation and neogenesis,
and the inhibition of apoptosis and death lead to insulin release
defects, which is typical of diabetes (75,76);
β-cell death is the major cause of T2DM. According to protein
subcellular localization, the composition and biological value of
proteins could change; analyzing PPIs may help identify the
signaling pathways. The present study identified three interactions
among 83 candidate genes, including SERPINA3 and
CTRB1 in the extracellular matrix, SERPING1 and
thymosin b4 X-linked (TMSB4X) in the cytoplasm, and
SYT1 and UNC13B in the cytoplasm, which were shared
between BPs, including protein input into the cytoplasm and
cell-cell signaling, which might indicate that their expression was
altered by the signaling cascades of the extracellular-plasma
membrane-cytoplasm or nucleus and alteration in cell development.
Takahashi et al (77)
identified that SERPINA3 levels were significantly increased
in T2DM. The rs7202877 locus for CTRB1 and CTRB2, a
known diabetes risk locus, might be able to prevent diabetes via
the incretin pathway (78).
SERPINA5 inhibits activated protein C (APC). APC has a
potential preventative role for islet β-cell damage and diabetes
(79). A previous study observed
that the plasma levels of APC were notably decreased in T2DM
(80). SERPINA5 may be
involved in T2DM via inhibited APC expression. TMSB4X is
involved in cell proliferation, migration and differentiation, and
its level increased in diabetic membranes (81).
The enriched KEGG pathways of candidate genes
involved ‘MAPK signaling pathway’, ‘Ras signaling pathway’,
‘PI3K-Akt signaling pathway’, ‘Rap1 signaling pathway’ and ‘purine
metabolism’. Previous studies demonstrated that p38 MAPK and ERK
signaling were activated to inhibit obesity and associated T2DM
(82,83). The Ras/Raf/ERK signaling pathway
may control β-cell proliferation, and Ras is essential for normal
β-cell development and function (84). Saltiel and Kahn (75) demonstrated that any obstacles in
the PI3K/Akt insulin signaling pathway result in islet β-cells
insulin resistance and lead to β-cell function reduction. Previous
studies demonstrated that the Rap1 pathway may yield targets for
β-cell dysfunction therapy in diabetes (85–88).
The pathway enrichment results for candidate genes in the present
study identified the MAPK. Ras, PI3K-Akt and Rap1 signaling
pathways in diabetes. RASGRF1 is mainly involved in the MAPK
and Ras signaling pathways (89).
Suppressing the expression of Rasgrf1 may contribute to
insufficient insulin secretion (90), which due to insulin resistance,
causes T2DM. In addition, EFNA3 in the extracellular matrix
was enriched in the PI3K-Akt, MAPK, Rap1 and Ras signaling
pathways. EFNA3 is an upstream gene of the MAPK signaling
pathway and the PI3K-Akt signaling pathway (91). Therefore, it was hypothesized that
a low expression of EFNA3 may regulate β-cell proliferation
by activating Ras/Raf/MEK/ERK. FHIT, a protein product involved in
purine metabolism that participates in the T2DM pathway, is
expressed in the pancreas (92).
Its single-nucleotide polymorphism (rs3845971) was related to an
intensified risk of T2DM (93).
FHIT increases adenosine-diphosphate in the purine metabolism
pathway (94). Therefore, FHIT may
induce β-cell apoptosis in the pancreas due to T2DM.
A TF-target gene regulatory network was
constructed, from which 10 TFs were identified and Smad5 was a
potential target for T2DM treatment (105). The Forkhead box class
O/Bcl6/cyclin D2 pathway connects nutrient and growth factor status
to cell cycle control in pancreatic β-cells, and should therefore
be considered for its therapeutic potential in diabetes (106). Notably, 8 of these transcription
regulatory factors, SUZ12, EZH2, ZNF580, KLF9, MAZ, ATF1, SSRP1,
WRNIP1, CHD1 were shown to be involved in the development of T2DM
by modulating the expression of various candidate genes such as
ankyrin repeat domain 23 (ANKRD23), transmembrane protein 37
(TMEM37), PPP1R1A, PCK1, CTGF, ISG1, SSRP1, WRNIP1
and CHD1, which have not been previously reported to be
dysregulated in T2DM. The present study predicted that these TFs
might play key roles in the occurrence and development of T2DM.
This result provided preliminary evidence that a lower expression
of TMEM37 could reflect a decrease in β-cell numbers in T2DM
(107). ANKRD23, a
diabetes-related ankyrin repeat protein, was identified as a novel
gene that is upregulated in the hearts of KKA(y) mice, a T2DM and
insulin-resistant animal model (108). Solimena et al (110) also identified that ANKRD23,
PPP1R1A and TMEM37 were enriched in β-cells and
downregulated in T2DM. TMEM37 prohibits
Ca2+-influx and insulin secretion in β-cells (109).
The present study has some limitations. The number
of samples was relatively inadequate, although the combining of
multiple datasets can compensate for missing or unreliable
information in any single dataset. Additionally, the present
results are preliminary and descriptive. Integrative analysis of
gene profiling data cannot entirely exclude false positive results.
Furthermore, the present study only discussed mRNA expression and
did not refer to the protein expression of the factors identified.
Due to post-transcription regulatory events, protein expression
levels may or may not correlate with mRNA levels. However, the
alteration of protein structure, function and interaction is the
underlying mechanism of a number of diseases, including diabetes
(110–112). Therefore, some experiments, such
as reverse transcription-quantitative PCR (113,114), western blotting (115), cross-linking immunoprecipitation
(116) or functional experimental
validation, are needed to validate key genes, TFs and miRNAs and
relevant proteins in T2DM development. Despite these limitations,
the present study still provided insight for understanding the
complicated underlying molecular mechanisms of T2DM.
Overall, the bioinformatics analysis of the present
study identified potential markers that may play a potential role
in the occurrence, development and treatment of T2DM. A total of 83
candidate genes were selected, and ISG15, PCK1, SYT1, IGFBP3,
TIMM44 and TRAF3IP2 could be the core genes of T2DM.
Certain key BPs such as ‘inflammatory response’, ‘cellular
responses to cytokine stimulus’, ‘lipid metabolic process’,
‘positive regulation of cell death’ and ‘positive regulation of
cell proliferation’, and certain signaling pathways associated with
the PI3K-Akt, MAPK, Rap1 and Ras signaling pathways were identified
to be involved in T2DM. The present study also identified miRNAs,
including hsa-miR-192-5p, hsa-miR-124-5p and hsa-miR-335-5p, and
TFs, including Smad5 and Bcl6, that might be potential targets for
the diagnosis and treatment of T2DM. In addition, has-miR-8485,
has-miR-1277-3p, has-miR-190a-3p, has-miR-5011-3p, has-let-7a-5p,
has-let-7b-5p, has-miR-98-5p, has-miR-7106-5p and has-miR-26b-5p,
and TFs SUZ12, EZH2, ZNF580, KLF9, MAZ, ATF1, SSRP1, WRNIP1
and CHD1 have not been previously identified to be related
to T2DM, to the best of the authors’ knowledge, while they and
their target genes may serve as diagnostic indicators for patients
with T2DM. To obtain more reliable correlation results, it is
necessary to validate the predicted results with a series of
verification experiments. The present study identified candidate
genes for T2DM development, which might be redefined as pathogenic
genes for T2DM diagnosis and therapy. The experimental results
could provide insight for future genomic individualized treatment
of T2DM and help to identify the underlying molecular mechanisms
that lead to T2DM.
Not applicable.
The present study was supported by The National
Natural Science Foundation of China (grant no. c010201), Startup
Funding for Specialized Professorship provided by The Shanghai Jiao
Tong University (grant no. WF220441502), The National Key Research
and Development Program (grant no. 2017YFC1308605), The Fundamental
Research Funds for The Central Universities Key Grant (grant no.
CQDXWL-2014-Z002), a grant (grant no. YZYN-15-04) from The Basic
Scientific Research Special of The Central Public Welfare Research
Institutes of Medicinal Plant Development, Chinese Academy of
Medical Sciences and Peking Union Medical College, The Applied
Basic Research Foundation of Yunnan Province of China (grant no.
2016FB143), The National Natural Science Foundation of China (grant
no. 81503289) and The PUMC Youth Fund (grant no. 2017350013).
The datasets used or analyzed during the present
study are included in this article.
HL and GL designed and conceived the experiments.
YLu, GL and YLi collected and analyzed the data. HL and YL wrote
the manuscript, and all authors reviewed the manuscript.
Not applicable.
Not applicable.
The authors declare that they have no competing
interests.
|
1
|
Zheng Y, Ley SH and Hu FB: Global
aetiology and epidemiology of type 2 diabetes mellitus and its
complications. Nat Rev Endocrinol. 14:88–98. 2018. View Article : Google Scholar : PubMed/NCBI
|
|
2
|
International Diabetes Federation: IDF
Diabetes Atlas. (8th). IDF. (Brussels, Belgium). 2017.
|
|
3
|
Ohn JH, Kwak SH, Cho YM, Lim S, Jang HC,
Park KS and Cho NH: 10-year trajectory of β-cell function and
insulin sensitivity in the development of type 2 diabetes: A
community-based prospective cohort study. Lancet Diabetes
Endocrinol. 4:27–34. 2016. View Article : Google Scholar : PubMed/NCBI
|
|
4
|
Ashcroft FM, Rohm M, Clark A and Brereton
MF: Is type 2 diabetes a glycogen storage disease of pancreatic β
cells? Cell Metab. 26:17–23. 2017. View Article : Google Scholar : PubMed/NCBI
|
|
5
|
Almaça J, Weitz J, Rodriguez-Diaz R,
Pereira E and Caicedo A: The pericyte of the pancreatic islet
regulates capillary diameter and local blood flow. Cell Metab.
27:630–644.e4. 2018. View Article : Google Scholar : PubMed/NCBI
|
|
6
|
Wei FJ, Cai CY, Yu P, Lv J, Ling C, Shi
WT, Jiao HX, Chang BC, Yang FH, Tian Y, et al: Quantitative
candidate gene association studies of metabolic traits in Han
Chinese type 2 diabetes patients. Genet Mol Res. 14:15471–15481.
2015. View Article : Google Scholar : PubMed/NCBI
|
|
7
|
Chen J, Meng Y, Zhou J, Zhuo M, Ling F,
Zhang Y, Du H and Wang X: Identifying candidate genes for type 2
diabetes mellitus and obesity through gene expression profiling in
multiple tissues or cells. J Diabetes Res. 2013:9704352013.
View Article : Google Scholar : PubMed/NCBI
|
|
8
|
Lynch CJ and Adams SH: Branched-chain
amino acids in metabolic signalling and insulin resistance. Nat Rev
Endocrinol. 10:723–736. 2014. View Article : Google Scholar : PubMed/NCBI
|
|
9
|
Xue A, Wu Y, Zhu Z, Zhang F, Kemper KE,
Zheng Z, Yengo L, Lloyd-Jones LR, Sidorenko J, Wu Y, et al: eQTLGen
Consortium: Genome-wide association analyses identify 143 risk
variants and putative regulatory mechanisms for type 2 diabetes.
Nat Commun. 9:29412018. View Article : Google Scholar : PubMed/NCBI
|
|
10
|
Lawlor N, Khetan S, Ucar D and Stitzel ML:
Genomics of Islet (Dys)function and Type 2 Diabetes. Trends Genet.
33:244–255. 2017. View Article : Google Scholar : PubMed/NCBI
|
|
11
|
Lee I, Blom UM, Wang PI, Shim JE and
Marcotte EM: Prioritizing candidate disease genes by network-based
boosting of genome-wide association data. Genome Res. 21:1109–1121.
2011. View Article : Google Scholar : PubMed/NCBI
|
|
12
|
Lawlor N, George J, Bolisetty M, Kursawe
R, Sun L, Sivakamasundari V, Kycia I, Robson P and Stitzel ML:
Single-cell transcriptomes identify human islet cell signatures and
reveal cell-type-specific expression changes in type 2 diabetes.
Genome Res. 27:208–222. 2017. View Article : Google Scholar : PubMed/NCBI
|
|
13
|
Segerstolpe Å, Palasantza A, Eliasson P,
Andersson EM, Andréasson AC, Sun X, Picelli S, Sabirsh A, Clausen
M, Bjursell MK, et al: Single-cell transcriptome profiling of human
pancreatic islets in health and type 2 diabetes. Cell Metab.
24:593–607. 2016. View Article : Google Scholar : PubMed/NCBI
|
|
14
|
Zeggini E, Scott LJ, Saxena R, Voight BF,
Marchini JL, Hu T, de Bakker PI, Abecasis GR, Almgren P, Andersen
G, et al Wellcome Trust Case Control Consortium, : Meta-analysis of
genome-wide association data and large-scale replication identifies
additional susceptibility loci for type 2 diabetes. Nat Genet.
40:638–645. 2008. View
Article : Google Scholar : PubMed/NCBI
|
|
15
|
Maruthur NM, Gribble MO, Bennett WL, Bolen
S, Wilson LM, Balakrishnan P, Sahu A, Bass E, Kao WH and Clark JM:
The pharmacogenetics of type 2 diabetes: A systematic review.
Diabetes Care. 37:876–886. 2014. View Article : Google Scholar : PubMed/NCBI
|
|
16
|
van de Bunt M, Manning Fox JE, Dai X,
Barrett A, Grey C, Li L, Bennett AJ, Johnson PR, Rajotte RV,
Gaulton KJ, et al: Transcript expression data from human islets
links regulatory signals from genome-wide association studies for
type 2 diabetes and glycemic traits to their downstream effectors.
PLoS Genet. 11:e10056942015. View Article : Google Scholar : PubMed/NCBI
|
|
17
|
Bonnefond A and Froguel P: Rare and common
genetic events in type 2 diabetes: What should biologists know?
Cell Metab. 21:357–368. 2015. View Article : Google Scholar : PubMed/NCBI
|
|
18
|
Ndiaye FK, Ortalli A, Canouil M, Huyvaert
M, Salazar-Cardozo C, Lecoeur C, Verbanck M, Pawlowski V, Boutry R,
Durand E, et al: Expression and functional assessment of candidate
type 2 diabetes susceptibility genes identify four new genes
contributing to human insulin secretion. Mol Metab. 6:459–470.
2017. View Article : Google Scholar : PubMed/NCBI
|
|
19
|
Pellegrino M, Sciambi A, Treusch S,
Durruthy-Durruthy R, Gokhale K, Jacob J, Chen TX, Geis JA, Oldham
W, Matthews J, et al: High-throughput single-cell DNA sequencing of
acute myeloid leukemia tumors with droplet microfluidics. Genome
Res. 28:1345–1352. 2018. View Article : Google Scholar : PubMed/NCBI
|
|
20
|
Zhang P, Xia JH, Zhu J, Gao P, Tian YJ, Du
M, Guo YC, Suleman S, Zhang Q, Kohli M, et al: High-throughput
screening of prostate cancer risk loci by single nucleotide
polymorphisms sequencing. Nat Commun. 9:20222018. View Article : Google Scholar : PubMed/NCBI
|
|
21
|
Nepal C, O'Rourke CJ, Oliveira DVNP,
Taranta A, Shema S, Gautam P, Calderaro J, Barbour A, Raggi C,
Wennerberg K, et al: Genomic perturbations reveal distinct
regulatory networks in intrahepatic cholangiocarcinoma. Hepatology.
68:949–963. 2018. View Article : Google Scholar : PubMed/NCBI
|
|
22
|
Fuchsberger C, Flannick J, Teslovich TM,
Mahajan A, Agarwala V, Gaulton KJ, Ma C, Fontanillas P, Moutsianas
L, McCarthy DJ, et al: The genetic architecture of type 2 diabetes.
Nature. 536:41–47. 2016. View Article : Google Scholar : PubMed/NCBI
|
|
23
|
Thul PJ, Åkesson L, Wiking M, Mahdessian
D, Geladaki A, Ait Blal H, Alm T, Asplund A, Björk L, Breckels LM,
et al: A subcellular map of the human proteome. Science.
356:8062017. View Article : Google Scholar : PubMed/NCBI
|
|
24
|
Zhu H, Bilgin M and Snyder M: Proteomics.
Annu Rev Biochem. 72:783–812. 2003. View Article : Google Scholar : PubMed/NCBI
|
|
25
|
Larance M and Lamond AI: Multidimensional
proteomics for cell biology. Nat Rev Mol Cell Biol. 16:269–280.
2015. View Article : Google Scholar : PubMed/NCBI
|
|
26
|
Stuart LM, Boulais J, Charriere GM,
Hennessy EJ, Brunet S, Jutras I, Goyette G, Rondeau C, Letarte S,
Huang H, et al: A systems biology analysis of the Drosophila
phagosome. Nature. 445:95–101. 2007. View Article : Google Scholar : PubMed/NCBI
|
|
27
|
Zhao L, Chen Y, Bajaj AO, Eblimit A, Xu M,
Soens ZT, Wang F, Ge Z, Jung SY, He F, et al: Integrative
subcellular proteomic analysis allows accurate prediction of human
disease-causing genes. Genome Res. 26:660–669. 2016. View Article : Google Scholar : PubMed/NCBI
|
|
28
|
Hunt KK, Karakas C, Ha MJ, Biernacka A, Yi
M, Sahin AA, Adjapong O, Hortobagyi GN, Bondy M, Thompson P, et al:
Cytoplasmic Cyclin E Predicts Recurrence in Patients with Breast
Cancer. Clin Cancer Res. 23:2991–3002. 2017. View Article : Google Scholar : PubMed/NCBI
|
|
29
|
Mezzanzanica D, Fabbi M, Bagnoli M,
Staurengo S, Losa M, Balladore E, Alberti P, Lusa L, Ditto A,
Ferrini S, et al: Subcellular localization of activated leukocyte
cell adhesion molecule is a molecular predictor of survival in
ovarian carcinoma patients. Clin Cancer Res. 14:1726–1733. 2008.
View Article : Google Scholar : PubMed/NCBI
|
|
30
|
Zhu W, Yang L and Du Z: Layered functional
network analysis of gene expression in human heart failure. PLoS
One. 4:e62882009. View Article : Google Scholar : PubMed/NCBI
|
|
31
|
Du ZP, Wu BL, Wang SH, Shen JH, Lin XH,
Zheng CP, Wu ZY, Qiu XY, Zhan XF, Xu LY, et al: Shortest path
analyses in the protein-protein interaction network of NGAL
(neutrophil gelatinase-associated lipocalin) overexpression in
esophageal squamous cell carcinoma. Asian Pac J Cancer Prev.
15:6899–6904. 2014. View Article : Google Scholar : PubMed/NCBI
|
|
32
|
Diao B, Liu Y, Zhang Y, Liu Q, Lu WJ and
Xu G: Functional network analysis with the subcellular location and
gene ontology information in human allergic asthma. Genet Test Mol
Biomarkers. 16:1287–1292. 2012. View Article : Google Scholar : PubMed/NCBI
|
|
33
|
Lee S, Zhang C, Kilicarslan M, Piening BD,
Bjornson E, Hallström BM, Groen AK, Ferrannini E, Laakso M, Snyder
M, et al: Integrated Network Analysis Reveals an Association
between Plasma Mannose Levels and Insulin Resistance. Cell Metab.
24:172–184. 2016. View Article : Google Scholar : PubMed/NCBI
|
|
34
|
Alvarez MJ, Shen Y, Giorgi FM, Lachmann A,
Ding BB, Ye BH and Califano A: Functional characterization of
somatic mutations in cancer using network-based inference of
protein activity. Nat Genet. 48:838–847. 2016. View Article : Google Scholar : PubMed/NCBI
|
|
35
|
Krell J, Stebbing J, Frampton AE,
Carissimi C, Harding V, De Giorgio A, Fulci V, Macino G, Colombo T
and Castellano L: The role of TP53 in miRNA loading onto AGO2 and
in remodelling the miRNA-mRNA interaction network. Lancet. 385
(Suppl 1):S152015. View Article : Google Scholar : PubMed/NCBI
|
|
36
|
Marselli L, Thorne J, Dahiya S, Sgroi DC,
Sharma A, Bonner-Weir S, Marchetti P and Weir GC: Gene expression
profiles of Beta-cell enriched tissue obtained by laser capture
microdissection from subjects with type 2 diabetes. PLoS One.
5:e114992010. View Article : Google Scholar : PubMed/NCBI
|
|
37
|
Keshava Prasad TS, Goel R, Kandasamy K,
Keerthikumar S, Kumar S, Mathivanan S, Telikicherla D, Raju R,
Shafreen B, Venugopal A, et al: Human Protein Reference
Database--2009 update. Nucleic Acids Res 37 (Database). D767–D772.
2009. View Article : Google Scholar
|
|
38
|
Chatr-Aryamontri A, Breitkreutz BJ,
Oughtred R, Boucher L, Heinicke S, Chen D, Stark C, Breitkreutz A,
Kolas N, O'Donnell L, et al: The BioGRID interaction database: 2015
update. Nucleic Acids Res. 43(D1): D470–D478. 2015. View Article : Google Scholar : PubMed/NCBI
|
|
39
|
Kerrien S, Aranda B, Breuza L, Bridge A,
Broackes-Carter F, Chen C, Duesbury M, Dumousseau M, Feuermann M,
Hinz U, et al: The IntAct molecular interaction database in 2012.
Nucleic Acids Res. 40(D1): D841–D846. 2012. View Article : Google Scholar : PubMed/NCBI
|
|
40
|
Szklarczyk D, Franceschini A, Wyder S,
Forslund K, Heller D, Huerta-Cepas J, Simonovic M, Roth A, Santos
A, Tsafou KP, et al: STRING v10: Protein-protein interaction
networks, integrated over the tree of life. Nucleic Acids Res.
43(D1): D447–D452. 2015. View Article : Google Scholar : PubMed/NCBI
|
|
41
|
Shannon P, Markiel A, Ozier O, Baliga NS,
Wang JT, Ramage D, Amin N, Schwikowski B and Ideker T: Cytoscape: A
software environment for integrated models of biomolecular
interaction networks. Genome Res. 13:2498–2504. 2003. View Article : Google Scholar : PubMed/NCBI
|
|
42
|
Pontén F, Jirström K and Uhlen M: The
Human Protein Atlas--a tool for pathology. J Pathol. 216:387–393.
2008. View Article : Google Scholar : PubMed/NCBI
|
|
43
|
Barsky A, Gardy JL, Hancock RE and Munzner
T: Cerebral: A Cytoscape plugin for layout of and interaction with
biological networks using subcellular localization annotation.
Bioinformatics. 23:1040–1042. 2007. View Article : Google Scholar : PubMed/NCBI
|
|
44
|
Bindea G, Galon J and Mlecnik B: CluePedia
Cytoscape plugin: Pathway insights using integrated experimental
and in silico data. Bioinformatics. 29:661–663. 2013. View Article : Google Scholar : PubMed/NCBI
|
|
45
|
Bindea G, Mlecnik B, Hackl H, Charoentong
P, Tosolini M, Kirilovsky A, Fridman WH, Pagès F, Trajanoski Z and
Galon J: ClueGO: A Cytoscape plug-in to decipher functionally
grouped gene ontology and pathway annotation networks.
Bioinformatics. 25:1091–1093. 2009. View Article : Google Scholar : PubMed/NCBI
|
|
46
|
Gene Ontology Consortium: Gene Ontology
Consortium: Going forward. Nucleic Acids Res. 43(D1): D1049–D1056.
2015. View Article : Google Scholar : PubMed/NCBI
|
|
47
|
Kanehisa M, Furumichi M, Tanabe M, Sato Y
and Morishima K: KEGG: New perspectives on genomes, pathways,
diseases and drugs. Nucleic Acids Res. 45(D1): D353–D361. 2017.
View Article : Google Scholar : PubMed/NCBI
|
|
48
|
Fan Y, Siklenka K, Arora SK, Ribeiro P,
Kimmins S and Xia J: miRNet - dissecting miRNA-target interactions
and functional associations through network-based visual analysis.
Nucleic Acids Res 44 (W1). W135–41. 2016. View Article : Google Scholar
|
|
49
|
Chou CH, Chang NW, Shrestha S, Hsu SD, Lin
YL, Lee WH, Yang CD, Hong HC, Wei TY, Tu SJ, et al: miRTarBase
2016: Updates to the experimentally validated miRNA-target
interactions database. Nucleic Acids Res. 44(D1): D239–D247. 2016.
View Article : Google Scholar : PubMed/NCBI
|
|
50
|
Xiao F, Zuo Z, Cai G, Kang S, Gao X and Li
T: miRecords: An integrated resource for microRNA-target
interactions. Nucleic Acids Res 37 (Database). D105–D110. 2009.
View Article : Google Scholar
|
|
51
|
Xia J, Gill EE and Hancock RE:
NetworkAnalyst for statistical, visual and network-based
meta-analysis of gene expression data. Nat Protoc. 10:823–844.
2015. View Article : Google Scholar : PubMed/NCBI
|
|
52
|
Wang S, Sun H, Ma J, Zang C, Wang C, Wang
J, Tang Q, Meyer CA, Zhang Y and Liu XS: Target analysis by
integration of transcriptome and ChIP-seq data with BETA. Nat
Protoc. 8:2502–2515. 2013. View Article : Google Scholar : PubMed/NCBI
|
|
53
|
Yoshikawa A, Imagawa A, Nakata S, Fukui K,
Kuroda Y, Miyata Y, Sato Y, Hanafusa T, Matsuoka TA, Kaneto H, et
al: Interferon stimulated gene 15 has an anti-apoptotic effect on
MIN6 cells. Endocr J. 61:883–890. 2014. View Article : Google Scholar : PubMed/NCBI
|
|
54
|
Rees SD, Britten AC, Bellary S, O'Hare JP,
Kumar S, Barnett AH and Kelly MA: The promoter polymorphism −232C/G
of the PCK1 gene is associated with type 2 diabetes in a
UK-resident South Asian population. BMC Med Genet. 10:832009.
View Article : Google Scholar : PubMed/NCBI
|
|
55
|
Gustavsson N and Han W: Calcium-sensing
beyond neurotransmitters: Functions of synaptotagmins in
neuroendocrine and endocrine secretion. Biosci Rep. 29:245–259.
2009. View Article : Google Scholar : PubMed/NCBI
|
|
56
|
Marshall C, Hitman GA, Partridge CJ, Clark
A, Ma H, Shearer TR and Turner MD: Evidence that an isoform of
calpain-10 is a regulator of exocytosis in pancreatic beta-cells.
Mol Endocrinol. 19:213–224. 2005. View Article : Google Scholar : PubMed/NCBI
|
|
57
|
Rajpathak SN, He M, Sun Q, Kaplan RC,
Muzumdar R, Rohan TE, Gunter MJ, Pollak M, Kim M, Pessin JE, et al:
Insulin-like growth factor axis and risk of type 2 diabetes in
women. Diabetes. 61:2248–2254. 2012. View Article : Google Scholar : PubMed/NCBI
|
|
58
|
Drogan D, Schulze MB, Boeing H and Pischon
T: Insulin-like growth factor 1 and insulin-like growth
factor-binding protein 3 in relation to the risk of type 2 diabetes
mellitus: Results from the EPIC-Potsdam study. Am J Epidemiol.
183:553–560. 2016. View Article : Google Scholar : PubMed/NCBI
|
|
59
|
Wang Y, Katayama A, Terami T, Han X,
Nunoue T, Zhang D, Teshigawara S, Eguchi J, Nakatsuka A, Murakami
K, et al: Translocase of inner mitochondrial membrane 44 alters the
mitochondrial fusion and fission dynamics and protects from type 2
diabetes. Metabolism. 64:677–688. 2015. View Article : Google Scholar : PubMed/NCBI
|
|
60
|
Venkatesan B, Valente AJ, Das NA,
Carpenter AJ, Yoshida T, Delafontaine JL, Siebenlist U and
Chandrasekar B: CIKS (Act1 or TRAF3IP2) mediates high
glucose-induced endothelial dysfunction. Cell Signal. 25:359–371.
2013. View Article : Google Scholar : PubMed/NCBI
|
|
61
|
Bergholdt R, Brorsson C, Palleja A,
Berchtold LA, Fløyel T, Bang-Berthelsen CH, Frederiksen KS, Jensen
LJ, Størling J and Pociot F: Identification of novel type 1
diabetes candidate genes by integrating genome-wide association
data, protein-protein interactions, and human pancreatic islet gene
expression. Diabetes. 61:954–962. 2012. View Article : Google Scholar : PubMed/NCBI
|
|
62
|
Kokkola T, Suuronen T, Molnár F, Määttä J,
Salminen A, Jarho EM and Lahtela-Kakkonen M: AROS has a
context-dependent effect on SIRT1. FEBS Lett. 588:1523–1528. 2014.
View Article : Google Scholar : PubMed/NCBI
|
|
63
|
Haigis MC and Sinclair DA: Mammalian
sirtuins: Biological insights and disease relevance. Annu Rev
Pathol. 5:253–295. 2010. View Article : Google Scholar : PubMed/NCBI
|
|
64
|
Zhou CH, Zhang MX, Zhou SS, Li H, Gao J,
Du L and Yin XX: SIRT1 attenuates neuropathic pain by epigenetic
regulation of mGluR1/5 expressions in type 2 diabetic rats. Pain.
158:130–139. 2017. View Article : Google Scholar : PubMed/NCBI
|
|
65
|
Ortega FJ, Pueyo N, Moreno-Navarrete JM,
Sabater M, Rodriguez-Hermosa JI, Ricart W, Tinahones FJ and
Fernandez-Real JM: The lung innate immune gene surfactant protein-D
is expressed in adipose tissue and linked to obesity status. Int J
Obes (Lond) (2005). 37:1532–1538. 2013. View Article : Google Scholar
|
|
66
|
Crook M: Type 2 diabetes mellitus: A
disease of the innate immune system? An update. Diabet Med.
21:203–207. 2004. View Article : Google Scholar : PubMed/NCBI
|
|
67
|
Yang W, Li Y, Wang JY, Han R and Wang L:
Circulating levels of adipose tissue-derived inflammatory factors
in elderly diabetes patients with carotid atherosclerosis: A
retrospective study. Cardiovasc Diabetol. 17:752018. View Article : Google Scholar : PubMed/NCBI
|
|
68
|
Prattichizzo F, De Nigris V, Spiga R,
Mancuso E, La Sala L, Antonicelli R, Testa R, Procopio AD, Olivieri
F and Ceriello A: Inflammageing and metaflammation: The yin and
yang of type 2 diabetes. Ageing Res Rev. 41:1–17. 2018. View Article : Google Scholar : PubMed/NCBI
|
|
69
|
Naidoo V, Naidoo M and Ghai M: Cell- and
tissue-specific epigenetic changes associated with chronic
inflammation in insulin resistance and type 2 diabetes mellitus.
Scand J Immunol. 88:e127232018. View Article : Google Scholar : PubMed/NCBI
|
|
70
|
Ehses JA, Perren A, Eppler E, Ribaux P,
Pospisilik JA, Maor-Cahn R, Gueripel X, Ellingsgaard H, Schneider
MK, Biollaz G, et al: Increased number of islet-associated
macrophages in type 2 diabetes. Diabetes. 56:2356–2370. 2007.
View Article : Google Scholar : PubMed/NCBI
|
|
71
|
Böni-Schnetzler M, Thorne J, Parnaud G,
Marselli L, Ehses JA, Kerr-Conte J, Pattou F, Halban PA, Weir GC
and Donath MY: Increased interleukin (IL)-1beta messenger
ribonucleic acid expression in beta -cells of individuals with type
2 diabetes and regulation of IL-1beta in human islets by glucose
and autostimulation. J Clin Endocrinol Metab. 93:4065–4074. 2008.
View Article : Google Scholar : PubMed/NCBI
|
|
72
|
Donath MY, Böni-Schnetzler M, Ellingsgaard
H and Ehses JA: Islet inflammation impairs the pancreatic beta-cell
in type 2 diabetes. Physiology (Bethesda). 24:325–331.
2009.PubMed/NCBI
|
|
73
|
Marchetti P, Lupi R, Del Guerra S,
Bugliani M, D'Aleo V, Occhipinti M, Boggi U, Marselli L and Masini
M: Goals of treatment for type 2 diabetes: Beta-cell preservation
for glycemic control. Diabetes Care. 32 (Suppl 2):S178–S183. 2009.
View Article : Google Scholar : PubMed/NCBI
|
|
74
|
Cnop M: Fatty acids and glucolipotoxicity
in the pathogenesis of Type 2 diabetes. Biochem Soc Trans.
36:348–352. 2008. View Article : Google Scholar : PubMed/NCBI
|
|
75
|
Saltiel AR and Kahn CR: Insulin signalling
and the regulation of glucose and lipid metabolism. Nature.
414:799–806. 2001. View Article : Google Scholar : PubMed/NCBI
|
|
76
|
Wajchenberg BL: beta-cell failure in
diabetes and preservation by clinical treatment. Endocr Rev.
28:187–218. 2007. View Article : Google Scholar : PubMed/NCBI
|
|
77
|
Takahashi E, Unoki-Kubota H, Shimizu Y,
Okamura T, Iwata W, Kajio H, Yamamoto-Honda R, Shiga T, Yamashita
S, Tobe K, et al: Proteomic analysis of serum biomarkers for
prediabetes using the Long-Evans Agouti rat, a spontaneous animal
model of type 2 diabetes mellitus. J Diabetes Investig. 8:661–671.
2017. View Article : Google Scholar : PubMed/NCBI
|
|
78
|
Hart LM, Fritsche A, Nijpels G, van
Leeuwen N, Donnelly LA, Dekker JM, Alssema M, Fadista J, Carlotti
F, Gjesing AP, et al: The CTRB1/2 locus affects diabetes
susceptibility and treatment via the incretin pathway. Diabetes.
62:3275–3281. 2013. View Article : Google Scholar : PubMed/NCBI
|
|
79
|
Xue M and Jackson CJ: Activated protein C
and its potential applications in prevention of islet β-cell damage
and diabetes. Vitam Horm. 95:323–363. 2014. View Article : Google Scholar : PubMed/NCBI
|
|
80
|
Matsumoto K, Yano Y, Gabazza EC, Araki R,
Bruno NE, Suematsu M, Akatsuka H, Katsuki A, Taguchi O, Adachi Y,
et al: Inverse correlation between activated protein C generation
and carotid atherosclerosis in Type 2 diabetic patients. Diabet
Med. 24:1322–1328. 2007. View Article : Google Scholar : PubMed/NCBI
|
|
81
|
Wang JY, Lu Q, Tao Y, Jiang YR and Jonas
JB: Intraocular expression of thymosin β4 in proliferative diabetic
retinopathy. Acta Ophthalmol. 89:e396–e403. 2011. View Article : Google Scholar : PubMed/NCBI
|
|
82
|
Sidarala V and Kowluru A: The regulatory
roles of mitogen-activated protein kinase (MAPK) pathways in health
and diabetes: Lessons learned from the pancreatic β-cell. Recent
Pat Endocr Metab Immune Drug Discov. 10:76–84. 2017. View Article : Google Scholar : PubMed/NCBI
|
|
83
|
Pang Y, Zhu H, Xu J, Yang L, Liu L and Li
J: β-arrestin-2 is involved in irisin induced glucose metabolism in
type 2 diabetes via p38 MAPK signaling. Exp Cell Res. 360:199–204.
2017. View Article : Google Scholar : PubMed/NCBI
|
|
84
|
Stewart AF, Hussain MA, García-Ocaña A,
Vasavada RC, Bhushan A, Bernal-Mizrachi E and Kulkarni RN: Human
β-cell proliferation and intracellular signaling: Part 3. Diabetes.
64:1872–1885. 2015. View Article : Google Scholar : PubMed/NCBI
|
|
85
|
Fraenkel M, Ketzinel-Gilad M, Ariav Y,
Pappo O, Karaca M, Castel J, Berthault MF, Magnan C, Cerasi E,
Kaiser N, et al: mTOR inhibition by rapamycin prevents beta-cell
adaptation to hyperglycemia and exacerbates the metabolic state in
type 2 diabetes. Diabetes. 57:945–957. 2008. View Article : Google Scholar : PubMed/NCBI
|
|
86
|
Baeder WL, Sredy J, Sehgal SN, Chang JY
and Adams LM: Rapamycin prevents the onset of insulin-dependent
diabetes mellitus (IDDM) in NOD mice. Clin Exp Immunol. 89:174–178.
1992. View Article : Google Scholar : PubMed/NCBI
|
|
87
|
Zhang CL, Katoh M, Shibasaki T, Minami K,
Sunaga Y, Takahashi H, Yokoi N, Iwasaki M, Miki T and Seino S: The
cAMP sensor Epac2 is a direct target of antidiabetic sulfonylurea
drugs. Science. 325:607–610. 2009. View Article : Google Scholar : PubMed/NCBI
|
|
88
|
Sabbatini ME, Chen X, Ernst SA and
Williams JA: Rap1 activation plays a regulatory role in pancreatic
amylase secretion. J Biol Chem. 283:23884–23894. 2008. View Article : Google Scholar : PubMed/NCBI
|
|
89
|
Manyes L, Arribas M, Gomez C, Calzada N,
Fernandez-Medarde A and Santos E: Transcriptional profiling reveals
functional links between RasGrf1 and Pttg1 in pancreatic beta
cells. BMC Genomics. 15:10192014. View Article : Google Scholar : PubMed/NCBI
|
|
90
|
Hoffmann A and Spengler D: Transient
neonatal diabetes mellitus gene Zac1 impairs insulin secretion in
mice through Rasgrf1. Mol Cell Biol. 32:2549–2560. 2012. View Article : Google Scholar : PubMed/NCBI
|
|
91
|
Yang Y, Fu Q, Wang X, Liu Y, Zeng Q, Li Y,
Gao S, Bao L, Liu S, Gao D, et al: Comparative transcriptome
analysis of the swimbladder reveals expression signatures in
response to low oxygen stress in channel catfish, Ictalurus
punctatus. Physiol Genomics. 50:636–647. 2018. View Article : Google Scholar : PubMed/NCBI
|
|
92
|
Dong Q, Ginsberg HN and Erlanger BF:
Overexpression of the A1 adenosine receptor in adipose tissue
protects mice from obesity-related insulin resistance. Diabetes
Obes Metab. 3:360–366. 2001. View Article : Google Scholar : PubMed/NCBI
|
|
93
|
Rampersaud E, Damcott CM, Fu M, Shen H,
McArdle P, Shi X, Shelton J, Yin J, Chang YP, Ott SH, et al:
Identification of novel candidate genes for type 2 diabetes from a
genome-wide association scan in the Old Order Amish: Evidence for
replication from diabetes-related quantitative traits and from
independent populations. Diabetes. 56:3053–3062. 2007. View Article : Google Scholar : PubMed/NCBI
|
|
94
|
Straub SG and Sharp GW: Glucose-stimulated
signaling pathways in biphasic insulin secretion. Diabetes Metab
Res Rev. 18:451–463. 2002. View Article : Google Scholar : PubMed/NCBI
|
|
95
|
Ma X, Lu C, Lv C, Wu C and Wang Q: The
expression of miR-192 and its significance in diabetic nephropathy
patients with different urine albumin creatinine ratio. J Diabetes
Res. 2016:67894022016. View Article : Google Scholar : PubMed/NCBI
|
|
96
|
Wu C, Chen X, Shu J and Lee CT:
Whole-genome expression analyses of type 2 diabetes in human skin
reveal altered immune function and burden of infection. Oncotarget.
8:34601–34609. 2017. View Article : Google Scholar : PubMed/NCBI
|
|
97
|
Zhu Z, Yin J, Li DC and Mao ZQ: Role of
microRNAs in the treatment of type 2 diabetes mellitus with
Roux-en-Y gastric bypass. Braz J Med Biol Res. 50:e58172017.
View Article : Google Scholar : PubMed/NCBI
|
|
98
|
Pivovarova O, Fisher E, Dudziak K,
Ilkavets I, Dooley S, Slominsky P, Limborska S, Weickert MO,
Spranger J, Fritsche A, et al: A polymorphism within the connective
tissue growth factor (CTGF) gene has no effect on non-invasive
markers of beta-cell area and risk of type 2 diabetes. Dis Markers.
31:241–246. 2011. View Article : Google Scholar : PubMed/NCBI
|
|
99
|
Salunkhe VA, Ofori JK, Gandasi NR, Salo
SA, Hansson S, Andersson ME, Wendt A, Barg S, Esguerra JLS and
Eliasson L: MiR-335 overexpression impairs insulin secretion
through defective priming of insulin vesicles. Physiol Rep. 52017.
PubMed/NCBI
|
|
100
|
Taneera J, Fadista J, Ahlqvist E, Atac D,
Ottosson-Laakso E, Wollheim CB and Groop L: Identification of novel
genes for glucose metabolism based upon expression pattern in human
islets and effect on insulin secretion and glycemia. Hum Mol Genet.
24:1945–1955. 2015. View Article : Google Scholar : PubMed/NCBI
|
|
101
|
Aso Y, Matsuura H, Momobayashi A, Inukai
Y, Sugawara N, Nakano T, Yamamoto R, Wakabayashi S, Takebayashi K
and Inukai T: Profound reduction in T-helper (Th) 1 lymphocytes in
peripheral blood from patients with concurrent type 1 diabetes and
Graves' disease. Endocr J. 53:377–385. 2006. View Article : Google Scholar : PubMed/NCBI
|
|
102
|
Voss M, Paterson J, Kelsall IR,
Martín-Granados C, Hastie CJ, Peggie MW and Cohen PT: Ppm1E is an
in cellulo AMP-activated protein kinase phosphatase. Cell Signal.
23:114–124. 2011. View Article : Google Scholar : PubMed/NCBI
|
|
103
|
Torsvik J, Johansson S, Johansen A, Ek J,
Minton J, Raeder H, Ellard S, Hattersley A, Pedersen O, Hansen T,
et al: Mutations in the VNTR of the carboxyl-ester lipase gene
(CEL) are a rare cause of monogenic diabetes. Hum Genet. 127:55–64.
2010. View Article : Google Scholar : PubMed/NCBI
|
|
104
|
Taneera J, Lang S, Sharma A, Fadista J,
Zhou Y, Ahlqvist E, Jonsson A, Lyssenko V, Vikman P, Hansson O, et
al: A systems genetics approach identifies genes and pathways for
type 2 diabetes in human islets. Cell Metab. 16:122–134. 2012.
View Article : Google Scholar : PubMed/NCBI
|
|
105
|
Anhê FF, Lellis-Santos C, Leite AR,
Hirabara SM, Boschero AC, Curi R, Anhê GF and Bordin S: Smad5
regulates Akt2 expression and insulin-induced glucose uptake in L6
myotubes. Mol Cell Endocrinol. 319:30–38. 2010. View Article : Google Scholar : PubMed/NCBI
|
|
106
|
Glauser DA and Schlegel W: The
FoxO/Bcl-6/cyclin D2 pathway mediates metabolic and growth factor
stimulation of proliferation in Min6 pancreatic beta-cells. J
Recept Signal Transduct Res. 29:293–298. 2009. View Article : Google Scholar : PubMed/NCBI
|
|
107
|
Rechsteiner MP, Floros X, Boehm BO,
Marselli L, Marchetti P, Stoffel M, Moch H and Spinas GA: Automated
assessment of β-cell area and density per islet and patient using
TMEM27 and BACE2 immunofluorescence staining in human pancreatic
β-cells. PLoS One. 9:e989322014. View Article : Google Scholar : PubMed/NCBI
|
|
108
|
Ikeda K, Emoto N, Matsuo M and Yokoyama M:
Molecular identification and characterization of a novel nuclear
protein whose expression is up-regulated in insulin-resistant
animals. J Biol Chem. 278:3514–3520. 2003. View Article : Google Scholar : PubMed/NCBI
|
|
109
|
Solimena M, Schulte AM, Marselli L,
Ehehalt F, Richter D, Kleeberg M, Mziaut H, Knoch KP, Parnis J,
Bugliani M, et al: Systems biology of the IMIDIA biobank from organ
donors and pancreatectomised patients defines a novel
transcriptomic signature of islets from individuals with type 2
diabetes. Diabetologia. 61:641–657. 2018. View Article : Google Scholar : PubMed/NCBI
|
|
110
|
Scott EM, Carter AM and Findlay JB: The
application of proteomics to diabetes. Diab Vasc Dis Res. 2:54–60.
2005. View Article : Google Scholar : PubMed/NCBI
|
|
111
|
Khan AR and Awan FR: Mining of protein
based biomarkers for type 2 diabetes mellitus. Pak J Pharm Sci.
25:889–901. 2012.PubMed/NCBI
|
|
112
|
Okada S, List EO, Sankaran S and Kopchick
JJ: Plasma protein biomarkers correlated with the development of
diet-induced Type 2 diabetes in mice. Clin Proteomics. 6:6–17.
2010. View Article : Google Scholar : PubMed/NCBI
|
|
113
|
Bustin SA and Mueller R: Real-time reverse
transcription PCR (qRT-PCR) and its potential use in clinical
diagnosis. Clin Sci (Lond). 109:365–379. 2005. View Article : Google Scholar : PubMed/NCBI
|
|
114
|
Guénin S, Mauriat M, Pelloux J, Van
Wuytswinkel O, Bellini C and Gutierrez L: Normalization of qRT-PCR
data: The necessity of adopting a systematic, experimental
conditions-specific, validation of references. J Exp Bot.
60:487–493. 2009. View Article : Google Scholar : PubMed/NCBI
|
|
115
|
Kim B: Western Blot Techniques. Methods
Mol Biol. 1606:133–139. 2017. View Article : Google Scholar : PubMed/NCBI
|
|
116
|
Ule J, Hwang HW and Darnell RB: The future
of cross-linking and immunoprecipitation (CLIP). Cold Spring Harb
Perspect Biol. 10:a0322432018. View Article : Google Scholar : PubMed/NCBI
|