Introduction
Pancreatic adenocarcinoma (PAAD) is a leading cause
of cancer deaths worldwide. The prognosis of PAAD is poor, with the
number of deaths almost matching the number of cases (1). Surgical resection is currently the
only potentially curative option for PAAD. However, only 15–20% of
patients present with a resectable tumor, and the 5-year survival
rate following resection is only 4–5% (2,3).
Moreover, the risk of local or distant recurrence in the first two
years following resection is as high as 80% (4). Therefore, it is necessary to evaluate
the patient survival rate following resection, yet current
prediction methods are inadequate.
AMP-activated protein kinase family member 5
(ARK5) is a member of the AMPK family that mediates the
migration of human PAAD cells (5).
ARK5 activation is induced by Akt-dependent Ser600 phosphorylation
(5). The Akt pathway is one of the
key pathways that can mediate tumor progression by promoting the
proliferation, survival and metastasis of cancer cells (6). Moreover, Akt signaling accelerates
the progression of malignant tumors such as PAAD, breast cancer,
colorectal cancer, squamous cell carcinoma and ovarian cancer
(7–10). Moreover, tumor tissues often
experience nutrient deficiency in their microenvironment (11), and ARK5 is the substrate of Akt
during nutrient starvation (5,12).
ARK5 has been reported to promote tumor cell survival
through Akt (13,14).
The expression of the ARK5 gene is associated
with PAAD metastasis (15). In
hepatocellular carcinoma, breast cancer and colorectal cancer,
patients with low expression levels of ARK5 display improved
overall survival times compared with the high expression group
(16–19). High ARK5 expression in tumor
tissue is associated with the metastatic potential of cancer,
clinical stage and patient survival time (16,20,21).
Furthermore, a previous study demonstrated that ARK5 plays an
essential role in cancer progression and chemotherapy resistance by
inducing epithelial-mesenchymal transition (22). Therefore, it may be hypothesized
that ARK5 is associated with PAAD prognosis and might play
an active role in the progression of PAAD.
The aim of the present study was to analyze the
expression levels of ARK5 using bioinformatics analysis of
The Cancer Genome Atlas (TCGA) datasets. ARK5 target genes
were identified, and their role in PAAD was examined. Lastly, in
order to confirm whether ARK5 could represent an indicator
of PAAD prognosis, ARK5 protein expression levels were determined
in tumor samples from patients with PAAD and matched, normal,
adjacent tissue.
Materials and methods
TCGA database and bioinformatics
analysis
ARK5 expression in PAAD samples from
TCGA
TCGA (https://cancergenome.nih.gov/abouttcga/aboutdata/datalevelstypes)
is a central repository of multidimensional experimental cancer
data, comprising data pertaining to >30 types of human tumor.
The expression profile of ARK5 was obtained from different
types of human cancer and corresponding non-cancerous tissue
(Table I), including PAAD, and
were analyzed using the Gene Expression Profiling Interactive
Analysis (GEPIA) tool (v2.2019; http://gepia.cancer-pku.cn/) (23). GEPIA utilized the UCSC Xena
(24) recomputed data of TCGA, and
consulted with medical experts to determine the most appropriate
sample grouping for tumor-normal comparisons. The datasets are
stored in a MySQL relational database (version 5.7.17). Entering
ARK5 in the ‘General’ field and clicking the ‘GoPIA!’: GEPIA
generated the expression profile of ARK5.
 | Table I.TCGA Datasets Evaluated (data from
TCGA datasets). |
Table I.
TCGA Datasets Evaluated (data from
TCGA datasets).
| Types of
cancer | TCGA dataset | No. of cancer
tissues | No. of normal
tissues |
|---|
| Adrenocortical
carcinoma | TCGA-ACC | 77 | 128 |
| Bladder urothelial
carcinoma | TCGA-BLCA | 404 | 28 |
| Breast invasive
carcinoma | TCGA-BRCA | 1,085 | 291 |
| Cervical squamous
cell carcinoma and endocervical adenocarcinoma | TCGA-CESC | 306 | 13 |
| Cholangio
carcinoma | TCGA-CHOL | 36 | 9 |
| Colon
adenocarcinoma | TCGA-COAD | 275 | 349 |
| Lymphoid neoplasm
diffuse large B-cell | TCGA-DLBC | 47 | 337 |
| Lymphoma Esophageal
carcinoma | TCGA-ESCA | 182 | 286 |
| Glioblastoma
multiforme | TCGA-GBM | 163 | 207 |
| Head and neck
squamous cell carcinoma | TCGA-HNSC | 519 | 44 |
| Kidney
chromophobe | TCGA-KICH | 66 | 53 |
| Kidney renal clear
cell carcinoma | TCGA-KIRC | 523 | 100 |
| Kidney renal
papillary cell carcinoma | TCGA-KIRP | 286 | 60 |
| Acute myeloid
leukemia | TCGA-LAML | 173 | 70 |
| Brain lower grade
glioma | TCGA-LGG | 518 | 207 |
| Liver
hepatocellular carcinoma | TCGA-LIHC | 369 | 160 |
| Lung
adenocarcinoma | TCGA-LUAD | 483 | 347 |
| Lung squamous cell
carcinoma | TCGA-LUSC | 486 | 338 |
| Mesothelioma | TCGA-MESO | 87 | 0 |
| Ovarian serous
cystadenocarcinoma | TCGA-OV | 426 | 88 |
| Pancreatic
adenocarcinoma | TCGA-PAAD | 179 | 171 |
| Pheochromocytoma
and paraganglioma | TCGA-PCPG | 182 | 3 |
| Prostate
adenocarcinoma | TCGA-PRAD | 492 | 152 |
| Rectum
adenocarcinoma | TCGA-PEAD | 92 | 318 |
| Sarcoma | TCGA-SARC | 262 | 2 |
| Skin cutaneous
melanoma | TCGA-SKCM | 461 | 558 |
| Stomach
adenocarcinoma | TCGA-STAD | 408 | 211 |
| Testicular germ
cell tumors | TCGA-TGCT | 137 | 165 |
| Thyroid
carcinoma | TCGA-THCA | 512 | 337 |
| Thymoma | TCGA-THYM | 118 | 339 |
| Uterine corpus
endometrial carcinoma | TCGA-UCEC | 174 | 91 |
| Uterine
carcinosarcoma | TCGA-UCS | 57 | 78 |
Prediction and screening of target
genes
Target genes (gene with a homology score >0.5 for
ARK5) (25) were predicted
by entering ‘ARK5’ into four databases; STRING v11.0
(https://string-db.org/), InBioMap v2019
(https://www.intomics.com/inbio/map),
BioGRID v3.5.188 (https://thebiogrid.org/) and IntAct v4.2.15
(https://www.ebi.ac.uk/intact/). To
improve the accuracy of prediction results, Venn diagrams were
constructed and target genes overlapping between at least two of
the four databases were selected for further analysis (http://bioinformatics.psb.ugent.be/webtools/Venn/).
Enrichment analysis of overlapping
target genes
Enrichment analysis of overlapping target genes in
ARK5 signaling was performed using Metascape v2019
(http://metascape.org/gp/index.html)
(26). Gene Ontology (GO)
Biological Processes, Kyoto Encyclopedia of Genes and Genomes
(KEGG) Pathway and Reactome gene sets were used to determine the
functions associated with the target genes.
Protein-protein interaction (PPI)
network analysis of overlapping target genes
PPI analysis of ARK5 overlapping target genes
was performed using Metascape and the node score was calculated and
obtained in Metascape, with a node score cut-off of 1. Molecular
Complex Detection (MCODE) algorithm, a module in Cytoscape v1.1
(27), was used to identify
densely connected network neighborhoods, each MCODE component was
labeled with a different color, and their biological significance
are characterized.
Prognostic significance of the chosen
node degree genes
Node genes were analyzed with the GEPIA tool to
compare their expression levels varied in PAAD and adjacent normal
tissues and whether these genes had any influence on the prognosis
of PAAD. The gene symbol or gene ID (Ensembl ID) of node genes were
entered in the ‘Expression DIY’ and ‘Survival Analysis’ fields
respectively, and PAAD selected in the ‘Dataset’ field. Clicking
the ‘Plot’ button caused GEPIA to present the gene expression box
plot and survival plot of ARK5 in PAAD respectively.
Validation experiments on PAAD clinical
samples
Patients and tissue collection
A PAAD tissue microarray (TMA) was obtained from the
Biochip Shanghai National Engineering Research Center. All
experimental procedures were approved by the Ethics Committee of
Taizhou Hospital, authorizing TMA sample collection at Taizhou
Hospital. The TMA included tumor tissue from 150 patients with PAAD
who had undergone resection between January 2004 and December 2013.
Of these, 112 included adjacent normal tissue. All patients signed
an informed consent form. Clinicopathological data for all 150
patients included age, sex, grade, T stage, N stage, M stage, TNM
stage, p53 expression and Ki67 expression. A total of 112 pairs of
tumor samples were used and included adjacent normal tissues when
analyzing the difference between cancer and normal tissues. In the
correlation analysis of cancer and clinical data, 150 tumor samples
were used, regardless of whether they contained adjacent normal
tissues or not.
Immunohistochemical staining
evaluation
PAAD tissue microarrays were immunohistochemically
stained with Immunohistochemical kit (EnVision™ FLEX+, cat. no.
K8002, Dako; Agilent Technologies, Inc.) using an Automated
Autostainer Link 48 system (Dako; Agilent Technologies, Inc.) by
The Biochip Shanghai National Engineering Research Center.
To evaluate ARK5 protein expression, two
pathologists scored the immunohistochemical staining using an
Aperio scanner (Aperio XT, Leica Microsystems GmbH, magnification,
×200); both were unaware of any clinical parameters. The
cytoplasmic/nuclear staining intensity and ARK5 protein positive
staining rate were determined using PAAD and corresponding
non-cancerous tissues. The cytoplasmic and nuclear staining were
scored separately. The staining intensity of each sample was given
a modified Remmele score (26)
that considers both the intensity and the percentage of cells
stained at each intensity (27,28).
The staining intensity scores were defined as follows: i) 0,
negative; ii) 1, weak; iii) 2, strong; iv) 3, very strong. The
positive staining rate scores were defined as follows: i) 0,
negative; ii) 1, 1–25%; iii) 2, 26–50%; iv) 3, 51–75%; and v) 4,
76–100%. After multiplying the staining intensity score by positive
staining rate score, patients were divided into low (<6) and
high (≥6) expression groups according to the resultant scores.
Statistical analysis
ARK5 expression in PAAD samples and adjacent normal
tissue was analyzed using χ2 tests and Fisher's exact
test. The association between ARK5 protein expression and
clinicopathological features was analyzed using a χ2
test or Fisher's exact test. A survival curve was constructed using
the Kaplan-Meier method, and the log-rank statistical test was used
for single-factor survival analysis. Statistical analysis was
conducted using SPSS version 18.0 (SPSS, Inc.). P<0.05 was
considered to indicate a statistically significant difference.
Results
TCGA database and bioinformatics
analysis
ARK5 expression in PAAD samples from
TCGA database
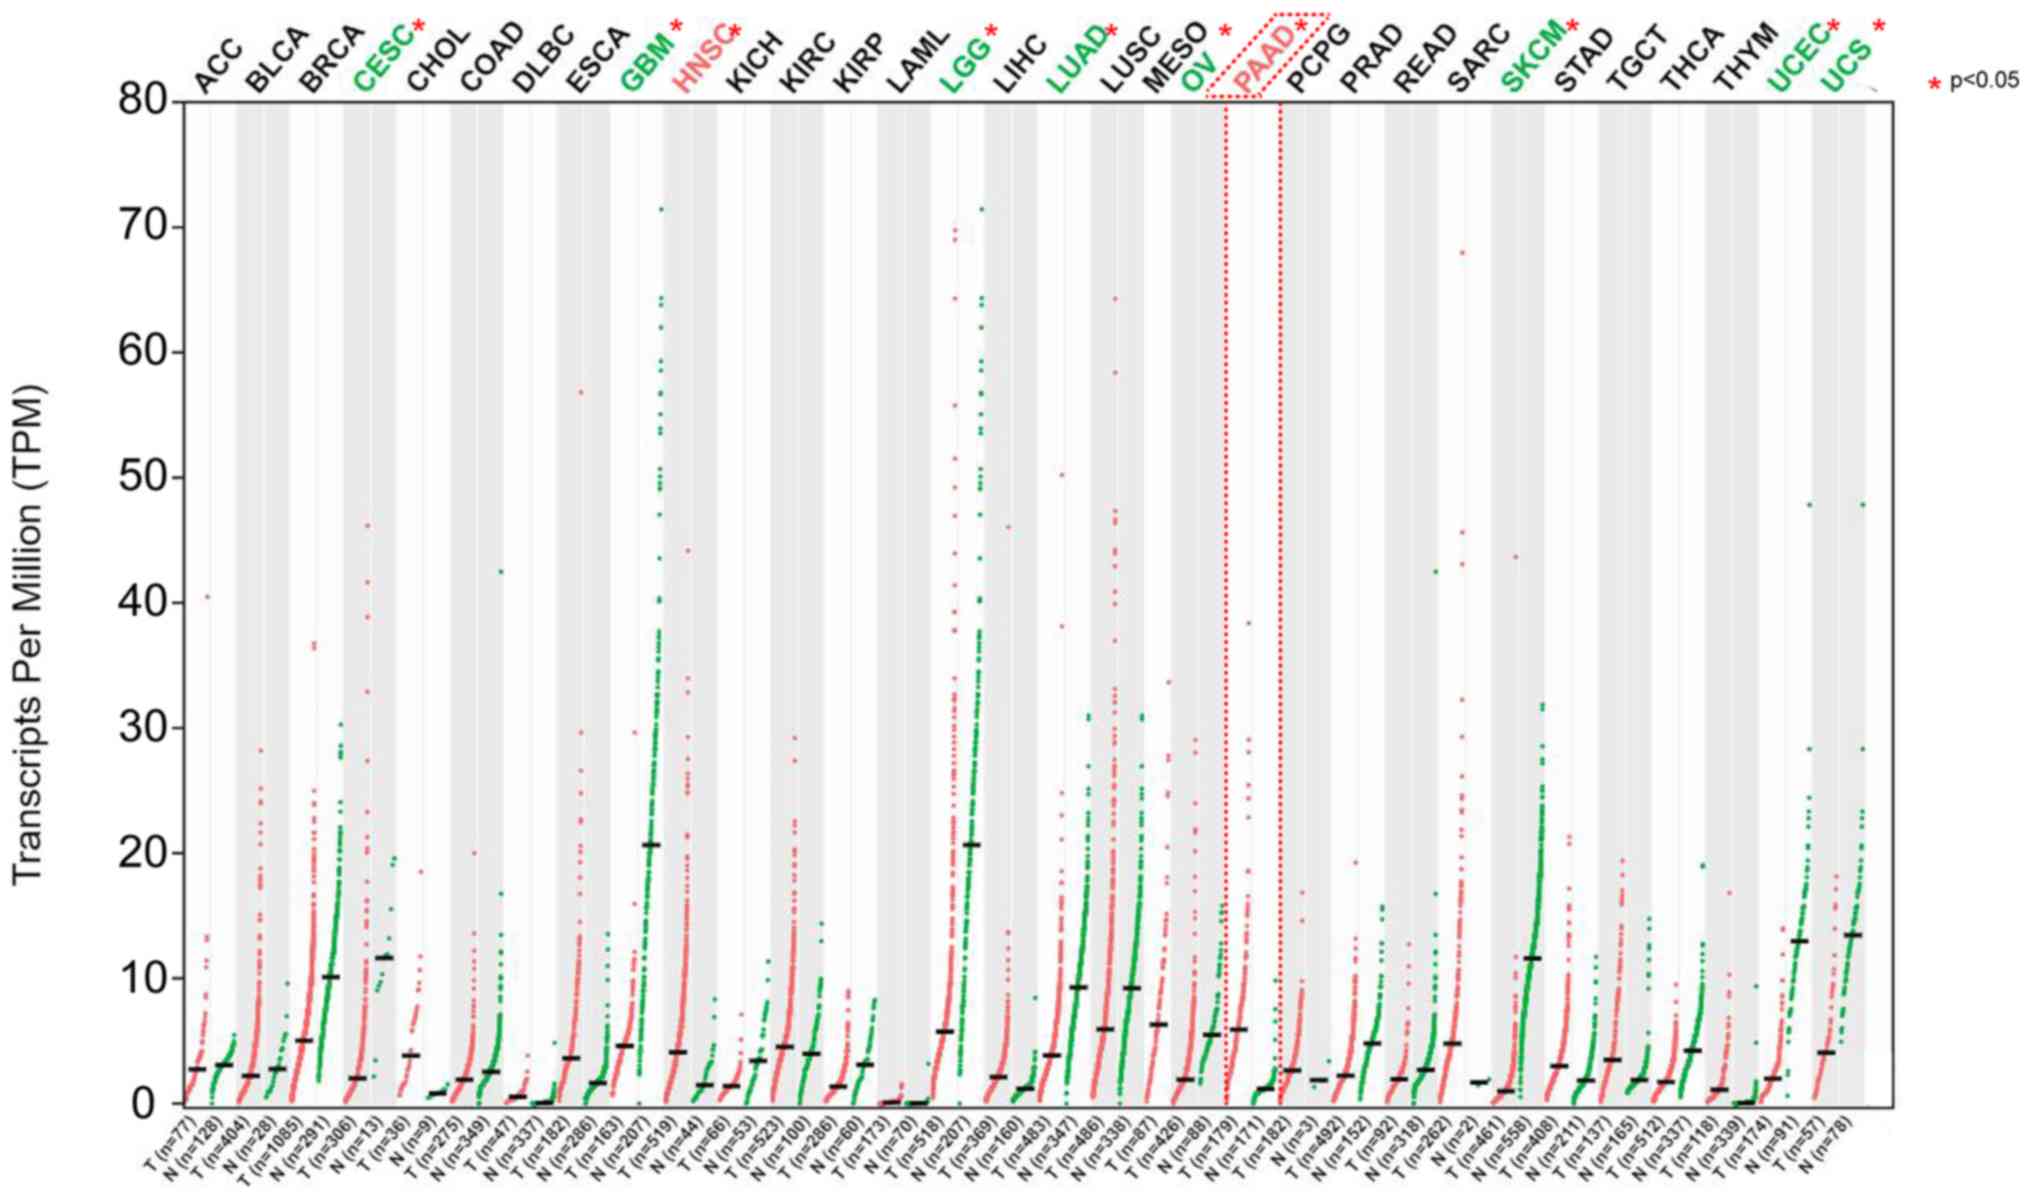
ARK5 was overexpressed in several types of
human cancer, including PAAD and head and neck squamous cell
carcinoma. Moreover, ARK5 was also expressed at low levels
in other tumors, such as cervical squamous cell carcinoma,
endocervical adenocarcinoma, glioblastoma multiforme, brain
low-grade glioma, lung adenocarcinoma, ovarian serous
cystadenocarcinoma, skin cutaneous melanoma, uterine corpus
endometrial carcinoma and uterine sarcoma (P<0.05). These
results indicated that ARK5 had different expression levels
in different tumors and is highly expressed in PAAD, in which it
may exist as an oncogene (Fig.
1).
Prediction and screening of target
genes
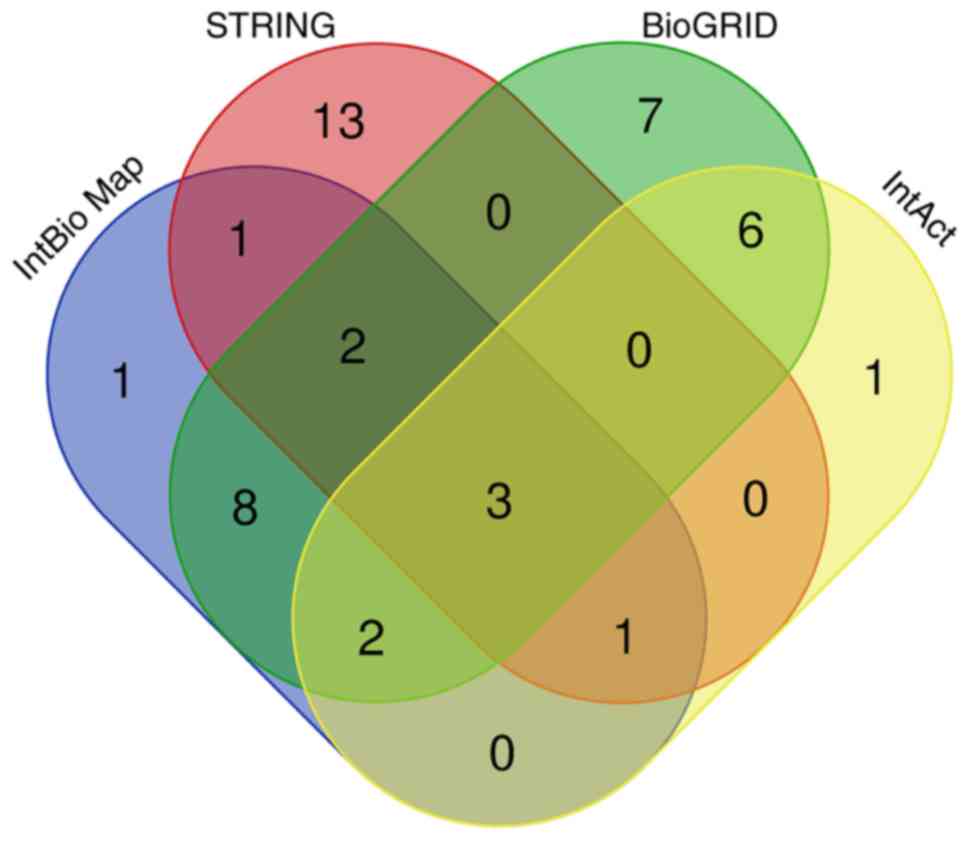
Using InBioMap, STRING, BioGRID, and IntAct, a total
of 18, 20, 28, and 13 ARK5 candidate target genes were
identified, respectively (Table
II). Moreover, 23 genes were shared between at least two of the
four databases and were therefore further selected as overlapping
target genes for ARK5. A Venn diagram illustrating the
overlap between the four databases is illustrated in Fig. 2.
| Table II.Pancreatic adenocarcinoma-associated
genes identified in The Cancer Genome Atlas using four databases
(data from TCGA datasets). |
Table II.
Pancreatic adenocarcinoma-associated
genes identified in The Cancer Genome Atlas using four databases
(data from TCGA datasets).
| Database | Gene name |
|---|
| InBio Map | BTRC, CDKN1A,
CUL1, FBXO25, FBXW11, LATS1, PLK1, PPP1CB, PPP1CC, PPP1R12A,
PPP1R12B, PPP1R12C, PRKAA1, SKP1, STK11, TP53, UBC, USP9X |
| STRING | AASS, ATM,
CASP6, CCNA2, CCND1, CCND2, CCND3, CCNE1, CDK2, CDK4, CDKN1A,
FBXW11, MDM2, MDM4, PPP1R12A, PPP1R12B, STK11, STRADA, TP53,
USP9X |
| BioGRID | APP, BTRC, CRYM,
CUL1, ELAVL1, FBXO25, FBXW11, FLT3, IGHA2, KIAA1429, KRT77, LATS1,
PLK1, PPP1CB, PPP1CC, PPP1R12A, PPP1R12B, PPP1R12C, PRKAA1,
PRKAR1A, PRPSAP1, S100A8, S100A9, SKP1, SRRM2, TNIP2, TP53,
USP9X |
| IntAct | BTRC, FBXW11,
FYN, IGHA2, LATS1, PRKAR1A, PRPSAP1, S100A8, S100A9, SRRM2, STK11,
TP53, USP9X |
Enrichment analysis of overlapping
target genes in ARK5 signaling pathways
Pathway enrichment analysis was performed to
determine the functions associated with the 23 target genes with
respect to biological processes (Table III). The target genes of
ARK5 participated in GO Biological Processes, such as ‘cell
cycle G2/M phase transition’, ‘regulation of circadian rhythm’,
‘negative regulation of cell cycle’, ‘intrinsic apoptotic signaling
pathway’, and ‘protein destabilization’ and in KEGG Pathways,
including ‘oxytocin signaling pathway’ and ‘FoxO signaling
pathway’, and Reactome gene sets including ‘Signaling by TGF-β
Receptor complex’.
| Table III.Pathway enrichment analysis of
overlapping target genes (data from TCGA datasets). |
Table III.
Pathway enrichment analysis of
overlapping target genes (data from TCGA datasets).
| A, GO biological
processes |
|---|
|
|---|
| Term | Description | Count | Frequency, % |
Log10(P) |
Log10(q) |
|---|
| GO:0044839 | Cell cycle G2/M
phase transition | 11 | 47.83 | −15.46 | −11.14 |
| GO:0042752 | Regulation of
circadian rhythm | 7 | 30.43 | −10.97 | −7.66 |
| GO:0045786 | Negative regulation
of cell cycle | 9 | 39.13 | −8.47 | −5.51 |
| GO:0097193 | Intrinsic apoptotic
signaling pathway | 6 | 26.09 | −6.63 | −3.91 |
| GO:0031648 | Protein
destabilization | 3 | 13.04 | −4.84 | −2.67 |
|
| B, KEGG
pathways |
|
| Term |
Description | Count | Frequency,
% |
Log10(P) |
Log10(q) |
|
| hsa04921 | Oxytocin signaling
pathway | 7 | 30.43 | −10.12 | −6.88 |
| hsa04068 | FoxO signaling
pathway | 5 | 21.74 | −6.85 | −4.08 |
|
| C, Reactome gene
sets |
| Term |
Description | Count | Frequency,
% |
Log10(P) |
Log10(q) |
|
| R-HSA-170834 | Signaling by
TGF-beta Receptor Complex | 3 | 13.04 | −4.35 | −2.24 |
Identifying node degree genes via PPI
network analyses of overlapping target genes
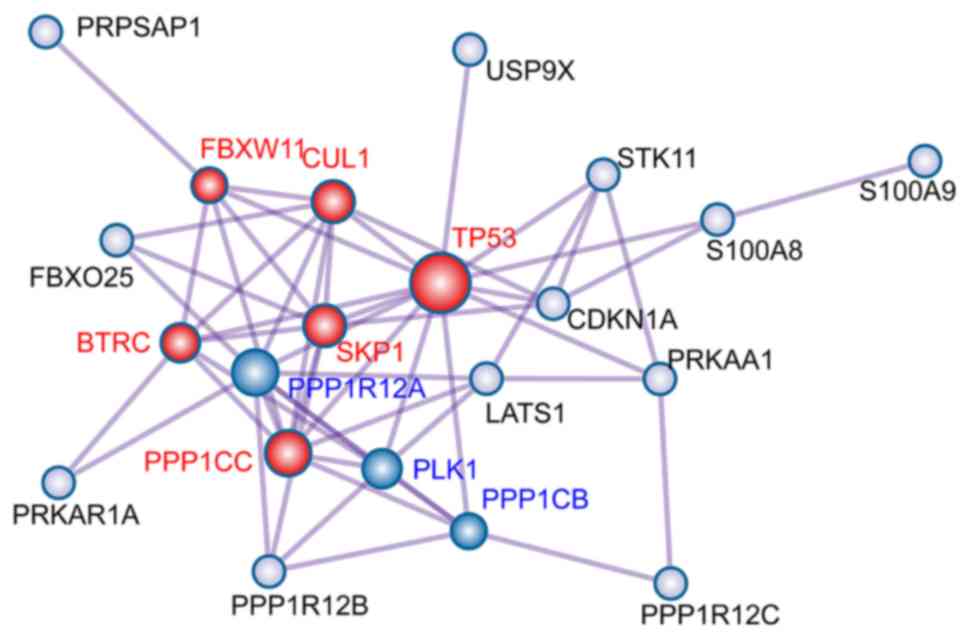
To explore the interaction between the 23
overlapping target genes, a PPI network was constructed using
Metascape (Fig. 3). The Molecular
Complex Detection (MCODE) algorithm was used to identify densely
connected network neighborhoods, each MCODE component is labeled
with a different color, and their biological significance are
characterized [Red MCODE: MAP3K8 (TPL2)-dependent MAPK1/3
activation; Ubiquitin E3 ligase (SKP1A, BTRC, CUL1); Ubiquitin E3
ligase (FBXW11, SKP1, CUL1). Blue MCODE: PID PLK1 PATHWAY;
Regulation of PLK1 Activity at G2/M Transition; G2/M Transition]. A
total of 9 node genes were identified, including polo-like kinase 1
(PLK1), protein phosphatase 1 catalytic subunit β
(PPP1CB), protein phosphatase 1 regulatory subunit 12A
(PPP1R12A), tumor protein 53 (TP53); cullin 1
(CUL1); F-box and WD repeat domain-containing 11
(FBXW11), S-phase kinase-associated protein 1 (SKP1),
β-transducin repeat-containing E3 ubiquitin protein ligase
(BTRC) and protein phosphatase 1 catalytic subunit γ
(PPP1CC).
Prognostic significance evaluation of
the nine node degree genes
The expression levels of the nine node genes were
analyzed using the GEPIA tool in PAAD tissue and corresponding
non-cancerous tissue. PLK1, PPP1CB, TP53, SKP1, CUL1 and
PPP1R12A expression levels were significantly increased in
PAAD tissue, compared with paired non-cancerous tissues (Fig. 4). To solve the imbalance between
the tumor and normal data which can cause inefficiency in various
differential analyses, the GEPIA tool downloaded the gene
expression data that are re-computed from raw RNA-Seq data by the
UCSC Xena (24) project based on a
uniform pipeline. The GEPIA tool uses input from medical experts to
determine the most appropriate sample grouping for tumor-normal
comparisons. The datasets are stored in a MySQL relational database
(version 5.7.17). In addition, the overall survival time of
patients with PAAD and high expression PLK1 or PPP1CB
was significantly reduced, compared with patients in the respective
low-expression groups (Fig.
5).
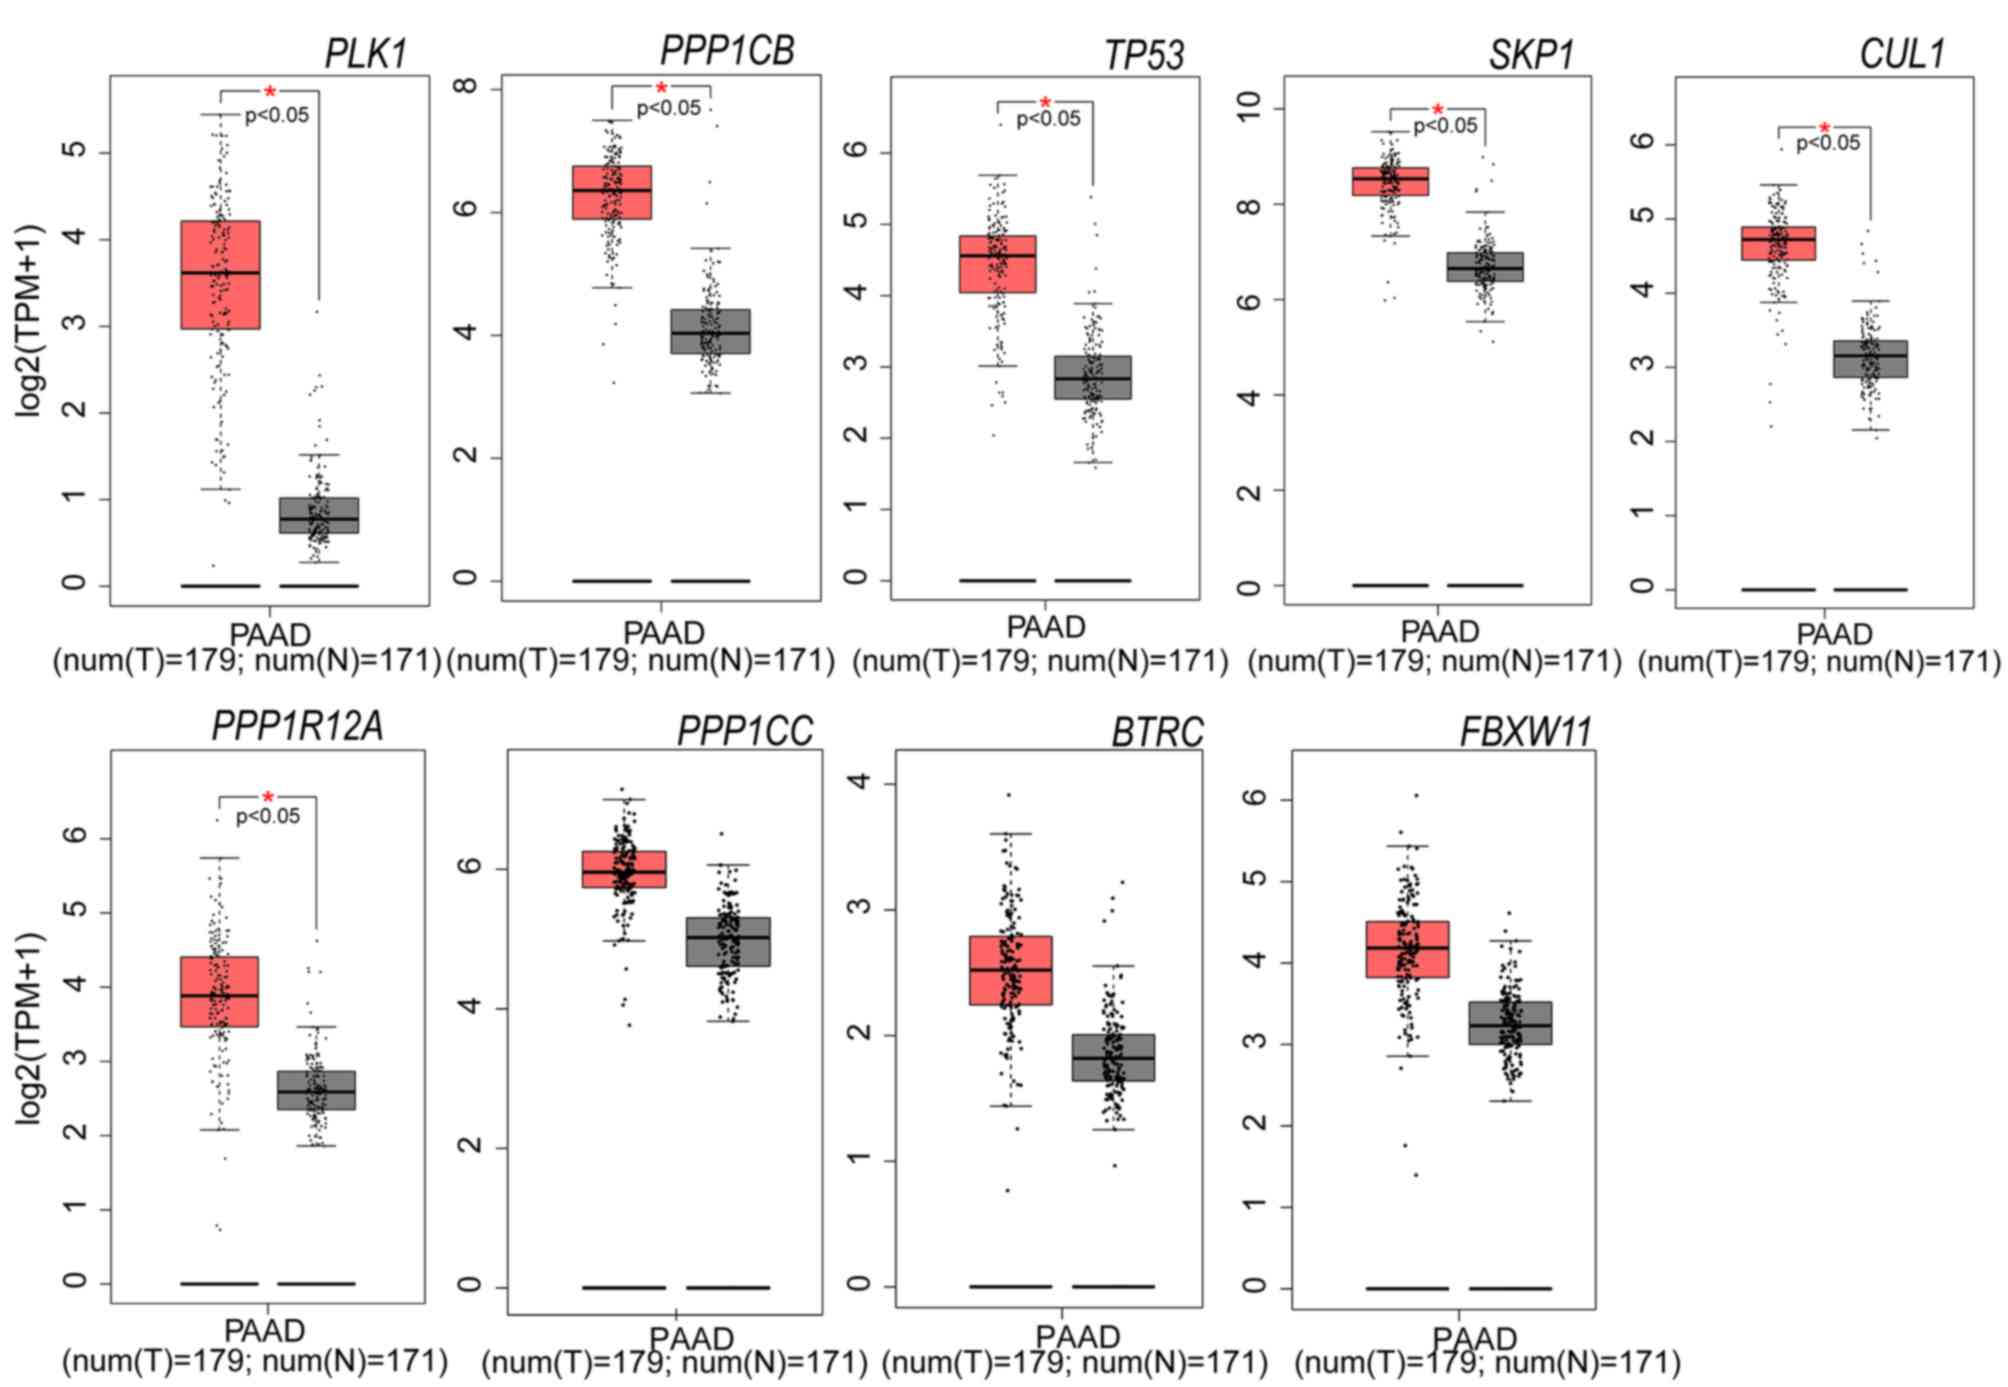 | Figure 4.Expression levels of nine selected
genes in PAAD tissues and adjacent non-tumor tissues (The data were
from TCGA datasets). Six of the nine genes are significantly
upregulated in PAAD tissue (n=179), compared with adjacent
non-tumor tissue (n=171). Red and grey represent tumor and normal
adjacent tissues, respectively. *P<0.05 vs. normal tissue. PAAD,
pancreatic adenocarcinoma; PLK1, polo-like kinase 1;
PPP1CB, protein phosphatase 1 catalytic subunit β;
PPP1R12A, protein phosphatase 1 regulatory subunit 12A,
TP53, tumor protein 53; CUL1, cullin 1;
FBXW11, F-box and WD repeat domain-containing 11
SKP1, S-phase kinase-associated protein 1; BTRC,
β-transducin repeat-containing E3 ubiquitin protein ligase;
PPP1CC, protein phosphatase 1 catalytic subunit γ. |
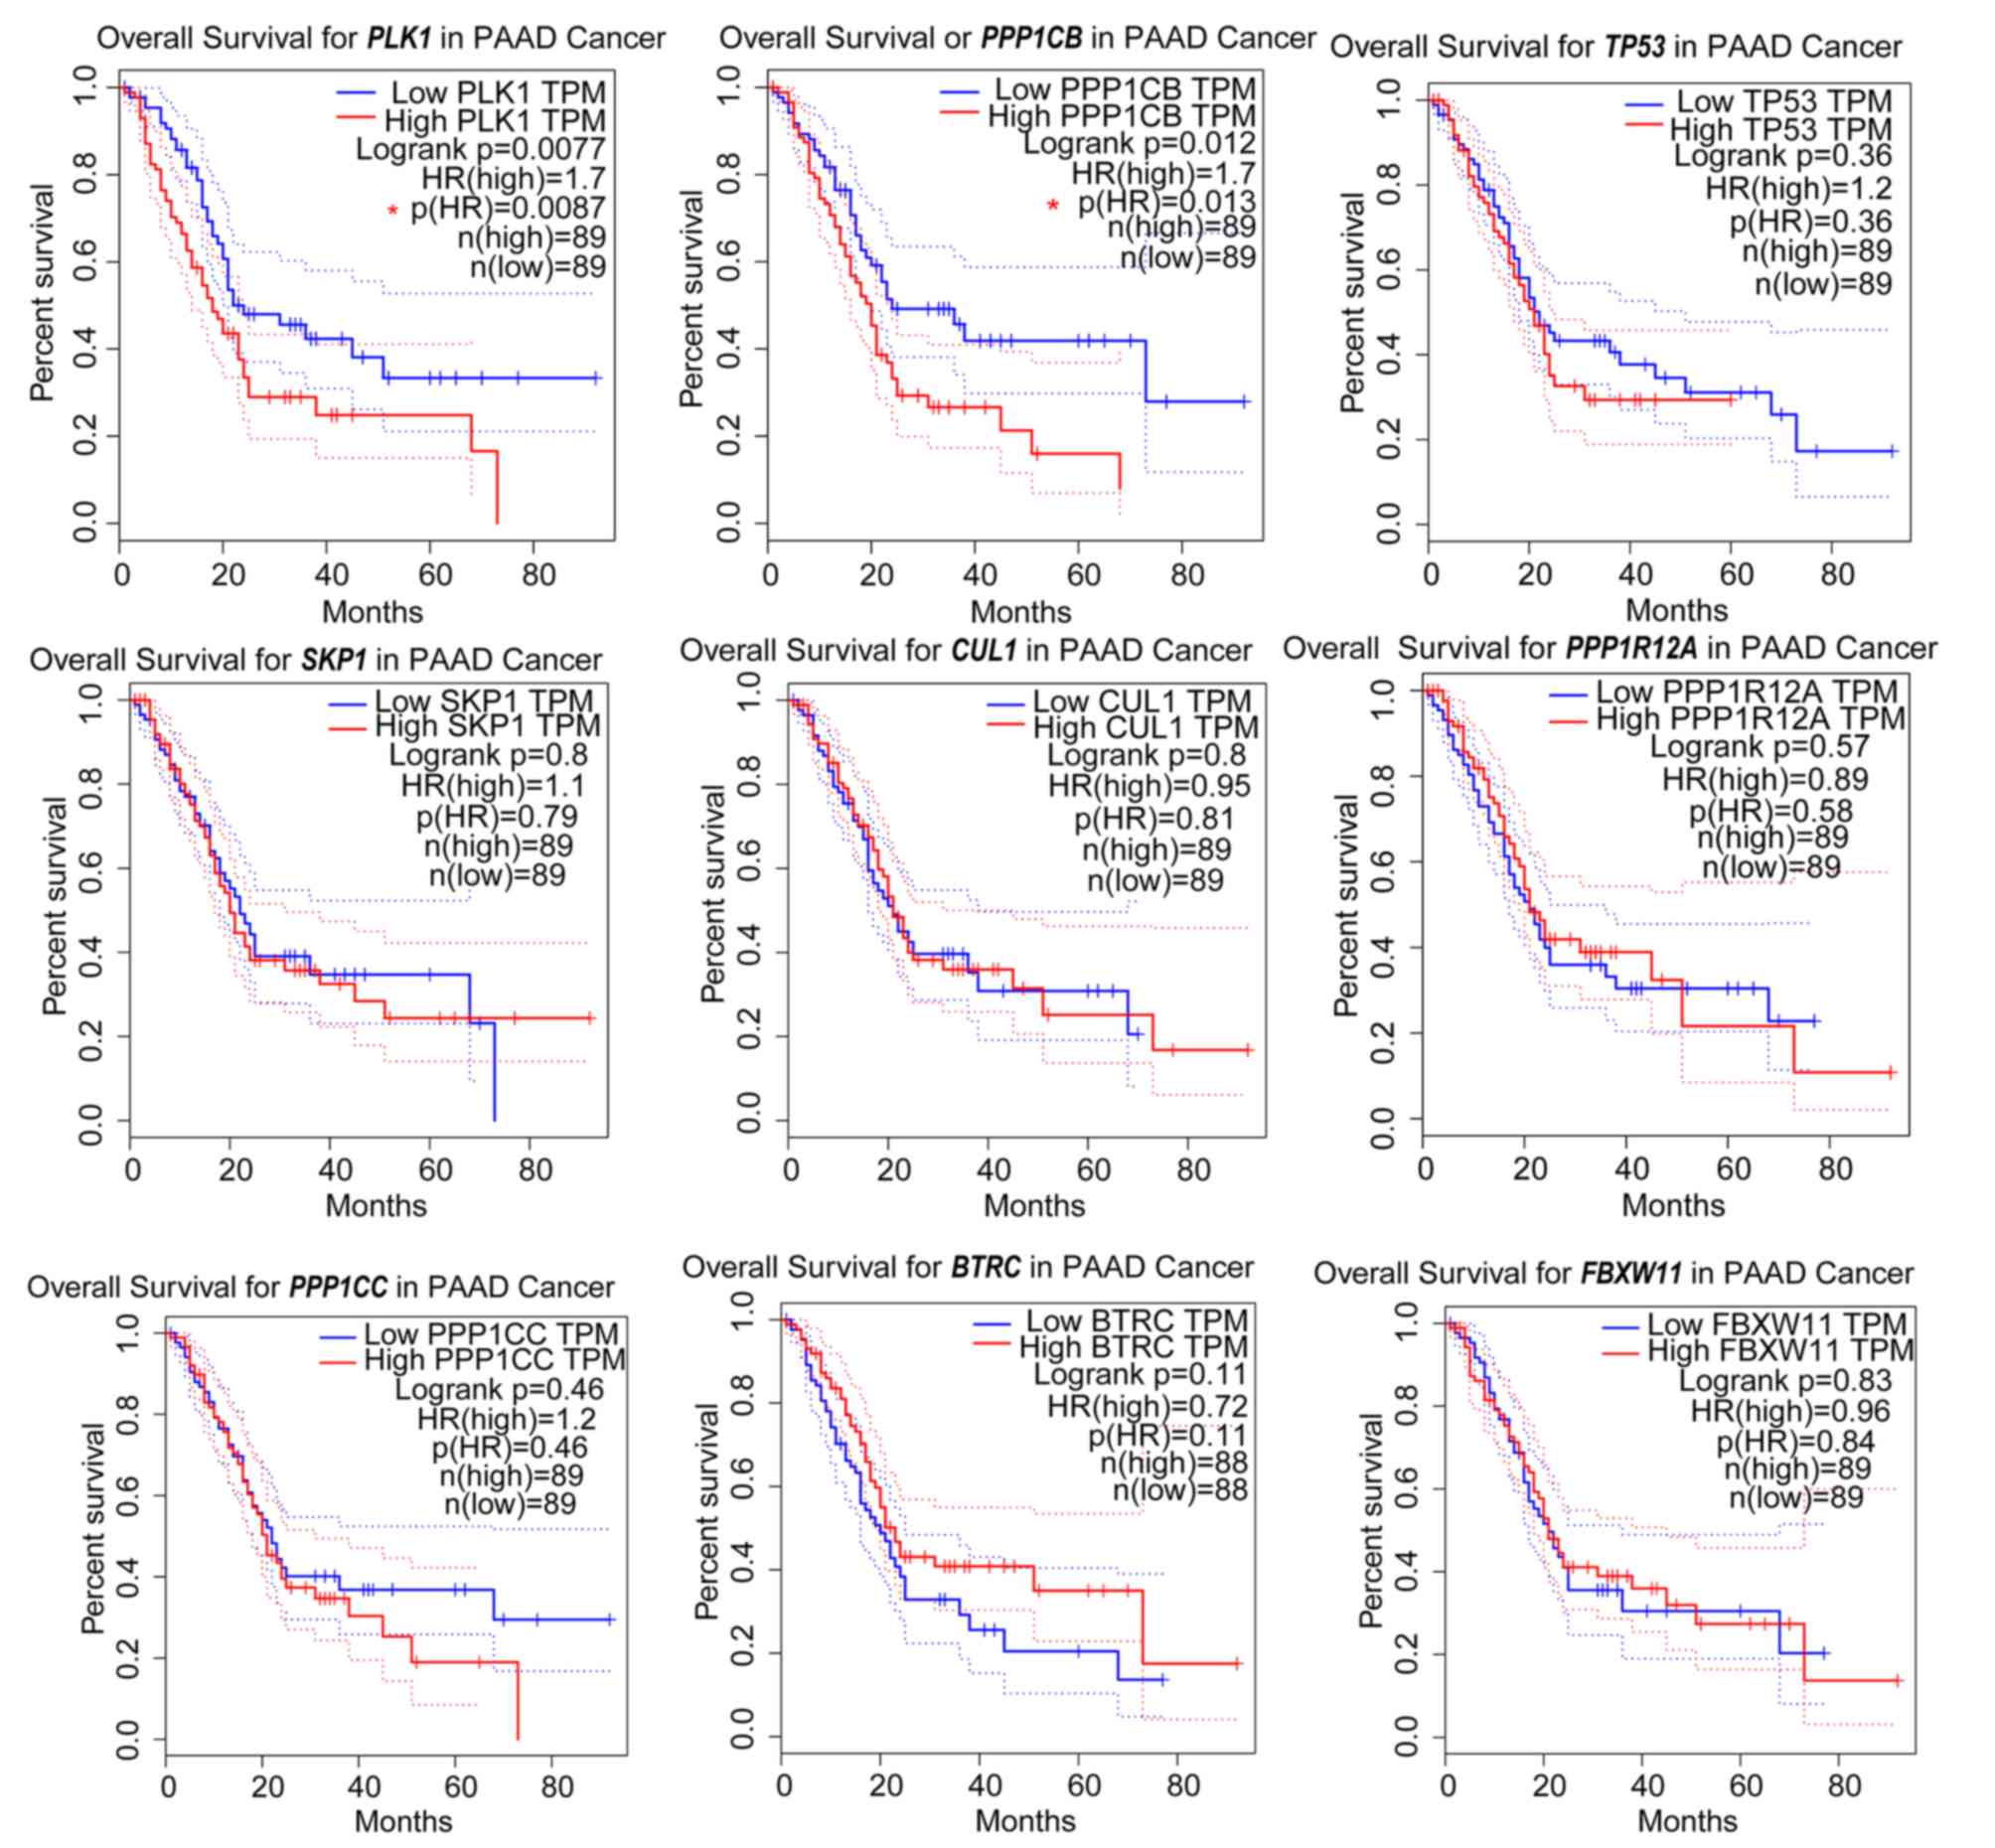 | Figure 5.Prognostic information for the nine
node genes. Online tools were used to generate Kaplan-Meier curves
(data from TCGA datasets). The median value of the dataset was used
as the cut-off for high and low expression for each gene.
PLK1 and PPP1CB were associated with significantly
worse survival rates. PAAD, pancreatic adenocarcinoma; PLK1,
polo-like kinase 1; PPP1CB, protein phosphatase 1 catalytic
subunit β; PPP1R12A, protein phosphatase 1 regulatory
subunit 12A, TP53, tumor protein 53; CUL1, cullin 1;
FBXW11, F-box and WD repeat domain-containing 11
SKP1, S-phase kinase-associated protein 1; BTRC,
β-transducin repeat-containing E3 ubiquitin protein ligase;
PPP1CC, protein phosphatase 1 catalytic subunit γ. |
Validation experiments on PAAD clinical
samples
ARK5 protein expression levels in PAAD
and corresponding non-cancerous tissues
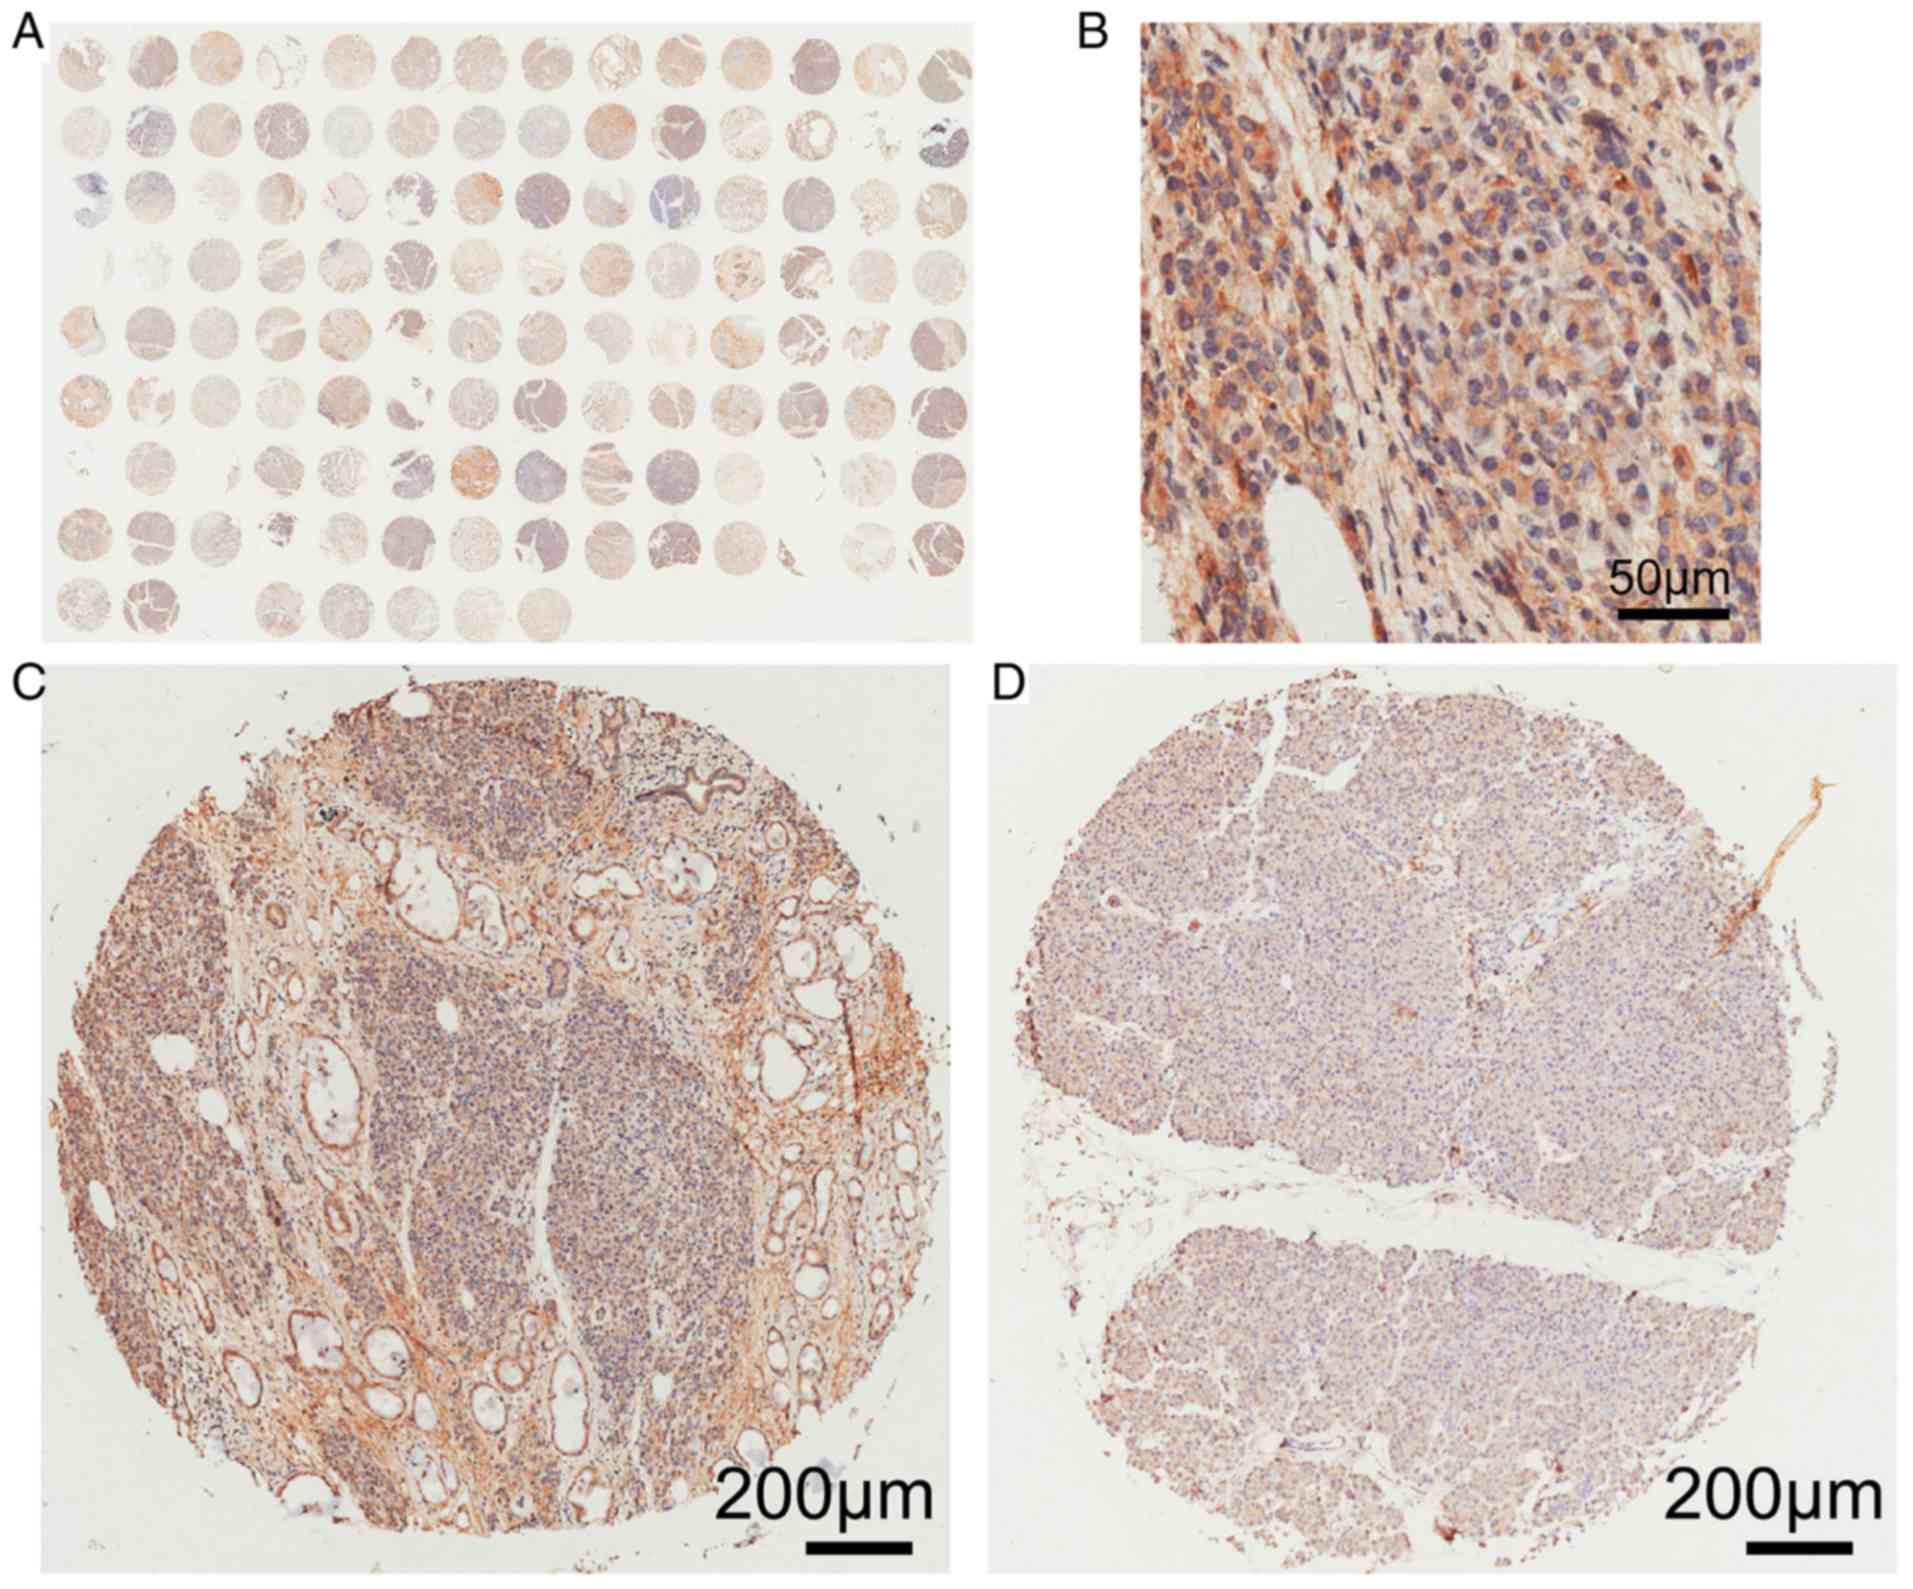
ARK5 protein expression levels in 112 PAAD tissue
and matched, adjacent, normal tissue were determined using
immunohistochemistry (Fig. 6).
ARK5 was highly expressed in 54 (48.2%) and poorly expressed in 58
(51.8%) of the 112 PAAD tissue samples. However, ARK5 protein was
only highly expressed in 10 (8.9%) and poorly expressed in 102
(91.1%) normal tissue samples (Table
IV). ARK5 protein expression levels were significantly higher
in PAAD tissues, compared with paired non-cancerous tissue
(P<0.01; Table IV).
| Table IV.ARK5 protein expression levels in
PAAD tissues are significantly upregulated compared with adjacent
normal tissue (data from the clinical samples). |
Table IV.
ARK5 protein expression levels in
PAAD tissues are significantly upregulated compared with adjacent
normal tissue (data from the clinical samples).
|
| ARK5
expression |
|
|
|---|
|
|
|
|
|
|---|
| Tissue type | High, n | Low, n | χ2 | P-value |
|---|
| PAAD | 54 | 58 | 42.350 | <0.01 |
| Adjacent
normal | 10 | 102 |
|
|
ARK5 protein expression levels are
associated with tumor N stage
High ARK5 protein expression levels were associated
with N stage (P=0.018). There were no significant associations with
other clinicopathological characteristics, such as age or sex
(Table V).
| Table V.Association between ARK5 protein
expression levels and clinicopathological characteristics (data
from the clinical samples). |
Table V.
Association between ARK5 protein
expression levels and clinicopathological characteristics (data
from the clinical samples).
|
|
| ARK5
expression |
|
|
|---|
|
|
|
|
|
|
|---|
| Clinicopathological
variable | Total cases | High, n | Low, n | χ2 | P-value |
|---|
| Age (year) |
|
|
|
|
|
|
≤60 | 65 | 32 | 33 | 0.009 | 0.926 |
|
>60 | 84 | 42 | 42 |
|
|
| No
data | 1 |
|
|
|
|
| Sex |
|
|
|
|
|
|
Female | 58 | 29 | 29 | <0.01 | >0.999 |
|
Male | 92 | 46 | 46 |
|
|
| Grade |
|
|
|
|
|
| I | 4 | 0 | 4 | NA | 0.120a |
|
II/III | 146 | 75 | 71 |
|
|
| T stage |
|
|
|
|
|
|
T1/T2 | 83 | 37 | 46 | 0.883 | 0.347 |
| T3 | 53 | 28 | 25 |
|
|
| No
data | 14 |
|
|
|
|
| N stage |
|
|
|
|
|
| N0 | 80 | 33 | 47 | 5.611 | 0.018 |
| N1 | 62 | 38 | 24 |
|
|
| No
data | 8 |
|
|
|
|
| M stage |
|
|
|
|
|
| M0 | 145 | 72 | 73 | NA |
>0.999a |
| M1 | 5 | 3 | 2 |
|
|
| TNM stage |
|
|
|
|
|
| I | 40 | 16 | 24 | 1.932 | 0.165 |
|
II/IV | 100 | 53 | 47 |
|
|
| No
data | 10 |
|
|
|
|
| p53 |
|
|
|
|
|
|
Negative | 33 | 17 | 16 | 2.879 | 0.090 |
|
Positive | 57 | 19 | 38 |
|
|
| No
data | 60 |
|
|
|
|
| Ki67 |
|
|
|
|
|
|
Negative | 25 | 12 | 13 | 0.634 | 0.426 |
|
Positive | 62 | 24 | 38 |
|
|
| No
data | 63 |
|
|
|
|
Association between ARK5 protein
expression levels and overall survival
Kaplan-Meier survival analysis and the log-rank test
were used for single-factor survival analysis. The overall survival
time of patients with PAAD significantly differed between the high
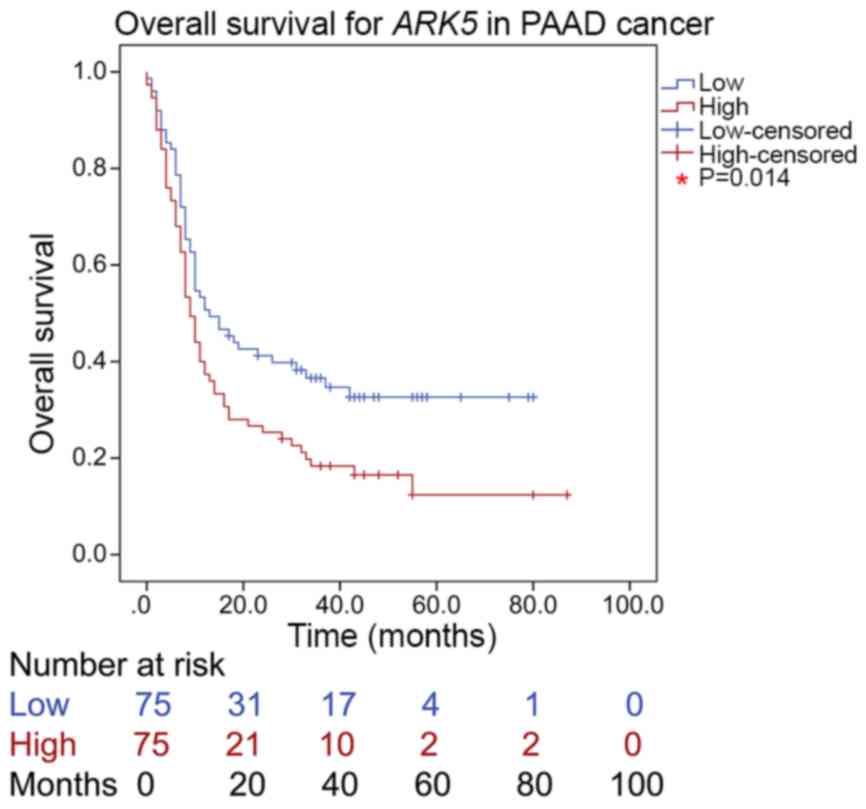
and the low ARK5 protein expression groups (P=0.014). Indeed,
overall survival was significantly reduced patients with high ARK5
protein expression, compared with that in the low-expression group
(Fig. 7), suggesting that
ARK5 may be used as an independent prognosis factor for
PAAD.
Discussion
PAAD is one of the leading causes of cancer deaths
globally, particularly in developed nations. PAAD prognosis is
generally very poor, with a 5-year survival rate at only ~4–5%, and
a postoperative recurrence rate within 2 years as high as 80%
(1,3,4).
Therefore, it is pivotal to identify an independent predictor for
evaluating the prognosis of PAAD. Moreover, surgical resection is
the only treatment that offers a potential cure of pancreatic
cancer and conventional treatment methods, including chemotherapy
and radiotherapy, only exist as auxiliary means (29). New therapies, such as
tumor-specific targeted therapy, have emerged. Identifying novel
targets is an integral part of tumor-specific targeted therapy
(30).
ARK5 mediates the migration of human PAAD
cells (5). A previous study
identified an association between ARK5 and gemcitabine
resistance (22). In addition,
ARK5 is reported to play an important role in tumor energy
metabolism, providing a new class of potential target molecules for
tumor therapy (31). In the
present study, bioinformatics analysis was performed on TCGA
datasets in order to determine whether ARK5 was associated
with the prognosis of PAAD, and the results were validated in
clinical samples from patients with PAAD.
In the present study, bioinformatics analysis
results supported the hypothesis that ARK5 served an active
role in PAAD development. ARK5 protein expression levels in tumor
tissues were significantly higher than those in corresponding
non-cancerous tissues. Additionally, elevated ARK5 protein
expression levels were associated with tumor N stage.
Single-factor survival analysis indicated that high
ARK5 protein expression levels in PAAD tissues were associated with
worse overall survival rates. These findings indicated that ARK5
protein expression levels in PAAD tissues may prove useful when
evaluating patient prognosis.
Although ARK5 is known to be associated with
important pathways that drive the progression of PAAD and promote
the proliferation, migration and invasion of PAAD cells, the
prognostic significance of ARK5 for PAAD has not been thoroughly
explored (32,33). In conclusion, the present study
suggested that ARK5 may represent an independent predictor
for PAAD prognosis in a clinical setting. In addition, the present
findings suggested that ARK5 might be used as a novel
chemotherapeutic target for PAAD. However, these results, which are
based on a Chinese cohort, should be further confirmed in other
populations of patients with PAAD. In addition, due to the
inevitable loss of clinicopathological data collection, there may
be some errors in analyzing the association between ARK5 protein
expression levels and clinicopathological characteristics, which is
also be a limitation of the present study.
Acknowledgements
Not applicable.
Funding
This work was supported by the Medical and Health
Science and Technology Planning Project of Zhejiang Province (grant
no. 2019KY219), the Science and Technology Planning Project of
Jiaxing City (grant no. 2018AY32003), the Zhejiang Provincial Ten
Thousand Plan for Young Top Talents (2018), the Training Objects of
Health Innovative Talents of Zhejiang Health (2018), the Key
Project Co-constructed by Zhejiang Province and the Ministry (grant
no. WKJ-ZJ-1916), and the Natural Science Foundation of China
(grant nos. 81972693, 81972674, and 31900543).
Availability of data and materials
All datasets used in the present study are available
from the corresponding author on reasonable request. The datasets
generated during the present study are available in the TCGA
(https://cancergenome.nih.gov/abouttcga/aboutdata/datalevelstypes).
Authors' contributions
ZXZ, XGW and HKX made substantial contributions to
conception and design. HKX was involved in drafting the manuscript.
JYM, WC and HKX made substantial contributions to analysis and
interpretation of data. XDY, FC, ZWS and JGF made substantial
contributions to the use of TCGA website and the acquisition of
bioinformatics data. All authors read and approved the final
manuscript.
Ethic approval and consent to
participate
All experimental procedures were approved by the
Ethics Committee of Taizhou Hospital, Zhejiang Province, where
sample collection took place. All samples were obtained through
National Human Genetic Resources Sharing Service Platform. All
patients signed an informed consent form.
Patient consent for publication
Not applicable.
Competing interests
The authors declare that they have no competing
interests.
References
|
1
|
Bray F, Ferlay J, Soerjomataram I, Siegel
RL, Torre LA and Jemal A: Global cancer statistics 2018: GLOBOCAN
estimates of incidence and mortality worldwide for 36 cancers in
185 countries. CA Cancer J Clin. 68:394–424. 2018. View Article : Google Scholar : PubMed/NCBI
|
|
2
|
Hidalgo M, Cascinu S, Kleeff J, Labianca
R, Löhr JM, Neoptolemos J, Real FX, Van Laethem JL and Heinemann V:
Addressing the challenges of pancreatic cancer: Future directions
for improving outcomes. Pancreatology. 15:8–18. 2015. View Article : Google Scholar : PubMed/NCBI
|
|
3
|
Maitra A and Hruban RH: Pancreatic cancer.
Ann Rev Pathol. 3:157–188. 2008. View Article : Google Scholar
|
|
4
|
Javadi S, Karbasian N, Bhosale P, de
Castro Faria S, Le O, Katz MH, Koay EJ and Tamm EP: Imaging
findings of recurrent pancreatic cancer following resection. Abdom
Radiol (NY). 43:489–496. 2018. View Article : Google Scholar : PubMed/NCBI
|
|
5
|
Suzuki A, Kusakai G, Kishimoto A, Lu J,
Ogura T, Lavin MF and Esumi H: Identification of a novel protein
kinase mediating Akt survival signaling to the ATM protein. J Biol
Chem. 278:48–53. 2003. View Article : Google Scholar : PubMed/NCBI
|
|
6
|
Warfel NA and Kraft AS: PIM kinase (and
Akt) biology and signaling in tumors. Pharmacol Ther. 151:41–49.
2015. View Article : Google Scholar : PubMed/NCBI
|
|
7
|
Ekstrand AI, Jonsson M, Lindblom A, Borg A
and Nilbert M: Frequent alterations of the PI3K/AKT/mTOR pathways
in hereditary nonpolyposis colorectal cancer. Fam Cancer.
9:125–129. 2010. View Article : Google Scholar : PubMed/NCBI
|
|
8
|
Li B, Tsao SW, Li YY, Wang X, Ling MT,
Wong YC, He QY and Cheung AL: Id-1 promotes tumorigenicity and
metastasis of human esophageal cancer cells through activation of
PI3K/AKT signaling pathway. Int J Cancer. 125:2576–2585. 2009.
View Article : Google Scholar : PubMed/NCBI
|
|
9
|
Ohta T, Isobe M, Takahashi T,
Saitoh-Sekiguchi M, Motoyama T and Kurachi H: The Akt and ERK
activation by platinum-based chemotherapy in ovarian cancer is
associated with favorable patient outcome. Anticancer Res.
29:4639–4647. 2009.PubMed/NCBI
|
|
10
|
Simon PO Jr, McDunn JE, Kashiwagi H, Chang
K, Goedegebuure PS, Hotchkiss RS and Hawkins WG: Targeting AKT with
the proapoptotic peptide, TAT-CTMP: A novel strategy for the
treatment of human pancreatic adenocarcinoma. Int J Cancer.
125:942–951. 2009. View Article : Google Scholar : PubMed/NCBI
|
|
11
|
Esumi H, Izuishi K, Kato K, Hashimoto K,
Kurashima Y, Kishimoto A, Ogura T and Ozawa T: Hypoxia and nitric
oxide treatment confer tolerance to glucose starvation in a
5′-AMP-activated protein kinase-dependent manner. J Biol Chem.
277:32791–3298. 2002. View Article : Google Scholar : PubMed/NCBI
|
|
12
|
Suzuki A, Kusakai G, Shimojo Y, Chen J,
Ogura T, Kobayashi M and Esumi H: Involvement of transforming
growth factor-beta 1 signaling in hypoxia-induced tolerance to
glucose starvation. J Biol Chem. 280:31557–31563. 2005. View Article : Google Scholar : PubMed/NCBI
|
|
13
|
Suzuki A, Lu J, Kusakai G, Kishimoto A,
Ogura T and Esumi H: ARK5 is a tumor invasion-associated factor
downstream of Akt signaling. Mol Cell Biol. 24:3526–3535. 2004.
View Article : Google Scholar : PubMed/NCBI
|
|
14
|
Suzuki A, Ogura T and Esumi H: NDR2 acts
as the upstream kinase of ARK5 during insulin-like growth factor-1
signaling. J Biol Chem. 281:13915–21391. 2006. View Article : Google Scholar : PubMed/NCBI
|
|
15
|
Kusakai G, Suzuki A, Ogura T, Kaminishi M
and Esumi H: Strong association of ARK5 with tumor invasion and
metastasis. J ExpClin Cancer Res. 23:263–268. 2004.
|
|
16
|
Cui J, Yu Y, Lu GF, Liu C, Liu X, Xu YX
and Zheng PY: Overexpression of ARK5 is associated with poor
prognosis in hepatocellular carcinoma. Tumour Biol. 34:1913–1918.
2013. View Article : Google Scholar : PubMed/NCBI
|
|
17
|
Chang XZ, Yu J, Liu HY, Dong RH and Cao
XC: ARK5 is associated with the invasive and metastatic potential
of human breast cancer cells. J Cancer Res Clin Oncol. 138:247–254.
2012. View Article : Google Scholar : PubMed/NCBI
|
|
18
|
Sun X, Gao L, Chien HY, Li WC and Zhao J:
The regulation and function of the NUAK family. J Mol Endocrinol.
51:R15–R22. 2013. View Article : Google Scholar : PubMed/NCBI
|
|
19
|
Kusakai G, Suzuki A, Ogura T, Miyamoto S,
Ochiai A, Kaminishi M and Esumi H: ARK5 expression in colorectal
cancer and its implications for tumor progression. Am J Pathol.
164:987–995. 2004. View Article : Google Scholar : PubMed/NCBI
|
|
20
|
Lu S, Niu N, Guo H, Tang J, Guo W, Liu Z,
Shi L, Sun T, Zhou F, Li H, et al: ARK5 promotes glioma cell
invasion, and its elevated expression is correlated with poor
clinical outcome. Eur J Cancer. 49:752–763. 2013. View Article : Google Scholar : PubMed/NCBI
|
|
21
|
Chen P, Li K, Liang Y, Li L and Zhu X:
High NUAK1 expression correlates with poor prognosis and involved
in NSCLC cells migration and invasion. Exp Lung Res. 39:9–17. 2013.
View Article : Google Scholar : PubMed/NCBI
|
|
22
|
Wang X, Song Z, Chen F, Yang X, Wu B, Xie
S, Zheng X, Cai Y, Chen W and Zhong Z: AMPK-related kinase 5 (ARK5)
enhances gemcitabine resistance in pancreatic carcinoma by inducing
epithelial-mesenchymal transition. Am J Transl Res. 10:4095–4106.
2018.PubMed/NCBI
|
|
23
|
Tang Z, Li C, Kang B, Gao G, Li C and
Zhang Z: GEPIA: A web server for cancer and normal gene expression
profiling and interactive analyses. Nucleic Acids Res. 45:W98–W102.
2017. View Article : Google Scholar : PubMed/NCBI
|
|
24
|
Vivian J, Rao AA, Nothaft FA, Ketchum C,
Armstrong J, Novak A, Pfeil J, Narkizian J, Deran AD,
Musselman-Brown A, et al: Toil enables reproducible, open source,
big biomedical data analyses. Nat Biotechnol. 35:314–316. 2017.
View Article : Google Scholar : PubMed/NCBI
|
|
25
|
von Mering C, Jensen LJ, Snel B, Hooper
SD, Krupp M, Foglierini M, Jouffre N, Huynen MA and Bork P: STRING:
Known and predicted protein-protein associations, integrated and
transferred across organisms. Nucleic Acids Res. 33((Database
Issue)): D433–D437. 2005.PubMed/NCBI
|
|
26
|
Zhou Y, Zhou B, Pache L, Chang M,
Khodabakhshi AH, Tanaseichuk O, Benner C and Chanda SK: Metascape
provides a biologist-oriented resource for the analysis of
systems-level datasets. Nat Commun. 10:15232019. View Article : Google Scholar : PubMed/NCBI
|
|
27
|
Shannon P, Markiel A, Ozier O, Baliga NS,
Wang JT, Ramage D, Amin N, Schwikowski B and Ideker T: Cytoscape: A
software environment for integrated models of biomolecular
interaction networks. Genome Res. 13:2498–2504. 2003. View Article : Google Scholar : PubMed/NCBI
|
|
28
|
Remmele W and Stegner HE: Recommendation
for uniform definition of an immunoreactive score (IRS) for
immunohistochemical estrogen receptor detection (ER-ICA) in breast
cancer tissue. Pathologe. 8:138–140. 1987.(In German). PubMed/NCBI
|
|
29
|
McGuigan A, Kelly P, Turkington RC, Jones
C, Coleman HG and McCain RS: Pancreatic cancer: A review of
clinical diagnosis, epidemiology, treatment and outcomes. World J
Gastroenterol. 24:4846–4861. 2018. View Article : Google Scholar : PubMed/NCBI
|
|
30
|
Liu H, Ma Q, Xu Q, Lei J, Li X, Wang Z and
Wu E: Therapeutic potential of perineural invasion, hypoxia and
desmoplasia in pancreatic cancer. Curr Pharm Des. 18:2395–2403.
2012. View Article : Google Scholar : PubMed/NCBI
|
|
31
|
Liu L, Ulbrich J, Müller J, Wüstefeld T,
Aeberhard L, Kress TR, Muthalagu N, Rycak L, Rudalska R, Moll R, et
al: Deregulated MYC expression induces dependence upon AMPK-related
kinase 5. Nature. 483:608–612. 2012. View Article : Google Scholar : PubMed/NCBI
|
|
32
|
Rajamani D and Bhasin MK: Identification
of key regulators of pancreatic cancer progression through
multidimensional systems-level analysis. Genome Med. 8:382016.
View Article : Google Scholar : PubMed/NCBI
|
|
33
|
Huang X, Lv W, Zhang JH and Lu DL: miR-96
functions as a tumor suppressor gene by targeting NUAK1 in
pancreatic cancer. Int J Mol Med. 34:1599–1605. 2014. View Article : Google Scholar : PubMed/NCBI
|