Introduction
Hepatocellular carcinoma (HCC) is an aggressive type
of cancer with high morbidity and mortality rates (1–3).
Glycolysis is highly associated with the prognosis of patients with
HCC and plays a crucial role in the origin, proliferation and
metastasis of HCC (4). On the one
hand, the activation of glycolysis enhances the ability of cells to
compete for energy as it accelerates glucose consumption. On the
other hand, numerous metabolic intermediates accumulate in this
process and facilitate the synthesis of biomacromolecules, such as
nucleic acids (5). Glycolysis also
produces lactate and hydrogen ions (H+), which lead to the
acidification of immune microenvironments and inhibit immune cell
function (6). Therefore, the
genomics of glycolysis may be aid in the identification of novel
prognostic biomarkers.
Given that HCC is a highly heterogeneous tumor
(7,8), some relatively weak yet important
signals on glycolytic signaling pathways in the liver may be missed
by conventional sequencing techniques. Single-cell RNA sequencing
analysis (scRNA-Seq) is an excellent technique used to explore the
genetic information in specific cell clusters in tumor tissues of a
patient (9,10). This technique has more genetic
information and less background interference than traditional gene
sequencing, and is helpful for exploring new prognostic factors and
avoiding omission of important genetic information.
The present study explored the heterogeneity of
glycolysis states in HCC tissues through scRNA-seq and constructed
a glycolysis-related prognostic model to predict prognosis and
response to immunotherapy. The most significant gene, zinc finger
protein (ZFP)41, in the model was identified as a potential
biomarker of HCC. Further analyses and experiments were conducted
to investigate the characteristics and prognostic value of ZFP41 in
HCC. The present study aimed to identify a novel prognostic
biomarker and therapeutic target from glycolysis-related model
construction and experimental verification and provide new
perspectives into the underlying molecular mechanisms of HCC.
Materials and methods
Acquisition of glycolysis-related
genes
A total of 198 glycolysis-related genes were
identified in the Molecular Signatures Database of the human Gene
Set HALLMARK_GLYCOLYSIS. (https://www.gsea-msigdb.org/gsea/msigdb/human/geneset/HALLMARK_GLYCOLYSIS).
Ethics approval
The present study and all included experimental
procedures were approved by the Biomedical Ethics Review Committee,
West China Hospital, Sichuan University (Chengdu, China; Approval
no. 2023-0121 and no. 2020-1866). For the experimental procedures
involving tissues from human participants, exemption for patient
consent was granted by the Biomedical Ethics Review Committee, West
China Hospital, Sichuan University.
scRNA-seq data download and
processing
GSE146115, which contains 16 samples from 4
patients, was downloaded from the Gene Expression Omnibus database
for liver hepatocellular carcinoma (LIHC). Each patient provided
four samples, each from one part of a tumor. Data quality control
was conducted using the R package ‘Seurat’. The cells selected had
<5% mitochondrial genes, a total number of >50 genes and
genes were expressed in at least three cells. For the following
analysis, 1,500 variable genes were selected in each cell after
normalizing their expression. Principal component analysis (PCA)
was performed by setting the number of PCs to 20. k-Nearest
neighbor (KNN) was calculated based on 20 previous PCs and the
resolution was set to 0.5 for the purpose of clustering cells and
further reducing the dimension by using t-distributed stochastic
neighbor embedding (t-SNE). The reference dataset built into the
‘SingleR’ function in R was used to to automatically annotate each
cell cluster. The reference data set includes BlueprintEncodeData
Blueprint (11) and Encode
(12), HumanPrimaryCellAtlasData
the Human Primary Cell Atlas (13), DatabaseImmuneCellExpressionData The
Database for Immune Cell Expression(/eQTLs/Epigenomics) (14). Glycolysis genes were imported into
each cell through the ‘PercentageFeatureSet’ function to determine
their percentage. A feature violin plot was used to illustrate the
percentage of glycolytic genes in each cell or cluster.
Downloading and manipulation of
transcriptome with clinical data
The transcriptome data of 374 patients with LIHC and
corresponding clinical information were retrospectively collected
from The Cancer Genome Atlas (TCGA) data portal (https://portal.gdc.cancer.gov/) as the training
cohort. Moreover, 273 samples from the International Cancer Genome
Consortium (ICGC) data portal with clinical information were
downloaded as the validation cohort (https://dcc.icgc.org/projects/LIRI-JP). The TPM data
type was extracted from raw data and used for subsequent
analysis.
Construction of the prognostic model
associated with glycolysis
Differentially expressed differentially between the
374 LIHC samples and 50 normal samples were identified using the R
package ‘limma’ according to the criteria of a fold change >1
and false discovery rate <0.05 in TCGA cohort. Univariate Cox
proportional hazard regression analysis was applied to assess the
association between gene expression and the overall survival (OS)
of patients with HCC. Least absolute shrinkage and selection
operator (LASSO) Cox regression was used to identify the fewest
genes with the most complete information. Highly correlated genes
were identified among the LASSO genes, and a prognostic gene
signature was constructed using multivariate Cox proportional
hazard regression. The risk score of patients was calculated
according to the expression of each glycolysis-related gene and its
corresponding regression coefficient by using the following
formula: RiskScore=esum (each gene's expression ×
corresponding coefficient). TCGA cohort was divided into the
low- and high-risk groups based on its median risk score. The R
packages ‘survival’ and ‘survivalROC’ were used to determine the
survival rates of the patients in the high- and low-risk groups and
evaluate accuracy of the prognostic model. A two-stage test was
applied when late-stage crossover appeared in survival curves using
the R package ‘TSHRC’ to obtain the P-values for survival analysis.
A P-value <0.05 was considered to indicate a statistically
significant difference.
External validation of the
glycolysis-related gene signature model
LIRI-JP in the ICGC data portal was selected to
validate the glycolysis-related prognostic model. In the ICGC
validation cohort, the risk scores of each patient were calculated
using the formula of the model, and patients were divided into the
high- and low-risk groups based on the median risk score of TCGA
cohort. Survival analysis was performed to determine differences in
prognosis between the two subgroups in the validation cohort. A
receiver operating characteristic (ROC) curve was used to evaluate
the accuracy of the model.
Construction of a nomogram
TCGA cohorts were used for the subsequent analysis.
A nomogram was constructed to assess the risk of mortality in
patients by combining clinical data and the prognostic model. The
accuracy of the nomogram was evaluated in estimating the outcomes
of patients using prognostic ROC curves.
Functional enrichment analysis
By using the ‘clusterProfiler’ R package, the Gene
Ontology (GO) enrichment analyses for different risk groups was
examined to identify biological functions and signaling pathways
associated with them. The parameter minGSSize was set to 10 and
maxGSSize was set to 500. A P-value <0.05 was considered to
indicate a statistically significant difference.
Immune status analysis
The single-sample gene set enrichment analysis
(ssGSEA) score was employed by using the R package ‘GSVA’ to
quantify the activity or enrichment levels of immune cells and
immune functional pathways in HCC samples. An FDR <0.05 was
regarded as statistically significant. Differences between the
high- and low-risk groups were investigated in terms of immune cell
infiltration to determine immune cells with different functional
scores. In the two subgroups, the expression of immune checkpoint
genes was analyzed using the Wilcoxon test. Immune exclusion
ability and tumor immune dysfunction and exclusion scores of LIHC
were calculated based on the database tumor immune dysfunction and
exclusion (TIDE; http://tide.dfci.harvard.edu/login/).
Survival analysis and clinical
correlation analysis
The expression of ZFP41 combined with survival data
was analyzed using the R package ‘survival’, and Kaplan-Meier
curves were drawn. The association between the expression of ZFP41
and clinical data was determined.
HCC tissue collection
A total of 22 pairs of liver cancer tissues for
reverse transcription-quantitative PCR (RT-qPCR) and eight pairs of
HCC specimens were obtained from patients who underwent hepatectomy
and pathologically diagnosed with HCC from March, 2020 to December,
2023 at the Department of Biliary Surgery, West China Hospital of
Sichuan University, Chengdu, China. The patients did not receive
any pre-operative chemoradiotherapy. The clinical and pathological
characteristics of the patients are presented in Table SI.
Validation of mRNA expression
Primer series of ZFP41 were designed according to
gene sequence on https://blast.ncbi.nlm.nih.gov/Blast.cgi. Two pairs of
primers were successfully designed: Primer2 (forward,
5′-TAAGCACAAGACAGACCACATTC-3′ and reverse,
5′-GAGATTGGAGCCGCAGTTAAAG-3′) and primer4 (forward,
5′-GAGTGTGGGCGGATCTTTAAG-3′ and reverse,
5′-ATGTTTCAGGAGATTGGAGCC-3′). The verification results of each pair
of primers were similar in the pre-experiments, which ensured the
accuracy and authenticity of the subsequent verification results.
TRIzol® LS reagent (Invitrogen; Thermo Fisher Scientific, Inc.) was
used to extract mRNA and the reverse transcription of total cDNA
from HCC tissues and adjacent tissues was conducted using a
PrimeScript RT Reagent kit (Bio-Rad Laboratories, Inc.). qPCR was
conducted using the qRT-PCR instrument BioRad CFX96 and the
BeyoFast™ SYBR-Green One-Step qRT-PCR kit (Bio-Rad Laboratories,
Inc.). Pre-denaturation in 95°C lasted for 2 min. There are total
of 39 cycles in thermal cycling protocol used for RT-qPCR; one
cycle included 95°C for 15 sec, 60°C for 15 sec and 72°C for 30
sec. The melt curve stage was added at the end. All RNA expression
levels were standardized using the reference gene, β-actin (primer
sequence: Forward, 5′-AGCGCGGCTACAGCTTCACC-3′ and reverse,
5′-AGCAGCCGTGGCCATCTCTT-3′) and processed using the
2−∆∆Cq method (15).
Validation of prognostic gene protein
expression
Immunohistochemical staining was conducted to verify
the differences in the ZFP41 protein expression level between HCC
tissues and para-carcinoma tissues. All the HCC specimens were
preserved in 10% formalin at room temperature, embedded in paraffin
and cut into sections at a thickness of 5 µm. EDTA (cat. no. P0085,
Beyotime Institute of Biotechnology) (pH 8.0) was used to conduct
antigen retrieval. The sections were blocked with 3% hydrogen
peroxide for 15 min at room temperature. The primary antibody,
ZFP41 polyclonal antibody (cat. no. PA5-63276), was obtained from
Invitrogen; Thermo Fisher Scientific, Inc. and were diluted at a
ratio of 1:500 for overnight incubation at 4°C. Goat anti-rabbit
immunoglobulin (1:200 diluted; cat. no. 31466; Invitrogen; Thermo
Fisher Scientific, Inc.) was used for 40 min for secondary antibody
incubation at room temperature after blocking with goat serum
(Invitrogen; Thermo Fisher Scientific, Inc.) for 30 min at room
temperature. DAB (Beyotime Institute of Biotechnology) color
development for 45 sec and hematoxylin (Beyotime Institute of
Biotechnology) counterstaining for 15 sec were then performed at
room temperature. A Nikon inverted microscope (Nikon Corp.) was
used to obtain images of the sections after sealing. The average
optical density of each image was analyzed using ImageJ software
(version 1.45s/Java1.6.0_20, National Institutes of Health) to
present the protein expression of ZFP41.
Cells, cell culture and
transfection
The Huh7 and PLC cell lines (cat. no. CL-0120, cat.
no. CL-0415; Procell Life Science &Technology Co., Ltd.) were
derived from the cell bank of Research Center for Biliary Diseases,
West China Hospital of Sichuan University. Both cell lines were
maintained in Dulbecco's modified Eagle's medium (DMEM, HyClone;
Cytiva) supplemented with 10% fetal bovine serum (FBS, HyClone;
Cytiva) and 1% streptomycin-penicillin (HyClone; Cytiva). According
to the multivariate Cox proportional hazard regression analysis
(the RiskScore formula below) and single-gene survival analysis (as
shown below), ZFP41 was the gene with the highest coefficient and
efficient survival outcomes. Blank vectors pLKO.1 were used to
construct vectors with short hairpin RNAs. Blank vectors pCDH were
used to construct vectors with the overexpression sequence. pLKO.1
and pCDH were obtained from Frontiers Science Center for
Disease-related Molecular Network, West China Hospital of Sichuan
University. Cells were transfected with the previously synthesized
short hairpin RNAs (target sequence: sh2, GGGAGAGAAGCCCTTCAAA; sh4,
CCCTACGAATGCACGCACTGT) and overexpression sequence
(GAGTGTGGGCGGATCTTTAAG) targeting gene ZFP41 by using Lipofectamine
3000® reagent (Invitrogen; Thermo Fisher Scientific, Inc.)
according to the manufacturer's protocol. The cells were
transfected with blank vectors (pLKO.1 or pCDH) to serve as
negative controls for the experiments. The scrambled sequence in
pLKO.1 was CCTAAGGTTAAGTCGCCCTCG. The shRNA and overexpression
sequences for the ZFP41 gene are provided in Table SII. Second-generation lentiviral
transduction was performed. psPAX2 (1,000 ng/µl, Delivectory
Biosciences Inc.) and pMD2.G (1,000 ng/µl, Delivectory Biosciences
Inc.) were used as packaging vectors. 293T cells (cat. no. CL-0005;
Procell Life Science & Technology Co., Ltd.) at a density of
70% were transfected with a mixture of the 3 transfection vectors
(psPAX2:pMD2.G:constructed vectors=0.3125:0.3125:1.875 µg).
Lipofectamine 3000® reagent (Invitrogen; Thermo Fisher Scientific,
Inc.) was used at a mass ratio of 1:2 (DNA:Lipofectamine 3000). The
medium was replaced with fresh medium was following overnight
incubation at 37°C with 5% CO2. The viral supernatant
was collected after 48 h and centrifuged at 500 × g for 5 min at
4°C to pellet the lentiviral particles. The PLC and Huh7 cells (40%
confluency) were then respectively infected with different
lentiviral particles at a multiplicity of infection of 1.5 and
incubated with virus at 37°C for 48 h. The medium was then replaced
with fresh medium with 3 µg/ml puromycin (cat. no. A1113802, Thermo
Fisher Scientific, Inc.) once every 2 days for 4 days to obtain
stable cell lines. The mRNA expression of ZFP41 in the different
transfected cells was verified and stable cell lines successfully
constructed were used in the following experiments.
Cell Counting Kit-8 (CCK-8) assay
The CCK-8 (Biosharp Life Sciences) assay was used to
detect cell viability. For each cell line, five types of
transfected cells were seeded into 96-well cell culture plate with
the same cell density (1,500 cells per well) and CCK-8 solution was
added (10 µl per 100 µl of the FBS-free medium) for different
durations (24, 48, 72 and 96 h). The cells were preserved in
CO2 incubator for 1 h and the absorbance at an optical
density of 450 nm wavelength was detected using a microplate reader
(BioTek Instruments, Inc.). All data are presented as the mean ± SD
of five independent experiments.
Clone formation assay
Clone formation assay was used to detect the cell
proliferative ability. The transfected cells were seeded into a
six-well cell culture plate with the same cell density (500 cells
per well). The cells were preserved in a CO2 incubator
for 14 days, and the medium was replaced every 3 days. The cells
were then rinsed with PBS, fixed with methanol for 20 min and
stained with 0.1% crystal violet (cat. no. C0121-500ml, Beyotime
Institute of Biotechnology) for 10 min at room temperature, and
photographed using a digital camera (PowerShot G7 X Mark II,
Canon). The average area of cell clusters in the images was
analyzed using ImageJ software (version 1.45s/Java1.6.0_20,
National Institutes of Health). All data are presented as the mean
± SD of five independent experiments.
Scratch wound healing assay
Scratch wound healing assay was used to detect the
horizontal migration of the cells. The transfected cells were fully
seeded into a six-well cell culture plate. When the cells adhered
to the wall, a scratch wound was made gently with a 1,000-µl
pipette tip. The medium was replaced with serum-free medium. The
cells were preserved in a CO2 incubator for 48 h. The
scratch wound was photographed using a Nikon inverted microscope
(Nikon Corp.) at 0, 24 and 48 h. The healing area of the cells in
the images was marked and analyzed using ImageJ software (version
1.45s/Java1.6.0_20, National Institutes of Health). All data are
presented as the mean ± SD of five independent experiments.
Transwell assay
Transwell assay was used to assess the migratory
capacity of the cells. In brief, 0.2 ml of the transfected cells
resuspended in serum-free medium (2.5×10⁴ cells per ml)
were seeded into a Transwell chamber (Corning, Inc.) on a 24-well
culture plate with 0.6 ml DMEM combined with 20% FBS. After the
cells were preserved in a CO2 incubator for 48 h, they
were rinsed with PBS, fixed with methanol for 20 min and stained
with crystal violet for 10 min at room temperature. The cells were
photographed using a Nikon inverted microscope (Nikon Corp.) and
analyzed using ImageJ software (version 1.45s/Java1.6.0_20,
National Institutes of Health). All data are presented as the mean
± SD of five independent experiments.
Glycolysis-related analysis
In TCGA cohort, the mRNA expression of 10 known key
genes of anaerobic glycolysis (ALDOA, ENO1, GAPDH, HK2, LDHA, PFKL,
TIGAR, PGK1, PKM and SLC2A1) were extracted to conduct
co-expression analysis with ZFP41 using simple linear regression
analysis Glucose uptake experiments and lactic acid production
experiments were performed. The Glucose Uptake Cell-based Assay kit
(cat. no. 600470, Cayman Chemical Co.) and Lactic Acid (LA) Content
Assay kit (cat. no. BC2235, Beijing Solarbio Science &
Technology Co., Ltd.) were used to examine the glycolysis status of
the transfected cells. For each cell line, five types of
transfected cells were seeded into 96-well cell culture plate with
the same cell density (1×10⁵ cells per well). When the
cells adhered to the wall, 200 µl glucose-free medium with 100
µg/ml 2-NBDG (Cayman Chemical Co.) were added. The cells were
preserved in a CO2 incubator for 16 h. Fluorescein
(excitation/emission=485/535) was detected after rinsing with
Cell-based Assay Buffer (Cayman Chemical Co.). For each cell line,
five typs of 5×10⁶ transfected cells were processed
according to the protocol provided with the Lactic Acid (LA)
Content Assay kit protocol. The absorbance at an optical density of
570 nm wavelength was detected using a microplate reader (BioTek
Instruments, Inc.). All data are presented as the mean ± SD of five
independent experiments.
Statistical analysis
GraphPad Prism software (version 9.0; GraphPad
Software, Inc.), SPSS software (version 25.0; IBM Corp.) and R
(version 4.0.5, R Foundation for Statistical Computing, Vienna,
Austria) were utilized to conduct statistical analyses and plot the
diagrams. A two-stage test was applied when the survival curves
crossed over using the R package ‘TSHRC’. The Wilcoxon rank sum
test was used to reveal the differences in ZFP41 expression between
adjacent normal tissue and tumor tissue. Each experiment was
repeated independently at least three times. An unpaired Student's
t-test and one-way ANOVA were used to assess the differences
between groups. Tukey's test was used as A post hoc test for
multiple comparisons. A P-value <0.05 was considered to indicate
a statistically significant difference.
Results
scRNA-Seq data analysis
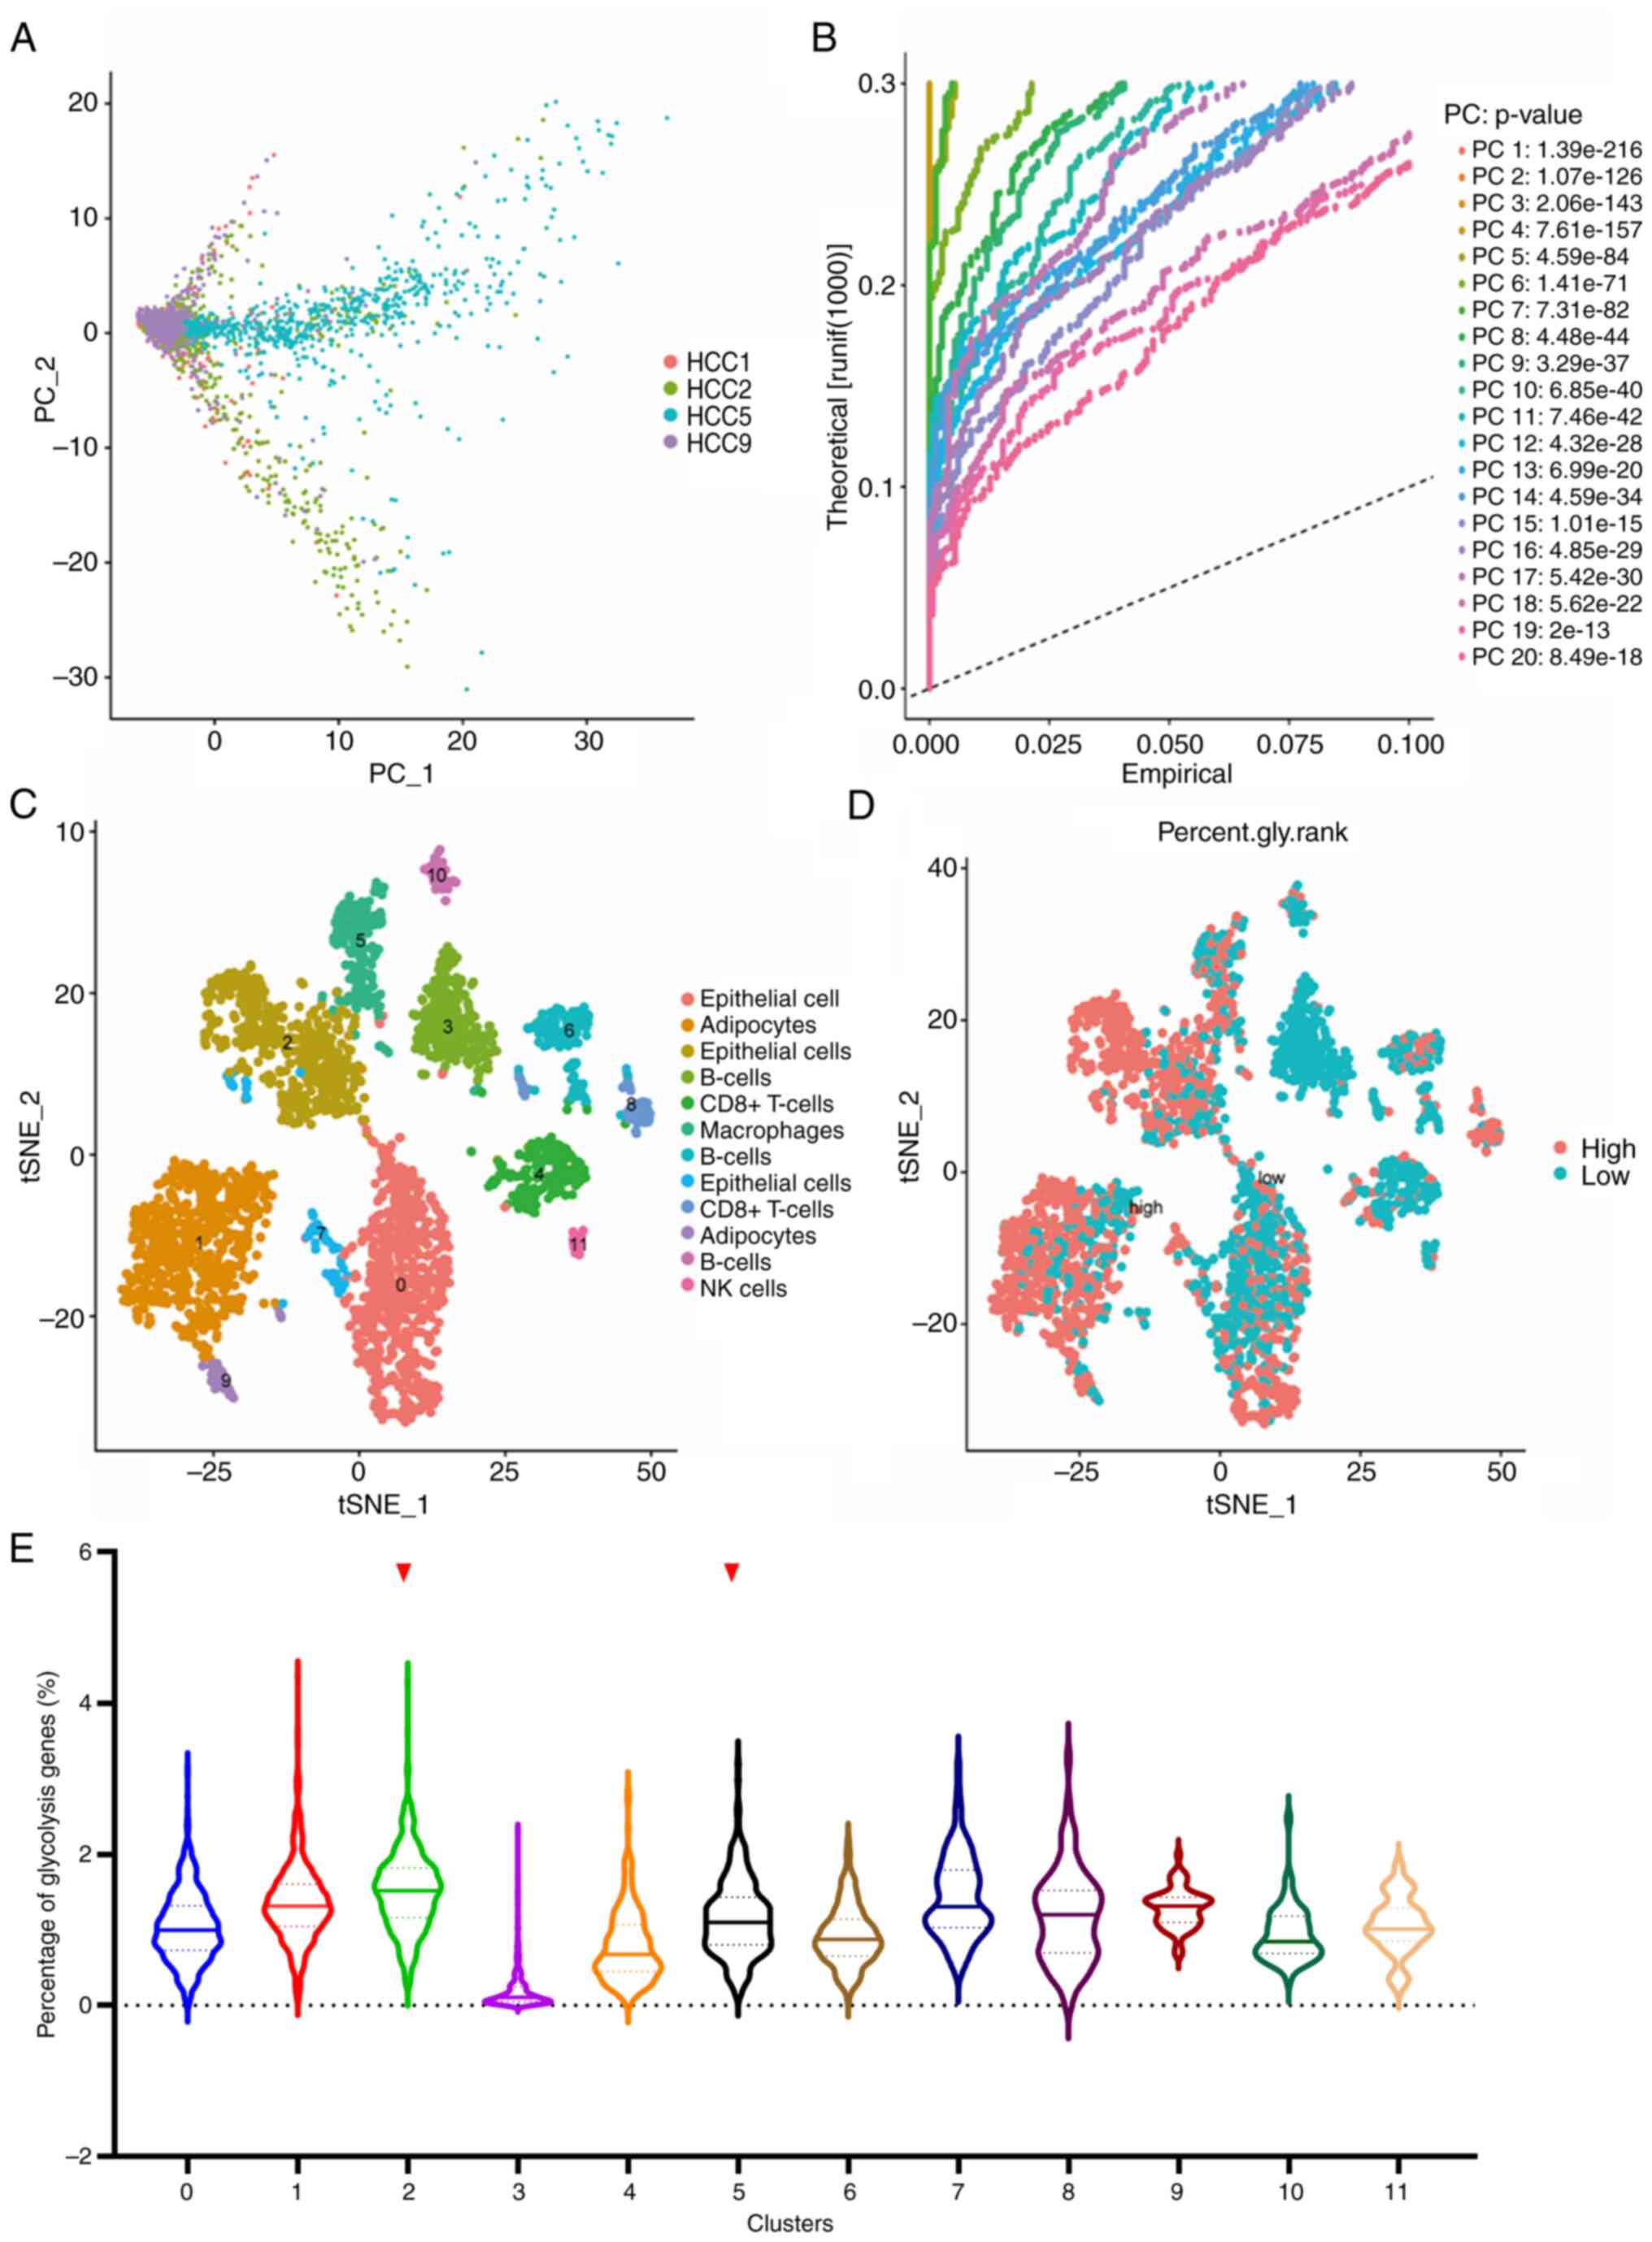
Following quality control and normalization, PCA was
conducted on the scRNA-Seq data of LIHC GSE146115. As shown in
Fig. 1A, four samples were
distinguished on the dimensions of PC1 and PC2. The whole data were
divided into 20 PCs with a P-value <0.001 (Fig. 1B). All cells were clustered into 11
clusters using the k-Nearest Neighbor (KNN) clustering algorithm
and were presented as t-SNE diagrams. The cell type annotation of
each cluster was determined using the R package ‘SingleR’ (Fig. 1C). Subsequently, 198 genes related
to glycolysis were input using the ‘PercentageFeatureSet’ function
to determine the percentage of glycolysis genes in each cell. The
cells were divided into low- and high-glycolysis cells according to
their median glycolysis gene proportion and were displayed in the
t-SNE diagram and the violin diagram (Fig. 1D and E). Comprehensively, Cluster1,
Cluster2, Cluster5, Cluster8 and Cluster9 expressed more glycolysis
genes. These cells were adipocytes, epithelial cells, macrophages
and CD8+ T-cells, respectively. Finally, the marker
genes of cluster2 and cluster5 were selected, considering that
cells in the liver mainly consist of hepatocytes and Kupffer cells,
whose function is similar to that of epithelial cells and
macrophages.
Construction and validation of
glycolysis-related prognostic model
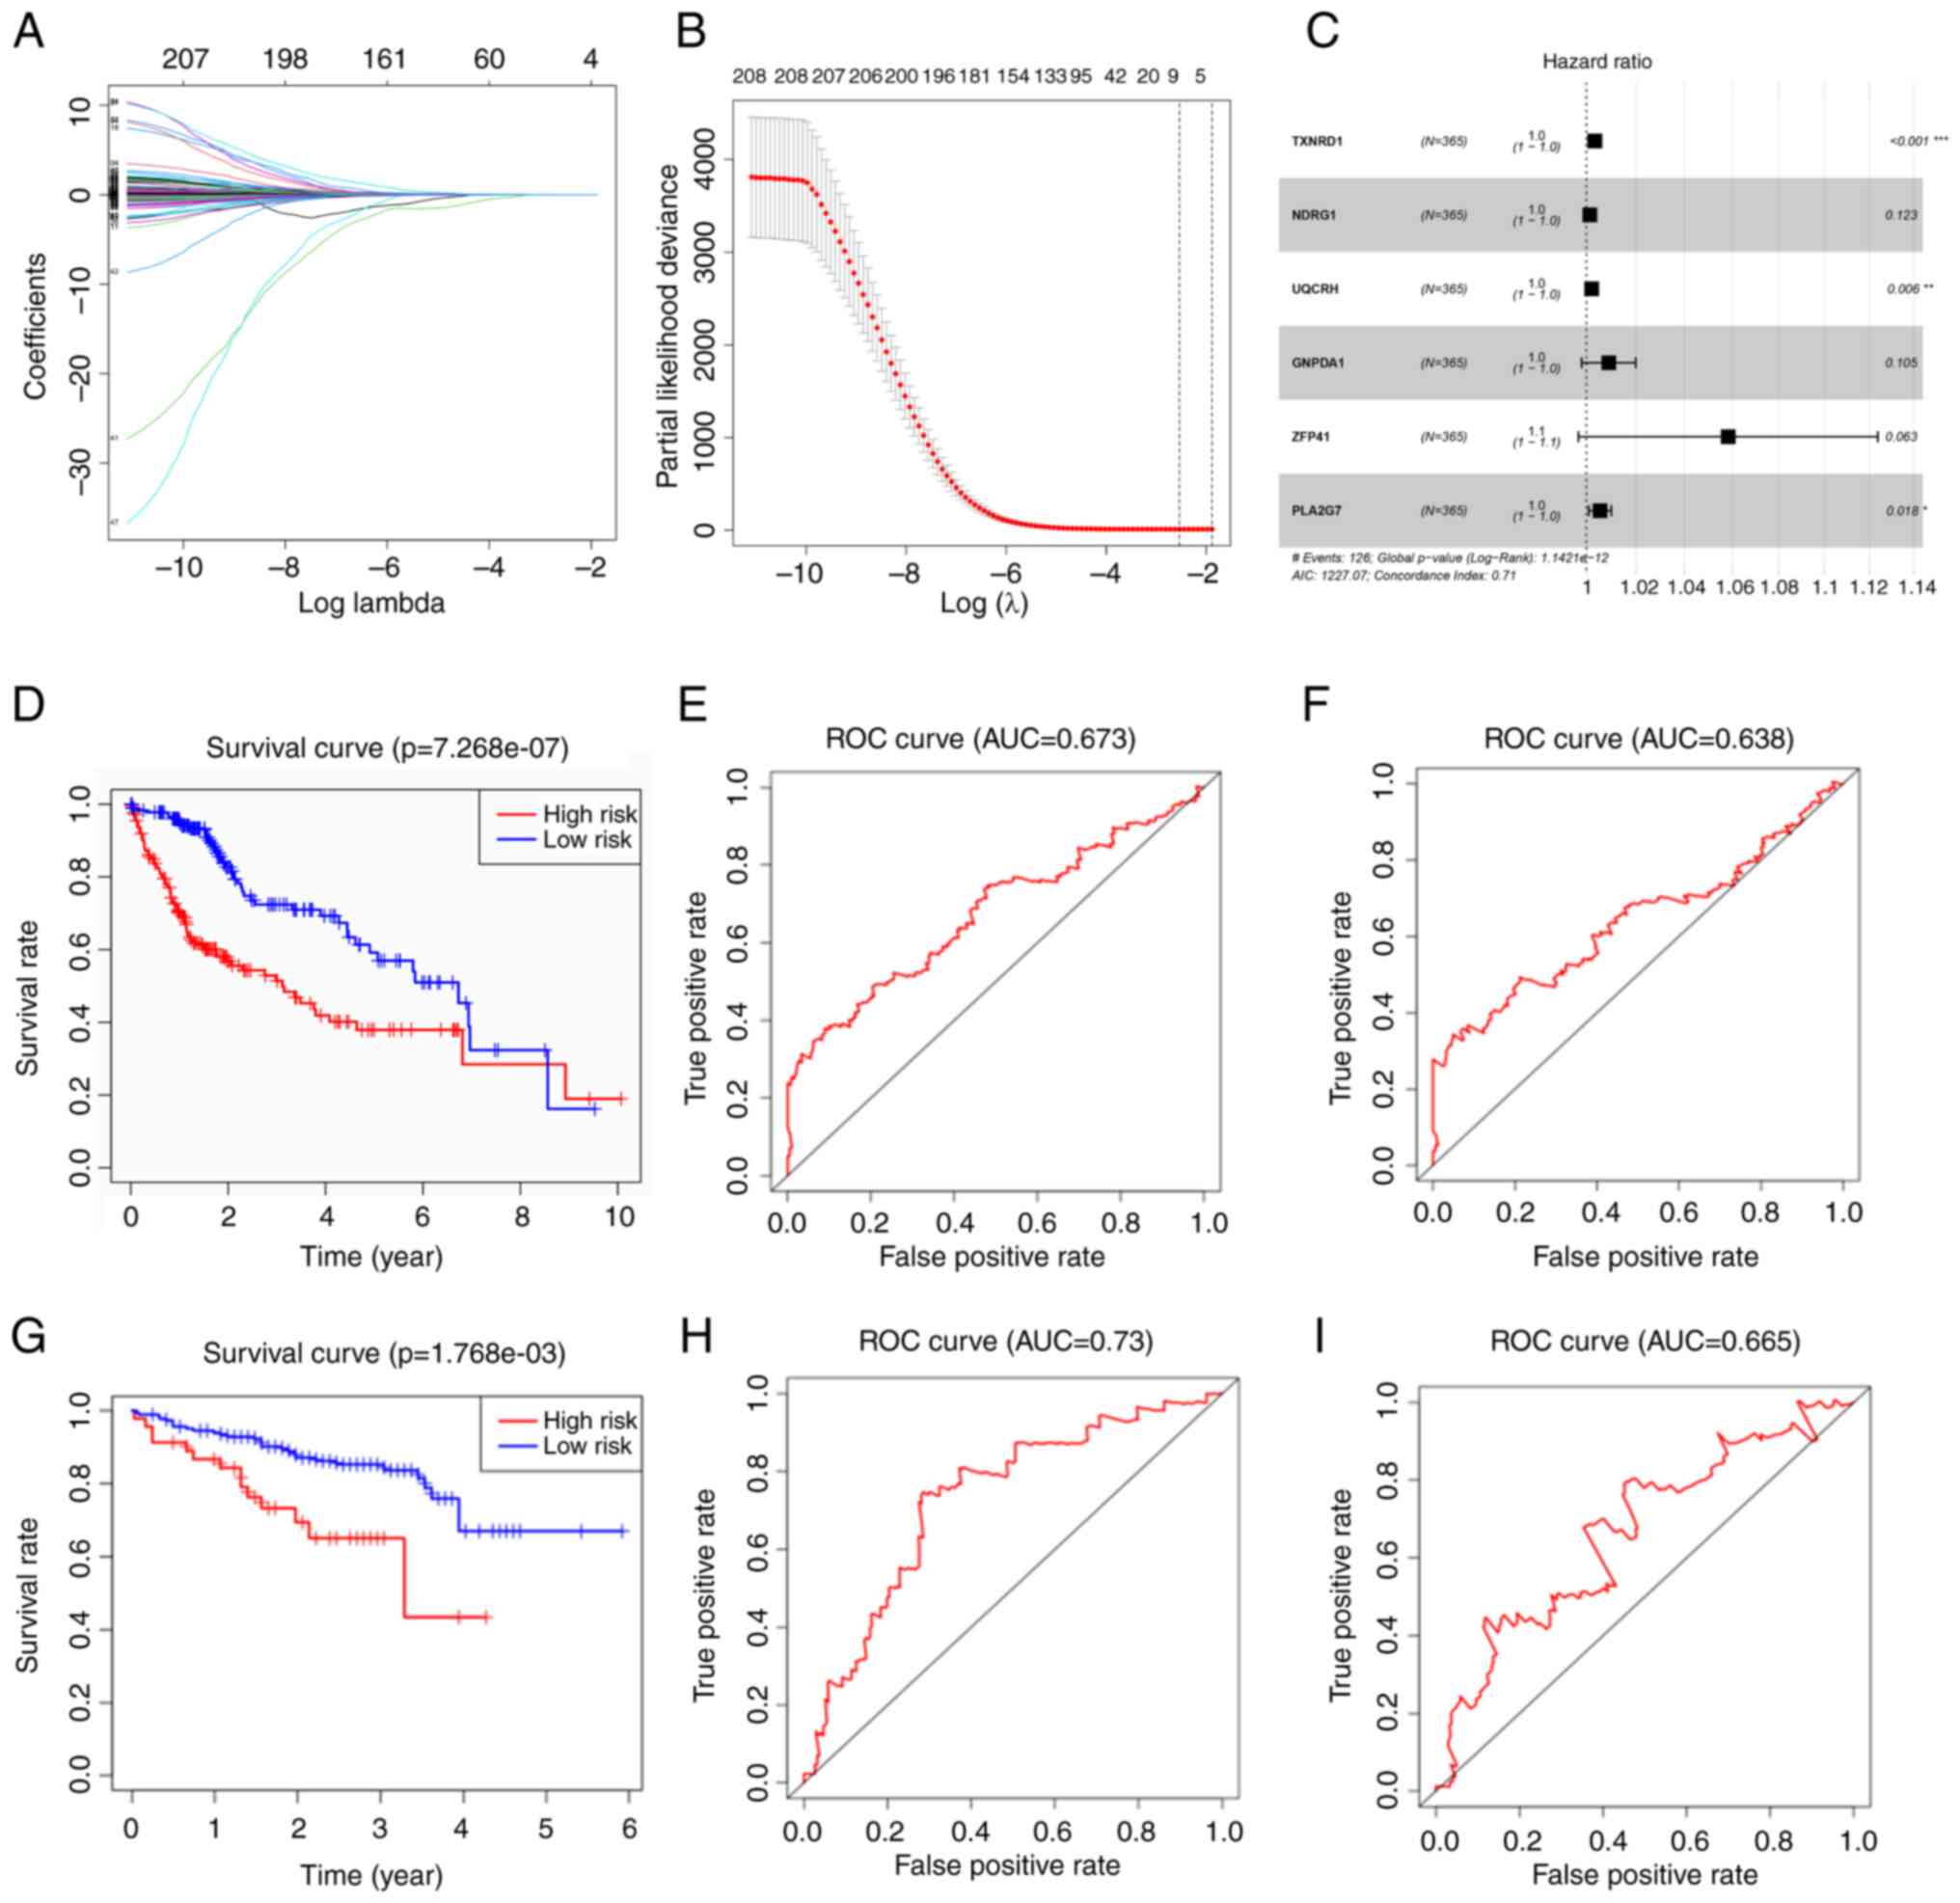
A total of 1,167 marker genes were selected and only
384 genes had a differential expression between the normal and
tumor groups. A total of 208 genes were associated with OS on
univariate Cox regression analysis. LASSO Cox regression analysis
was then conducted with the remnant candidates that were found to
be highly associated with survival, resulting in eight genes
remaining (LASSO genes) (Fig. 2A and
B). The LASSO genes included TXNRD1, NDRG1, UQCRH, GNPDA1,
ZFP41, PSMD1, SSB and PLA2G7. These were applied in multivariate
Cox regression analysis, and a prognostic model with six genes was
constructed (Fig. 2C). Since
Fig. 2C presents the forest map
with the result of multivariate Cox regression, only the six genes
that comprised the risk formula in the end were displayed. The
formula of the model containing six genes was as follows:
RiskScore=e(TXNRD1 × 0.003395 + NDRG1 × 0.001377 + UQCRH ×
0.002102 + GNPDA1 × 0.008965 + ZFP41 × 0.056787 + PLA2G7
× 0.00548). The risk score of each patient was calculated in
TCGA cohort, and the patients were divided into a high- and
low-risk group according to the median risk score. The Kaplan-Meier
survival curve revealed that the high-risk group had poorer
outcomes than the low-risk group (Fig.
2D). The model demonstrated an excellent predictive value, with
areas under the curve (AUC) >0.673 at 3 years and 0.638 at 5
years (Fig. 2E and F).
The ICGC cohort was used to validate the established
six-gene risk score model. The Kaplan-Meier survival curve of the
high-risk group was inferior to that of the low-risk group, similar
to the training cohort (Fig. 2G).
The time-dependent ROC curves of the validation cohort revealed
higher prediction value with AUC values >0.73 at 3 years and
0.665 at 5 years (Fig. 2H and
I).
Independent prognostic value of the
six-gene signature
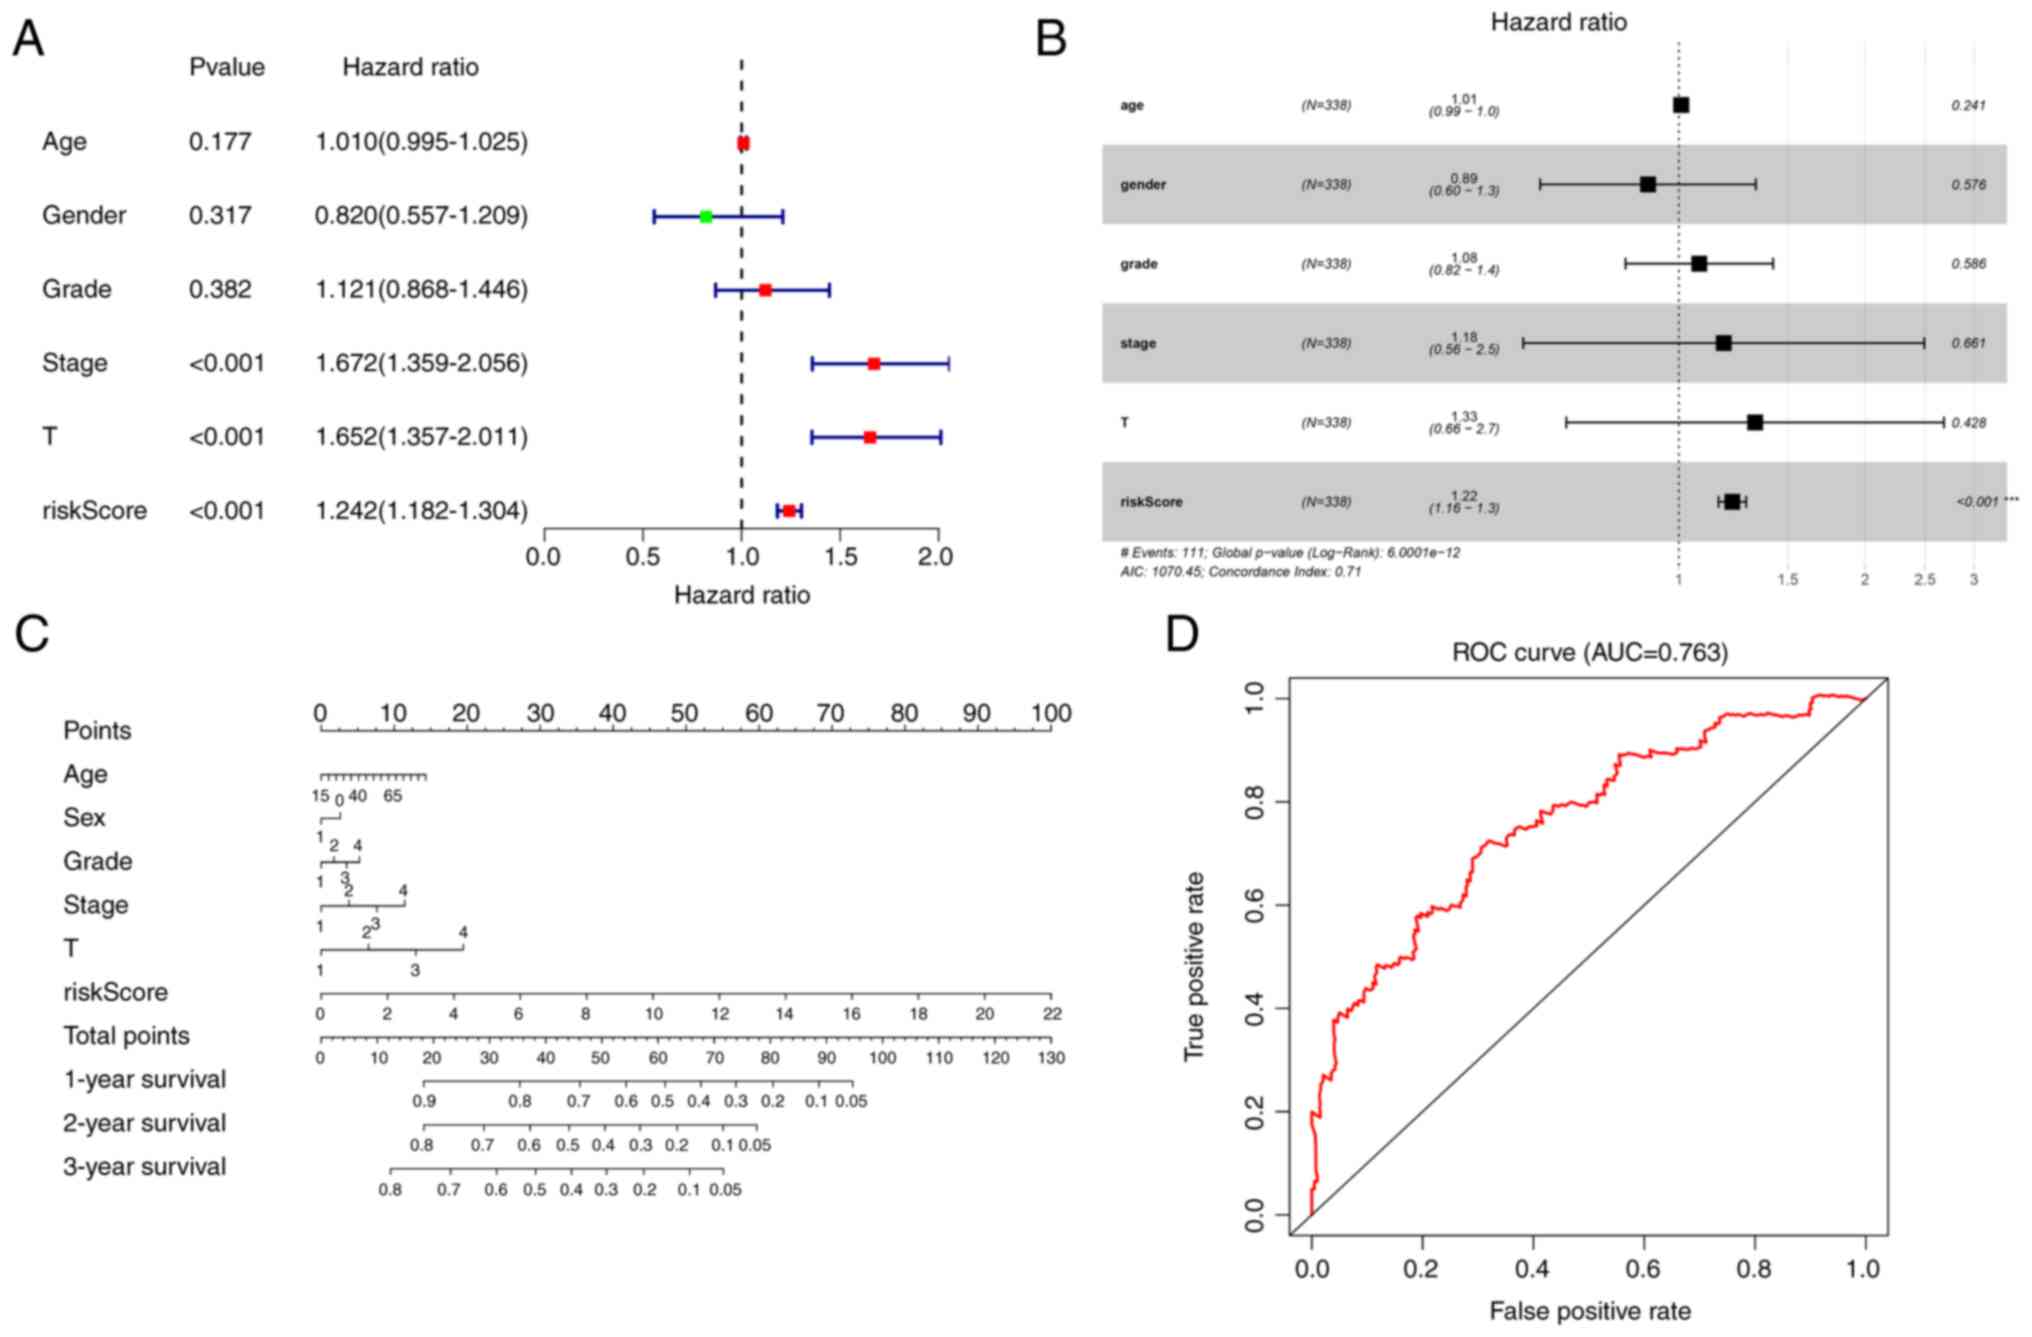
Univariate and multivariate Cox analyses were
conducted to determine whether the risk score can be an independent
prognostic factor. Univariate Cox analysis revealed that the risk
score was significantly associated with OS in TCGA cohort (hazard
ratio, 1.242; 95% confidence interval, 1.182–1.304; P<0.001;
Fig. 3A). Multivariate Cox
analysis demonstrated that the risk score was also an independent
prognostic factor, when combined with clinical information (hazard
ratio, 1.22; 95% confidence interval. 1.16–1.3; P<0.001;
Fig. 3B).
Construction of the nomogram
A nomogram was constructed, by combining the risk
score and clinical data including age, sex, grade, stage and
magnitude of tumor, to assess the survival of patients in TCGA
cohort (Fig. 3C). Prognostic ROC
analysis was performed to evaluate the accuracy of this nomogram.
The AUC at 3 years was 0.763 (Fig.
3D).
Immune status analysis
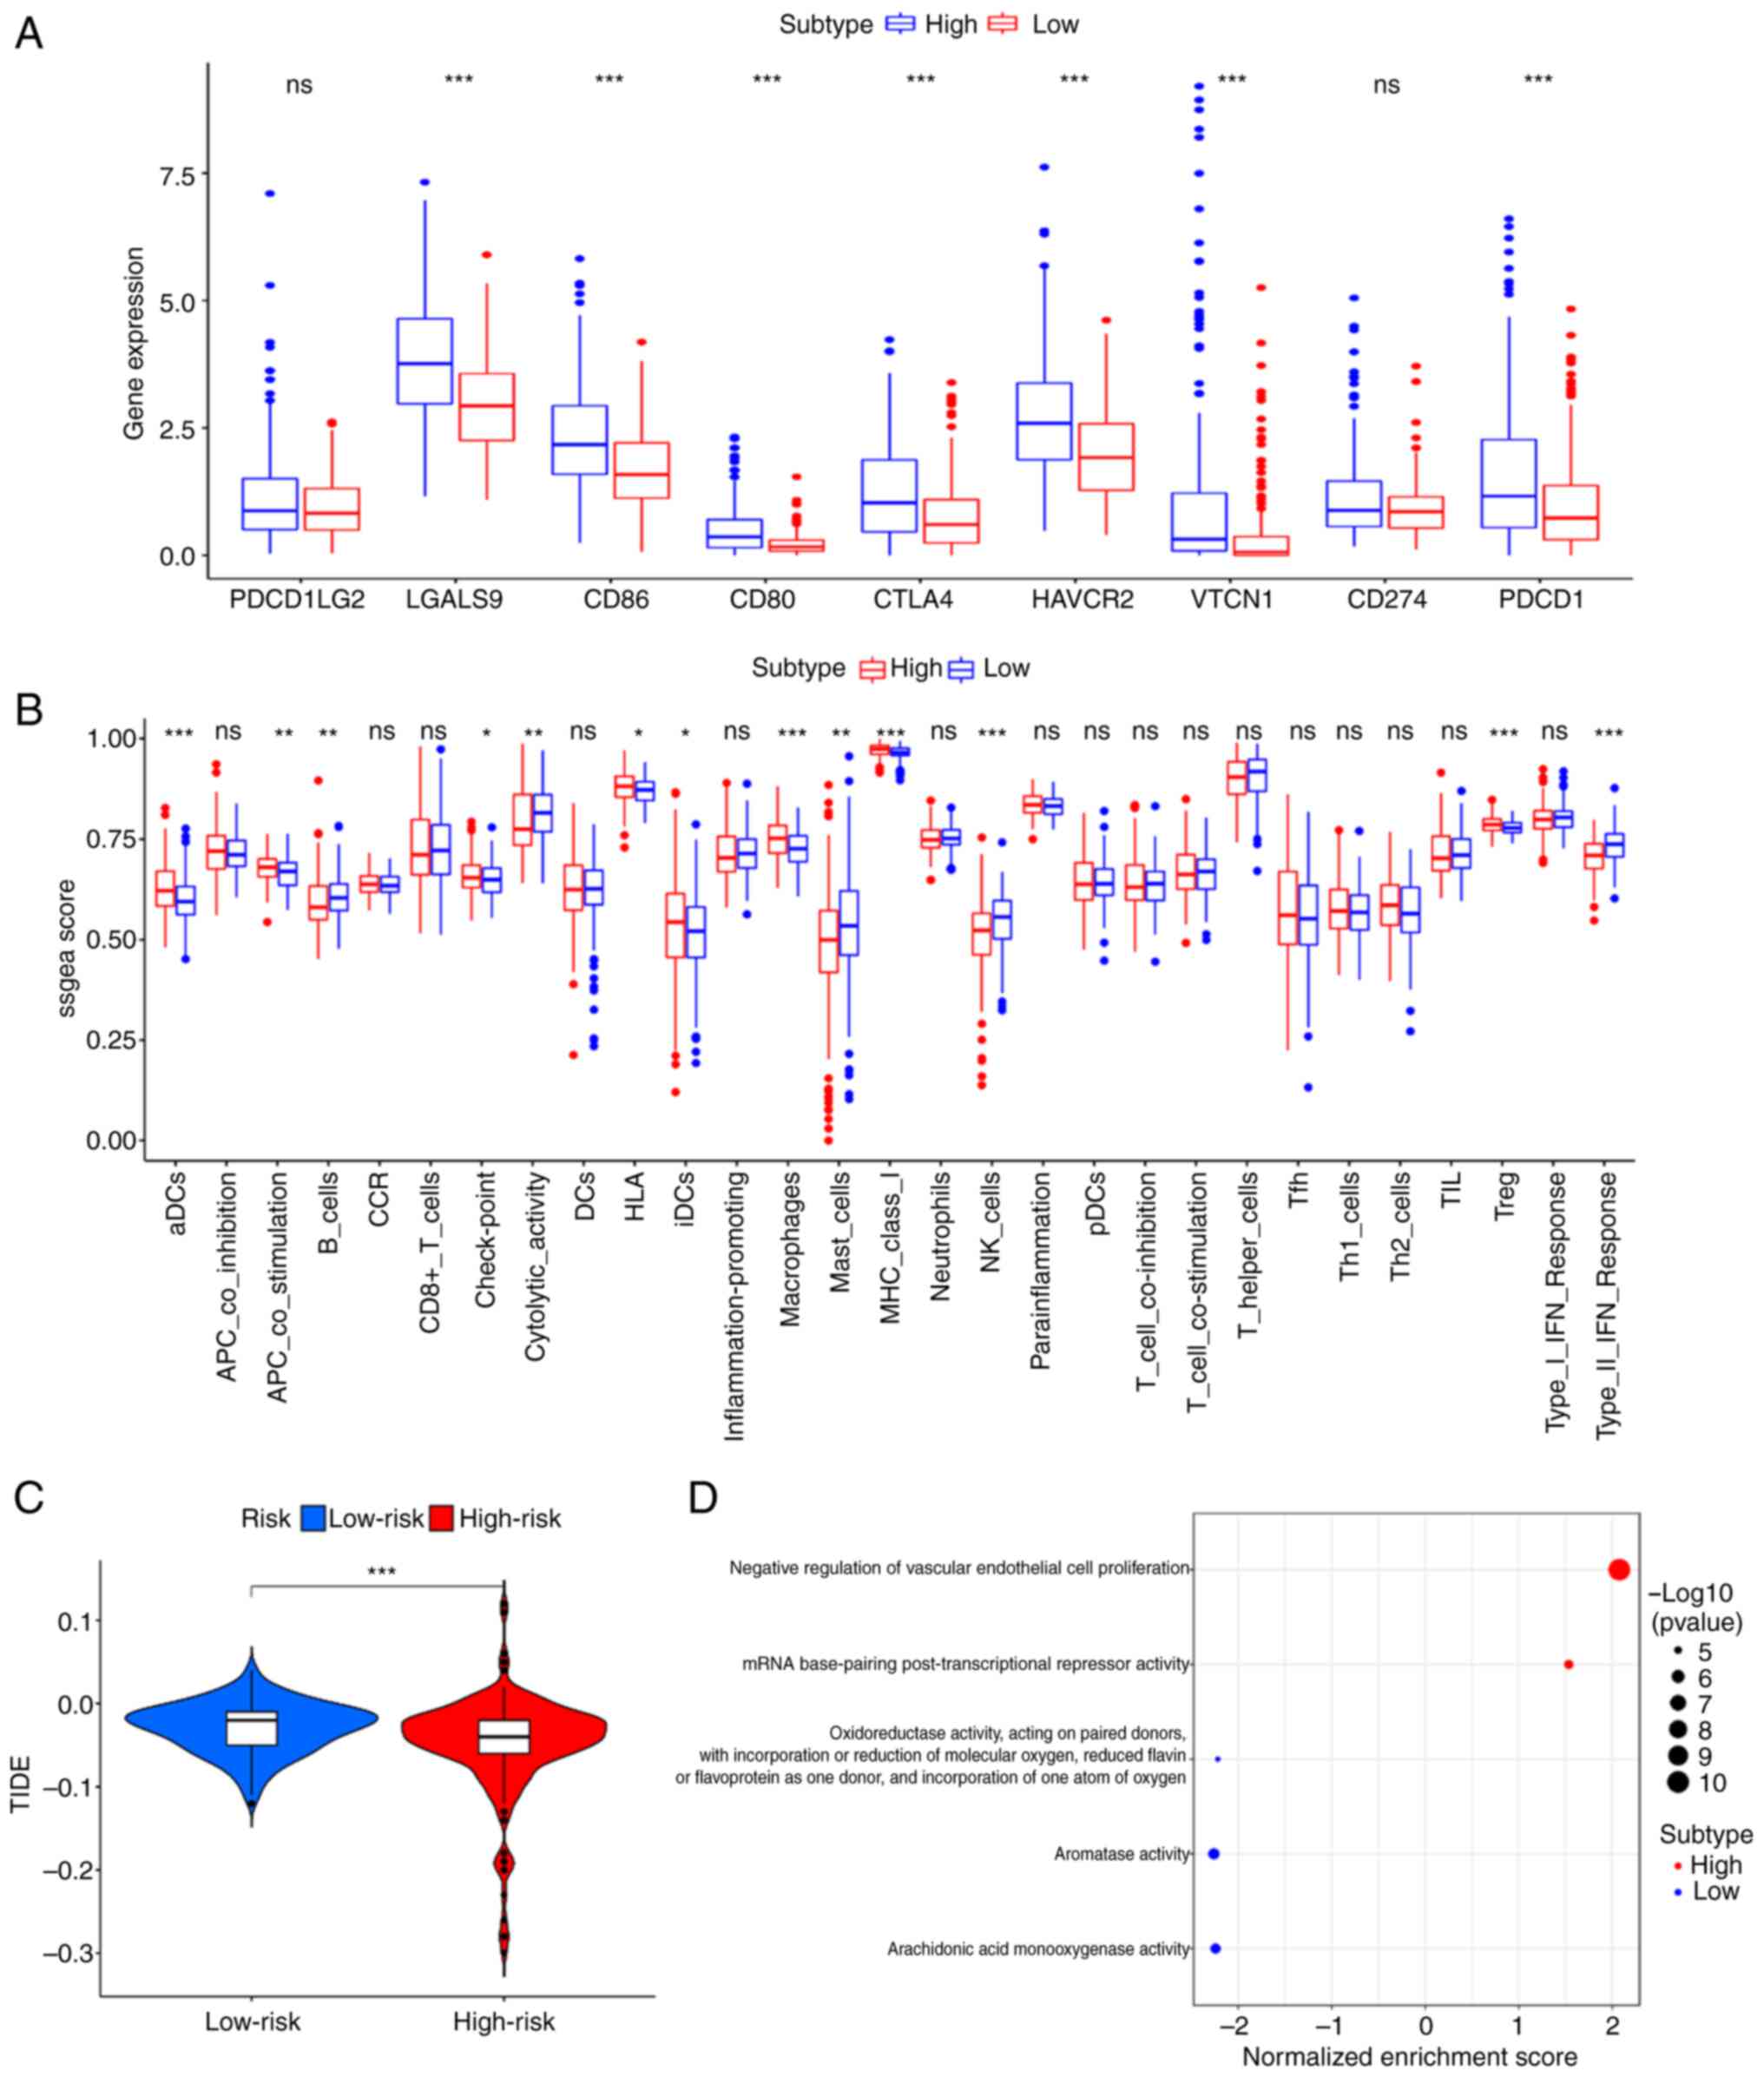
To consider the differences between the two
subgroups and provide a reference for immunotherapy, an immune
status analysis was conducted to explore the immune infiltration
levels (Fig. 4A). As shown in
Fig. 4A, the high-risk group had
higher immune infiltration levels in aDCs, APC_co_stimulation,
Check-point, HLA, iDCs, Macrophages, MHC_class I, and Treg and
lower levels in B_cells, Cytolytic_activity, Mast_cells, NK_cells,
and Type II_IFN_Response. Furthermore, the expression levels of
immune checkpoint genes (PDCD1, PDCD1LG2, CTLA4, CD80, CD86,
HAVCR2, LGALS9, CD274 and VTCN1) were significantly increased in
the high-risk group (Fig. 4B). The
immune prediction model identified that the TIDE score was
decreased in the high-risk group compared with that in the low-risk
group, indicating a worse immune response and poorer outcomes
following immunotherapy (Fig.
4C).
GO enrichment analysis
GO enrichment analysis was conducted using TCGA
cohort to reveal the molecular mechanism of the six-gene prognostic
model. As shown in Fig. 4D, two
signaling pathways, including the negative regulation of vascular
endothelial cell proliferation and mRNA base-pairing
post-transcriptional repressor activity were markedly enriched in
the high-risk group compared with the low-risk group.
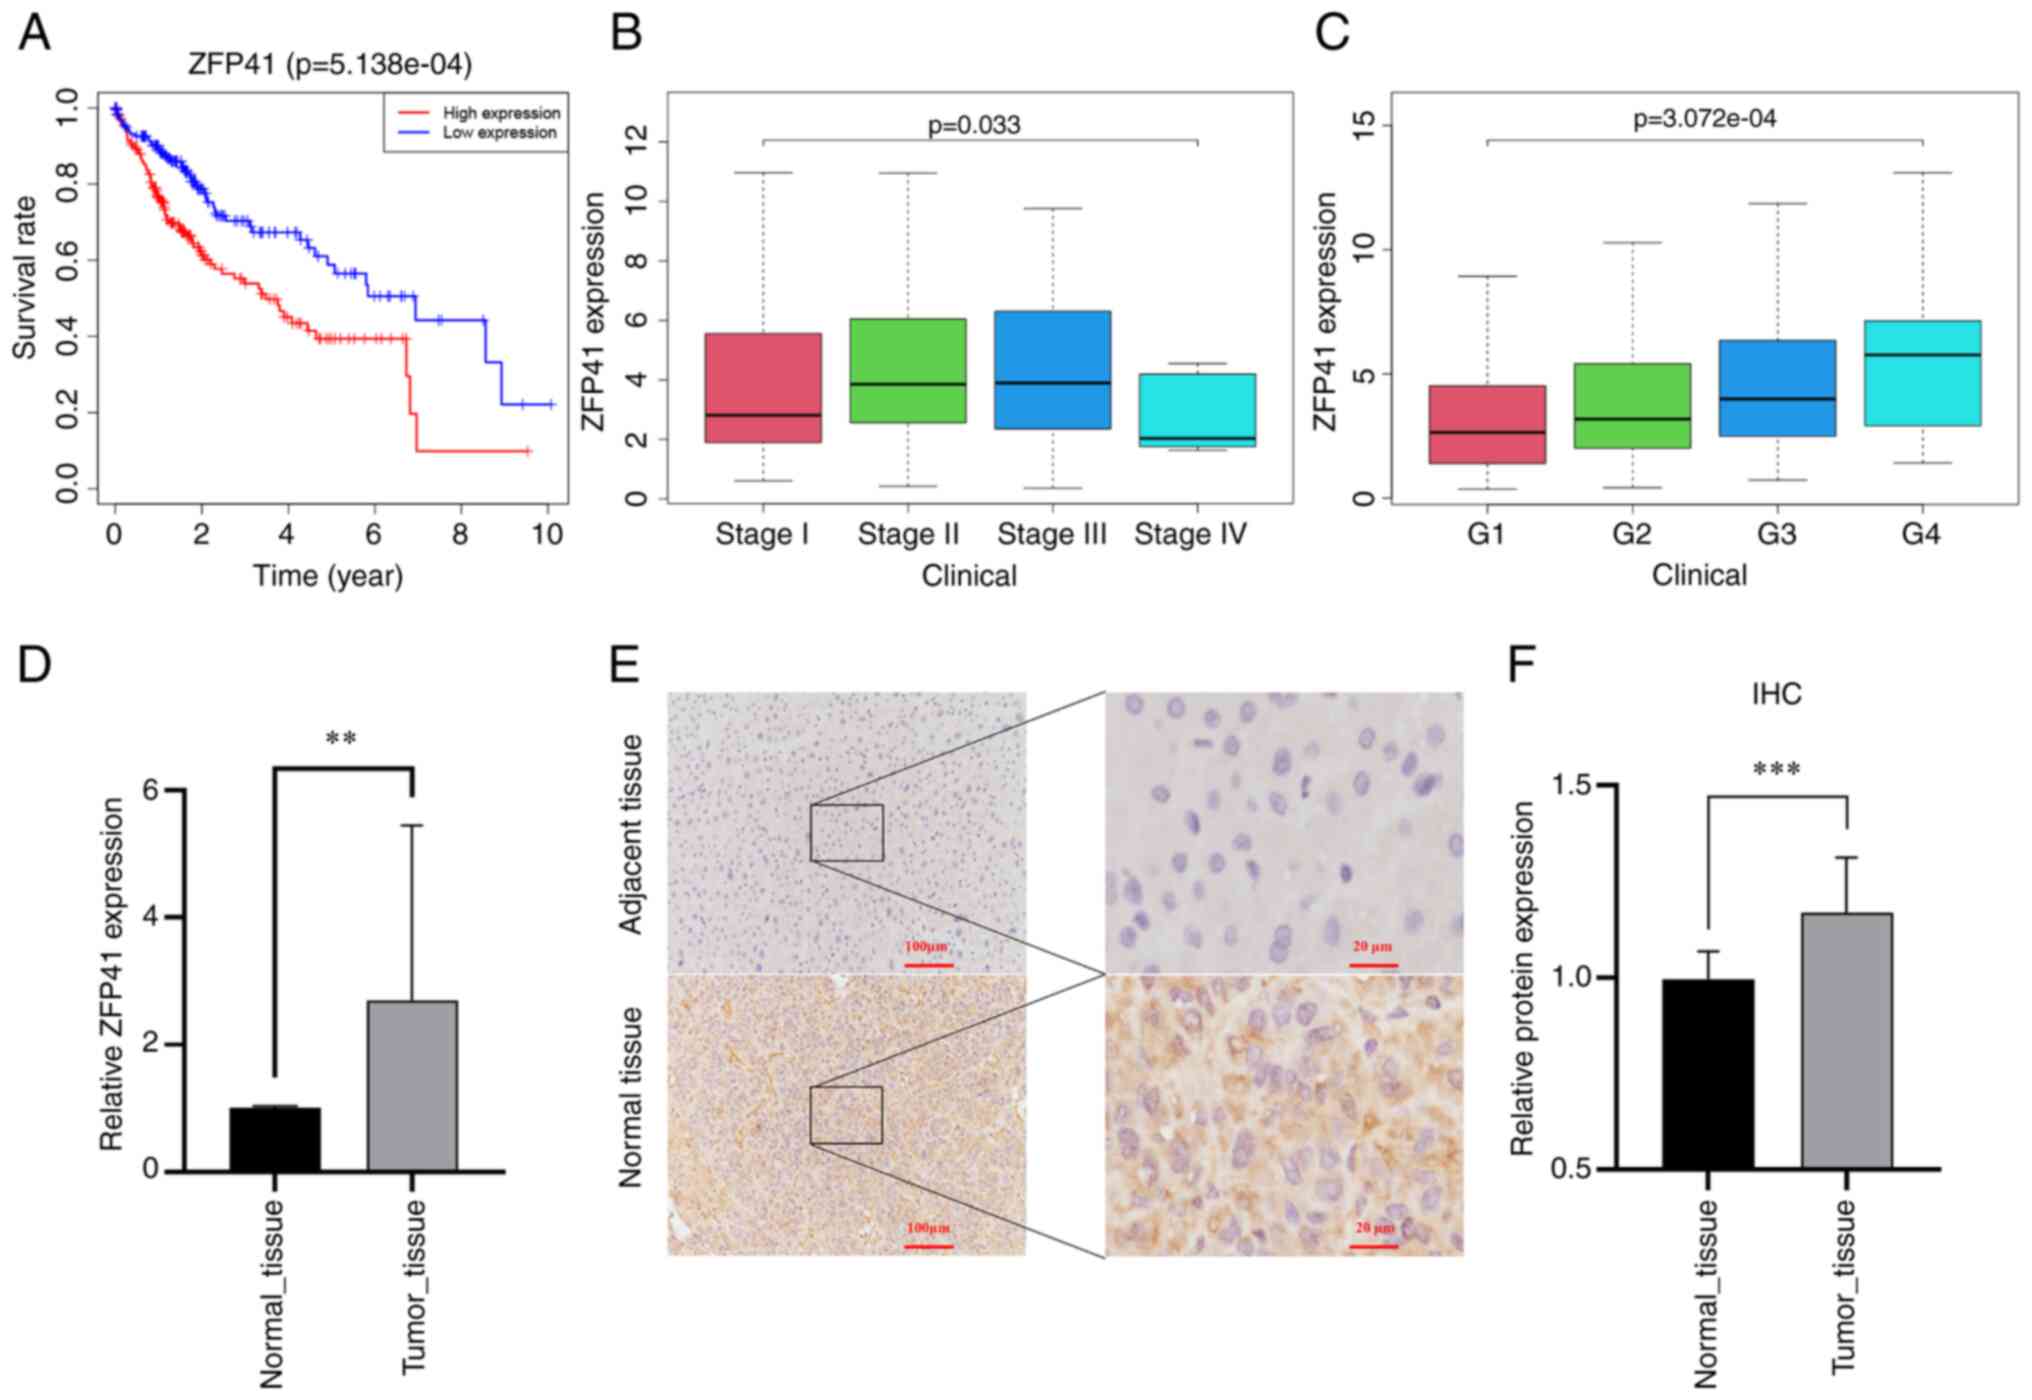
Survival analysis of ZFP41
In multivariate Cox regression analysis, the
coefficient of ZFP41 was the highest among the six model genes.
Survival analysis was conducted on ZFP41. Patients with a high
expression of ZFP41 had a significantly worse prognosis than
patients with a low expression of ZFP41 (P<0.001; Fig. 5A). The expression of ZFP41 was
found to be highly associated with the patient clinical
characteristics, including grade (P<0.001; Fig. 5B) and the stage of LIHC (P<0.05;
Fig. 5C).
High expression of ZFP41 in tumor
tissues
The differences in expression levels between tumor
and normal tissues were verified. A total of 22 pairs of HCC
tissues were collected for RT-qPCR to detect ZFP41 gene expression,
and eight pairs of HCC tissues were collected for
immunohistochemical analysis to detect ZFP41 protein expression.
The results of RT-qPCR revealed that the mRNA level of ZFP41 was
higher in the tumor tissues (P=0.004, Fig. 5D). Immunohistochemistry revealed
that the tumor tissue had a higher optical density per area than
the normal tissue (P<0.001; Fig.
5F), indicating that ZFP41 protein had a higher expression in
HCC tissues. Brown granules, which represented ZFP41 protein, were
more commonly observed in the HCC cytoplasm and intercellular
substance (Fig. 5E). The data
presented in Fig. 5F (optical
density) are based on the data presented in Fig. 5E (staining images).
ZFP41 plays a crucial role in Huh7 and
PLC cell viability in vitro
RT-qPCR was conducted to evaluate the mRNA level of
ZFP41 in Huh7 cells and assess the effects of shRNA targeting ZFP41
and overexpression plasmid for ZFP41. The mRNA expression of ZFP41
increased in the cells overexpressing ZFP41 (Huh7 cells: NC vs.
OE-ZFP41, P=0.007; PLC cells: NC vs. OE-ZFP41, P<0.001; Fig. 6A and C) and decreased in the cells
transfected with shRNA (SH2-ZFP41 and SH4-ZFP41; Huh7 cells: SH-NC
vs. SH2-ZFP41, P=0.016; SH-NC vs. SH2-ZFP41, P=0.004; PLC cells:
SH-NC vs. SH2-ZFP41, P<0.001; SH-NC vs. SH4-ZFP41, P<0.001;
Fig. 6B and D).
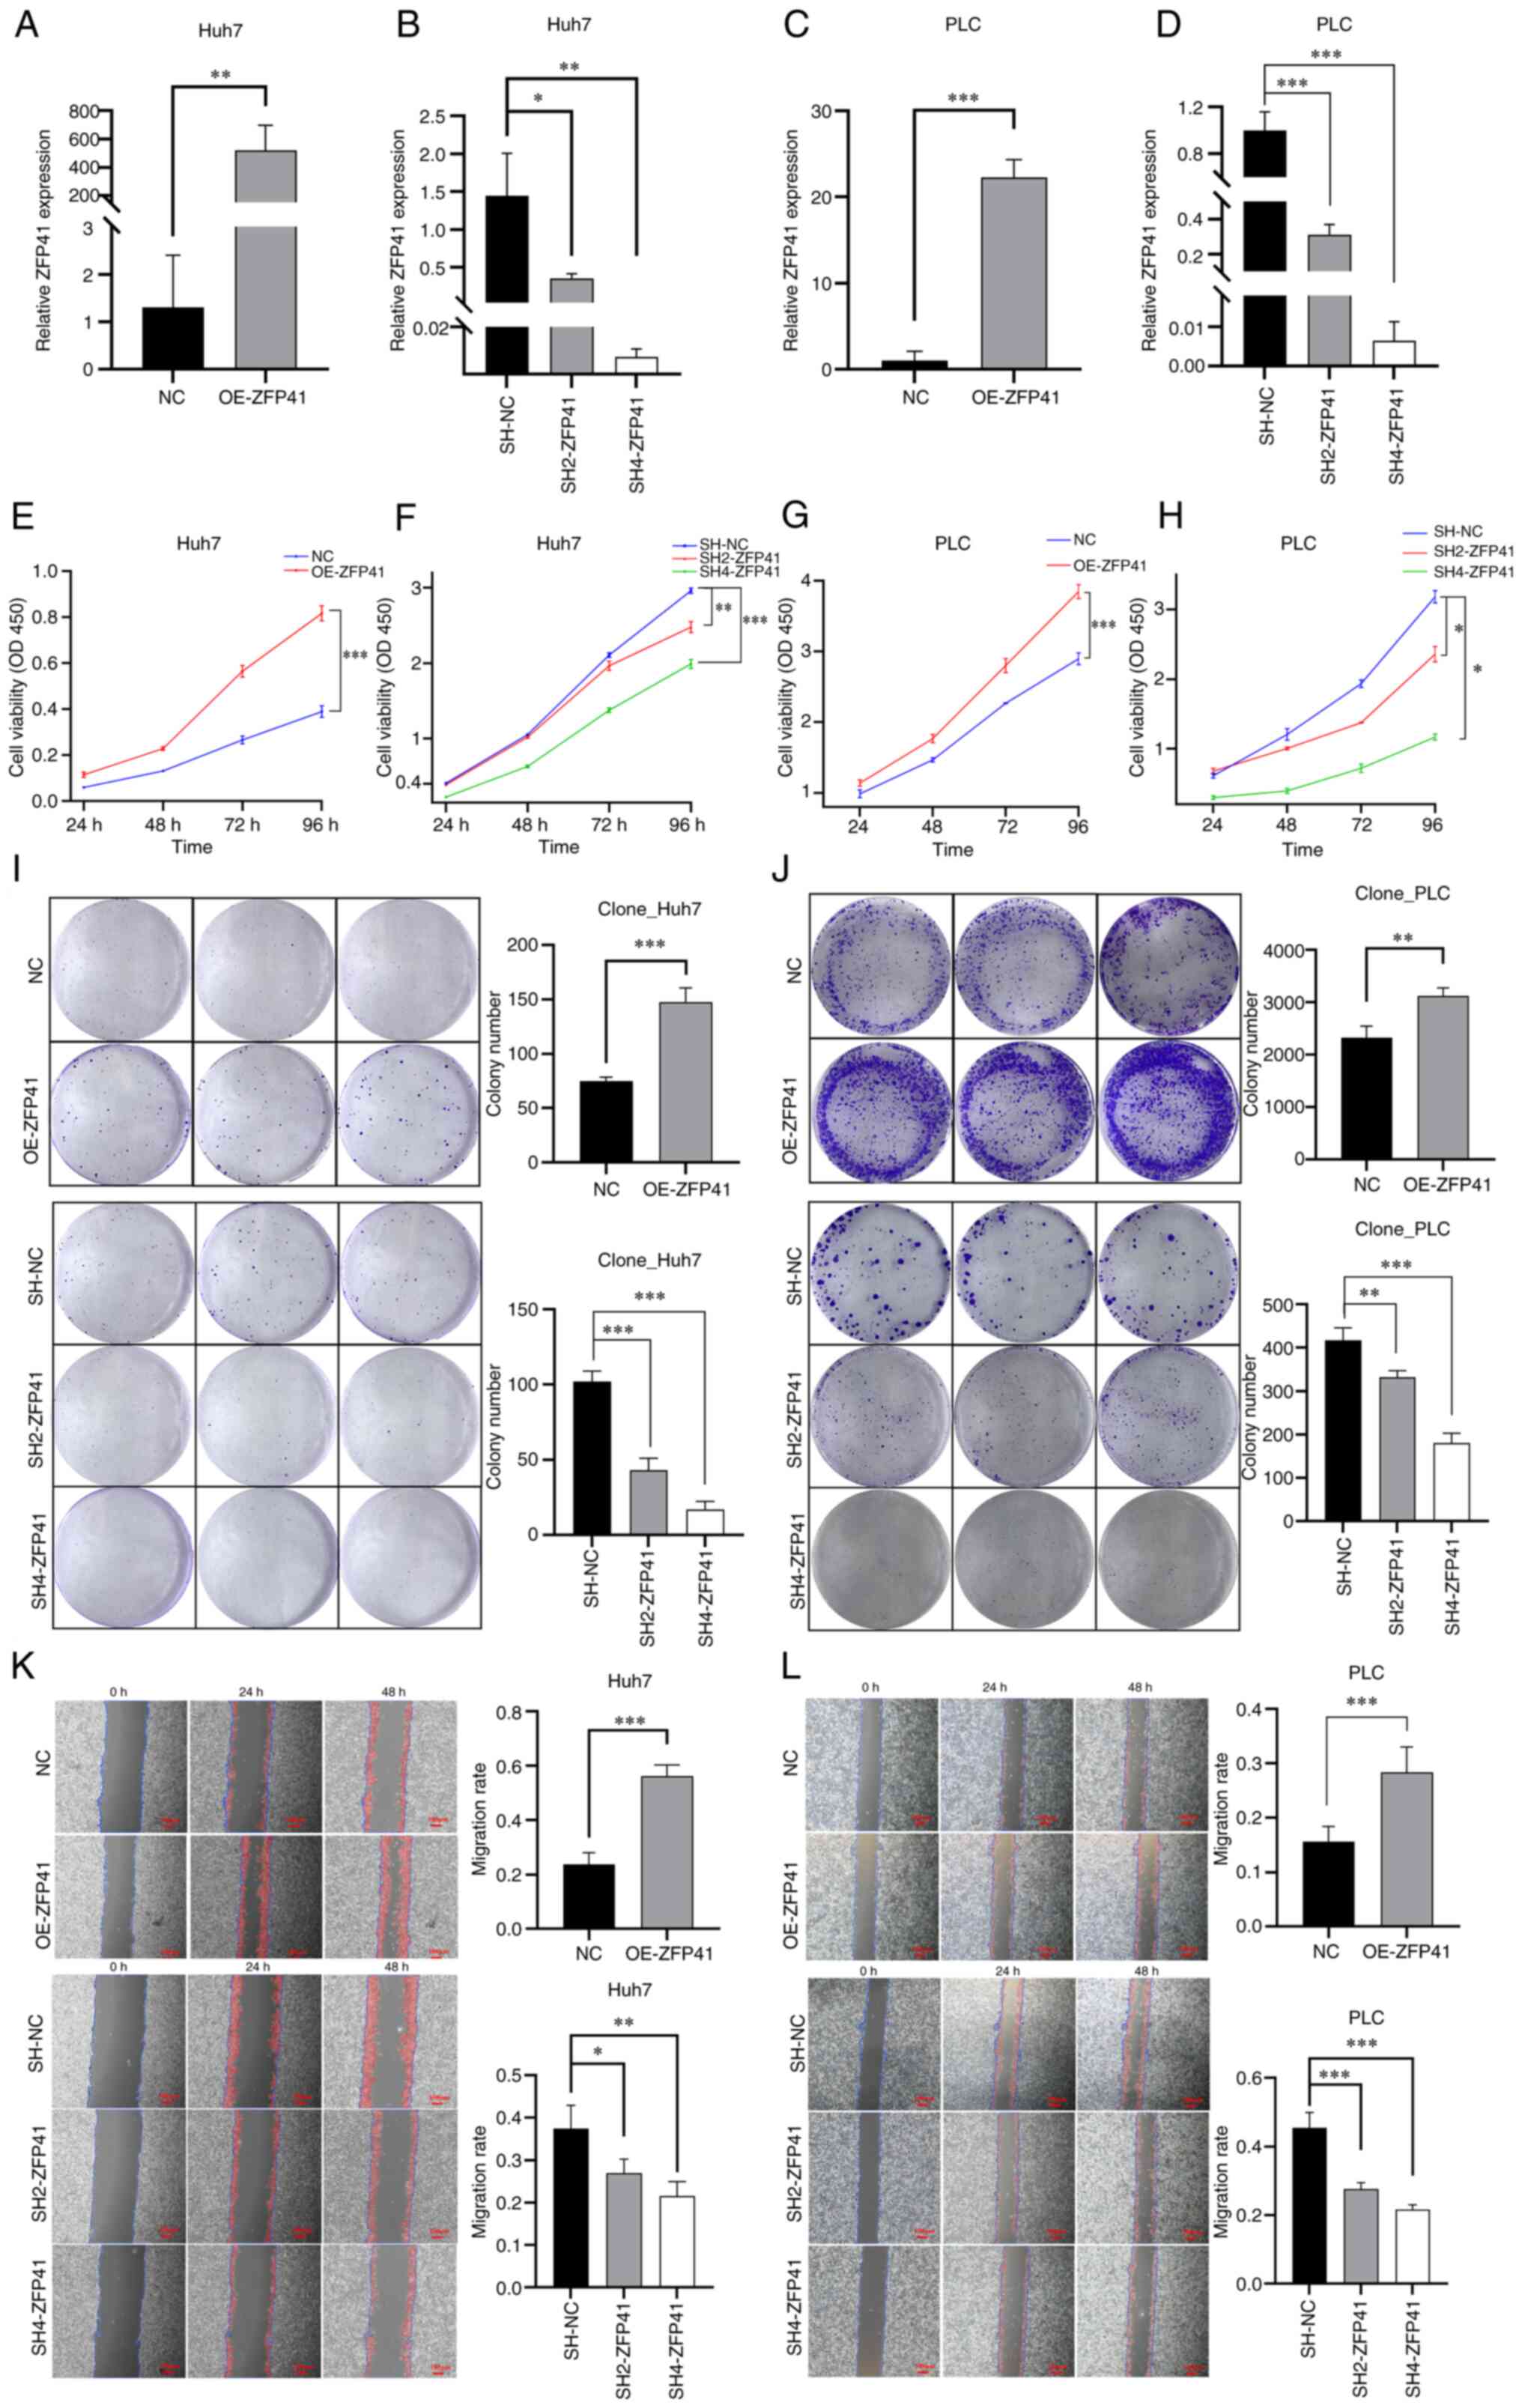 | Figure 6.Effects of ZFP41 on cell viability
and proliferation in vitro. (A and C) RT-qPCR results of
OE-ZFP41 cells and normal cells (NC) in Huh7 and PLC cell lines. NC
cells were cells transfected with blank vectors. (B and D) RT-qPCR
results of SH2-ZFP41 cells, SH4-ZFP41 cells and NC cells (Huh7 and
PLC cell lines). NC cells were cells transfected with blank
vectors. (E and G) Results of CCK-8 assay of OE-ZFP41 cells and
normal Huh7 cells (F and H) Results of CCK-8 assay of SH2-ZFP41
cells, SH4-ZFP41 cells and NC cells (Huh7 and PLC cell lines). (I
and J) Results of colony formation assay of OE-ZFP41 cells and
normal cells, and SH2-ZFP41 cells, SH4-ZFP41 cells and NC cells
(Huh7 and PLC cell lines). (K and L) Results of scratch wound
healing assay of OE-ZFP41 cells and NC cells, and SH2-ZFP41 cells,
SH4-ZFP41 cells and NC cells (Huh7 and PLC cell lines). *P<0.05,
**P<0.01 and ***P<0.001. RT-qPCR, reverse
transcription-quantitative PCR; OE, overexpression; SH, shRNA. |
The results of CCK-8 assay revealed that after ZFP41
was overexpressed, the viability of the Huh7 and PLC cells
significantly increased (Huh7 cells: NC vs. OE-ZFP41, P<0.001;
PLC cells: NC vs. OE-ZFP41, P<0.001; Fig. 6E and G). Following the knockdown of
ZFP41, the Huh7 and PLC cells exhibited a reduced viability (Huh7
cells: SH-NC vs. SH2-ZFP41, P=0.006; SH-NC vs. SH2-ZFP41,
P<0.001; PLC cells: SH-NC vs. SH2-ZFP41, P=0.024; SH-NC vs.
SH4-ZFP41, P=0.01; Fig. 6F and H).
Hence, ZFP41 plays an important role in HCC cell survival.
ZFP41 plays a crucial role in Huh7 And
PLC cell proliferation in vitro
Colony formation assay was conducted to assess the
proliferation of the Huh7 and PLC cells following the
overexpression and knockdown of the ZFP41 gene. The average size of
cell colony clusters in the ZFP41-overexpressing cells was
significantly higher than that in normal cells (Huh7 cells: NC vs.
OE-ZFP41, P<0.001; PLC cells: NC vs. OE-ZFP41, P=0.008; Fig. 6I and J). The average size of cell
colony clusters in the shRNA-transfected cells (SH2-ZFP41 and
SH4-ZFP41) was lower than that in normal cells (Huh7 cells: SH-NC
vs. SH2-ZFP41, P<0.001; SH-NC vs. SH2-ZFP41, P<0.001; PLC,
SH-NC vs. SH2-ZFP41, P=0.001; SH-NC vs. SH4-ZFP41, P<0.001;
Fig. 6I and J). Hence, the results
demonstrated that ZFP41 plays a crucial role in HCC cell
proliferation and the SH4-RNA sequence exhibited a high knockdown
efficiency.
ZFP41 plays a crucial role in Huh7 And
PLC cell migration and invasion in vitro
Scratch wound healing and Transwell assays were
conducted to evaluate the migratory and invasive ability of the
cells following the overexpression and knockdown of the ZFP41 gene.
The results of scratch wound healing assay demonstrated that the
healing speed of the OE-ZFP41 cell cluster was higher than that of
the normal cell cluster (Huh7 cells: NC vs. OE-ZFP41, P<0.001;
PLC cells: NC vs. OE-ZFP41, P<0.001; Fig. 6K and L). The healing speed of the
SH2-ZFP41 cell and SH4-ZFP41 cell clusters (cells transfected with
shRNA) was lower than that of the normal cell cluster (Huh7 cells:
SH-NC vs. SH2-ZFP41, P=0.016; SH-NC vs. SH2-ZFP41, P=0.001; PLC
cells: SH-NC vs. SH2-ZFP41, P<0.001; SH-NC vs. SH4-ZFP41,
P<0.001; Fig. 6I and J).
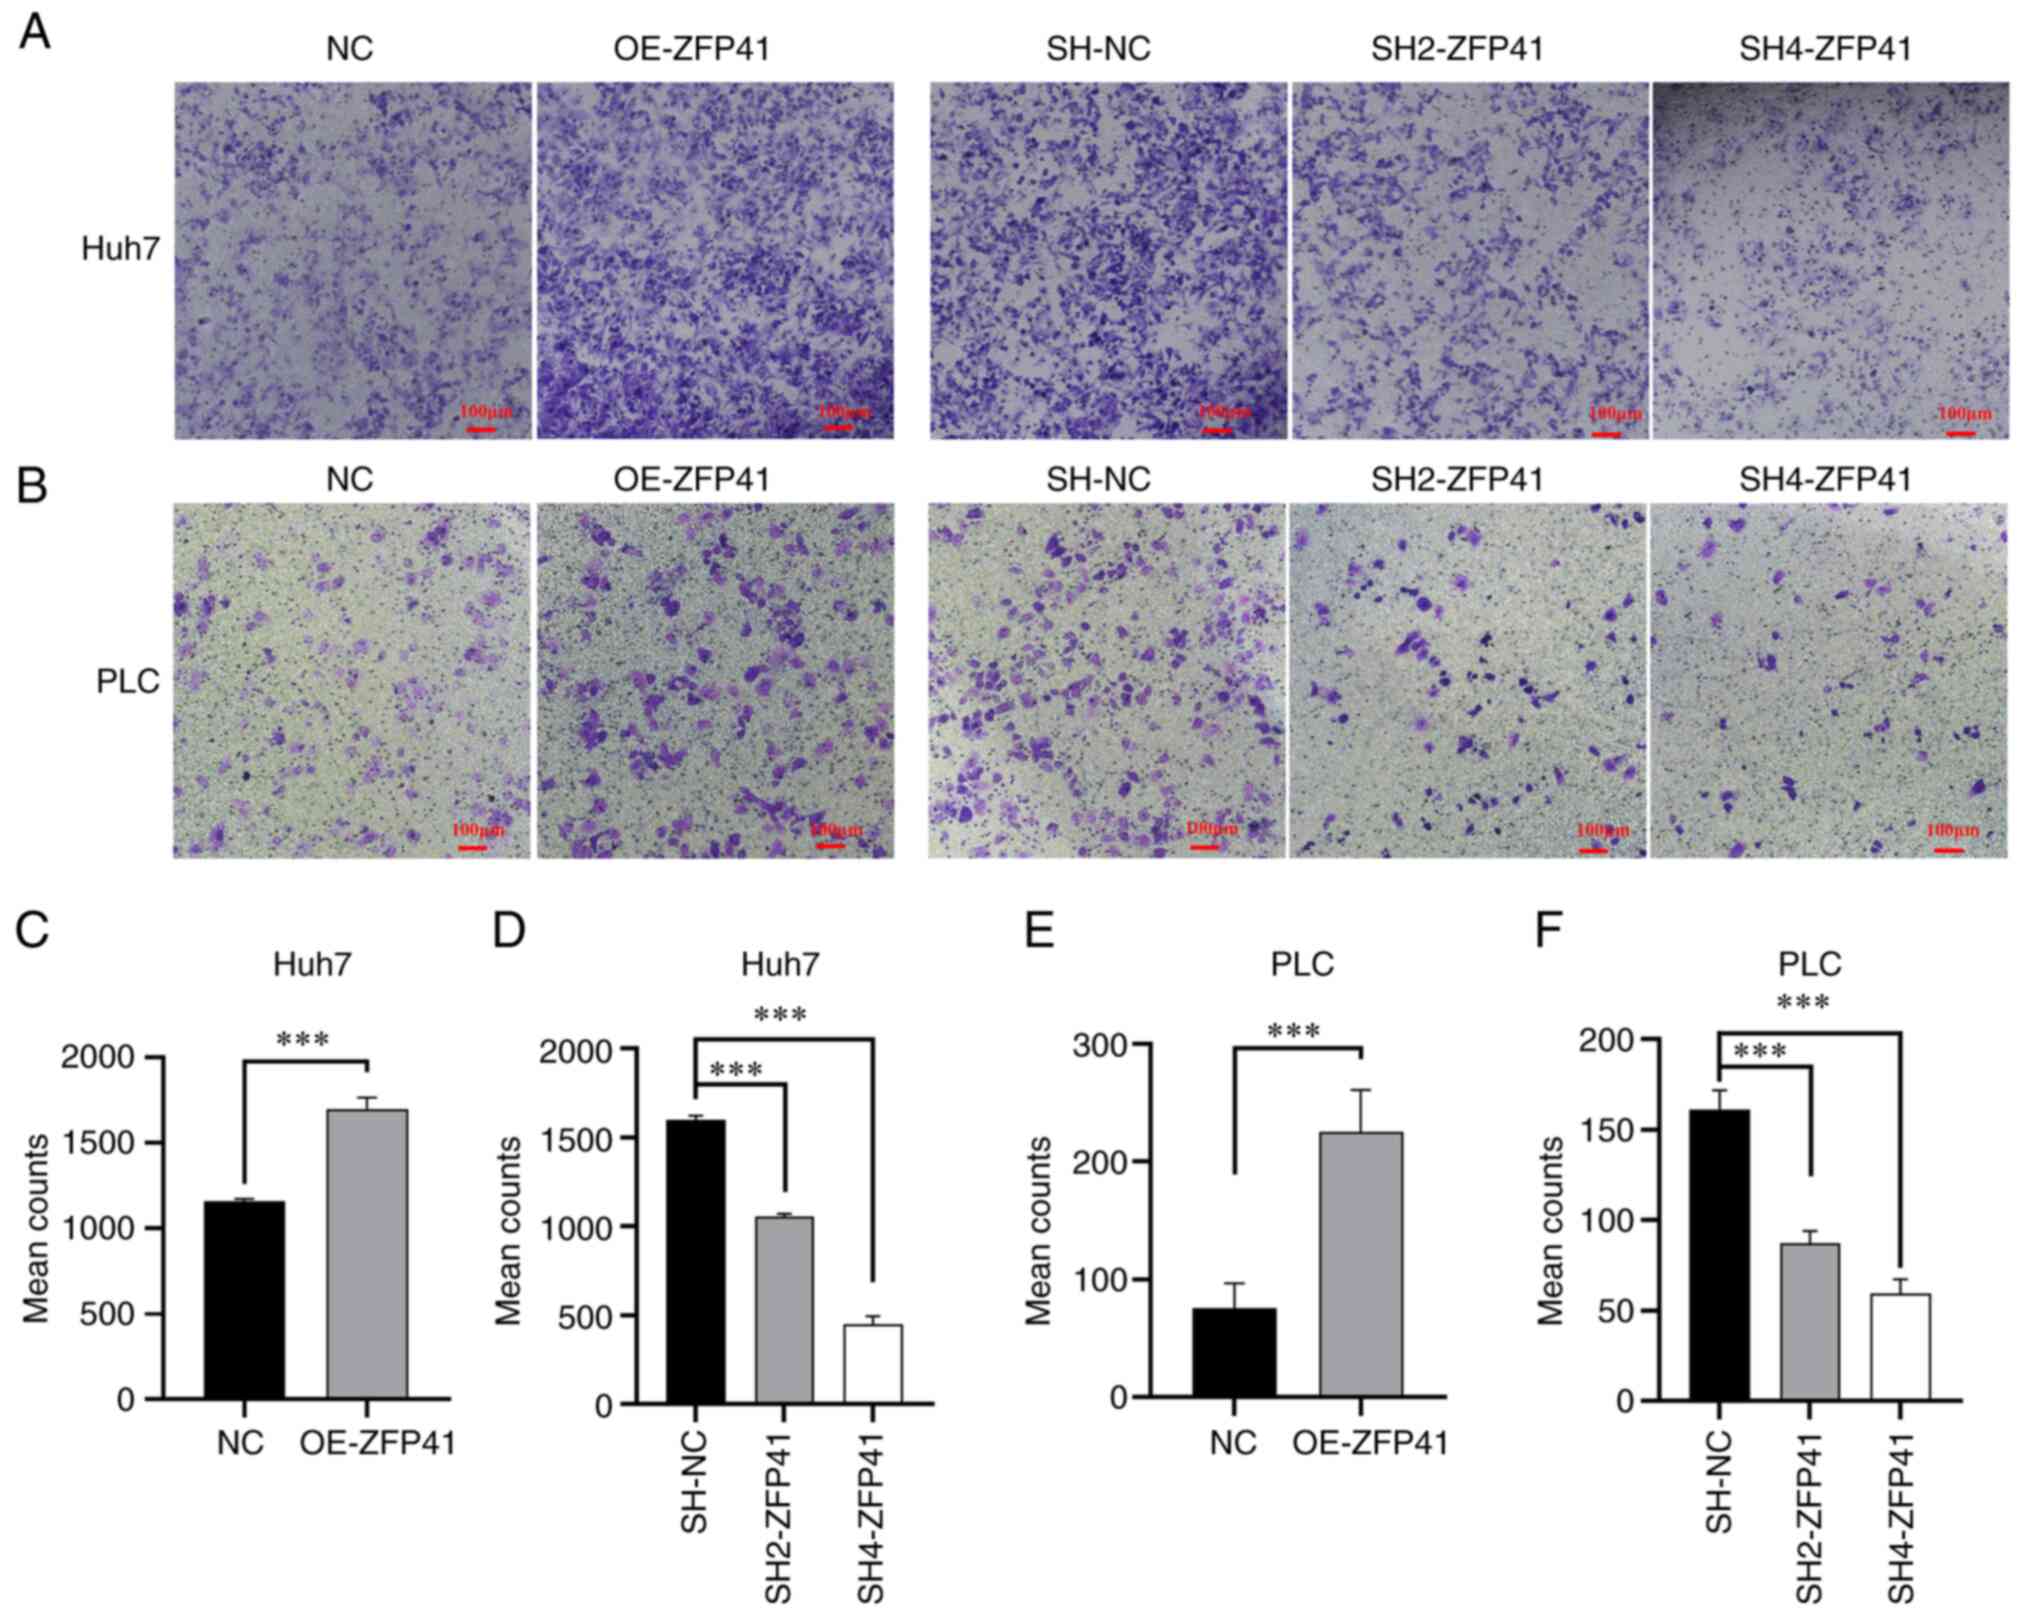
The density of the transfected Huh7 and PLC cells
outside the Transwell chamber is illustrated in Fig. 7A and B. The density of the
ZFP41-overexpressing cells outside the Transwell chamber was higher
than that of the normal cell cluster (Huh7 cells: NC vs. OE-ZFP41,
P<0.001; PLC cells: NC vs. OE-ZFP41, P<0.001; Fig. 7C and E). The density of the
SH2-ZFP41 and SH2-ZFP41 cells (cells transfected with shRNA)
outside the Transwell chamber was lower than that of the normal
cell cluster (Huh7 cells: SH-NC vs. SH2-ZFP41, P<0.001; SH-NC
vs. SH2-ZFP41, P<0.001; PLC cells: SH-NC vs. SH2-ZFP41,
P<0.001; SH-NC vs. SH4-ZFP41, P<0.001; Fig. 7D and F). These experimental results
illustrated that ZFP41 plays a crucial role in HCC cell
metastasis.
ZFP41 plays a crucial role in the HCC
cell glycolytic status
Co-expression analysis demonstrated the simple
linear regression association between ZFP41 and certain known key
genes of anaerobic glycolysis (ALDOA, ENO1, GADPH and PFKL,
P<0.001; PKM, P=0.011; PGK1, P=0.021; Fig. 8A-C, F, H and I). The results of
glucose uptake assay revealed that the ZFP41-overexpressing cells
had a higher glucose uptake (Huh7 cells: NC vs. OE-ZFP41, P=0.007;
PLC cells: NC vs. OE-ZFP41, P=0.007; Fig. 8K), and that the SH2-ZFP41 and
SH2-ZFP41 cells had a lower glucose uptake (Huh7 cells: SH-NC vs.
SH2-ZFP41, P=0.006; SH-NC vs. SH2-ZFP41, P<0.001; PLC cells:
SH-NC vs. SH2-ZFP41, P<0.006; SH-NC vs. SH4-ZFP41, P<0.001;
Fig. 8L). The results of lactic
acid generation assay demonstrated that ZFP41-overexpressing cells
had higher lactate generation levels (Huh7 cells: NC vs. OE-ZFP41,
P=0.002; PLC cells: NC vs. OE-ZFP41, P=0.002; Fig. 8M), and the SH2-ZFP41 and SH2-ZFP41
cells had lower lactate generation levels (Huh7 cells: SH-NC vs.
SH2-ZFP41, P=0.009; SH-NC vs. SH2-ZFP41, P<0.001; PLC cells:
SH-NC vs. SH2-ZFP41, P=0.008; SH-NC vs. SH4-ZFP41, P<0.001;
Fig. 8N). On the whole, the
co-expression analysis and in vitro experiments indicated
that ZFP41 plays a crucial role in the HCC cell glycolytic
status.
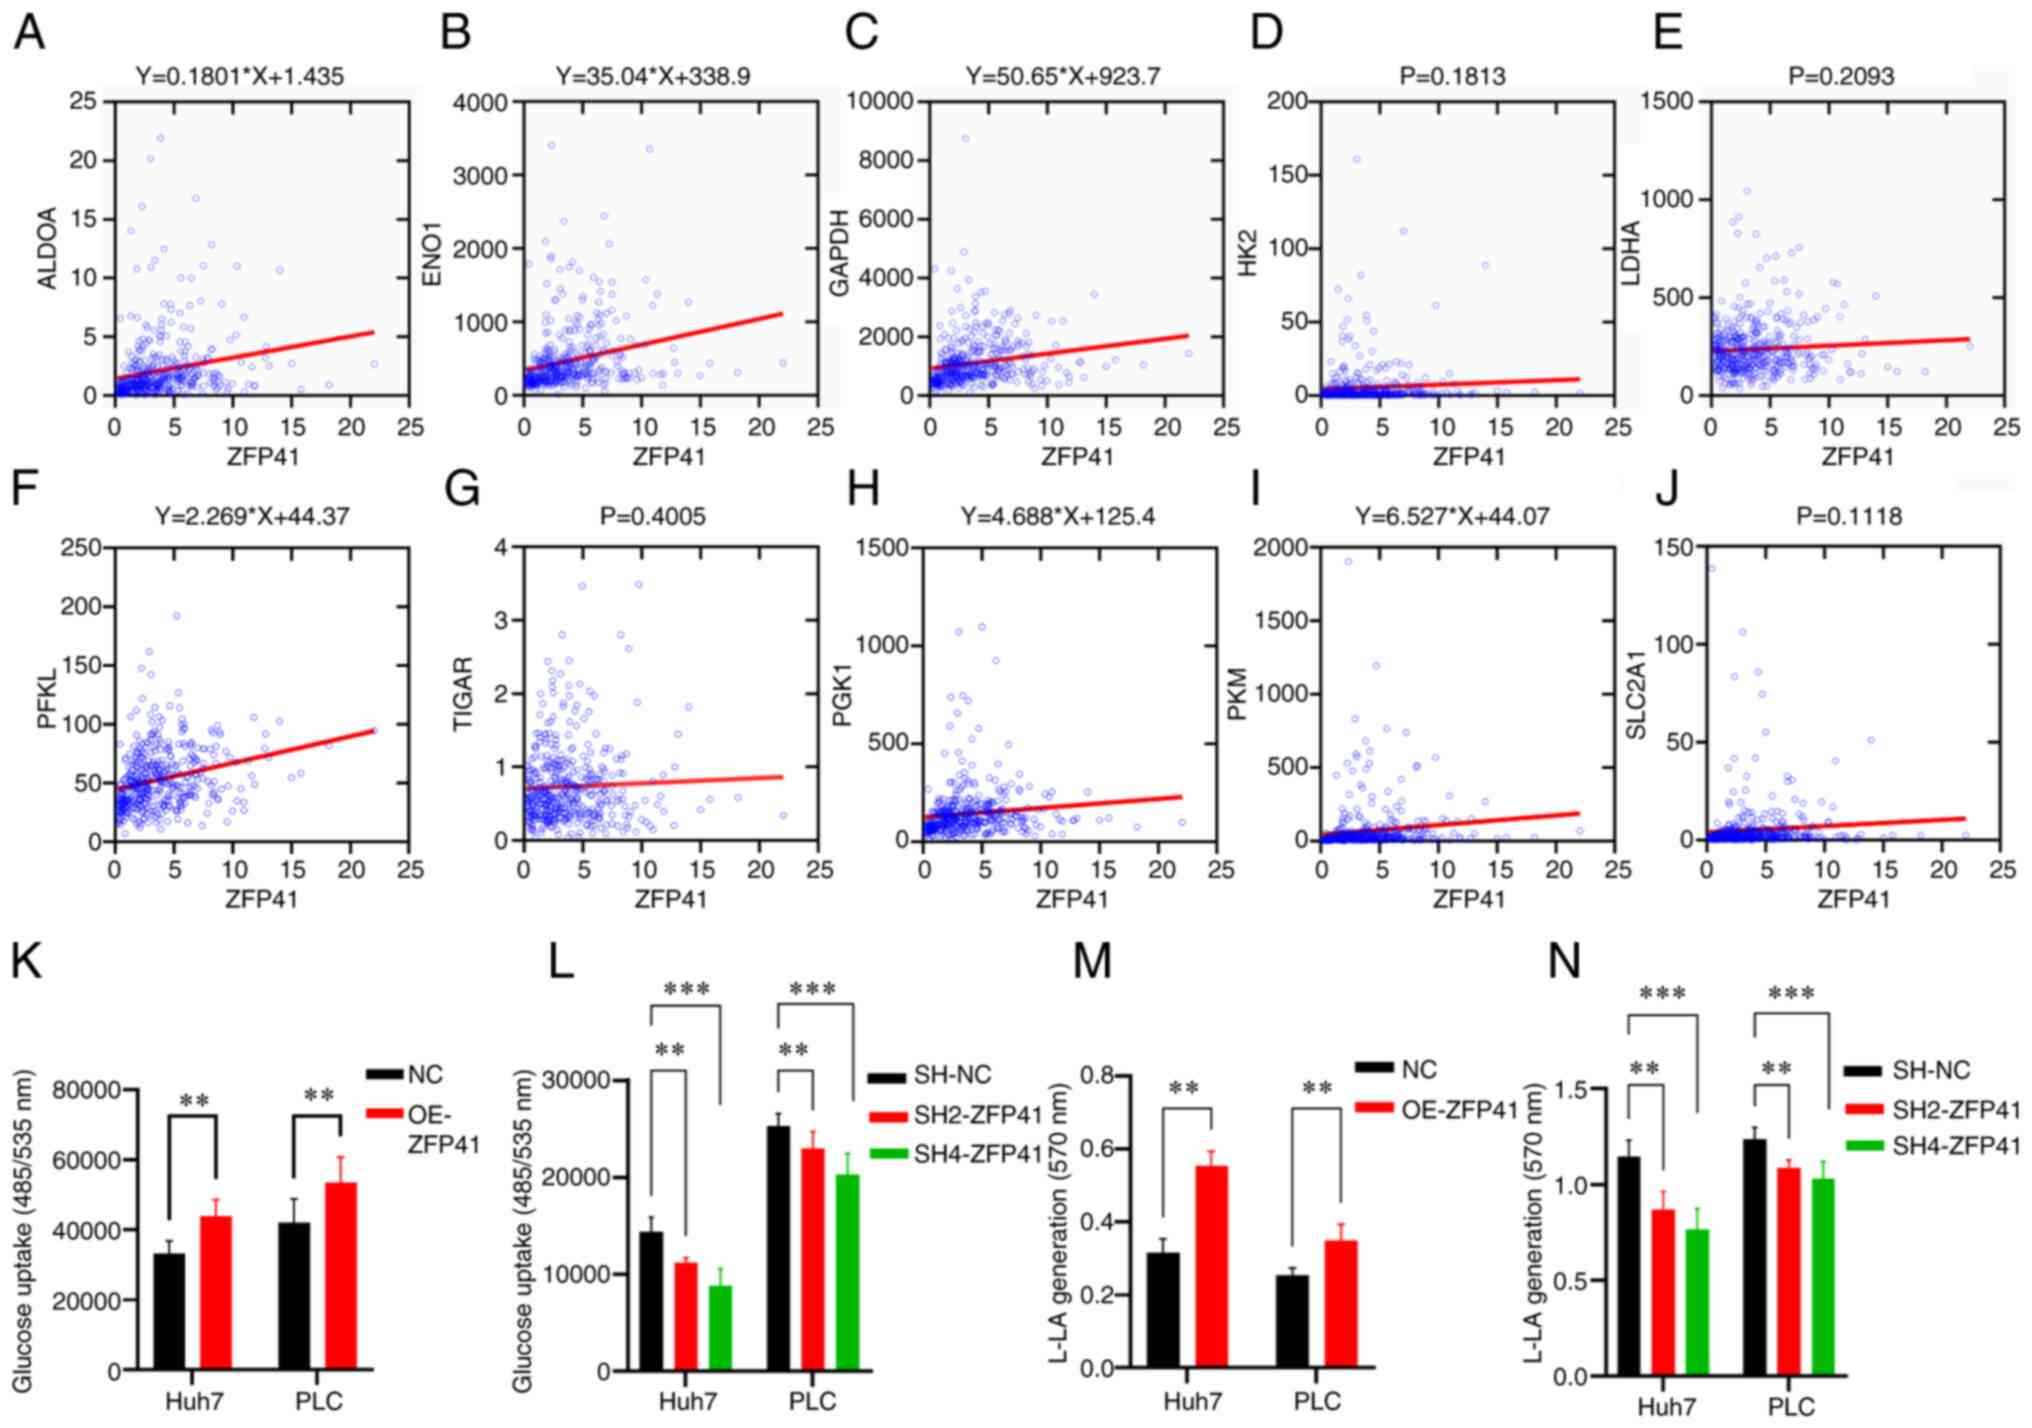 | Figure 8.Association between ZFP41 and
glycolysis. (A-J) Co-expression analysis between ZFP41 and 10 key
glycolysis gene (ALDOA, ENO1, GAPDH, HK2, LDHA, PFKL, TIGAR, PGK1,
PKM and SLC2A1). When P<0.05, a linear regression equation was
drawn as the title of the diagram. (K and L) Glucose uptake
cell-based assay results of OE-ZFP41 cells and NC cells, and
SH2-ZFP41 cells, SH4-ZFP41 cells and NC cells (Huh7 and PLC cell
lines). (M and N) Lactate generation assay results of OE-ZFP41
cells and NC cells, and SH2-ZFP41 cells, SH4-ZFP41 cells and NC
cells (Huh7 and PLC cell lines). **P<0.01 and ***P<0.001. OE,
overexpression; SH, shRNA. |
Discussion
HCC is the most common primary liver malignancy and
the third leading cause of cancer-related mortality worldwide
(1,2,16–18).
Although the targeted immunotherapy of HCC has made significant
progress, the prognosis of patients with HCC remains unsatisfactory
(19). One of the key reasons for
the poor prognosis of patients with HCC is its high intratumor
genomic heterogeneity (7,8,20).
The distinctive genomic alterations, biological behavior and local
microenvironments lead to different responses to similar types of
immunotherapy (20). The molecular
basis governing immune responses and evasion remains unclear, and
validated biomarkers are not yet available to guide clinical
decision making (21–23). Glycolysis plays a critical role in
tumor proliferation and metastasis. Glycolysis-related genes
improve the energy consumption and biomacromolecule accumulation of
tumor cells, thereby affecting the tumor microenvironment and
inhibiting immunity through lactate accumulation (24–26).
Thus, the activated glycolysis pathway thus is highly associated
with a poor prognosis and is key to the exploration of potential
biomarkers.
In the present study, the scRNA data were obtained
from GSE146115. The authors reconstructed single-cell and
single-variant clonal evolution in human HCC in the original study
of this dataset (27). It served
as a reference for the investigation of the heterogeneity of
glycolysis in HCC. In the present study, HCC cells were categorized
based on their distinct glycolytic states. Previous research has
demonstrated that monocytes display great heterogeneity among
various tumors and control tumor malignancy and that stromal cells
can modulate tumor stiffness and facilitate cancer progression by
secreting relevant factors to the extracellular matrix (10). The activation of glycolysis in
macrophages and endothelial cells can regulate the development of
HCC, which is associated with a poor prognosis (28–30).
Consistent with previous findings, the present study found that
macrophages and endothelial cells presented higher glycolytic
state. Their marker genes were selected to construct a prognostic
model. The glycolysis model combined with clinical features can
accurately assess the prognosis of patients with HCC with an AUC
>0.763.
To explore the regulatory mechanisms of the
glycolysis model, immune state analysis was conducted. The
high-risk group had higher levels of aDCs, APC_co_stimulation,
check-point, HLA, iDCs, Macrophages, MHC class I and Tregs. These
cells have been reported to promote immune tolerance and
immunosuppression, which are associated with a poor prognosis
(30–36). Moreover, B cells, Cytolytic
activity, Mast cells, NK cells and Type II IFN Response were lower
in the high-risk group. Their levels reflected the antitumor effect
by inhibiting cell proliferation, and inhibiting angiogenesis and
promoting apoptosis (37–39). These findings suggest that the risk
score reflects the immunosuppressive microenvironment of HCC. To
determine the effect of immunotherapy, the expression of checkpoint
genes was examined. In tumor cells, checkpoint genes can suppress
antitumor immune responses in solid tumors (35), and immune-checkpoint inhibitors can
provide clinical benefits (40).
Fu et al (41) established
a large-scale model to predict the response to immunotherapy, where
a lower TIDE score predicted a higher possibility to respond to
immunotherapy. In the present study, it was found that high-risk
group had higher expression levels of checkpoint genes. The immune
predicting model indicated that the high-risk group had lower TIDE
scores. These results demonstrated that the high-risk group may be
more likely to benefit from immunotherapy.
Glycolysis-related gene targeting, in combination
with immune checkpoint blockade, can breach the immunosuppressive
microenvironment and improve immune checkpoint inhibitor therapy
(42–44). In the present study, ZFP41 was
found to be the key gene with the highest coefficient in the
glycolysis-related model, and was associated with a poor prognosis
of patients with HCC. ZFP41 is a type of ZFP, which play diverse
roles in cell biological functions, such as cell differentiation,
apoptosis, transcriptional regulation, cell metabolism and the
immune response (45). Current
studies have found that ZFP41 plays a prominent role in tumor
differentiation and oxidative stress, and is closely related to the
co-expression of LACM and venous thromboembolism (46–49).
However, the role of ZFP41 in prognosis and cell function in HCC
has not yet been discovered. To the best of our knowledge, the
present study is the first to report that the high expression of
ZFP41 is associated with a poor prognosis of patients with HCC. The
high mRNA and protein expression of ZFP41 was verified in HCC
tissues. Cell experiments confirmed that ZFP41 plays a crucial role
in in cell viability, proliferation, migration and invasion. ZFP41
was also associated with ALDOA, GADPH, PFKL, PKM and PGK1, which
can promote glycolysis and malignancy (50–56).
The present study also explored the association between ZFP41 and
glycolysis in HCC, and found that ZFP41 was a crucial factor in HCC
glycolysis. These findings provide novel perspectives for the
exploration of potential prognostic biomarkers and therapeutic
targets for HCC.
To the best of our knowledge, the present study is
the first to develop a glycolysis prognostic model of HCC using
single-cell cluster analysis. The model not only provides a novel
perspective on glycolysis in HCC, but may also help in the
management of patients with HCC. The present study has certain
limitations, however, which should be mentioned. The small sample
size used in the immunohistochemical analysis may lead to a certain
degree of risk of bias to the validation of ZFP41 protein
expression in HCC tissues. The precise mechanisms underlying the
effects of the glycolysis-related gene signature on the tumor
microenvironment could not be clarified, and thus the effects of
immunotherapy could not be predicted precisely. The mechanism
through which the gene, ZFP41, affects HCC development remain
unclear. Thus, further investigations are warranted to fully
elucidate its role in HCC.
Supplementary Material
Supporting Data
Acknowledgements
Not applicable.
Funding
The present study was supported by the Sichuan Science and
Technology Program (grant no. 2022NSFSC0680).
Availability of data and materials
The datasets generated during and/or analyzed during
the bioinformatic parts of the present study are available from the
public databases: GEO (https://www.ncbi.nlm.nih.gov/geo/), TCGA (https://portal.gdc.cancer.gov/) and ICGC
(https://dcc.icgc.org/). The other datasets used
and/or analyzed during the current study are available from the
corresponding author on reasonable request.
Authors' contributions
YT, JX, YW, NW, BL and HY contributed to the
conception and design of the study. Material preparation, data
collection and analysis were performed by YT, JX, YW, NW, BL and
HY. The first draft of the manuscript was written by YT and all
authors commented on previous versions of the manuscript. YT and JX
confirm the authenticity of all the raw data. All authors have read
and approved the final manuscript.
Ethics approval and consent to
participate
The present study and all included experimental
procedures were approved by the Biomedical Ethics Review Committee,
West China Hospital, Sichuan University (Chengdu, China; Approval
no. 2023-0121 and no. 2020-1866). For the experimental procedures
involving tissues from human participants, exemption for patient
consent was granted by the Biomedical Ethics Review Committee, West
China Hospital, Sichuan University. The reason for patient consent
being waived were the following: i) The subject may not be exposed
to more than minimal risks; ii) the exemption from the subject's
informed consent will not adversely affect the subject's rights and
interests; iii) the use of identifiable human material or data for
research, the subject can no longer be found, and the research
project does not involve personal privacy and commercial
interests.
Patient consent for publication
Not applicable.
Competing interests
The authors declare that they have no competing
interests.
Glossary
Abbreviations
Abbreviations:
|
HCC
|
hepatocellular carcinoma
|
|
scRNA-Seq
|
single-cell RNA sequencing
|
|
LIHC
|
liver hepatocellular carcinoma
|
|
TCGA
|
The Cancer Genome Atlas
|
|
LASSO
|
least absolute shrinkage and selection
operator
|
|
ICGC
|
International Cancer Genome
Consortium
|
|
TIDE
|
tumor immune dysfunction and
exclusion
|
|
OS
|
overall survival
|
|
GO
|
Gene Ontology
|
|
ROC
|
receiver operating characteristic
|
|
AUC
|
area under the curve
|
|
ssGSEA
|
single-sample gene set enrichment
analysis
|
|
CCK-8
|
Cell Counting Kit-8
|
|
PCA
|
principal component analysis
|
|
t-SNE
|
t-distributed stochastic neighbor
embedding
|
References
|
1
|
Llovet JM, Kelley RK, Villanueva A, Singal
AG, Pikarsky E, Roayaie S, Lencioni R, Koike K, Zucman-Rossi J and
Finn RS: Hepatocellular carcinoma. Nat Rev Dis Primers. 7:62021.
View Article : Google Scholar : PubMed/NCBI
|
|
2
|
McGlynn KA, Petrick JL and El-Serag HB:
Epidemiology of hepatocellular carcinoma. Hepatology. 73 (Suppl
1):S4–S13. 2021. View Article : Google Scholar
|
|
3
|
Llovet JM, Pinyol R, Kelley RK,
El-Khoueiry A, Reeves HL, Wang XW, Gores GJ and Villanueva A:
Molecular pathogenesis and systemic therapies for hepatocellular
carcinoma. Nat Cancer. 3:386–401. 2022. View Article : Google Scholar : PubMed/NCBI
|
|
4
|
Feng J, Li J, Wu L, Yu Q, Ji J, Wu J, Dai
W and Guo C: Emerging roles and the regulation of aerobic
glycolysis in hepatocellular carcinoma. J Exp Clin Cancer Res.
39:1262020. View Article : Google Scholar : PubMed/NCBI
|
|
5
|
Du D, Liu C, Qin M, Zhang X, Xi T, Yuan S,
Hao H and Xiong J: Metabolic dysregulation and emerging
therapeutical targets for hepatocellular carcinoma. Acta Pharm Sin
B. 12:558–580. 2022. View Article : Google Scholar : PubMed/NCBI
|
|
6
|
Zhang Y, Zhai Z, Duan J, Wang X, Zhong J,
Wu L, Li A, Cao M, Wu Y, Shi H, et al: Lactate: The mediator of
metabolism and immunosuppression. Front Endocrinol (Lausanne).
13:9014952022. View Article : Google Scholar : PubMed/NCBI
|
|
7
|
Zhang QY, Ho DW, Tsui YM and Ng IO:
Single-cell transcriptomics of liver cancer: Hype or insights? Cell
Mol Gastroenterol Hepatol. 14:513–525. 2022. View Article : Google Scholar : PubMed/NCBI
|
|
8
|
Aliya S, Lee H, Alhammadi M, Umapathi R
and Huh YS: An overview on single-cell technology for
hepatocellular carcinoma diagnosis. Int J Mol Sci. 23:14022022.
View Article : Google Scholar : PubMed/NCBI
|
|
9
|
Zhang Y, Wang D, Peng M, Tang L, Ouyang J,
Xiong F, Guo C, Tang Y, Zhou Y, Liao Q, et al: Single-cell RNA
sequencing in cancer research. J Exp Clin Cancer Res. 40:812021.
View Article : Google Scholar : PubMed/NCBI
|
|
10
|
Lei Y, Tang R, Xu J, Wang W, Zhang B, Liu
J, Yu X and Shi S: Applications of single-cell sequencing in cancer
research: Progress and perspectives. J Hematol Oncol. 14:912021.
View Article : Google Scholar : PubMed/NCBI
|
|
11
|
Martens JH and Stunnenberg HG: BLUEPRINT:
Mapping human blood cell epigenomes. Haematologica. 98:1487–1489.
2013. View Article : Google Scholar : PubMed/NCBI
|
|
12
|
ENCODE Project Consortium, . An integrated
encyclopedia of DNA elements in the human genome. Nature.
489:57–74. 2012. View Article : Google Scholar : PubMed/NCBI
|
|
13
|
Mabbott NA, Baillie JK, Brown H, Freeman
TC and Hume DA: An expression atlas of human primary cells:
Inference of gene function from coexpression networks. BMC
Genomics. 14:6322013. View Article : Google Scholar : PubMed/NCBI
|
|
14
|
Schmiedel BJ, Singh D, Madrigal A,
Valdovino-Gonzalez AG, White BM, Zapardiel-Gonzalo J, Ha B, Altay
G, Greenbaum JA, McVicker G, et al: Impact of genetic polymorphisms
on human immune cell gene expression. Cell. 175:1701–15.e16. 2018.
View Article : Google Scholar : PubMed/NCBI
|
|
15
|
Livak KJ and Schmittgen TD: Analysis of
relative gene expression data using real-time quantitative PCR and
the 2(−Delta Delta C(T)) method. Methods. 25:402–408. 2001.
View Article : Google Scholar : PubMed/NCBI
|
|
16
|
Brown ZJ, Tsilimigras DI, Ruff SM, Mohseni
A, Kamel IR, Cloyd JM and Pawlik TM: Management of hepatocellular
carcinoma: A review. JAMA Surg. 158:410–420. 2023. View Article : Google Scholar : PubMed/NCBI
|
|
17
|
Wen N, Cai Y, Li F, Ye H, Tang W, Song P
and Cheng N: The clinical management of hepatocellular carcinoma
worldwide: A concise review and comparison of current guidelines:
2022 Update. Biosci Trends. 16:20–30. 2022. View Article : Google Scholar : PubMed/NCBI
|
|
18
|
Chidambaranathan-Reghupaty S, Fisher PB
and Sarkar D: Hepatocellular carcinoma (HCC): Epidemiology,
etiology and molecular classification. Adv Cancer Res. 149:1–61.
2021. View Article : Google Scholar : PubMed/NCBI
|
|
19
|
Vogel A, Meyer T, Sapisochin G, Salem R
and Saborowski A: Hepatocellular carcinoma. Lancet. 400:1345–1362.
2022. View Article : Google Scholar : PubMed/NCBI
|
|
20
|
Zhang Q, Lou Y, Yang J, Wang J, Feng J,
Zhao Y, Wang L, Huang X, Fu Q, Ye M, et al: Integrated multiomic
analysis reveals comprehensive tumour heterogeneity and novel
immunophenotypic classification in hepatocellular carcinomas. Gut.
68:2019–2031. 2019. View Article : Google Scholar : PubMed/NCBI
|
|
21
|
Sperandio RC, Pestana RC, Miyamura BV and
Kaseb AO: Hepatocellular carcinoma immunotherapy. Annu Rev Med.
73:267–278. 2022. View Article : Google Scholar : PubMed/NCBI
|
|
22
|
Liu Z, Liu X, Liang J, Liu Y, Hou X, Zhang
M, Li Y and Jiang X: Immunotherapy for hepatocellular carcinoma:
Current status and future prospects. Front Immunol. 12:7651012021.
View Article : Google Scholar : PubMed/NCBI
|
|
23
|
Jiang Y, Han QJ and Zhang J:
Hepatocellular carcinoma: Mechanisms of progression and
immunotherapy. World J Gastroenterol. 25:3151–3167. 2019.
View Article : Google Scholar : PubMed/NCBI
|
|
24
|
Chen L, Huang L, Gu Y, Cang W, Sun P and
Xiang Y: Lactate-lactylation hands between metabolic reprogramming
and immunosuppression. Int J Mol Sci. 23:119432022. View Article : Google Scholar : PubMed/NCBI
|
|
25
|
Ganapathy-Kanniappan S: Linking tumor
glycolysis and immune evasion in cancer: Emerging concepts and
therapeutic opportunities. Biochim Biophys Acta Rev Cancer.
1868:212–220. 2017. View Article : Google Scholar : PubMed/NCBI
|
|
26
|
Ganapathy-Kanniappan S and Geschwind JF:
Tumor glycolysis as a target for cancer therapy: Progress and
prospects. Mol Cancer. 12:1522013. View Article : Google Scholar : PubMed/NCBI
|
|
27
|
Su X, Zhao L, Shi Y, Zhang R, Long Q, Bai
S, Luo Q, Lin Y, Zou X, Ghazanfar S, et al: Clonal evolution in
liver cancer at single-cell and single-variant resolution. J
Hematol Oncol. 14:222021. View Article : Google Scholar : PubMed/NCBI
|
|
28
|
Li Y, Song Z, Han Q, Zhao H, Pan Z, Lei Z
and Zhang J: Targeted inhibition of STAT3 induces immunogenic cell
death of hepatocellular carcinoma cells via glycolysis. Mol Oncol.
16:2861–2880. 2022. View Article : Google Scholar : PubMed/NCBI
|
|
29
|
Matsumoto K, Noda T, Kobayashi S, Sakano
Y, Yokota Y, Iwagami Y, Yamada D, Tomimaru Y, Akita H, Gotoh K, et
al: Inhibition of glycolytic activator PFKFB3 suppresses tumor
growth and induces tumor vessel normalization in hepatocellular
carcinoma. Cancer Lett. 500:29–40. 2021. View Article : Google Scholar : PubMed/NCBI
|
|
30
|
Chen DP, Ning WR, Jiang ZZ, Peng ZP, Zhu
LY, Zhuang SM, Kuang DM, Zheng L and Wu Y: Glycolytic activation of
peritumoral monocytes fosters immune privilege via the PFKFB3-PD-L1
axis in human hepatocellular carcinoma. J Hepatol. 71:333–343.
2019. View Article : Google Scholar : PubMed/NCBI
|
|
31
|
Suthen S, Lim CJ, Nguyen PHD, Dutertre CA,
Lai HLH, Wasser M, Chua C, Lim TKH, Leow WQ, Loh TJ, et al:
Hypoxia-driven immunosuppression by Treg and type-2 conventional
dendritic cells in HCC. Hepatology. 76:1329–1344. 2022. View Article : Google Scholar : PubMed/NCBI
|
|
32
|
Lu LG, Zhou ZL, Wang XY, Liu BY, Lu JY,
Liu S, Zhang GB, Zhan MX and Chen Y: PD-L1 blockade liberates
intrinsic antitumourigenic properties of glycolytic macrophages in
hepatocellular carcinoma. Gut. 71:2551–2560. 2022. View Article : Google Scholar : PubMed/NCBI
|
|
33
|
Cheng K, Cai N, Zhu J, Yang X, Liang H and
Zhang W: Tumor-associated macrophages in liver cancer: From
mechanisms to therapy. Cancer Commun (Lond). 42:1112–1140. 2022.
View Article : Google Scholar : PubMed/NCBI
|
|
34
|
Wculek SK, Cueto FJ, Mujal AM, Melero I,
Krummel MF and Sancho D: Dendritic cells in cancer immunology and
immunotherapy. Nat Rev Immunol. 20:7–24. 2020. View Article : Google Scholar : PubMed/NCBI
|
|
35
|
Xu F, Jin T, Zhu Y and Dai C: Immune
checkpoint therapy in liver cancer. J Exp Clin Cancer Res.
37:1102018. View Article : Google Scholar : PubMed/NCBI
|
|
36
|
Huang CF, Huang CY, Yeh ML, Wang SC, Chen
KY, Ko YM, Lin CC, Tsai YS, Tsai PC, Lin ZY, et al: Genetics
variants and serum levels of MHC class I chain-related A in
predicting hepatocellular carcinoma development in chronic
hepatitis C patients post antiviral treatment. EBioMedicine.
15:81–89. 2017. View Article : Google Scholar : PubMed/NCBI
|
|
37
|
Sajid M, Liu L and Sun C: The dynamic role
of NK cells in liver cancers: Role in HCC and HBV associated HCC
and its therapeutic implications. Front Immunol. 13:8871862022.
View Article : Google Scholar : PubMed/NCBI
|
|
38
|
Garnelo M, Tan A, Her Z, Yeong J, Lim CJ,
Chen J, Lim KH, Weber A, Chow P, Chung A, et al: Interaction
between tumour-infiltrating B cells and T cells controls the
progression of hepatocellular carcinoma. Gut. 66:342–351. 2017.
View Article : Google Scholar : PubMed/NCBI
|
|
39
|
Dunn GP, Koebel CM and Schreiber RD:
Interferons, immunity and cancer immunoediting. Nat Rev Immunol.
6:836–848. 2006. View Article : Google Scholar : PubMed/NCBI
|
|
40
|
Donne R and Lujambio A: The liver cancer
immune microenvironment: Therapeutic implications for
hepatocellular carcinoma. Hepatology. 77:1773–1796. 2023.
View Article : Google Scholar : PubMed/NCBI
|
|
41
|
Fu J, Li K, Zhang W, Wan C, Zhang J, Jiang
P and Liu XS: Large-scale public data reuse to model immunotherapy
response and resistance. Genome Med. 12:212020. View Article : Google Scholar : PubMed/NCBI
|
|
42
|
Cappellesso F, Orban MP, Shirgaonkar N,
Berardi E, Serneels J, Neveu MA, Di Molfetta D, Piccapane F,
Caroppo R, Debellis L, et al: Targeting the bicarbonate transporter
SLC4A4 overcomes immunosuppression and immunotherapy resistance in
pancreatic cancer. Nat Cancer. 3:1464–1483. 2022. View Article : Google Scholar : PubMed/NCBI
|
|
43
|
Ganapathy-Kanniappan S: Taming tumor
glycolysis and potential implications for immunotherapy. Front
Oncol. 7:362017. View Article : Google Scholar : PubMed/NCBI
|
|
44
|
Gong Y, Ji P, Yang YS, Xie S, Yu TJ, Xiao
Y, Jin ML, Ma D, Guo LW, Pei YC, et al: Metabolic-pathway-based
subtyping of triple-negative breast cancer reveals potential
therapeutic targets. Cell Metab. 33:51–64.e9. 2021. View Article : Google Scholar : PubMed/NCBI
|
|
45
|
Li X, Han M, Zhang H, Liu F, Pan Y, Zhu J,
Liao Z, Chen X and Zhang B: Structures and biological functions of
zinc finger proteins and their roles in hepatocellular carcinoma.
Biomark Res. 10:22022. View Article : Google Scholar : PubMed/NCBI
|
|
46
|
Shen Y, Zhang Y, Xiong Y, Zhang Z, Zhang
B, Li A, Zhang Z, Ding J, Du J and Che Y: Whole exome sequencing
identifies genetic variants in Chinese Han pregnant women with
venous thromboembolism. Thromb Res. 211:49–55. 2022. View Article : Google Scholar : PubMed/NCBI
|
|
47
|
Guo HJ, Wang LJ, Wang C, Guo DZ, Xu BH,
Guo XQ and Li H: Identification of an Apis cerana zinc finger
protein 41 gene and its involvement in the oxidative stress
response. Arch Insect Biochem Physiol. 108:e218302021. View Article : Google Scholar : PubMed/NCBI
|
|
48
|
Jiang P, He S, Li Y and Xu Z:
Identification of therapeutic and prognostic biomarkers of Lamin C
(LAMC) family members in head and neck squamous cell carcinoma. Med
Sci Monit. 26:e9257352020. View Article : Google Scholar : PubMed/NCBI
|
|
49
|
Yamada N, Yasui K, Dohi O, Gen Y, Tomie A,
Kitaichi T, Iwai N, Mitsuyoshi H, Sumida Y, Moriguchi M, et al:
Genome-wide DNA methylation analysis in hepatocellular carcinoma.
Oncol Rep. 35:2228–2236. 2016. View Article : Google Scholar : PubMed/NCBI
|
|
50
|
Fu H, Gao H, Qi X, Zhao L, Wu D, Bai Y, Li
H, Liu X, Hu J and Shao S: Aldolase A promotes proliferation and
G1/S transition via the EGFR/MAPK pathway in non-small
cell lung cancer. Cancer Commun (Lond). 38:182018.PubMed/NCBI
|
|
51
|
Sun M, Li L, Niu Y, Wang Y, Yan Q, Xie F,
Qiao Y, Song J, Sun H, Li Z, et al: PRMT6 promotes tumorigenicity
and cisplatin response of lung cancer through triggering 6PGD/ENO1
mediated cell metabolism. Acta Pharm Sin B. 13:157–173. 2023.
View Article : Google Scholar : PubMed/NCBI
|
|
52
|
Zhu Y, Jin L, Shi R, Li J, Wang Y, Zhang
L, Liang CZ, Narayana VK, De Souza DP, Thorne RF, et al: The long
noncoding RNA glycoLINC assembles a lower glycolytic metabolon to
promote glycolysis. Mol Cell. 82:542–554.e6. 2022. View Article : Google Scholar : PubMed/NCBI
|
|
53
|
Pan M, Luo M, Liu L, Chen Y, Cheng Z, Wang
K, Huang L, Tang N, Qiu J, Huang A and Xia J: EGR1 suppresses HCC
growth and aerobic glycolysis by transcriptionally downregulating
PFKL. J Exp Clin Cancer Res. 43:352024. View Article : Google Scholar : PubMed/NCBI
|
|
54
|
Zheng C, Yu X, Liang Y, Zhu Y, He Y, Liao
L, Wang D, Yang Y, Yin X, Li A, et al: Targeting PFKL with
penfluridol inhibits glycolysis and suppresses esophageal cancer
tumorigenesis in an AMPK/FOXO3a/BIM-dependent manner. Acta Pharm
Sin B. 12:1271–1287. 2022. View Article : Google Scholar : PubMed/NCBI
|
|
55
|
Bian Z, Yang F, Xu P, Gao G, Yang C, Cao
Y, Yao S, Wang X, Yin Y, Fei B and Huang Z: LINC01852 inhibits the
tumorigenesis and chemoresistance in colorectal cancer by
suppressing SRSF5-mediated alternative splicing of PKM. Mol Cancer.
23:232024. View Article : Google Scholar : PubMed/NCBI
|
|
56
|
Chen Z, He Q, Lu T, Wu J, Shi G, He L,
Zong H, Liu B and Zhu P: mcPGK1-dependent mitochondrial import of
PGK1 promotes metabolic reprogramming and self-renewal of liver
TICs. Nat Commun. 14:11212023. View Article : Google Scholar : PubMed/NCBI
|