Introduction
Osteoporosis (OP) is a major public health issue
with a gradually increasing incidence, from 14.94% prior to 2008 to
27.96% in the period between 2012 and 2015 in China (1,2). Nearly
27.5 million individuals in Europe were affected by OP in 2010
(3). Furthermore, the diagnosis of OP
is difficult until the occurrence of bone fractures. Accordingly,
research on the pathogenesis and molecular mechanism of OP is
required in order to identify biomarkers and therapeutic
targets.
Mutations in genes associated with OP have been
detected. For example, cystatin A (expressed by the CSTA
gene) is essential for epidermal development and maintenance
(4). CSTA interacts with various
genes, including one encoding a tyrosine kinase binding protein.
These genes are associated with the immune regulation of
osteoclasts (5). Additionally, a
member of the fibroblast growth factors (FGFs) family, FGF21, is an
essential endocrine hormone that regulates glucose and lipid
metabolism (6). FGF21 affects bone
development; it is inversely associated with regional bone mass
density (BMD) (7). However, few
studies have evaluated the core genes involved in OP using a
bioinformatics approach. Although previous studies have identified
several potential genes and proteins associated with OP,
topological analyses are required in order to characterize the
complex underlying networks. Furthermore, few studies have explored
the microRNA (miRNA/miR)-gene regulatory networks to generate novel
premises for OP research.
In the present study, the gene expression dataset
GSE35956 was selected from the Gene Expression Omnibus (GEO)
database (https://www.ncbi.nlm.nih.gov/geo) (8), and the GEO2R online analysis software
(https://www.ncbi.nlm.nih.gov/geo/geo2r/) was used to
uncover differentially expressed genes (DEGs). Using these loci, a
protein-protein interaction (PPI) network was obtained and a
network topological analysis was performed in order to identify
core genes with high degrees of connectivity. In addition, the
functions of the DEGs and 3 central modules were analyzed,
including analyses of over-represented biological processes (BPs),
molecular functions (MFs), cellular components (CCs), and Kyoto
Encyclopedia of Genes and Genomes (KEGG) pathways (9,10). miRNAs
that regulate these core genes were predicted, providing a basis
for further studies.
Materials and methods
Data
The gene expression dataset GSE35956 was obtained
from the publicly accessible GEO database. GSE35956 was obtained
through rigorous scientific design and the data can be analyzed
with high quality. The selection criteria were as follows: i) Entry
type: Series; ii) Organism: Homo sapiens; and iii) Experiment type:
Expression profiling by array. The dataset includes human
mesenchymal stem cell (hMSC) samples from 5 middle-aged donors
without any indication of the syndrome (age range, 42–67 years;
mean age, 57.6 years; sex, 4 female and 1 male) and 5 patients (age
range, 79–94 years; mean age, 86.2 years; sex, female) suffering
from primary OP (hMSC-OP) (11).
Non-osteoporotic donors with total hip arthroplasty due to
osteoarthritis and/or hip dysplasia were selected and MSCs from the
bone marrow of the donors were obtained. MSCs of OP donors were
isolated from femoral heads following low-energy fracture of the
femoral neck. Benisch et al (11) used the Significance Analysis of
Microarrays software (http://statweb.stanford.edu/~tibs/SAM/) to compare
gene expression patterns of 2 groups of hMSC populations. In the
present study, a separate analysis of 2 groups was performed and
each group contained the 5 aforementioned samples. The study was
based on the GPL570 platform (Affymetrix Human Genome U133 Plus 2.0
Array; Affymetrix; Thermo Fisher Scientific, Inc., Waltham, MA,
USA). The series matrix file of GSE35956 was downloaded from the
GEO database.
Data processing for DEG
identification
GEO2R and Morpheus (https://software.broadinstitute.org/morpheus/) were
used to identify DEGs among experimental samples (12). GEO2R offers a convenient interface
enabling sophisticated R-based analyses of GEO data and is useful
for the identification and evaluation of DEGs (8). P<0.05 and |logFC|≥2 were set as the
thresholds for DEG detection.
Gene Ontology (GO) and KEGG pathway
analyses of DEGs
GO analyses are used to annotate genes or gene
products and to determine biological characteristics of
high-throughput genome or transcriptome data (10). KEGG is a group of databases for
various biological data, including genomes and biological pathways.
The Database for Annotation, Visualization and Integrated Discovery
v6.8 (DAVID; http://david.ncifcrf.gov/) is a net-based online
bioinformatics resource with tools for the functional
interpretation of large-scale gene or protein datasets (13). The Functional Annotation Tool of DAVID
was used and then the upregulated and downregulated DEGs were
inserted into the tool for GO and KEGG analysis, respectively. In
particular, Homo sapiens were required to be selected in
order to limit the annotation of the species, thereby generating a
summary of gene-species mapping. Finally, the data was downloaded
and P<0.05 was used to indicate a statistically significant
difference.
Construction of functional annotation
maps
In order to evaluate the biological functions of the
proteins in the PPI networks based on upregulated, downregulated
and total DEGs, the ClueGO plug-in v2.5.0 was used to identify
over-represented BP terms for protein members in the network
(14). ClueGO integrates GO terms
into a PPI network and creates a functional annotation map that
represents the associations between terms. The κ score was set to
0.4, indicating the resemblance of GO terms for associated genes.
In addition, KEGG pathways were used to combine associated genes
with corresponding pathways and P<0.05 indicated a significant
difference.
Network topological parameters
Network topological analyses were used for the
comparison and characterization of complex networks.
NetworkAnalyzer v2.7 (Department of Computational Biology and
Applied Algorithmics at the Max Planck Institute for Informatics,
Saarbrücken, Germany), which is part of Cytoscape v3.6.0, was used
to analyze network topological parameters (15). NetworkAnalyzer only fits points with
positive coordinate values and provides the association between the
given data points and the corresponding points on the fitted curve.
This coefficient provides the ratio of variability in a dataset,
which is described by a fitted linear model. To determine whether
two random variables satisfy the linear association, the
correlation coefficient can be calculated with the linear
regression model and the least squares method. Consequently, the
R2 value is calculated on logarithmized data, where the
power-law curve: y=a xb is transformed into linear
model: ln y=ln a + b ln x, where × and y are positive random
variables, and a and b are constants >0. The power law
distribution appears as a straight line with a slope of a power
exponent. This linear association is the basis for judging whether
a random variable satisfies a power law in a given instance, and
the power-law distribution of node degree was the main parameter
used to evaluate the network topology.
PPI network and module analysis
The Search Tool for the Retrieval of Interacting
Genes (STRING) v10.5 (https://string-db.org/) is an online tool designed to
evaluate PPI information (16) and
this was used to detect potential associations among the DEGs. The
results were input into Cytoscape v3.6.0 (http://www.cytoscape.org/) to map the associations
among the DEGs (17). A confidence
score ≥0.4 and a maximum number of interactors of 0 were set as
criteria. Molecular Complex Detection (MCODE) v1.5.1 (Bader Lab,
University of Toronto, Toronto, Ontario, Canada) was used to
evaluate the modules in the PPI network in Cytoscape (18). The definition of false discovery rate
(FDR) is the expected value of the number of false rejects as a
percentage of all rejected null hypotheses. The P-value is
generally performed using a Student's t-test or χ2 test
for the analysis of differential gene expression, and the false
positive test can be performed on the P-value using the Benjamini
FDR check method (19). In other
words, the second screening of DEGs can be performed by the FDR
significance parameter. The screening conditions were as follows:
Degree, 2; node score, 0.2; k-core, 2; and maximum depth, 100. A
KEGG pathway enrichment analysis for DEGs in the module was
performed using the Functional Annotation Tool based on the DAVID
for these cluster genes and annotation summary results are depicted
as a Functional Annotation Chart in Fig.
1. The count threshold was set to 2, which means the minimum
number of genes for the corresponding term is 2. Additionally,
Homo sapiens were required to be selected to limit the
annotation of the species. P<0.05 indicated a significant
difference.
Prediction of miRNA-gene regulatory
modules
CyTargetLinker v3.0.1 (https://projects.bigcat.unimaas.nl/cytargetlinker/)
was utilized to predict miRNA-target interactions (MTIs) for the
genes, which were presented in a graphical manner using an
extension of the network (20), with
the network established by the core genes can be extended to be
associated with miRNAs. A regulatory interaction network (RegIN) is
a network containing regulatory interactions, often derived from
online interaction databases (20).
To generate a RegIN using CyTargetLinker in Cytoscape, Homo
sapiens MTIs were obtained from the experimentally validated
database miRTarBase v4.4, which includes 20,942 MTIs, and from 2
predicted miRNA databases, MicroCosm v5.0, with 541,039 MTIs, and
TargetScan v6.2, with 511,040 MTIs (http://projects.bigcat.unimaas.nl/cytargetlinker/regins).
Each regulatory interaction comprises 2 nodes, a source (regulatory
component) and a target biomolecule, connected by a single directed
edge. In the present study, the top 10 hub genes were selected for
the extension of the network using CyTargetLinker.
Results
Identification of DEGs
The gene expression profiles of 10 samples in the
gene expression dataset GSE35956, including 5 OP and 5 control
samples, were analyzed. A total of 915 DEGs between the OP and
control samples were identified using GEO2R and Morpheus, including
774 upregulated and 141 downregulated genes.
GO function and KEGG pathway
enrichment analysis
GO and KEGG pathway enrichment analyses were
performed using DAVID and the ClueGO plug-in in order to gain a
comprehensive understanding of the functions of the DEGs. The
results of the GO analysis indicated that upregulated and
downregulated genes were enriched for various BP terms, which are
listed in Table I. For upregulated
DEGs these included ‘nervous system development’, ‘homeostatic
process’, ‘cell-cell signaling’, ‘chemical homeostasis’ and
‘cellular chemical homeostasis’, and for downregulated DEGs they
included ‘regulation of MF’, ‘single-organism organelle
organization’, ‘cytoskeleton organization’, ‘regulation of GTPase
activity’ and ‘actin cytoskeleton organization’. In the MF
category, the upregulated genes were enriched for ‘RNA polymerase
II transcription factor activity, sequence-specific DNA binding’,
‘channel activity’, ‘passive transmembrane transporter activity’,
‘ligand-gated ion channel activity’ and ‘ligand-gated channel
activity’, while the downregulated genes were enriched for
‘nucleotide binding’, ‘nucleoside phosphate binding’, ‘purine
ribonucleoside triphosphate binding’, ‘purine ribonucleoside
binding’ and ‘extracellular matrix structural constituent’. A CC
analysis further demonstrated that the upregulated genes were
enriched for ‘synapse’, ‘synapse part’, ‘synaptic membrane’,
‘postsynaptic membrane’ and ‘excitatory synapse’, while the
downregulated genes were enriched for ‘extracellular matrix’,
‘perinuclear region of cytoplasm’, ‘proteinaceous extracellular
matrix’, ‘cell leading edge’ and ‘ruffle’.
 | Table I.Gene Ontology analysis of
differentially expressed genes associated with
osteoporosisa. |
Table I.
Gene Ontology analysis of
differentially expressed genes associated with
osteoporosisa.
| Expression | Category | Term | Countb | %c | P-value |
|---|
| Upregulated | GOTERM_BP_FAT | GO:0007399~nervous
system development | 106 | 13.73 |
4.20×10⁻⁶ |
|
| GOTERM_BP_FAT |
GO:0042592~homeostatic process | 88 | 11.40 |
1.06×10⁻⁶ |
|
| GOTERM_BP_FAT |
GO:0007267~cell-cell signaling | 85 | 11.01 |
2.52×10⁻⁷ |
|
| GOTERM_BP_FAT | GO:0048878~chemical
homeostasis | 66 | 8.55 |
1.42×10⁻⁷ |
|
| GOTERM_BP_FAT | GO:0055082~cellular
chemical homeostasis | 47 | 6.09 |
3.77×10⁻⁶ |
|
| GOTERM_MF_FAT | GO:0000981~RNA
polymerase II transcription factor activity, sequence-specific DNA
binding | 43 | 5.57 |
1.96×10⁻⁵ |
|
| GOTERM_MF_FAT | GO:0015267~channel
activity | 31 | 4.02 |
3.65×10⁻⁴ |
|
| GOTERM_MF_FAT | GO:0022803~passive
transmembrane transporter activity | 31 | 4.02 |
3.80×10⁻⁴ |
|
| GOTERM_MF_FAT |
GO:0015276~ligand-gated ion channel
activity | 16 | 2.07 |
6.49×10⁻⁵ |
|
| GOTERM_MF_FAT |
GO:0022834~ligand-gated channel
activity | 16 | 2.07 |
6.49×10⁻⁵ |
|
| GOTERM_CC_FAT |
GO:0045202~synapse | 51 | 6.61 |
7.19×10⁻⁷ |
|
| GOTERM_CC_FAT | GO:0044456~synapse
part | 42 | 5.44 |
4.81×10⁻⁶ |
|
| GOTERM_CC_FAT | GO:0097060~synaptic
membrane | 29 | 3.76 |
6.53×10⁻⁸ |
|
| GOTERM_CC_FAT |
GO:0045211~postsynaptic membrane | 22 | 2.85 |
4.28×10⁻⁶ |
|
| GOTERM_CC_FAT |
GO:0060076~excitatory synapse | 20 | 2.59 |
1.79×10⁻⁵ |
| Downregulated | GOTERM_BP_FAT |
GO:0065009~regulation of molecular
function | 34 | 24.29 | 0.001 |
|
| GOTERM_BP_FAT |
GO:1902589~single-organism organelle
organization | 23 | 16.43 | 0.001 |
|
| GOTERM_BP_FAT |
GO:0007010~cytoskeleton organization | 18 | 12.86 | 0.002 |
|
| GOTERM_BP_FAT |
GO:0043087~regulation of GTPase
activity | 14 | 10.00 |
9.63×10⁻⁴ |
|
| GOTERM_BP_FAT | GO:0030036~actin
cytoskeleton organization | 12 | 8.57 | 0.002 |
|
| GOTERM_MF_FAT |
GO:0000166~nucleotide binding | 29 | 20.71 | 0.003 |
|
| GOTERM_MF_FAT |
GO:1901265~nucleoside phosphate
binding | 29 | 20.71 | 0.003 |
|
| GOTERM_MF_FAT | GO:0035639~purine
ribonucleoside triphosphate binding | 24 | 17.14 | 0.004 |
|
| GOTERM_MF_FAT | GO:0032550~purine
ribonucleoside binding | 24 | 17.14 | 0.004 |
|
| GOTERM_MF_FAT |
GO:0005201~extracellular matrix structural
constituent | 5 | 3.57 | 0.003 |
|
| GOTERM_CC_FAT |
GO:0031012~extracellular matrix | 10 | 7.14 | 0.015 |
|
| GOTERM_CC_FAT |
GO:0048471~perinuclear region of
cytoplasm | 10 | 7.14 | 0.044 |
|
| GOTERM_CC_FAT |
GO:0005578~proteinaceous extracellular
matrix | 8 | 5.71 | 0.017 |
|
| GOTERM_CC_FAT | GO:0031252~cell
leading edge | 7 | 5.00 | 0.046 |
|
| GOTERM_CC_FAT |
GO:0001726~ruffle | 6 | 4.29 | 0.006 |
In addition, 6 KEGG pathways were identified, as
listed in Table II, involving the
‘glutamatergic synapse’, ‘adrenergic signaling in cardiomyocytes’,
‘neuroactive ligand-receptor interaction’, ‘Rap1 signaling pathway’
and ‘cAMP signaling pathway’ for upregulated DEGs, and ‘pathways in
cancer’ for downregulated DEGs.
| Table II.Kyoto Encyclopedia of Genes and
Genomes pathway analysis of DEGs associated with
osteoporosisa. |
Table II.
Kyoto Encyclopedia of Genes and
Genomes pathway analysis of DEGs associated with
osteoporosisa.
| Category of
DEGs | Term | Countb | %c | P-value | Genes |
|---|
| Upregulated |
hsa04080:Neuroactive ligand-receptor
interaction | 28 | 3.63 |
2.34×10⁻⁷ | AVPR2, MCHR1,
GRIK2, NPY2R, GRIK3, GABRB1, F2RL1, GRIK5, HCRTR1, LTB4R, CNR1,
P2RY1, CHRNA4, GRID1, GABRG3, GABRA2, PTGER3, NPBWR2, LEP, P2RY10,
ADRB1, GRM2, PRLR, GRM8, CHRM1, P2RX2, GHSR, TSHR |
|
| hsa04015:Rap1
signaling pathway | 19 | 2.46 |
1.45×10⁻⁴ | PIK3CG, ADCY1,
MAGI2, PGF, EFNA2, SIPA1L2, KITLG, FGF23, RGS14, PRKCB, CNR1,
P2RY1, RASGRP2, CALML6, RAPGEF3, ANGPT2, RAPGEF1, AKT2,
ITGA2B |
|
| hsa04024:cAMP
signaling pathway | 16 | 2.07 | 0.002 | PIK3CG, HCN2,
ADCY1, PTGER3, CFTR, CNGB1, CNGB3, ADRB1, CHRM1, CAMK2D, CALML6,
RAPGEF3, GHSR, CAMK2A, TSHR, AKT2 |
|
|
hsa04724:Glutamatergic synapse | 11 | 1.42 | 0.004 | SLC17A8, SLC1A2,
ADCY1, DLGAP1, GRM2, GRM8, GRIK2, GRIK3, GRIK5, SHANK3,
PRKCB |
|
| hsa04261:Adrenergic
signaling in cardiomyocytes | 11 | 1.42 | 0.020 | PIK3CG, ADCY1,
ADRB1, CACNG8, PPP1R1A, CACNB1, CAMK2D, CALML6, RAPGEF3, CAMK2A,
AKT2 |
| Downregulated | hsa05200:Pathways
in cancer | 7 | 55.00 | 0.030 | FGFR2, LAMA4,
WNT4, HSP90B1, APC2, PIAS2, CDK2 |
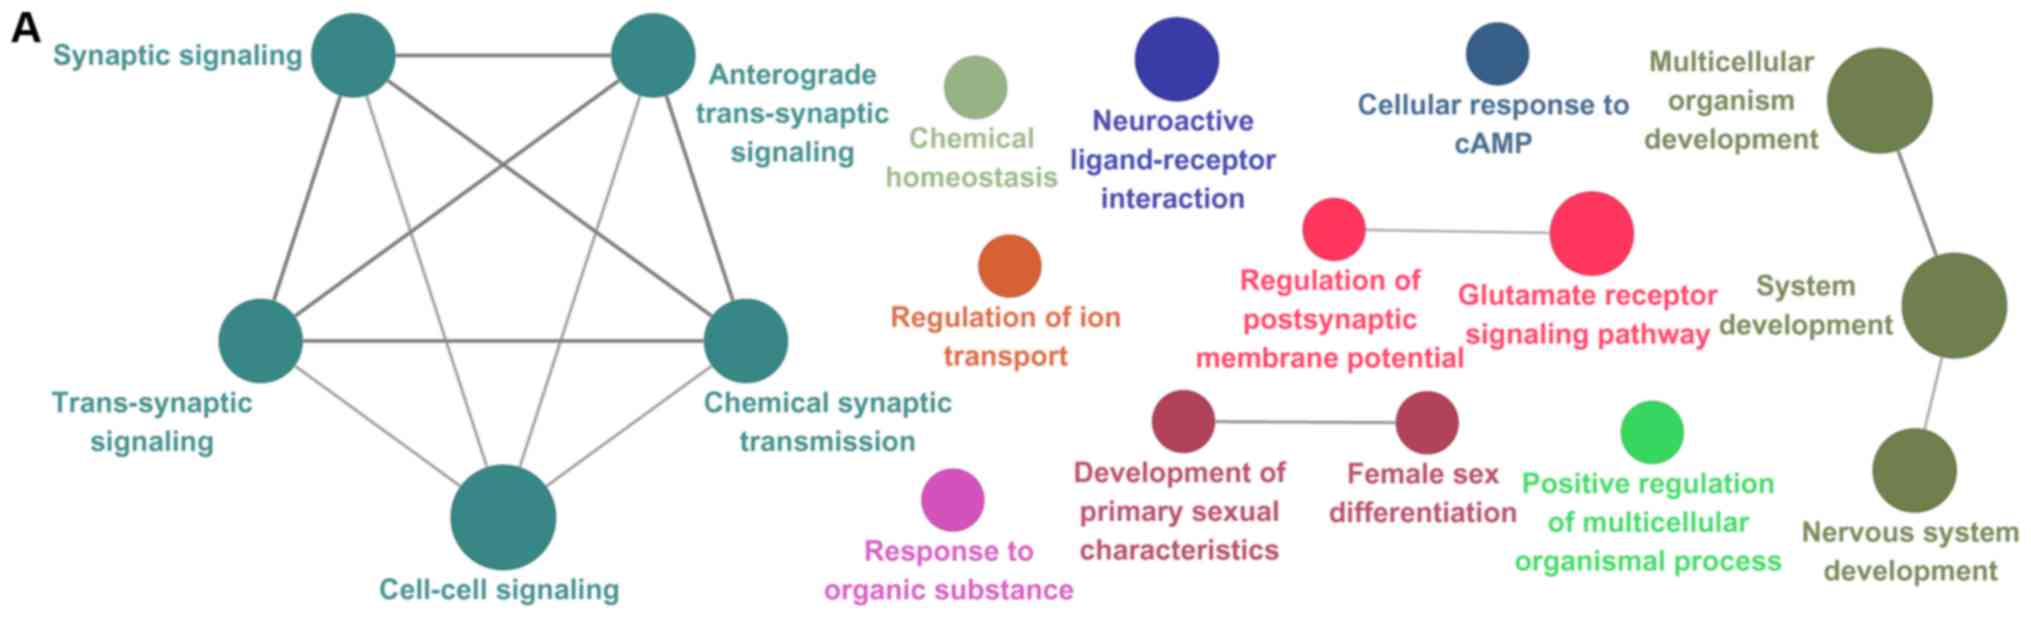
The results of the ClueGO analysis demonstrated that
upregulated and downregulated DEGs were particularly enriched for
BP terms, including ‘multicellular organism development’, ‘system
development’, ‘response to organic substance’, ‘nervous system
development’ and ‘cell-cell signaling’ for upregulated DEGs, and
‘regulation of osteoblast differentiation’, ‘mitotic DNA integrity
checkpoint’, ‘central nervous system neuron development’, ‘mitotic
G1/S transition checkpoint’ and ‘mitotic G1 DNA damage checkpoint’
for downregulated DEGs (Table III).
KEGG pathways involved in ‘neuroactive ligand-receptor interaction’
and the ‘p53 signaling pathway’ for upregulated and downregulated
DEGs, respectively, were identified.
| Table III.Summary of ClueGO analysis of DEGs
for biological processes associated with osteoporosisa. |
Table III.
Summary of ClueGO analysis of DEGs
for biological processes associated with osteoporosisa.
| DEG expression | GO ID | GO term | Genes,
nb | %c | P-value | Genes |
|---|
| Upregulated | GO:0007275 | Multicellular
organism | 220 | 4.14 |
5.03×10⁻⁷ | ADAMTS9, ADCY1,
AKT2, ALG5, AMOT, ANGPT2, ANKRD54, ANPEP, APLP1, APOH, AQP1,
ARHGAP26, ASB4, ASCL2, ASNS, ATCAY, ATN1, AVPR2, AXIN2, BCAN, BMP7,
BMP8B, BRSK1, BRSK2, CAMK2A, CAMK2D, CBX2, CCK, CCR4, CD24, CD74,
CHRM1, CNGB1, CNR1, CNTN4, COL10A1, CPB2, CUX2, CYP19A1, DACH1,
DCHS2, DDC, DMBX1, DNAH11, DRAXIN, DYRK1B, EFNA2, EGR2, EMX1, EN2,
EPHA4, ESRRB, EZH1, F2RL1, FEZF2, FGF23, FOXE1, FOXG1, FOXO1,
FOXP2, FZD10, GABRB1, GAL, GHSR, GJA5, GJB6, GPM6B, GPRC5B, HDAC10,
HES4, HID1, HIPK1, HMGA2, HNF4A, HOOK1, HPRT1, HSPB6, HTN3, IBSP,
IKZF1, IKZF3, IL2, IRF4, ITGA2B, JMJD6, JPH1, KCNIP2, KITLG,
KLHL17, KLHL32, KLKB1, KMT2B, KRT40, LEP, LFNG, LHX2, LHX6, LHX8,
LPAL2, LRRC7, LSAMP, LST1, LTBP4, LYL1, MAB21L2, MAGI2, MARK4,
MCF2, MEF2D, MEX3C, MINK1, MMP11, MOBP, MOV10L1, MT1G, MYCBPAP,
MYH7B, MYO3B, MYO7A, NDRG2, NEUROG2, NFATC4, NME8, NOBOX, NPAS1,
NPPC, NPY2R, NR0B1, NR2F6, NRP2, NRXN1, NTRK3, OBSL1, OLFM1, P2RX2,
P2RY1, PAK3, PCDH15, PCDH8, PCDHGC5, PCSK6, PCYT1B, PECAM1, PGF,
PHOSPHO1, PIK3CG, PKP2, PLCG2, POLB, PPARGC1A, PPARGC1B, PPDPF,
PRKCB, PRLR, PSG1, PTPRB, RAB11FIP4, RAD21L1, RAPGEF1, RAPGEF3,
RARRES2, RAX, RFX4, RGS14, RIMS1, RIPPLY2, SCEL, SCN3B, SCRT1,
SDK2, SEMA4D, SEMA6B, SERPINA5, SETDB2, SEZ6L, SF1, SFTPD, SH3TC2,
SHANK3, SHOX, SIAH3, SIN3A, SLC17A8, SLC1A2, SLC8A3, SMIM6, SOST,
SOX10, SOX2, SOX8, SPATA19, ST8SIA2, STMN4, STOX1, TAF10, TBX3,
TBX6, TCF21, TEF, TERT, TEX11, THPO, TIE1, TNFRSF11A, TP63, TRIB1,
TRIM54, TRPC6, TRPM1, TSHR, TSSK1B, TTPA, TUB, UBE4B, WDR72, WT1,
XIRP2, ZFP36L1, ZFP36L2, ZFP42 |
|
| GO:0048731 | System
development | 203 | 4.28 |
1.94×10⁻⁷ | ADAMTS9, ADCY1,
AKT2, AMOT, ANGPT2, ANKRD54, ANPEP, APLP1, APOH, AQP1, ARHGAP26,
ASB4, ASCL2, ASNS, ATCAY, ATN1, AVPR2, AXIN2, BCAN, BMP7, BMP8B,
BRSK1, BRSK2, CAMK2A, CAMK2D, CCK, CCR4, CD24, CD74, CHRM1, CNGB1,
CNR1, CNTN4, COL10A1, CPB2, CUX2, CYP19A1, DCHS2, DMBX1, DNAH11,
DRAXIN, DYRK1B, EFNA2, EGR2, EMX1, EN2, EPHA4, ESRRB, EZH1, F2RL1,
FEZF2, FGF23, FOXE1, FOXG1, FOXO1, FOXP2, FZD10, GABRB1, GAL, GHSR,
GJA5, GJB6, GPM6B, GPRC5B, HDAC10, HES4, HID1, HIPK1, HMGA2, HPRT1,
HSPB6, HTN3, IBSP, IKZF1, IKZF3, IL2, IRF4, ITGA2B, JMJD6, JPH1,
KCNIP2, KITLG, KLHL17, KLHL32, KLKB1, KMT2B, KRT40, LEP, LFNG,
LHX2, LHX6, LHX8, LPAL2, LRRC7, LSAMP, LST1, LYL1, MAB21L2, MAGI2,
MARK4, MCF2, MEF2D, MEX3C, MINK1, MOBP, MT1G, MYH7B, MYO3B, MYO7A,
NDRG2, NEUROG2, NFATC4, NOBOX, NPAS1, NPPC, NPY2R, NR0B1, NR2F6,
NRP2, NRXN1, NTRK3, OBSL1, OLFM1, P2RX2, P2RY1, PAK3, PCDH15,
PCDH8, PCDHGC5, PCSK6, PCYT1B, PECAM1, PGF, PHOSPHO1, PIK3CG, PKP2,
PLCG2, POLB, PPARGC1A, PPARGC1B, PPDPF, PRKCB, PRLR, PSG1, PTPRB,
RAB11FIP4, RAD21L1, RAPGEF1, RAPGEF3, RARRES2, RAX, RFX4, RGS14,
RIMS1, RIPPLY2, SCEL, SCN3B, SCRT1, SDK2, SEMA4D, SEMA6B, SERPINA5,
SETDB2, SEZ6L, SF1, SFTPD, SH3TC2, SHANK3, SHOX, SIN3A, SLC17A8,
SLC1A2, SLC8A3, SMIM6, SOX10, SOX2, SOX8, ST8SIA2, STMN4, STOX1,
TAF10, TBX3, TBX6, TCF21, TERT, TEX11, THPO, TIE1, TNFRSF11A, TP63,
TRIB1, TRPC6, TRPM1, TSHR, TTPA, TUB, UBE4B, WDR72, WT1, XIRP2,
ZFP36L1, ZFP36L2, ZFP42 |
|
| GO:0010033 | Response to organic
substance | 138 | 4.34 | <0.001 | ABCA2, ABCC2,
ADCY1, AIM2, AKT2, ANGPT2, APLP1, AQP1, AQP4, ASNS, ATP6V0A4,
AVPR2, BMP7, BMP8B, BRSK2, CACNB1, CAMK2A, CAMK2D, CCDC3, CCL23,
CCR4, CD24, CD6, CD74, CFTR, CGN, CHRM1, CHRNA4, CNR1, CPB2, CRLF2,
CSF2RA, CUX2, CXCL5, DBH, DDC, EGR2, ELANE, EPHA4, ESRRB, F2RL1,
FABP4, FGF23, FOXO1, FOXP2, FZD10, GABRB1, GAL, GBP5, GHSR, GJB6,
GPD1, GRIK5, HCN2, HCRTR1, HFE2, HID1, HIPK1, HNF4A, HPRT1, IBSP,
IL2, IL22RA2, IL37, IRF4, ITIH4, KANK2, KHSRP, LATS2, LEP, LMO3,
LPAL2, LRRC19, LRRC3, LTBP4, MAGI2, MAP2K7, MAPK4, MCF2, MEFV,
MT1G, MTHFR, MTSS1L, NFATC4, NPPC, NR0B1, NR2F6, NRP2, NRXN1,
NTRK3, P2RX2, P2RY1, PAK3, PAQR9, PCSK6, PELO, PGF, PID1, PIK3CG,
PLCG2, POLB, POLR2A, PPARGC1A, PPARGC1B, PRKCB, PRLR, PSG1,
RAPGEF1, RAPGEF3, RARRES2, RERG, RIPOR1, RNASE7, RNF31, RXRB,
SIN3A, SLC11A1, SLC1A2, SLC8A3, SORBS1, SOST, SOX10, SOX2, SOX30,
TAT, TCF21, TERT, THPO, TIE1, TNFRSF11A, TP63, TRIB1, TSHR, TUB,
UBE4B, WT1, ZFP36L1, ZFP36L2 |
|
| GO:0007399 | Nervous system
development | 109 | 4.61 | <0.001 | ADCY1, AKT2,
APLP1, AQP1, ARHGAP26, ASCL2, ATCAY, ATN1, AVPR2, BCAN, BMP7,
BRSK1, BRSK2, CAMK2A, CAMK2D, CCK, CCR4, CHRM1, CNGB1, CNR1, CNTN4,
CUX2, DMBX1, DRAXIN, EFNA2, EGR2, EMX1, EN2, EPHA4, EZH1, FEZF2,
FOXG1, FOXP2, FZD10, GABRB1, GAL, GHSR, GPM6B, GPRC5B, HDAC10,
HES4, HIPK1, HPRT1, IL2, KCNIP2, KLHL17, LEP, LHX2, LHX6, LHX8,
LRRC7, LSAMP, LST1, MAB21L2, MAGI2, MARK4, MCF2, MEF2D, MINK1,
MOBP, MYO7A, NDRG2, NEUROG2, NFATC4, NPAS1, NPPC, NR0B1, NR2F6,
NRP2, NRXN1, NTRK3, OBSL1, OLFM1, P2RY1, PAK3, PCDH15, PCDH8,
PCDHGC5, PPARGC1A, RAPGEF1, RAX, RFX4, RGS14, RIMS1, SCN3B, SCRT1,
SDK2, SEMA4D, SEMA6B, SEZ6L, SH3TC2, SHANK3, SLC17A8, SLC1A2,
SLC8A3, SOX10, SOX2, SOX8, ST8SIA2, STMN4, TBX3, TBX6, TERT, TP63,
TRPC6, TRPM1, TSHR, UBE4B, ZFP36L1 |
|
| GO:0007267 | Cell-cell
signaling | 94 | 5.64 | 1.18×
10−8 | ADRB1, AMER3,
ANPEP, AQP1, AXIN2, BRSK1, BRSK2, CACNB1, CADPS, CAMK2A, CCL23,
CD24, CFTR, CHRM1, CHRNA4, CNR1, CNTN4, CUX2, CXCL5, DBH, DLGAP1,
DRAXIN, EFNA2, EGR2, EPHA4, FGF23, FOXO1, FZD10, GAL, GHSR, GJA5,
GPRC5B, GRID1, GRIK2, GRIK3, GRIK5, GRM2, GRM8, HCN2, HCRTR1,
HMGA2, HNF4A, IL2, JPH3, KCNIP2, LATS2, LEP, LTBP4, MAGI2, MCHR1,
MINK1, MYCBPAP, NDRG2, NETO1, NFATC4, NPBWR2, NPPC, NPTX2, NPY2R,
NRXN1, P2RX2, P2RY1, PANX2, PCDH15, PCDH8, PCDHGC5, PGF, PKP2,
PLCG2, RAPGEF1, RAPGEF3, RASL10B, RGS14, RIMS1, SCEL, SCN3B,
SHANK3, SHISA9, SIRPG, SLC1A2, SLC5A7, SLC8A3, SORCS3, SOST, SOX10,
SOX2, STXBP5L, SYNPO, TBX3, TERT, TNFRSF11A, TP63, TSHR,
UNC13C |
| Downregulated | GO:0045667 | Regulation of
osteoblast differentiation | 5 | 4.42 | 0.001 | FGFR2, IL6ST,
PIAS2, PRKD1, WNT4 |
|
| GO:0044774 | Mitotic DNA
integrity checkpoint | 5 | 4.31 | 0.001 | CDK2, CNOT7,
PLK3, TOP2A, TP73 |
|
| GO:0021954 | Central nervous
system neuron development | 4 | 5.41 | 0.001 | ADARB1, FGFR2,
NFIB, SZT2 |
|
| GO:0044819 | Mitotic G1/S
transition checkpoint | 4 | 5.19 | 0.002 | CDK2, CNOT7,
PLK3, TP73 |
|
| GO:0031571 | Mitotic G1 DNA
damage checkpoint | 4 | 5.19 | 0.002 | CDK2, CNOT7,
PLK3, TP73 |
Functional annotation map of PPI
subnetworks
ClueGO provided a functional annotation map for PPI
subnetworks, in which protein members are enriched corresponding to
their GO terms and pathways (Fig. 1).
Regulation of osteoblast differentiation was linked to 5 genes.
Among these, FGF receptor 2, interleukin 6 signal transducer and
Wnt family member 4 genes were also associated with a number of BP
terms, including ‘central nervous system projection neuron
axonogenesis’, ‘cardiac muscle hypertrophy’, ‘positive regulation
of focal adhesion assembly biological process’ and ‘pathways in
cancer’.
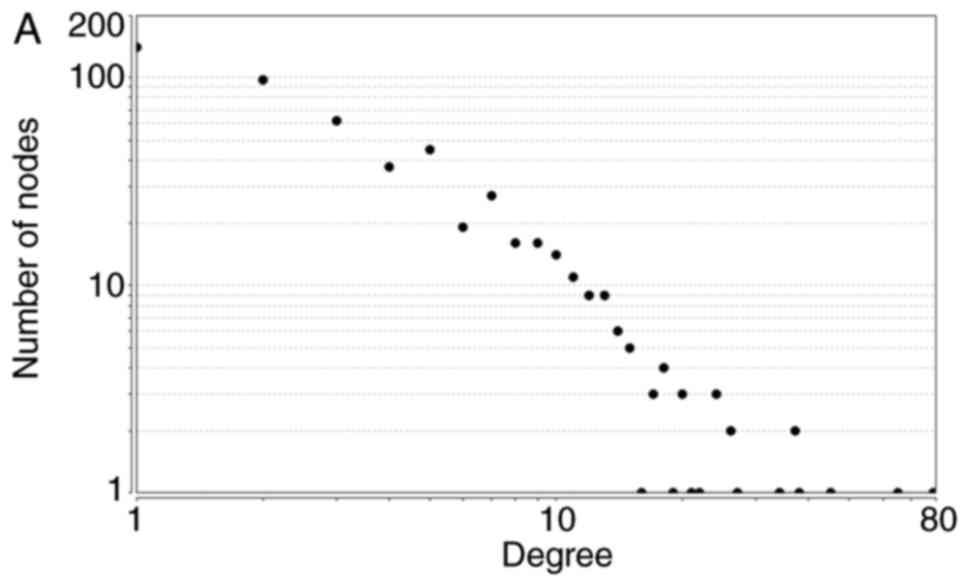
Analyses of network topological
properties
The node degrees for the total upregulated and
downregulated DEGs generally obeyed power-law distributions, as
demonstrated in Fig. 2. Supplementary
topological parameters, including the clustering coefficient,
network centralization and network density, are listed in Table IV.
| Table IV.Topological parameters for the total,
the upregulated and the downregulated PPI subnetworks. |
Table IV.
Topological parameters for the total,
the upregulated and the downregulated PPI subnetworks.
| PPI subnetwork |
y=axb | R2 | Correlation
coefficient | Clustering
coefficient | Network
centralization | Network
density |
|---|
| Total |
y=256.19x−1.478 | 0.863 | 0.931 | 0.249 | 0.137 | 0.010 |
| Upregulated |
y=191.96x−1.462 | 0.901 | 0.939 | 0.256 | 0.153 | 0.012 |
| Downregulated |
y=18.646x−1.291 | 0.809 | 0.984 | 0.142 | 0.287 | 0.044 |
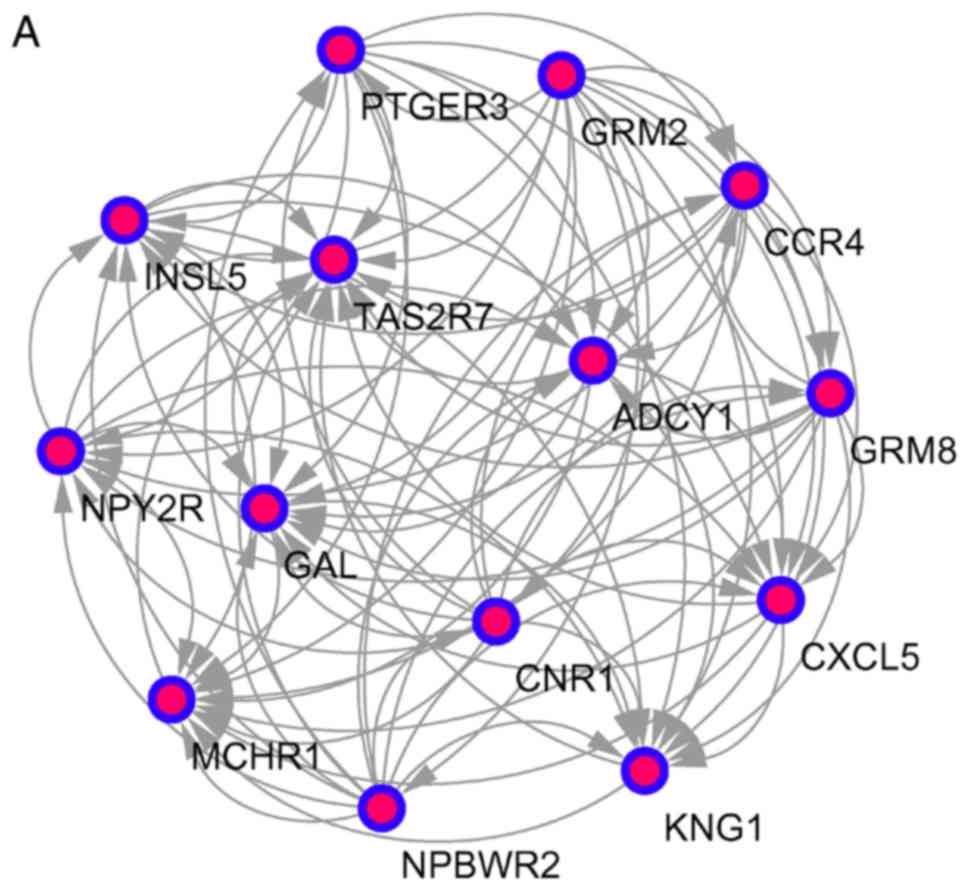
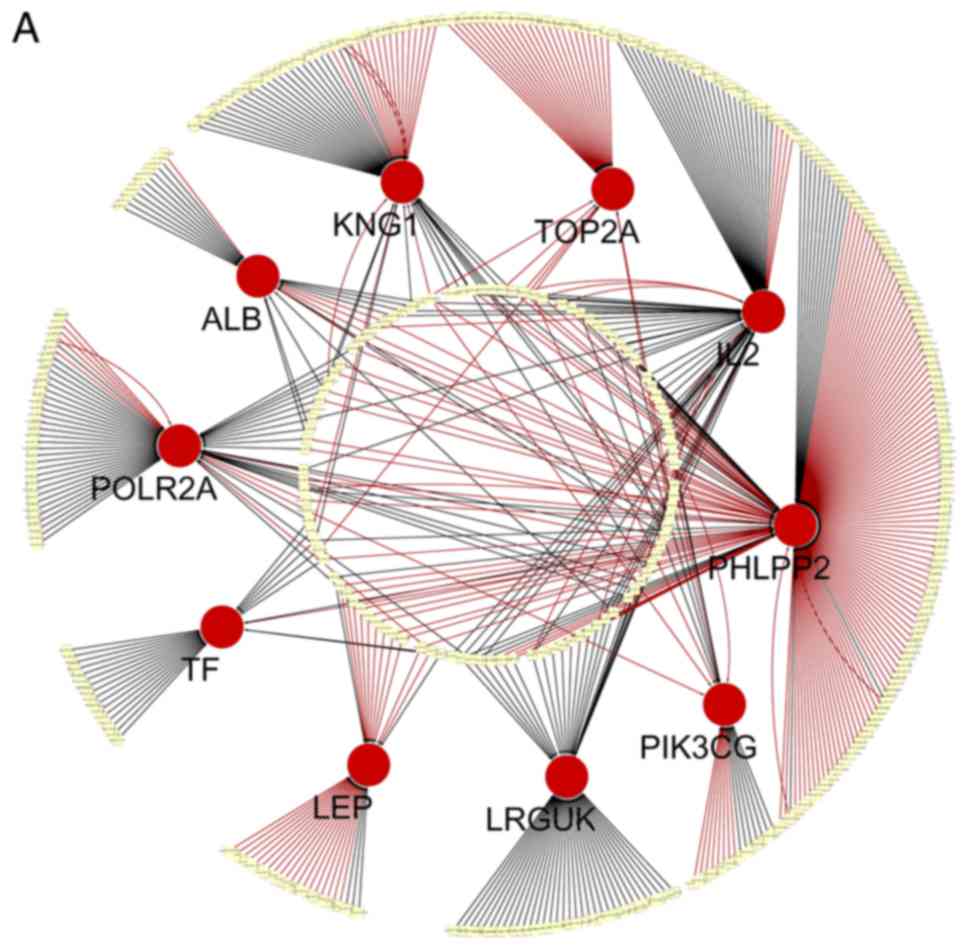
Core genes and modules in the PPI
network
The top 10 core genes with the highest node degrees
were determined using Cytoscape and the STRING database. These were
albumin (ALB), PH domain leucine-rich repeat-containing
protein phosphatase 2 (PHLPP2), DNA topoisomerase 2-α
(TOP2A), kininogen 1 (KNG1), interleukin 2
(IL2), leucine-rich repeats and guanylate kinase domain
containing (LRGUK), phosphatidylinositol-4,5-bisphosphate
3-kinase catalytic subunit γ (PIK3CG), leptin (LEP),
transferrin (TF) and RNA polymerase II subunit A
(POLR2A). Using an MCODE analysis, several significant
modules were identified, including 541 nodes and 1431 edges. The 3
modules with the lowest P-values were selected to evaluate enriched
pathways (Fig. 3 and Table V).
| Table V.Enriched pathways for modules
A-Ca. |
Table V.
Enriched pathways for modules
A-Ca.
| Modules | Terms | P-value | FDR | Genes |
|---|
| A | Neuroactive
ligand-receptor interaction |
1.53×10⁻⁶ | 0.001 | MCHR1, PTGER3,
GRM2, GRM8, CNR1, NPY2R, NPBWR2 |
| B | Ubiquitin mediated
proteolysis | 0.021 | 2.096 | UBA6,
HERC1 |
| C | Neuroactive
ligand-receptor interaction |
3.94×10⁻⁹ |
2.36×10⁻⁶ | HCRTR1, P2RY10,
LTB4R, CHRM1, P2RY1, F2RL1, GHSR |
Identification of miRNA-gene
regulatory modules
CyTargetLinker was used to predict miRNA-gene
interactions for the 10 core genes. In total, 305 predicted MTIs
were identified using the MicroCosm database and 277 predicted MTIs
were identified using the TargetScan database, including 456 nodes
and 582 edges. Additionally, setting a threshold functionality of
2, 15 MTIs were found from the MicroCosm and TargetScan databases.
The genes and miRNAs are shown in Fig.
4. Specifically, 7 miRNAs that co-regulate IL2, 3 miRNAs
that regulate PHLPP2, 3 miRNAs that regulate KNG1, 1
miRNA that regulates PIK3CG and 1 miRNA that modulates
POLR2A were detected (Table
VI).
| Table VI.A list of 5 hub genes and their
predicted miRNAs from the CyTargetLinker extension network
analysisa. |
Table VI.
A list of 5 hub genes and their
predicted miRNAs from the CyTargetLinker extension network
analysisa.
| Gene | miRNAs |
|---|
| IL2 | hsa-miR-524-5p,
hsa-miR-520d-5p, hsa-miR-181b, hsa-miR-181a, hsa-miR-181d,
hsa-miR-181c, hsa-miR-186 |
| PHLPP2 | hsa-miR-509-3p,
hsa-miR-134, hsa-miR-367 |
| KNG1 | hsa-miR-361-5p,
hsa-miR-578, hsa-miR-942 |
| PIK3CG | hsa-miR-142-3p |
| POLR2A | hsa-miR-873 |
Discussion
OP has become a pervasive public health problem; it
is characterized by decreased bone strength and an increased risk
of fractures (21). The pathogenesis
of OP involves an imbalance between osteoclast resorption and
osteoblast bone formation. MSCs have multiple differentiation
potential, and they can directly participate in bone formation by
phenotypic differentiation into osteoblasts and indirectly via
paracrine effects. During the process of aging, MSCs in bone marrow
transform into other types of cells, including adipocytes and
osteoblasts, leading to OP (22).
Owing to the high prevalence and gravity of OP, understanding its
pathogenic and molecular mechanisms is urgent for drug development
and treatment. Microarray and high-throughput sequencing approaches
have been used extensively to predict therapeutic targets for
diseases, including OP. In the present study, the gene expression
dataset GSE35956 was obtained from the GEO database to explore core
genes and predict regulatory miRNAs involved in OP. Specifically, 5
hMSC specimens from normal osseous tissues and 5 hMSC specimens
from OP samples were included and 915 DEGs were identified,
including 774 upregulated and 141 downregulated genes.
Subsequently, network topological properties were
analyzed to distinguish between the predicted network and a random
network. A node degree approximating a power-law distribution is a
standard characteristic of scale-free networks, and the PPI network
in this study obeyed this rule (23,24). The 3
subnetworks were true complex biological networks characterized as
scale-free, suggesting that the PPI network is reliable and
robust.
OP-associated DEGs identified in the present study
are not necessarily biologically meaningful. A number of effective
methods, including GO and KEGG analyses, can be used to determine
the importance of DEGs, with the goal of clarifying the roles of
individual molecules in BPs. Accordingly, GO and KEGG pathway
analyses were performed using the DEGs in the present study.
Upregulated DEGs were primarily associated with ‘nervous system
development’, ‘multicellular organism development’, ‘RNA polymerase
II transcription factor activity’, ‘sequence-specific DNA binding
and synapse’, while downregulated DEGs were associated with the
‘regulation of molecular function’, ‘regulation of osteoblast
differentiation’, ‘nucleotide binding’ and ‘extracellular matrix’.
Based on the KEGG pathway analysis, upregulated DEGs were enriched
for ‘neuroactive ligand-receptor interaction’, ‘Rap1 signaling
pathway’, ‘cAMP signaling pathway’, ‘glutamatergic synapse’ and
‘adrenergic signaling in cardiomyocytes’, while the downregulated
DEGs were involved in the ‘p53 signaling pathway’.
Based on an analysis of the PPI network, the
following core genes were identified: ALB, PHLPP2, TOP2A, KNG1,
IL2, LRGUK, PIK3CG, LEP, TF and POLR2A. Among these,
ALB had the highest degree of connectivity. These hub genes,
particularly ALB, TOP2A, KNG1, IL2, PIK3CG, LEP and
TF, were enriched for homeostatic processes and the
regulation of apoptotic processes. A recent study has reported that
homeostatic processes are imbalanced in postmenopausal osteoporotic
women (25). In addition, triggering
apoptotic processes could promote osteoclast apoptosis, thus
alleviating OP (26). It could be
hypothesized that the hub genes are associated with the development
of OP. ALB and its product, which has a good binding
capacity for hormones, is involved in various BPs, including
antioxidant activity, the regulation of apoptotic processes and the
cellular response to starvation. The precise function of ALB
and its role in OP are unclear. However, a previous study found
that the expression of ALB differed significantly between a normal
group and an OP group (P<0.05), and others have linked oxidative
status with bone alterations (27–29).
PHLPP2 is involved in the regulation of protein kinase B (Akt) and
protein kinase C signaling, and mediates dephosphorylation in the
C-terminal domain hydrophobic motif of members of the AGC
serine/threonine protein kinase family. The protein is also
involved in signal transduction and hippocampus development. PHLPP2
exhibits nuclear localization and is expressed in numerous tissue
types, including the small intestine, brain, bone marrow and
ovaries (30). PHLPP inhibitors may
relieve mechanical pain and slow cartilage degradation in
osteoarthritic joints (31).
Therefore, PHLPP2 has a potential regulatory role in OP and
is a target for future research. TOP2A, which encodes a DNA
topoisomerase, is associated with various processes, including
chromosome condensation (32).
Mutations in TOP2A are associated with the development of
drug resistance, including etoposide and doxorubicin (33–35).
Exposure to atmospheric oxygen promotes TOP2A expression in mouse
MSCs, leading to oxidative stress, reduced cell viability and the
inhibition of cell proliferation (36). KNG1 exhibits alternative
splicing to produce 2 distinct proteins: High- and
low-molecular-weight kininogen. KNG1 also factors in the
G-protein-coupled receptor signaling pathway and the inflammatory
response. Zhang et al (37)
revealed that KNG1 is significantly associated with the complement
and coagulation cascade pathway in Kashin-Beck disease. Further
research is required to clarify the role of KNG1 in OP. IL2
proteins are involved in cytokine secretion and are vital for the
proliferation of T and B lymphocytes. Targeted knock-outs of
similar genes in mice cause ulcerative diseases, suggesting that
IL2 serves an important role in antigen-stimulated immune responses
(38). The present study revealed
that IL2 is associated with the positive regulation of
tissue remodeling, including bone remodeling, but little is known
about the effects and mechanisms of IL2 in OP. LRGUK
comprises 3 domains: A leucine-rich repeat, a guanylate kinase-like
domain and an unnamed domain (39).
LRGUK exhibits biased expression in the testis, bone marrow and
lungs, and functions in ATP-binding and kinase activity. Studies on
LRGUK are rare. One previous study demonstrated that
LRGUK is associated with type 2 diabetes and fasting glucose
levels (40). PIK3CG phosphorylates
inositol lipids and is involved in the immune response process; it
serves a vital role by recruiting pleckstrin homology
domain-containing proteins to the membrane, including Akt1, and by
activating signaling cascades involved in cell growth,
proliferation and differentiation (41). Additionally, PIK3CG regulates bone
homeostasis by modulating osteoclastogenesis and bone homeostasis
(42), suggesting that this gene is
linked to OP. LEP encodes a protein secreted by white
adipocytes and serves an important role in energy balance
regulation. This protein is also involved in endocrine function and
in the regulation of immune and inflammatory responses. Tariq et
al (43) found that body weight
and body mass index impact BMD, whereas serum leptin is not
associated with BMD. Zheng et al (44) identified that LEP overexpression in
bone marrow stromal cells can stimulate periodontal regeneration in
osteoporotic conditions. The association between LEP and OP
is unclear, and should be a focus of future studies. TF
encodes an extracellular or secreted glycoprotein with an
N-terminal transmembrane domain and a short cysteine-rich
cytoplasmic loop prior to the unique C-terminal ends (45). The protein is involved in cellular
iron ion homeostasis, post-translational protein modification and
the regulation of protein stability. The putative iron sensor TF
receptor 2 can bind to iron-loaded TF in the bloodstream, which
increases the expression of hepcidin by stimulating the bone
morphogenetic protein signaling pathway (46). POLR2A provides a platform for
transcription, mRNA processing and chromosome remodeling (47). This gene encodes an essential subunit
of RNA polymerase II and is ubiquitously expressed in the testis,
skin and bone marrow, and is involved in numerous physiological
processes, including the regulation of gene silencing by miRNA and
of RNA splicing (48,49). However, the biological functions of
POLR2A in OP remain unknown.
A module analysis of the PPI network demonstrated
that OP is linked to neuroactive ligand-receptor interactions and
ubiquitin-mediated proteolysis. The neuroactive ligand-receptor
interaction pathway can be activated by targeting the cell membrane
G protein coupled receptor, which is involved in signal
transduction from the extracellular to the intracellular
components, including glycine, serine and threonine (50,51).
Neuroactive steroids, which influence the modulation of the
γ-aminobutyric acid receptor, are hormones that act as regulators
of neurotransmitter receptors to either enhance or suppress
neuronal activity (52). Moreover,
ubiquitin-mediated proteolysis has been reported to serve a key
role in MSC osteogenic or adipogenic differentiation (53) and the ubiquitin-mediated proteolysis
pathway serves a critical role in various processes, including the
cell cycle, cellular response to stress, DNA repair and immune
regulation (54). Therefore, combined
with the present results, these data indicate that neuroactive
ligand-receptor interactions and ubiquitin-mediated proteolysis may
serve key roles in the progression of OP, and are potential targets
for drug development and treatment.
In the present study, an integrated miRNA-gene
analysis of core genes associated with OP was performed. An overlap
threshold of 2 was set to identify only interactions supported by 2
MTI databases, and to ensure credible and accurate results.
Overall, 15 predicted miRNAs and their target genes were screened.
IL2 was regulated by miRNAs hsa-miR-524-5p, hsa-miR-520d-5p,
hsa-miR-181b, hsa-miR-181a, hsa-miR-181d, hsa-miR-181c and
hsa-miR-186. These miRNAs were enriched for biological function
terms, including ‘molecular function’, ‘enzyme regulator activity’
and ‘immune system process’. PHLPP2 was associated with
miRNAs hsa-miR-509-3p, hsa-miR-134 and hsa-miR-367, which are
mainly associated with organelles. miRNA hsa-miR-361-5p was
observed to modulate KNG1, along with hsa-miR-942 and
hsa-miR-578. These are involved in blood coagulation and platelet
activation. Furthermore, hsa-miR-142-3p may serve a vital role in
OP by regulating PIK3CG, which is involved in the estrogen
and B cell receptor signaling pathways. miRNA hsa-miR-873, which is
associated with metabolic pathways, co-regulates POLR2A. The
present results indicate that a series of miRNAs simultaneously
regulate the same gene, as observed for IL2, PHLPP2 and
KNG1. Further studies are required to verify these
interactions.
In conclusion, the results of the present study
improve our understanding of the progression of OP based on an
in-depth bioinformatics analysis of DEGs. In total, 915 DEGs and 10
core genes (ALB, PHLPP2, TOP2A, KNG1, IL2, LRGUK, PIK3CG, LEP,
TF and POLR2A) involved in OP were identified.
Additionally, miRNAs associated with target genes were identified;
these may be crucial for the initiation and progression of OP.
However, further experimental studies are required in order to
determine the precise roles of these genes and miRNAs. The present
study provides a useful set of genes and miRNAs for future studies
on the molecular mechanisms of OP and for the determination of
therapeutic targets.
Acknowledgements
Not applicable.
Funding
The National Natural Science Foundation of China
(grant no. 81573874) provided financial support for the conduct of
the study.
Availability of data and materials
The datasets generated and analyzed during the
current study are available in the Gene Expression Omnibus (GEO)
repository (https://www.ncbi.nlm.nih.gov/geo/) (8).
Authors' contributions
QLF, YC and FT designed the study. YC, SMY, FT and
FXL analyzed and interpreted the data. YC, FT and QLF were major
contributors in the writing of the manuscript. All authors read and
approved the submitted manuscript.
Ethics approval and consent to
participate
Not applicable.
Patient consent for publication
Not applicable.
Competing interests
The authors declare that they have no competing
interests.
References
|
1
|
Body JJ, Bergmann P, Boonen S, Boutsen Y,
Devogelaer JP, Goemaere S, Kaufman JM, Rozenberg S and Reginster
JY: Evidence-based guidelines for the pharmacological treatment of
postmenopausal osteoporosis: A consensus document by the Belgian
Bone Club. Osteoporos Int. 21:1657–1680. 2010. View Article : Google Scholar : PubMed/NCBI
|
|
2
|
Chen P, Li Z and Hu Y: Prevalence of
osteoporosis in China: A meta-analysis and systematic review. BMC
Public Health. 16:10392016. View Article : Google Scholar : PubMed/NCBI
|
|
3
|
Svedbom A, Hernlund E, Ivergård M,
Compston J, Cooper C, Stenmark J, McCloskey E, Jönsson B and Kanis
JEU; Review Panel of IOF, . Osteoporosis in the European Union: A
compendium of country-specific reports. Arch Osteoporos. 8:1372013.
View Article : Google Scholar : PubMed/NCBI
|
|
4
|
Ma M, Chen X, Lu L, Yuan F, Zeng W, Luo S,
Yin F and Cai J: Identification of crucial genes related to
postmenopausal osteoporosis using gene expression profiling. Aging
Clin Exp Res. 28:1067–1074. 2016. View Article : Google Scholar : PubMed/NCBI
|
|
5
|
Takayanagi H: Osteoimmunology: Shared
mechanisms and crosstalk between the immune and bone systems. Nat
Rev Immunol. 7:292–304. 2007. View
Article : Google Scholar : PubMed/NCBI
|
|
6
|
Li X, Ge H, Weiszmann J, Hecht R and Li Y,
Véniant M, Xu J, Wu X, Lindberg R and Li Y: Inhibition of lipolysis
may contribute to the acute regulation of plasma FFA and glucose by
FGF21 in ob/ob mice. FEBS Lett. 583:3230–3234. 2009. View Article : Google Scholar : PubMed/NCBI
|
|
7
|
Hao RH, Gao JL, Li M, Huang W, Zhu DL,
Thynn HN, Dong SS and Guo Y: Association between fibroblast growth
factor 21 and bone mineral density in adults. Endocrine. 2018.
View Article : Google Scholar
|
|
8
|
Barrett T, Wilhite SE, Ledoux P,
Evangelista C, Kim IF, Tomashevsky M, Marshall KA, Phillippy KH,
Sherman PM, Holko M, et al: NCBI GEO: Archive for functional
genomics data sets-update. Nucleic Acids Res. 41:(Database Issue).
D991–D995. 2012. View Article : Google Scholar : PubMed/NCBI
|
|
9
|
Kanehisa M and Goto S: KEGG: Kyoto
encyclopedia of genes and genomes. Nucleic Acids Res. 28:27–30.
2000. View Article : Google Scholar : PubMed/NCBI
|
|
10
|
Ashburner M, Ball CA, Blake JA, Botstein
D, Butler H, Cherry JM, Davis AP, Dolinski K, Dwight SS, Eppig JT,
et al: Gene ontology: Tool for the unification of biology. Nature
Genet. 25:25–29. 2000. View
Article : Google Scholar : PubMed/NCBI
|
|
11
|
Benisch P, Schilling T, Klein-Hitpass L,
Frey S, Seefried L, Raaijmakers N, Krug M, Regensburger M, Zeck S,
Schinke T, et al: The transcriptional profile of mesenchymal stem
cell populations in primary osteoporosis is distinct and shows
overexpression of osteogenic inhibitors. PLoS One. 7:e451422012.
View Article : Google Scholar : PubMed/NCBI
|
|
12
|
Venet D, Detours V and Bersini H: A
measure of the signal-to-noise ratio of microarray samples and
studies using gene correlations. PLoS One. 7:e510132012. View Article : Google Scholar : PubMed/NCBI
|
|
13
|
Huang da W, Sherman BT and Lempicki RA:
Systematic and integrative analysis of large gene lists using DAVID
bioinformatics resources. Nat Protoc. 4:44–57. 2009. View Article : Google Scholar : PubMed/NCBI
|
|
14
|
Bindea G, Mlecnik B, Hackl H, Charoentong
P, Tosolini M, Kirilovsky A, Fridman WH, Pagès F, Trajanoski Z and
Galon J: ClueGO: A Cytoscape plug-in to decipher functionally
grouped gene ontology and pathway annotation networks.
Bioinformatics. 25:1091–1093. 2009. View Article : Google Scholar : PubMed/NCBI
|
|
15
|
Doncheva N, Assenov Y, Domingues F and
Albrecht M: Topological analysis and interactive visualization of
biological networks and protein structures. Nat Protoc. 7:670–685.
2012. View Article : Google Scholar : PubMed/NCBI
|
|
16
|
Szklarczyk D, Franceschini A, Wyder S,
Forslund K, Heller D, Huerta-Cepas J, Simonovic M, Roth A, Santos
A, Tsafou KP, et al: STRING v10: Protein-protein interaction
networks, integrated over the tree of life. Nucleic Acids Res.
43:(Database Issue). D447–D452. 2015. View Article : Google Scholar : PubMed/NCBI
|
|
17
|
Shannon P, Markiel A, Ozier O, Baliga NS,
Wang JT, Ramage D, Amin N, Schwikowski B and Ideker T: Cytoscape: A
software environment for integrated models of biomolecular
interaction networks. Genome Res. 13:2498–2504. 2003. View Article : Google Scholar : PubMed/NCBI
|
|
18
|
Bader GD and Hogue CW: An automated method
for finding molecular complexes in large protein interaction
networks. BMC Bioinformatics. 4:22003. View Article : Google Scholar : PubMed/NCBI
|
|
19
|
Benjamini Y and Hochberg Y: Controlling
the false discovery rate: A practical and powerful approach to
multiple testing. J Roy Stat Soc Ser B. 57:289–300. 1995.
|
|
20
|
Kutmon M, Kelder T, Mandaviya P, Evelo CT
and Coort SL: CyTargetLinker: A Cytoscape app to integrate
regulatory interactions in network analysis. PLoS One.
8:e821602013. View Article : Google Scholar : PubMed/NCBI
|
|
21
|
Tella SH and Gallagher JC: Prevention and
treatment of postmenopausal osteoporosis. J Steroid Biochem Mol
Biol. 142:155–170. 2014. View Article : Google Scholar : PubMed/NCBI
|
|
22
|
Ho SS, Vollmer NL, Refaat MI, Jeon O,
Alsberg E, Lee MA and Leach JK: Bone morphogenetic protein-2
promotes human mesenchymal stem cell survival and resultant bone
formation when entrapped in photocrosslinked alginate hydrogels.
Adv Healthc Mater. 5:2501–2509. 2016. View Article : Google Scholar : PubMed/NCBI
|
|
23
|
Maslov S and Sneppen K: Specificity and
stability in topology of protein networks. Science. 296:910–913.
2002. View Article : Google Scholar : PubMed/NCBI
|
|
24
|
Wu B, Xie J, Du Z, Wu J, Zhang P, Xu L and
Li E: PPI network analysis of mRNA expression profile of ezrin
knockdown in esophageal squamous cell carcinoma. Biomed Res Int.
2014:6519542014. View Article : Google Scholar : PubMed/NCBI
|
|
25
|
Korkmaz V, Kurdoglu Z, Alisik M, Turgut E,
Sezgın OO, Korkmaz H, Ergun Y and Erel O: Thiol/disulfide
homeostasis in postmenopausal osteoporosis. J Endocrinol Invest.
40:431–435. 2017. View Article : Google Scholar : PubMed/NCBI
|
|
26
|
Lee EJ, Kim JL, Kim YH, Kang MK, Gong JH
and Kang YH: Phloretin promotes osteoclast apoptosis in murine
macrophages and inhibits estrogen deficiency-induced osteoporosis
in mice. Phytomedicine. 21:1208–1215. 2014. View Article : Google Scholar : PubMed/NCBI
|
|
27
|
Huang C and Li S: Association of blood
neutrophil lymphocyte ratio in the patients with postmenopausal
osteoporosis. Pak J Med Sci. 32:762–765. 2016. View Article : Google Scholar : PubMed/NCBI
|
|
28
|
Spilmont M, Léotoing L, Davicco MJ,
Lebecque P, Mercier S, Miot-Noirault E, Pilet P, Rios L, Wittrant Y
and Coxam V: Pomegranate and its derivatives can improve bone
health through decreased inflammation and oxidative stress in an
animal model of postmenopausal osteoporosis. Eur J Nutr.
53:1155–1164. 2014. View Article : Google Scholar : PubMed/NCBI
|
|
29
|
Wauquier F, Leotoing L, Coxam V, Guicheux
J and Wittrant Y: Oxidative stress in bone remodelling and disease.
Trends Mol Med. 15:468–477. 2009. View Article : Google Scholar : PubMed/NCBI
|
|
30
|
Fagerberg L, Hallström BM, Oksvold P,
Kampf C, Djureinovic D, Odeberg J, Habuka M, Tahmasebpoor S,
Danielsson A, Edlund K, et al: Analysis of the human
tissue-specific expression by genome-wide integration of
transcriptomics and antibody-based proteomics. Mol Cell Proteomics.
13:397–406. 2014. View Article : Google Scholar : PubMed/NCBI
|
|
31
|
Hwang SM, Feigenson M, Begun DL, Shull LC,
Culley KL, Otero M, Goldring MB, Ta LE, Kakar S, Bradley EW and
Westendorf JJ: Phlpp inhibitors block pain and cartilage
degradation associated with osteoarthritis. J Orthop Res.
36:1487–1497. 2018. View Article : Google Scholar : PubMed/NCBI
|
|
32
|
Madabhushi R: The Roles of DNA
Topoisomerase IIβ in Transcription. Int J Mol Sci. 19(pii):
E19172018. View Article : Google Scholar : PubMed/NCBI
|
|
33
|
Lang AJ, Mirski SE, Cummings HJ, Yu Q,
Gerlach JH and Cole SP: Structural organization of the human TOP2A
and TOP2B genes. Gene. 221:255–266. 1998. View Article : Google Scholar : PubMed/NCBI
|
|
34
|
Kaplan E and Gündüz U: Expression analysis
of TOP2A, MSH2 and MLH1 genes in MCF7 cells at different levels of
etoposide resistance. Biomed Pharmacother. 66:29–35. 2012.
View Article : Google Scholar : PubMed/NCBI
|
|
35
|
Raguz S, Adams C, Masrour N, Rasul S,
Papoutsoglou P, Hu Y, Cazzanelli G, Zhou Y, Patel N, Coombes C, et
al: Loss of O6-methylguanine-DNA methyltransferase
confers collateral sensitivity to carmustine in topoisomerase
II-mediated doxorubicin resistant triple negative breast cancer
cells. Biochem Pharmacol. 85:186–196. 2013. View Article : Google Scholar : PubMed/NCBI
|
|
36
|
Boregowda SV, Krishnappa V, Chambers JW,
Lograsso PV, Lai WT, Ortiz LA and Phinney DG: Atmospheric oxygen
inhibits growth and differentiation of marrow-derived mouse
mesenchymal stem cells via a p53-dependent mechanism: Implications
for long-term culture expansion. Stem Cells. 30:975–987. 2012.
View Article : Google Scholar : PubMed/NCBI
|
|
37
|
Zhang F, Wen Y, Guo X, Zhang Y, Wang S,
Yang T, Shen H, Chen X, Tan L, Tian Q and Deng HW: Genome-wide
pathway-based association study implicates complement system in the
development of Kashin-Beck disease in Han Chinese. Bone. 71:36–41.
2015. View Article : Google Scholar : PubMed/NCBI
|
|
38
|
Li J, Hou Y, Ding X, Hou W, Song B and
Zeng Y: Overexpression, purification, molecular characterization
and the effect on tumor growth of ribosomal protein L22 from the
Giant Panda (Ailuropoda melanoleuca). Mol Biol Rep. 41:3529–3539.
2014. View Article : Google Scholar : PubMed/NCBI
|
|
39
|
Okuda H, DeBoer K, O'Connor AE, Merriner
DJ, Jamsai D and O'Bryan MK: LRGUK1 is part of a multiprotein
complex required for manchette function and male fertility. FASEB
J. 31:1141–1152. 2017. View Article : Google Scholar : PubMed/NCBI
|
|
40
|
Laramie JM, Wilk JB, Williamson SL, Nagle
MW, Latourelle JC, Tobin JE, Province MA, Borecki IB and Myers RH:
Polymorphisms near EXOC4 and LRGUK on chromosome 7q32 are
associated with Type 2 Diabetes and fasting glucose; the NHLBI
Family Heart Study. BMC Med Genet. 9:462008. View Article : Google Scholar : PubMed/NCBI
|
|
41
|
Jean S and Kiger AA: Classes of
phosphoinositide 3-kinases at a glance. J Cell Sci. 127:923–928.
2014. View Article : Google Scholar : PubMed/NCBI
|
|
42
|
Kang H, Chang W, Hurley M, Vignery A and
Wu D: Important roles of PI3Kgamma in osteoclastogenesis and bone
homeostasis. Proc Natl Acad Sci USA. 107:12901–12906. 2010.
View Article : Google Scholar : PubMed/NCBI
|
|
43
|
Tariq S, Baig M, Tariq S and Shahzad M:
Association of serum leptin with bone mineral density in
postmenopausal osteoporotic females. Gynecol Endocrinol.
33:287–291. 2017. View Article : Google Scholar : PubMed/NCBI
|
|
44
|
Zheng B, Jiang J, Chen Y, Lin M, Du Z,
Xiao Y, Luo K and Yan F: Leptin overexpression in bone marrow
stromal cells promotes periodontal regeneration in a rat model of
osteoporosis. J Periodontol. 88:808–818. 2017. View Article : Google Scholar : PubMed/NCBI
|
|
45
|
Ramsey J and Mukhopadhyay S: Disentangling
the frames, the state of research on the alphavirus 6K and TF
proteins. Viruses. 9(pii): E2282017. View Article : Google Scholar : PubMed/NCBI
|
|
46
|
Worthen C and Enns C: The role of hepatic
transferrin receptor 2 in the regulation of iron homeostasis in the
body. Front Pharmacol. 5:342014. View Article : Google Scholar : PubMed/NCBI
|
|
47
|
Zhao DY, Gish G, Braunschweig U, Li Y, Ni
Z, Schmitges FW, Zhong G, Liu K, Li W, Moffat J, et al: SMN and
symmetric arginine dimethylation of RNA polymerase II C-terminal
domain control termination. Nature. 529:48–53. 2016. View Article : Google Scholar : PubMed/NCBI
|
|
48
|
Hui-Ying X, Da-Hong Z, Li-Juan J and
Xiao-Jie L: Anticancer opportunity created by loss of tumor
suppressor genes. Technol Cancer Res Treat. 15:729–731. 2016.
View Article : Google Scholar : PubMed/NCBI
|
|
49
|
David CJ, Boyne AR, Millhouse SR and
Manley JL: The RNA polymerase II C-terminal domain promotes
splicing activation through recruitment of a U2AF65-Prp19 complex.
Genes Dev. 25:972–983. 2011. View Article : Google Scholar : PubMed/NCBI
|
|
50
|
Lauss M, Kriegner A, Vierlinger K and
Noehammer C: Characterization of the drugged human genome.
Pharmacogenomics. 8:1063–1073. 2007. View Article : Google Scholar : PubMed/NCBI
|
|
51
|
Bhattarai UR, Katuwal Bhattarai M, Li F
and Wang D: Insights into the temporal gene expression pattern in
lymantria dispar larvae during the baculovirus induced hyperactive
stage. Virol Sin. Jul 25–2018.(Epub ahead of print). View Article : Google Scholar : PubMed/NCBI
|
|
52
|
Wang J, Cheng J, Zhang C and Li X:
Cardioprotection effects of sevoflurane by regulating the pathway
of neuroactive ligand-receptor interaction in patients undergoing
coronary artery bypass graft surgery. Comput Math Methods Med.
2017:36182132017. View Article : Google Scholar : PubMed/NCBI
|
|
53
|
Zhuang Q, Mao W, Xu P, Li H, Sun Z, Li S,
Qiu G, Li J and Zhang J: Identification of differential genes
expression profiles and pathways of bone marrow mesenchymal stem
cells of adolescent idiopathic scoliosis patients by microarray and
integrated gene network analysis. Spine (Phila Pa 1976).
41:840–855. 2016. View Article : Google Scholar : PubMed/NCBI
|
|
54
|
Ciechanover A, Orian A and Schwartz AL:
Ubiquitin-mediated proteolysis: Biological regulation via
destruction. Bioessays. 22:442–451. 2000. View Article : Google Scholar : PubMed/NCBI
|