Introduction
Small cell lung cancer (SCLC) is a highly malignant
cancer. According to a recent review, SCLC accounts for
approximately 15% of cases of lung cancers in the USA (2014), UK
(2014), China (2014) and Korea (2016) (1). Regardless of the progression of the
treatment for the other types of lung cancer, such as targeted
therapy and immunotherapy, the most common therapeutic options for
SCLC are traditional chemotherapy, radiation therapy (RT) and
surgical therapy (2). The outcome of
SCLC has not improved considerably, and the five-year survival of
SCLC is only 7% (1). Thus, besides
pioneering new therapies, modification of traditional ones is
needed, and radiation therapy as a major treatment option for SCLC
needs to be refined.
The effects of RT include undesirable side effects
on normal tissues (3). Normally, a
higher curative effect and a lower side effect are desirable.
Advanced technologies such as intensity-modulated and stereotactic
body RT can limit the irradiation area (4,5);
however, to further avoid damage to normal tissue, it is important
to determine whether the cancer cells are sensitive to radiation as
early as possible. At present, there are no biomarkers in clinical
use for predicting the effectiveness of RT on certain types of the
disease.
Next generation sequencing (NGS) technology provides
high throughput data of gene-transcribed mRNAs and RNAs transcribed
from the non-coding regions. The National Center for Biotechnology
Information (NCBI) Gene Expression Omnibus (GEO) database enables
mass exploration of data to obtain precise and comprehensive
information on diseases. With these tools, the present study aimed
to find a potential biomarker for prediction the effectiveness of
radiation therapy on SCLC by mining in the databases.
Materials and methods
Datasets
The gene expression data GSE55830 was collected from
NCBI GEO datasets (6). This dataset
comprises data of different SCLC cell lines (H69, H128, H146, H209,
H187, H526, D53, D114 and D153) treated with various therapeutic
methods including radiation therapy and chemotherapy, as well as
controls. The experiment was based on Illumina HumanHT-12 V4.0
expression beadchip (GPL10558). BRB-ArrayTools integrated in Excel
2016 (Microsoft Corporation) was used to display the data with
default parameters (7).
Identification of the underlying
targets
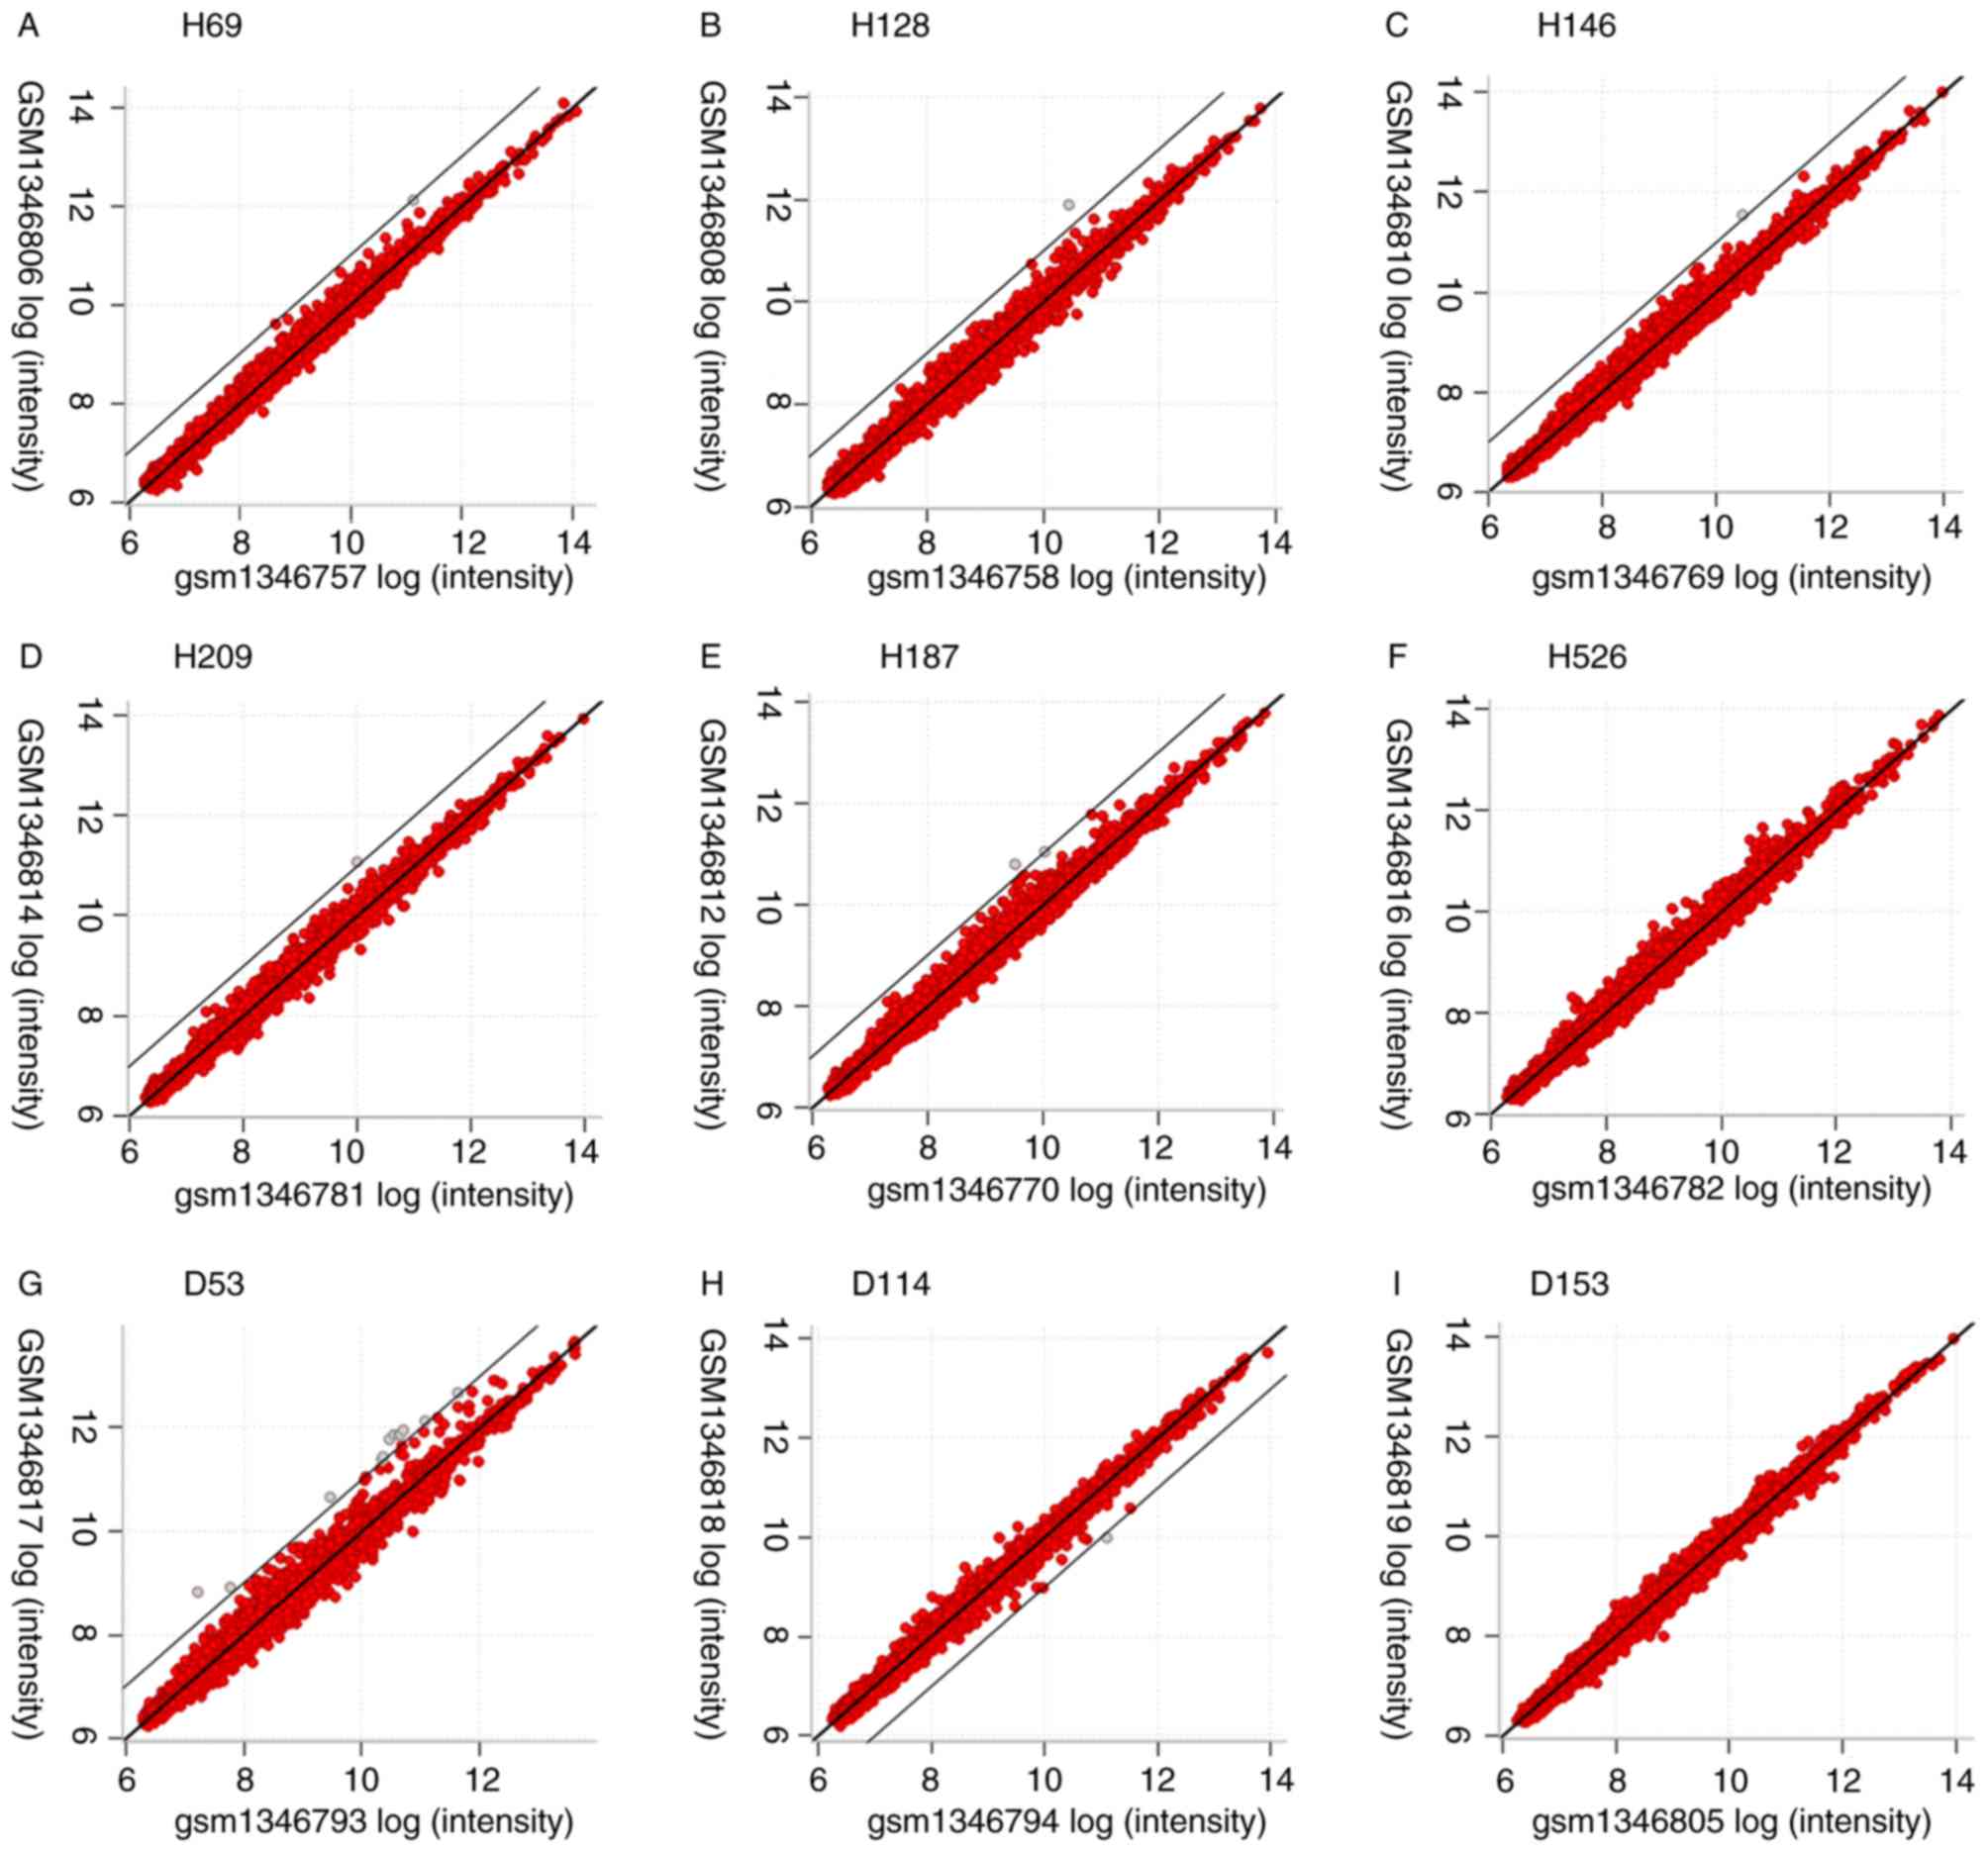
The ‘Array vs. Array’ module in BRB-ArrayTools was
used to display the differentially expressed sequences between
radiation-treated and the control arrays of each cell line on a
log2 scale.
Classification of differentially
expressed genes (DEGs)
Cell lines were divided into two groups with a
cut-off of 2-fold transcription change of the chosen sequence in
the former step. Each cell line was respectively categorized as
group A when the transcription levels of PPIAP43 were increased ≥2
fold following 2 Gy gamma radiation compared with the unirradiated
control cells, or group B when the transcription levels of PPIAP43
were decreased or increased <2 fold following 2 Gy gamma
radiation compared with the unirradiated control cells. The two
groups were processed by the class comparison module between
controls and radiation groups paired by cell line names.
Functional clustering of the
differentially expressed genes and pathway determination
The upregulated and downregulated genes in the
radiation group were analyzed by the Database for Annotation,
Visualization and Integrated Discovery online tool for Gene
Ontology (GO) annotation and Kyoto Encyclopedia or Genes and
Genomes (KEGG) pathway determination (8,9).
Detection of adjacent genes
NCBI Gene database was used to identify the adjacent
genes, the transcription of which can be affected by the
pseudogene. The transcription changes of the adjacent gene and the
pseudogene PPIAP43 were calculated as the difference between
radiation and the control group normalized to the control value:
Fold change = (radiation-control)/control.
Detection of protein candidates
interacting with the RNA transcript
The RNA transcript of the pseudogene was uploaded in
the catRAPID omics ‘transcript vs nucleotide-binding proteome’
module of the catRAPID online toolkits (10). This tool identified a series of
proteins that may bind with the target nucleotide.
MicroRNA (miRNA) determination
miRDB online (11,12) was
used to align potential miRNAs with RNA transcripts of pseudogenes
PPIAP43 and PPIA.
Basic Local Alignment Searching Tool
(BLAST) of peptidyl-prolyl cis-trans isomerase A (PPIA) and
PPIAP43
NCBI BLAST (https://blast.ncbi.nlm.nih.gov/Blast.cgi) was used to
align the DNA sequences with pseudogene PPIAP43 and PPIA.
Database construction
Microsoft Access 2016 (Microsoft Corporation) was
used for managing and relate the data across different tables.
Results
Screening upregulated and
downregulated expression nucleotides after 2 Gy gamma radiation in
each cell line
A total of 6,034 genes were displayed in Excel, and
nine cell lines comprising H69, H128, H146, H187, H209, H526, D53,
D114 and D153 were extracted from the dataset. PPIAP43 was
upregulated by ≥2-fold in H69, H128, H146, H209 and H187 following
radiation compared with non-irradiated controls, and was the only
upregulated transcript in former four cell lines and one of the two
in the H187 cell line (Tables I and
II; Fig.
1). No ≥2-fold downregulated transcripts were identified in
H69, H128, H146, H209 and H187 cells (Table II; Fig.
1). TAF15 was the only downregulated transcript in H114,
whereas no upregulated transcripts were identified. In H526 and
D153, no transcripts were differentially expressed. Multiple
differentially expressed RNAs were only identified in D53, all of
which were upregulated. These findings were based on the criterion
of ≥2-fold change (Table II).
 | Table I.Experimental design. |
Table I.
Experimental design.
| Cell line | Experiment ID of
control | Experiment ID of
radiation | PPIAP43 over
transcribed | Group |
|---|
| H69 | GSM1346757 | GSM1346806 | Yes | A |
| H128 | GSM1346758 | GSM1346808 | Yes | A |
| H146 | GSM1346769 | GSM1346810 | Yes | A |
| H187 | GSM1346770 | GSM1346812 | Yes | A |
| H209 | GSM1346781 | GSM1346814 | Yes | A |
| H526 | GSM1346782 | GSM1346816 | No | B |
| D53 | GSM1346793 | GSM1346817 | No | B |
| D114 | GSM1346794 | GSM1346818 | No | B |
| D153 | GSM1346805 | GSM1346819 | No | B |
| Table II.Transcripts with an up or
downregulated transcriptional fold change ≥2-fold following 2 Gy
gamma radiation in each small cell lung cancer cell line. |
Table II.
Transcripts with an up or
downregulated transcriptional fold change ≥2-fold following 2 Gy
gamma radiation in each small cell lung cancer cell line.
| A, Upregulated
transcripts |
|---|
|
|---|
| Cell line | ID | Transcript | ILMN gene | Entrez gene ID | Cytoband |
|---|
| H69 | ILMN_3208715 | ILMN_162197 | PPIAP43 | 440063 | 11q22.1c |
| H128 | ILMN_3208715 | ILMN_162197 | PPIAP43 | 440063 | 11q22.1c |
| H146 | ILMN_3208715 | ILMN_162197 | PPIAP43 | 440063 | 11q22.1c |
| H209 | ILMN_3208715 | ILMN_162197 | PPIAP43 | 440063 | 11q22.1c |
| H187 | ILMN_3208715 | ILMN_162197 | PPIAP43 | 440063 | 11q22.1c |
| H187 | ILMN_3251587 | ILMN_177351 | LOC100008589 | 100008589 |
|
| D53 | ILMN_1656868 | ILMN_45317 | LOC23117 | 23117 | 16p12.2a |
| D53 | ILMN_1772492 | ILMN_22327 | MCART1 | 92014 | 9p13.2a |
| D53 | ILMN_1807291 | ILMN_175467 | CYP1A1 | 1543 | 15q24.1b |
| D53 | ILMN_1892403 | ILMN_168446 | SNORD13 | 692084 | 8p12c |
| D53 | ILMN_2070052 | ILMN_25996 | LOC613037 | 613037 | 16p11.2d |
| D53 | ILMN_2075794 | ILMN_169055 | NLRP8 | 126205 | 19q13.42c |
| D53 | ILMN_2117809 | ILMN_17811 | DUXAP3 | 503632 | 10q11.21a |
| D53 | ILMN_2162367 | ILMN_167637 | DMC1 | 11144 |
22q13.1b-q13.1c |
| D53 | ILMN_2342455 | ILMN_15173 | PPA2 | 27068 | 4q24d |
| D53 | ILMN_3243664 | ILMN_20243 | LOC440353 | 440353 | 16p11.2d |
| D53 | ILMN_3304111 | ILMN_347878 | LOC729978 | 729978 | 16p13.13b |
| D53 | ILMN_3310491 | ILMN_388662 | MIR1978 | 100302173 |
|
|
| B, Downregulated
transcripts |
|
| Cell
line | ID |
Transcript | ILMN
Gene | Entrez gene
ID |
Cytoband |
|
| D114 | ILMN_1678707 | ILMN_18523 | TAF15 | 8148 | 17q12b |
Detection of differentially expressed
genes
Considering the similarity of expression change
patterns among H69, H128, H146, H209 and H187 cells and the
difficulty to determine discovery with the lack of adequate cell
types of each expression change pattern in the other four cell
lines, the cell lines were divided into two groups, with H69, H128,
H146, H209 and H187 labeled group A, and H526, D53, D114 and D153
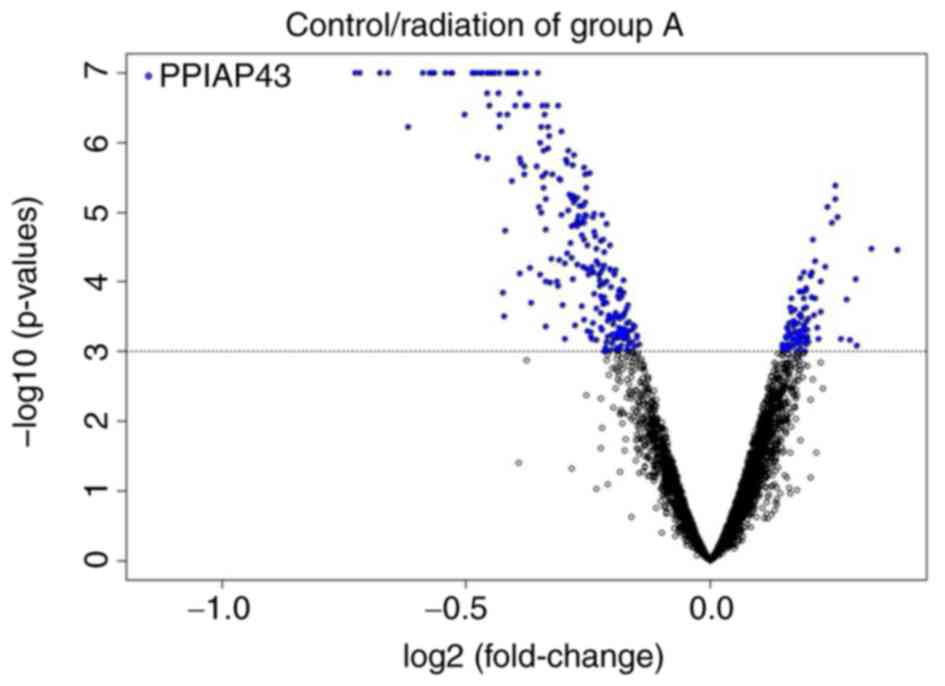
labeled group B. Group A was assessed using a t-test (with a random
variance model) class comparison between the radiation and control
groups paired by cell type with a P<0.001 nominal significance
threshold of univariate tests. A total of 355 transcripts passed
the filter with 259 upregulated and 96 downregulated transcripts
(Fig. 2). False discovery rates
(FDRs) were <0.018; the FDR of ILMN_3208715, which was annotated
as PPIAP43, was <1×10⁻⁷. Top five upregulated genes
or pseudogenes in group A are presented in Table II. Group B was processed by the same
algorithm; three upregulated and nine downregulated transcripts
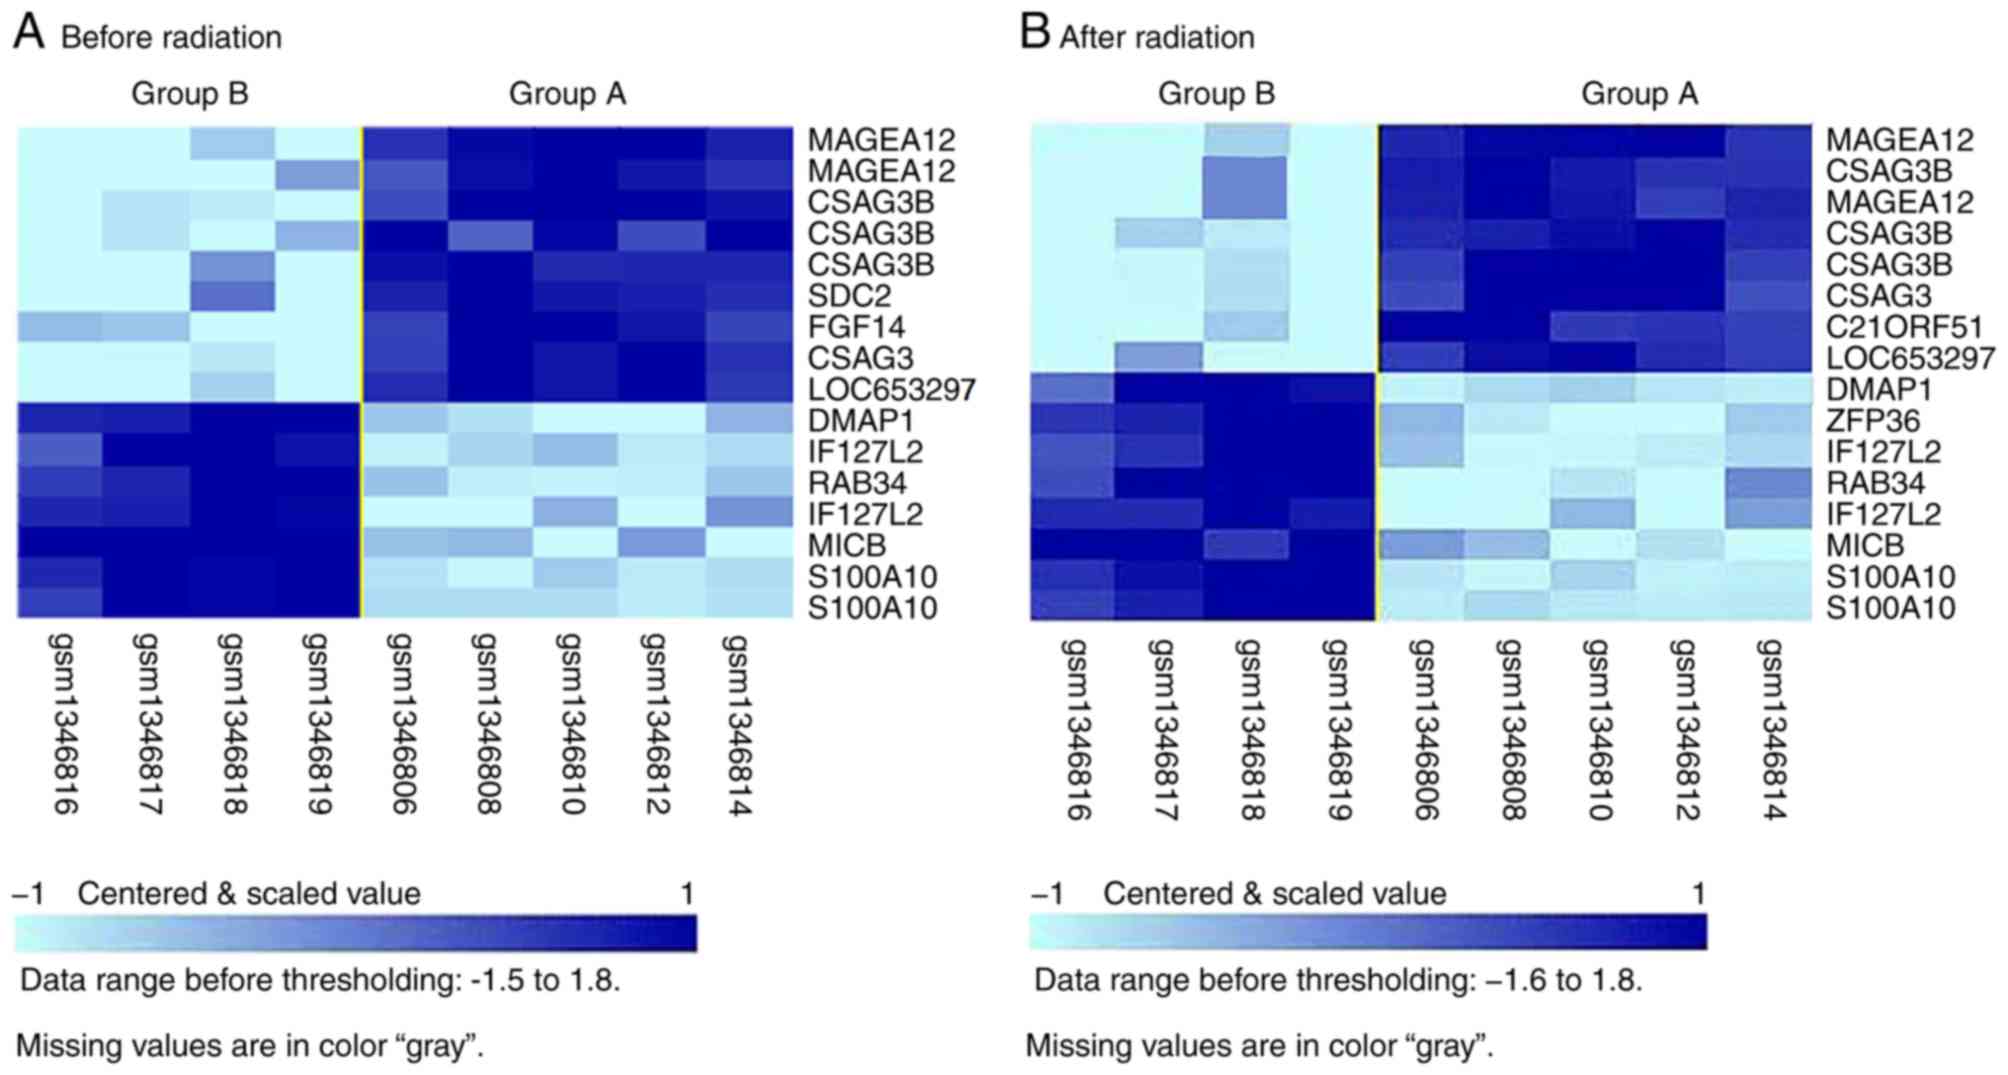
were identified on average. The transcription patterns of the two
groups before and after radiation were distinguishable from each
other (Fig. 3). The genes highly
expressed before and after radiation in radiosensitive group A
compared with group B were identified to be genes that are highly
expressed in normal testis and lymph nodes. The genes highly
expressed before and after radiation in radiosensitive group B
compared with group A were related with the cell cycle (Table III). Although P-values of these
differentially expressed genes between the radiation and control of
group B were all <0.001, FDRs were >0.05, with the lowest
FDR=0.0658.
| Table III.Differentially expressed genes with
different probes consecutively expressed before and after
radiation. |
Table III.
Differentially expressed genes with
different probes consecutively expressed before and after
radiation.
| UniqueID | Gene name | Before P-value | Before fold
change | After P-value | After fold
change | Function |
|---|
| ILMN_2231003 | MAGEA12 | 0.000993 | 0.28 | 0.000689 | 0.25 | Highly expressed in
normal testis |
| ILMN_2412880 | CSAG3B | 0.000009 | 0.32 | 0.000011 | 0.31 | Highly expressed in
normal testis, lymph node and spleen |
| ILMN_1718107 | MAGEA12 | 0.000288 | 0.30 | 0.000376 | 0.32 | Highly expressed in
normal testis |
| ILMN_1761122 | CSAG3B | 0.000030 | 0.39 | 0.000028 | 0.40 | Highly expressed in
normal testis, lymph node and spleen |
| ILMN_2297352 | CSAG3B | 0.000026 | 0.45 | 0.000078 | 0.48 | Highly expressed in
normal testis, lymph node and spleen |
| ILMN_3260910 | CSAG3 | 0.000014 | 0.56 | 0.000060 | 0.54 | Highly expressed in
normal testis, lymph node and spleen |
| ILMN_1803852 | LOC653297 | 0.000528 | 0.59 | 0.000693 | 0.61 | Similar to
CSAG3B |
| ILMN_2328813 | DMAP1 | 0.000198 | 1.85 | 0.000290 | 1.84 | Transcription
repression and activation |
| ILMN_1740319 | IFI27L2 | 0.000195 | 2.23 | 0.000454 | 1.99 | Apoptosis |
| ILMN_1810486 | RAB34 | 0.000659 | 2.57 | 0.000836 | 2.33 | Repositioning of
lysosomes and the activation of macropinocytosis |
| ILMN_3238560 | IFI27L2 | 0.000095 | 2.68 | 0.000137 | 2.64 | Apoptosis |
| ILMN_1708006 | MICB | 0.000798 | 3.28 | 0.000683 | 3.14 | Stress-induced
self-antigen |
| ILMN_1796712 | S100A10 | 0.000095 | 3.96 | 0.000187 | 3.80 | Cell cycle
progression and differentiation |
| ILMN_2046730 | S100A10 | 0.000024 | 7.34 | 0.000036 | 6.95 | Cell cycle
progression and differentiation |
GO function and KEGG pathway
analysis
Upregulated and downregulated genes in group A were
uploaded in DAVID. Although there were more upregulated transcripts
compared with downregulated transcripts, the upregulated genes were
involved in fewer (four pathways in total) and less reliable
pathways (P>0.01 in all 4 pathways) (Table IVA). By contrast, 22 pathways were
identified in the downregulated genes; four of these genes
exhibited P<0.01 (Table
IVB).
| Table IV.Pathways of upregulated and
downregulated genes in group A after radiation. |
Table IV.
Pathways of upregulated and
downregulated genes in group A after radiation.
| A, pathways of
upregulated genes |
|---|
|
|---|
| Category | Term | Count | % | P-value | List total | Fold
enrichment |
|---|
| KEGG_PATHWAY | hsa01100: Metabolic
pathways | 19 | 8.558559 | 0.018995 | 63 | 1.701902 |
| KEGG_PATHWAY | hsa04110:Cell
cycle | 5 | 2.252252 | 0.025133 | 63 | 4.402842 |
| KEGG_PATHWAY | hsa00270:Cysteine
and methionine metabolism | 3 | 1.351351 | 0.045657 | 63 | 8.620301 |
| KEGG_PATHWAY | hsa03420:Nucleotide
excision repair | 3 | 1.351351 | 0.066706 | 63 | 6.969605 |
|
| B, pathways of
downregulated genes |
|
|
Category | Term | Count | % | P-value | List
total | Fold
enrichment |
|
| UP_KEYWORDS | Phosphoprotein | 44 | 55 | 0.000379 | 72 | 1.525258 |
| UP_KEYWORDS | Cytoplasm | 29 | 36.25 | 0.001841 | 72 | 1.721256 |
| UP_KEYWORDS | Methylation | 11 | 13.75 | 0.002205 | 72 | 3.141178 |
| UP_KEYWORDS | Alternative
splicing | 49 | 61.25 | 0.004189 | 72 | 1.322992 |
| UP_KEYWORDS | Ubl
conjugation | 13 | 16.25 | 0.013193 | 72 | 2.179480 |
| UP_KEYWORDS | Coated pit | 3 | 3.75 | 0.013416 | 72 | 16.814542 |
| UP_KEYWORDS | Golgi
apparatus | 8 | 10 | 0.021676 | 72 | 2.816229 |
| UP_KEYWORDS | Endosome | 6 | 7.5 | 0.025215 | 72 | 3.565662 |
| UP_KEYWORDS | Cell junction | 7 | 8.75 | 0.028843 | 72 | 2.964342 |
| UP_KEYWORDS | Membrane | 35 | 43.75 | 0.030912 | 72 | 1.335022 |
| UP_KEYWORDS | Dyskeratosis
congenita | 2 | 2.5 | 0.037309 | 72 | 51.972222 |
| UP_KEYWORDS | Acetylation | 19 | 23.75 | 0.039913 | 72 | 1.586185 |
| UP_KEYWORDS | Cytoskeleton | 9 | 11.25 | 0.041696 | 72 | 2.260655 |
| KEGG_PATHWAY | hsa04530: Tight
junction | 3 | 3.75 | 0.048329 | 29 | 8.179548 |
| UP_KEYWORDS | Endocytosis | 3 | 3.75 | 0.065530 | 72 | 7.087121 |
| INTERPRO | IPR012677:
Nucleotide-binding, alpha-beta plait | 4 | 5 | 0.067759 | 67 | 4.196970 |
| UP_KEYWORDS | Microtubule | 4 | 5 | 0.072561 | 72 | 4.083532 |
| UP_KEYWORDS | Autophagy | 3 | 3.75 | 0.074222 | 72 | 6.596474 |
| UP_KEYWORDS |
Ribonucleoprotein | 4 | 5 | 0.082570 | 72 | 3.862800 |
| UP_KEYWORDS | Oxidation | 2 | 2.5 | 0.089138 | 72 | 21.173868 |
| UP_KEYWORDS | Isopeptide
bond | 8 | 10 | 0.094746 | 72 | 2.020122 |
| KEGG_PATHWAY | hsa04611: Platelet
activation | 3 | 3.75 | 0.097433 | 29 | 5.474005 |
mRNA transcription from an adjacent
protein-coding gene is negatively correlated with the transcription
of PPIAP43
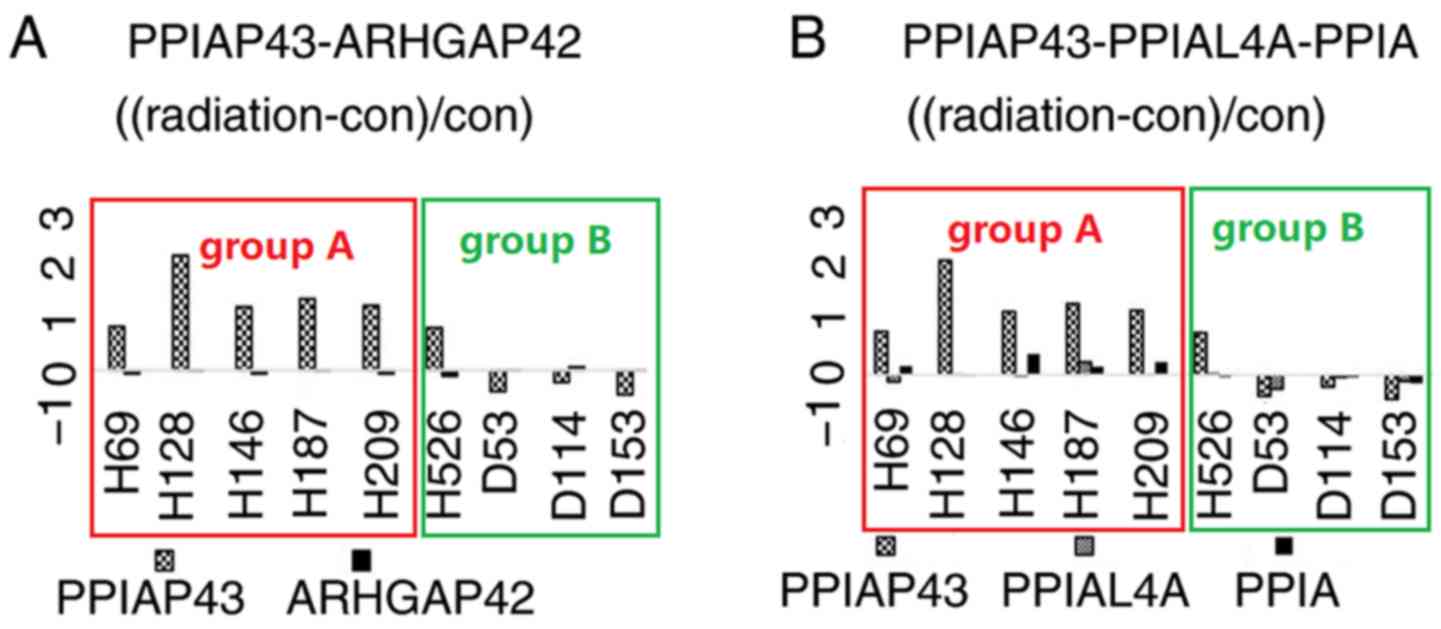
Pearson correlation analysis of transcriptional
changes between PPIAP43 and ARHGAP42 showed the correlation
coefficient was −0.584 (P=0.099) suggesting that there was no
statistically significant correlation between transcriptional
changes of PPIAP43 and ARHGAP42. The adjacent transcription effects
of the pseudogene PPIAP43 on the only nearby coding gene Rho GTPase
activating protein 42 (ARHGAP42) were limited, as previous studies
suggested that the transcription of lncRNA is positively correlated
with transcription of nearby protein-coding genes if there is an
effect on adjacent protein-coding genes by lncRNA transcription
(13,14). The transcription levels of PPIAP43
and ARHGAP42 changed in opposite directions following radiation
(Fig. 4). Of note, no P-value of the
expression of ARHGAP42 in the original dataset was <0.01, which
may be a limitation of this evaluation.
Proteins predicted to interact with
the identified lncRNA
The sequence of the RNA transcript of PPIAP43 was
uploaded to the catRAPID omics ‘transcript vs. nucleotide-binding
proteome’ module of the catRAPID online toolkits (http://service.tartaglialab.com/page/catrapid_group).
The identified 118 proteins as candidates that may bind with the
RNA transcript of PPIAP43. Of these, nine proteins, including TIAR,
SRS10, SRSF2, TRA2B, TIA1, SFPQ, SRSF7, SRSF9 and PCBP2 were marked
by catRAPID omics with necessary domains and motifs for
nucleotide-binding. These nine proteins were annotated by DAVID to
serve functions in nucleotide binding and splicing proteins
(Table V).
| Table V.Annotation of protein candidates to
bind with the RNA transcript of PPIAP43. |
Table V.
Annotation of protein candidates to
bind with the RNA transcript of PPIAP43.
| Category | Term | Count | P-value | Genes | Pop hits | FDR |
|---|
|
GOTERM_MF_DIRECT |
GO:0000166~nucleotide binding | 6 | <0.001 | SRSF2, SRSF7, SFPQ,
TIA1, SRSF9, TRA2B | 253 | <0.001 |
|
GOTERM_BP_DIRECT | GO:0048025~negative
regulation of mRNA splicing, via spliceosome | 3 | <0.001 | SRSF7, SRSF9,
TRA2B | 14 | 0.0132 |
|
GOTERM_MF_DIRECT | GO:0036002~pre-
mRNA binding | 2 | 0.0036 | SRSF2, TRA2B | 6 | 2.1484 |
|
GOTERM_MF_DIRECT | GO:0044822~poly(A)
RNA binding | 4 | 0.0089 | SRSF7, TIA1, SRSF9,
POP1 | 789 | 5.2146 |
|
GOTERM_BP_DIRECT |
GO:0000381~regulation of alternative mRNA
splicing, via spliceosome | 2 | 0.0136 | SRSF2, TRA2B | 28 | 9.5745 |
BLAST of PPIA and the pseudogenes
Two aligned sections (3732 to 3917 and 5327 to 5657
of the PPIA gene sequence with identities of 96 and 94%,
respectively) were identified on RNA transcripts of PPIAP43 and
PPIA, with the second aligned section (5327 to 5657) located
primarily in the 3′-untranslated region (UTR) of PPIA mRNA
(Table VI). In addition, PPIA
pseudogenes PPIAP33, PPIAP80, PPIAP35 which were also upregulated
by radiation, were aligned with PPIA in two sections similar to
PPIAP43.
| Table VI.MicroRNAs with the ability to bind
with the RNA transcript of PPIAP43 and mRNAs of PPIA and
PPIAL4A. |
Table VI.
MicroRNAs with the ability to bind
with the RNA transcript of PPIAP43 and mRNAs of PPIA and
PPIAL4A.
| Gene name | miRNA | PPIAP43 transcript
target score | PPIAP43 transcript
target site number | Gene transcript
target score | mRNA target site
number | Binding
locations |
|---|
| PPIA | hsa-miR-876-3p | 74 | 1 | 92 | 1 | 5485 (3′UTR) |
| PPIAL4A | hsa-miR-4288 | 79 | 1 | 87 | 1 | 151 |
| PPIAL4A | hsa-miR-4456 | 72 | 1 | 52 | 1 | 597 |
| PPIAL4A | hsa-miR-1825 | 59 | 2 | 55 | 2 | 194, 290 |
miRNA binding with PPIAP43 and PPIA or
peptidyl-prolyl cis-trans isomerase A like 4A (PPIAL4A)
A total of 12 and 28 miRNAs were predicted to be
able to bind with the RNA transcripts of PPIAP43 and PPIA,
respectively. By contrast, only one miRNA hsa-miR-876-3p, whose
binding ability had been confirmed by 91 RNA-seq reads from 21
experiments, was predicted to be able to bind with PPIAP43 and
PPIA. There was one binding site on PPIAP43 (target score, 74/100)
and three binding sites on PPIA (target score, 92/100) (Table VI). Two of the PPIA binding sites
were on pre-mRNA, and one was on the 3′UTR. By contrast, three
miRNAs were predicted to bind with RNA transcripts of PPIAP43 and
PPIAL4A (Table VI). Transcription
changes of PPIAP43, PPIA and PPIAL4A following radiation are
presented in Fig. 4.
Discussion
Radiation therapy remains a major form of treating
patients with SCLC. However, radio-sensitivity amongst different
SCLC cell lines vary. Therefore, identifying potential biomarkers
for predicting radio-sensitivity, may help predict a patient's
response to this mode of treatment. The results of the present
study identified a lncRNA transcribed from pseudogene PPIAP43,
which was overexpressed in several SCLC cell types (group A)
following 2 Gy gamma radiation by ≥2-fold compared with the
non-irradiated control group by bioinformatic processing of a GEO
dataset. In addition, other SCLC cell lines (group B) exhibited no
gene upregulation following radiation. Although the statuses of
cytotoxicity column were ‘YES’ in groups A and B in the table of
experiment descriptors displayed by the BRB ArrayTools, the
original study using this GEO dataset demonstrated that the
survival fraction of cell line H146 in group A and D153 in group B
were ~60 and 70%, respectively (Table
VII) (6). Another previous study
revealed that the 2 Gy X-RAY survival fractions of H69, H187 and
H209 were 0.23, 0.18 and 0.37, respectively, compared with 0.72 in
H526 cells (Table VII) (15). These two studies demonstrated that
the survival fractions following 2 Gy ionized radiation in cell
lines in group A were lower compared with those in group B,
although survival fraction values varied based on the irradiation
type, cell type and other factors. These results suggest that the
radiation sensitivity was different in the two groups. Therefore,
the transcription change models of PPIAP43 before and after
radiation may serve as a potential marker for classifying the two
groups of SCLC cell lines into high and low sensitivity groups.
| Table VII.Survival fractions of cell lines
after 2 Gy radiation. |
Table VII.
Survival fractions of cell lines
after 2 Gy radiation.
| Cell line | PPIAP43
over-transcribed | Group | Survival fraction
after 2 Gy γ-radiation (3) | Survival fraction
after 2 Gy X-radiation (10) |
|---|
| H69 | Yes | A |
| 0.23 |
| H146 | Yes | A | 0.6 |
|
| H187 | Yes | A |
| 0.18 |
| H209 | Yes | A |
| 0.37 |
| H526 | No | B |
| 0.72 |
| D153 | No | B | 0.7 |
|
Further investigation revealed that pseudogene
PPIAP43 was located on 11q22.1, and the only nearby protein-coding
gene, which may be affected by transcription of PPIAP43, was
ARHGAP42. Previous studies demonstrated that lncRNA may affect the
transcription of adjacent genes by targeting activators and
repressors of mRNA transcription (13,14).
According to these results, PPIAP43 may affect the transcription of
its adjacent gene ARHGAP42 by binding with nucleotide-binding
proteins. However, Pearson's correlation analysis of
transcriptional changes between PPIAP43 and ARHGAP42 was −0.584,
with significance of 0.099; with former studies suggesting that the
transcription of lncRNA is positively correlated with transcription
of nearby protein-coding genes if there is an effect on adjacent
protein-coding genes by lncRNA transcription (13,14),
which indicated that PPAP43 did not statistically affect ARHGAP42
on a transcriptional level.
Another functional role of PPIAP43 is competing
endogenous RNA. In this model, the RNA transcript of a pseudogene
may act as a decoy to target and capture miRNAs, which can bind
with RNAs of the pseudogenes and their gene counterparts (16,17). For
example, in the case of the RNA of pseudogene phosphatase and
tensin homolog pseudogene 1 (PTENP1), the expression level of the
tumor suppressor gene PTEN is upregulated when the PTENP1 RNA is
upregulated which results in decreased cancer cell proliferation;
similarly, the expression level of the oncogene B-Raf
proto-oncogene is upregulated when PTEN pseudogene 1 RNA is
upregulated, which leads to increased proliferation of cancer cells
(13,14). In the present study, an aligned
section on PPIA mRNA and RNA transcript of PPIAP43 to which miRNA
could bind was identified. In addition, miRNA hsa-miR-876-3p was
predicted by miRDB to be capable of binding with PPIA and PPIAP43
(18–26). The binding ability of this miRNA has
been confirmed by 21 experiments (18–26).
In addition, increase of RNA transcript PPIAP43 lead
to upregulation of RNA transcript of PPIA. The upregulated
transcription of other PPIA pseudogenes in the studied cell lines
also suggested that the cross-talk between PPIA RNA and its
pseudogenes mediated by miRNAs may be the dominant function pattern
of PPIAP43. This suggests that under radiation stress,
radiation-sensitive cells may generate more free radicals including
hydroxyl radicals (27–29) compared with insensitive cells,
therefore upregulating expression of PPIA (30). With the decoy effect of upregulated
RNAs of PPIA pseudogenes, the binding between miRNAs and the mRNA
of PPIA is decreased, the survival of PPIA mRNA is prolonged, and
therefore the expression of PPIA protein is increased (17). Cyclosporine can bind with PPIA (also
termed Cyclophilin A, CyPA) and other cyclophilins to suppress
organ rejection by coupling with cyclosporin (31). Overexpression of PPIA is associated
with poor response to inflammatory disease, cancer metastasis
progression and aging (32). In lung
cancer, exogenous PPIA protein stimulates H446 cell growth, whereas
PPIA knockdown may lead to slower growth, decreased proliferation
and increased apoptosis in cell lines ADLC-5M2 and LC-103H
(25,26,33,34).
Therefore, the overexpressed RNAs of PPIAP43 and other PPIA
pseudogenes may serve as a remedy for reactive oxygen species (ROS)
accumulation induced by ionizing radiation to rescue the sensitive
cancer cells by the decoy effect on miRNAs. In addition, there may
be other resistance mechanisms used by less radio-sensitive cell
types in group B. Nevertheless, the upregulated transcription of
PPIAP43 and the slightly downregulated PPIA transcription in H526
cells suggests that this cell type may be classified as
high-sensitivity, although the upregulated transcriptional change
of PPIAP43 in H526 was <2-fold following irradiation. This may
have been due to the different conditions of gamma ray, from which
transcription data was collected, and X-ray, from which the
survival fraction data was collected, although there may be other
influencing factors that still need to be identified.
There were certain limitations to the present in
silico study. First, the transcription levels of PPIAP43 in the
H526 cell line was not as distinct compared with those in the cell
lines in group A as compared with the levels in the other cell
lines in group B. Second, the survival fractions of the cell lines
were obtained from different studies with incomplete information.
Third, epigenetics may be also involved in the function of PPIAP43
(35), which was not considered in
the present study.
A previous study demonstrated that an increased
Ki-67 proliferation index may represent a predictive factor for
increased tumor radio-sensitivity (36). The present study identified a
potential radio-sensitivity indicator for SCLC cell lines following
early radiation in vitro. The results of this study revealed
that a ≥2-fold transcriptional change of pseudogene PPIAP43
following irradiation with 2 Gy gamma radiation may represent a
predictive factor for increased tumor radiosensitivity. To describe
this association in detail, additional studies with more cell types
and experimental methods are required. Further in vivo
studies, particularly studies involving blood tests, may provide a
basis to use the lncRNA identified in the present study to help
early identification of less radiation-sensitive SCLC types and
reduce the unnecessary radiation side effects in patients with
SCLC.
Acknowledgements
Not applicable.
Funding
This study was supported by The National Key
Research and Development Program of China (grant. no.
2018YFC1313200).
Availability of data and materials
The datasets used and/or analyzed during the present
study are available from the corresponding author on reasonable
request.
Authors' contributions
JY conceived and designed the study. SW conducted
the experiment and analysis, and drafted the manuscript. JY and SW
reviewed, edited and approved the manuscript.
Ethics approval and consent to
participate
Not applicable.
Patient consent for publication
Not applicable.
Competing interests
The authors declare that they have no conflicts of
interest.
Glossary
Abbreviations
Abbreviations:
|
SCLC
|
small cell lung cancer
|
|
RT
|
radiation therapy
|
|
PPIA
|
peptidyl-prolyl cis-trans isomerase
A
|
|
PPIAP43
|
peptidyl-prolyl cis-trans isomerase A
pseudogene 43
|
|
miRNA
|
micro RNA
|
|
lncRNA
|
long non-coding RNA
|
|
GO
|
Gene Ontology
|
|
DEG
|
differentially expressed gene
|
|
BLAST
|
Basic Local Alignment Searching
Tool
|
|
DAVID
|
the Database for Annotation,
Visualization and Integrated Discovery
|
|
KEGG
|
Kyoto Encyclopedia of Genes and
Genomes
|
|
ARHGAP42
|
Rho GTPase activating protein 42
|
|
PPIAL4A
|
peptidyl-prolyl cis-trans isomerase A
like 4A.
|
References
|
1
|
Gazdar AF, Bunn PA and Minna JD:
Small-cell lung cancer: What we know, what we need to know and the
path forward. Nat Rev Cancer. 17:725–737. 2017. View Article : Google Scholar : PubMed/NCBI
|
|
2
|
Sabari JK, Lok BH, Laird JH, Poirier JT
and Rudin CM: Unravelling the biology of SCLC: Implications for
therapy. Nat Rev Clin Oncol. 14:549–561. 2017. View Article : Google Scholar : PubMed/NCBI
|
|
3
|
Hendricks MV, Sheils WC and Davis WB:
Radiation-induced lung injury. Clin Pulm Med. 6:287–295. 1999.
View Article : Google Scholar
|
|
4
|
Videtic GM, Stephans KL, Woody NM, Pennell
NA, Shapiro M, Reddy CA and Djemil T: Stereotactic body radiation
therapy-based treatment model for stage I medically inoperable
small cell lung cancer. Pract Radiat Oncol. 3:301–306. 2013.
View Article : Google Scholar : PubMed/NCBI
|
|
5
|
Jassem J: The rote of radiotherapy in lung
cancer: Where is the evidence? Radiother Oncol. 83:203–213. 2007.
View Article : Google Scholar : PubMed/NCBI
|
|
6
|
Owonikoko TK, Zhang G, Deng X, Rossi MR,
Switchenko JM, Doho GH, Chen Z, Kim S, Strychor S, Christner SM, et
al: Poly (ADP) ribose polymerase enzyme inhibitor, veliparib,
potentiates chemotherapy and radiation in vitro and in vivo in
small cell lung cancer. Cancer Med. 3:1579–1594. 2014. View Article : Google Scholar : PubMed/NCBI
|
|
7
|
Simon R, Lam A, Li MC, Ngan M, Menenzes S
and Zhao Y: Analysis of gene expression data using BRB-ArrayTools.
Cancer Inform. 3:11–17. 2007. View Article : Google Scholar : PubMed/NCBI
|
|
8
|
Huang da W, Sherman BT and Lempicki RA:
Systematic and integrative analysis of large gene lists using DAVID
bioinformatics resources. Nat Protoc. 4:44–57. 2009. View Article : Google Scholar : PubMed/NCBI
|
|
9
|
Huang da W, Sherman BT and Lempicki RA:
Bioinformatics enrichment tools: Paths toward the comprehensive
functional analysis of large gene lists. Nucleic Acids Res.
37:1–13. 2009. View Article : Google Scholar : PubMed/NCBI
|
|
10
|
Bellucci M, Agostini F, Masin M and
Tartaglia GG: Predicting protein associations with long noncoding
RNAs. Nat Methods. 8:444–445. 2011. View Article : Google Scholar : PubMed/NCBI
|
|
11
|
Wong N and Wang X: miRDB: An online
resource for microRNA target prediction and functional annotations.
Nucleic Acids Res. 43:D146–D152. 2015. View Article : Google Scholar : PubMed/NCBI
|
|
12
|
Wang X: Improving microRNA target
prediction by modeling with unambiguously identified
microRNA-target pairs from CLIP-ligation studies. Bioinformatics.
32:1316–1322. 2016. View Article : Google Scholar : PubMed/NCBI
|
|
13
|
Goodrich JA and Kugel JF: Non-coding-RNA
regulators of RNA polymerase II transcription. Nat Rev Mol Cell
Biol. 7:612–616. 2006. View
Article : Google Scholar : PubMed/NCBI
|
|
14
|
Luo S, Lu Y, Liu L, Yin Y, Chen C, Han X,
Wu B, Xu R, Liu W, Yan P, et al: Divergent lncRNAs regulate gene
expression and lineage differentiation in pluripotent cells. Cell
Stem Cell. 18:637–652. 2016. View Article : Google Scholar : PubMed/NCBI
|
|
15
|
Carmichael J, Degraff WG, Gamson J, Russo
D, Gazdar AF, Levitt ML, Minna JD and Mitchell JB: Radiation
sensitivity of human-lung cancer cell-lines. Eur J Cancer Clin
Oncol. 25:527–534. 1989. View Article : Google Scholar : PubMed/NCBI
|
|
16
|
Karreth FA, Reschke M, Ruocco A, Ng C,
Chapuy B, Léopold V, Sjoberg M, Keane TM, Verma A, Ala U, et al:
The BRAF pseudogene functions as a competitive endogenous RNA and
induces lymphoma in vivo. Cell. 161:319–332. 2015. View Article : Google Scholar : PubMed/NCBI
|
|
17
|
Poliseno L, Salmena L, Zhang J, Carver B,
Haveman WJ and Pandolfi PP: A coding-independent function of gene
and pseudogene mRNAs regulates tumour biology. Nature.
465:1033–1038. 2010. View Article : Google Scholar : PubMed/NCBI
|
|
18
|
Griffiths-Jones S, Grocock RJ, van Dongen
S, Bateman A and Enright AJ: miRBase: MicroRNA sequences, targets
and gene nomenclature. Nucleic Acids Res. 34:D140–D144. 2006.
View Article : Google Scholar : PubMed/NCBI
|
|
19
|
Landgraf P, Rusu M, Sheridan R, Sewer A,
Iovino N, Aravin A, Pfeffer S, Rice A, Kamphorst AO, Landthaler M,
et al: A mammalian microRNA expression atlas based on small RNA
library sequencing. Cell. 129:1401–1414. 2007. View Article : Google Scholar : PubMed/NCBI
|
|
20
|
Lam LT, Lu X, Zhang H, Lesniewski R,
Rosenberg S and Semizarov D: A MicroRNA screen to identify
modulators of sensitivity to BCL2 inhibitor ABT-263 (Navitoclax).
Mol Cancer Ther. 9:2943–2950. 2010. View Article : Google Scholar : PubMed/NCBI
|
|
21
|
Wang RYL, Weng KF, Huang YC and Chen CJ:
Elevated expression of circulating miR876-5p is a specific response
to severe EV71 infections. Sci Rep. 6:241492016. View Article : Google Scholar : PubMed/NCBI
|
|
22
|
Bao L, Lv L, Feng J, Chen Y, Wang X, Han S
and Zhao H: MiR-876-5p suppresses epithelial-mesenchymal transition
of lung cancer by directly down-regulating bone morphogenetic
protein 4. J Biosci. 42:671–681. 2017. View Article : Google Scholar : PubMed/NCBI
|
|
23
|
Ayub Khan SM, Few LL and See Too WC:
Downregulation of human choline kinase α gene expression by
miR-876-5p. Mol Med Rep. 17:7442–7450. 2018.PubMed/NCBI
|
|
24
|
Kozomara A and Griffiths-Jones S: miRBase:
Integrating microRNA annotation and deep-sequencing data. Nucleic
Acids Res. 39:D152–D157. 2011. View Article : Google Scholar : PubMed/NCBI
|
|
25
|
Xu Q, Zhu Q, Zhou Z, Wang Y, Liu X, Yin G,
Tong X and Tu K: MicroRNA-876-5p inhibits epithelial-mesenchymal
transition and metastasis of hepatocellular carcinoma by targeting
BCL6 corepressor like 1. Biomed Pharmacother. 103:645–652. 2018.
View Article : Google Scholar : PubMed/NCBI
|
|
26
|
Wang Y, Xie Y, Li X, Lin J, Zhang S, Li Z,
Huo L and Gong R: MiR-876-5p acts as an inhibitor in hepatocellular
carcinoma progression by targeting DNMT3A. Pathol Res Pract.
214:1024–1030. 2018. View Article : Google Scholar : PubMed/NCBI
|
|
27
|
Joiner MC and van der Kogel A: Basic
Clinical Radiobiology 5th EditionCRC Press/Taylor & Francis
Group; Boca Raton FL, USA: pp. 188–205. 2019
|
|
28
|
Wallace SS: Enzymatic processing of
radiation-induced free radical damage in DNA. Radiat Res 150 (5
Suppl). S60–S79. 1998. View
Article : Google Scholar
|
|
29
|
Riley PA: Free radicals in biology:
Oxidative stress and the effects of ionizing radiation. Int J
Radiat Biol. 65:27–33. 1994. View Article : Google Scholar : PubMed/NCBI
|
|
30
|
Suzuki J, Jin ZG, Meoli DF, Matoba T and
Berk BC: Cyclophilin A is secreted by a vesicular pathway in
vascular smooth muscle cells. Circ Res. 98:811–817. 2006.
View Article : Google Scholar : PubMed/NCBI
|
|
31
|
Matsuda S and Koyasu S: Mechanisms of
action of cyclosporine. Immunopharmacology. 47:119–125. 2000.
View Article : Google Scholar : PubMed/NCBI
|
|
32
|
Nigro P, Pompilio G and Capogrossi MC:
Cyclophilin A: A key player for human disease. Cell Death Dis.
4:e8882013. View Article : Google Scholar : PubMed/NCBI
|
|
33
|
Yang H, Chen J, Yang J, Qiao S, Zhao S and
Yu L: Cyclophilin A is upregulated in small cell lung cancer and
activates ERK1/2 signal. Biochem Biophys Res Commun. 361:763–767.
2007. View Article : Google Scholar : PubMed/NCBI
|
|
34
|
Howard BA, Furumai R, Campa MJ, Rabbani
ZN, Vujaskovic Z, Wang XF and Patz EF Jr: Stable RNA
interference-mediated suppression of Cyclophilin A diminishes
non-small-cell lung tumor growth in vivo. Cancer Res. 65:8853–8860.
2005. View Article : Google Scholar : PubMed/NCBI
|
|
35
|
Sanchez-Elsner T, Gou D, Kremmer E and
Sauer F: Noncoding RNAs of trithorax response elements recruit
Drosophila Ash1 to ultrabithorax. Science. 311:1118–1123. 2006.
View Article : Google Scholar : PubMed/NCBI
|
|
36
|
Ishibashi N, Maebayashi T, Aizawa T,
Sakaguchi M, Nishimaki H and Masuda S: Correlation between the
Ki-67 proliferation index and response to radiation therapy in
small cell lung cancer. Radiat Oncol. 12:162017. View Article : Google Scholar : PubMed/NCBI
|