Introduction
Lung cancer is one of the most common types of human
cancer (11.6% of the total cases) and a major cause of
cancer-associated mortality (18.4% of the total cancer mortalities)
worldwide (1). Non-small cell lung
cancer (NSCLC) accounts for ~85% of all types of lung cancer
(2). The major types of NSCLC
include lung adenocarcinoma (LUAD, 63%), lung squamous cell
carcinoma (LUSC, 30%) and lung large cell carcinoma (7%) (2). Currently, surgical resection is the
most beneficial therapeutic strategy for lung cancer (3). Chemotherapy, radiotherapy and targeted
drugs are also extensively used; however, the therapeutic
resistance of these drugs is a major cause of treatment failure.
Thus, understanding the underlying molecular mechanisms for
carcinogenesis is important for the development of successful
therapy in treating lung cancer.
Kinesin family member 3A (KIF3A) is a motor protein,
that is essential for the formation and functional mechanisms of
cilia (4–6). It has been reported that KIF3A plays a
central role in the initiation and maintenance of medulloblastoma
(7) and a key role in the
proliferation and invasion of prostate cancer (8). Recently, KIF3A was reported to act as a
tumor suppressor in NSCLC by suppressing the Wnt/β-catenin
signaling pathway; however, the clinicopathological and prognostic
characteristics of patients has not been investigated and presented
in enough patients samples (9).
The clinical value of KIF3A and its underlying
molecular mechanism in KIF3A are yet to be confirmed. Thus, the
present study aimed to identify the role of KIF3A in the
carcinogenesis of NSCLC. Taken together, the results provide novel
potential therapeutic strategies, suggesting that KIF3A may act as
a potential tumor suppressor in the carcinogenesis of NSCLC.
Materials and methods
Clinical data and tissue specimen
The present study was approved by the Ethics
Committee of Qilu Hospital. Patients or their families agreed and
provided written informed consent. A total of 163 patients with
NSCLC who underwent pneumonectomy at Qilu Hospital between January
2005 and December 2008 were recruited in the present study. Among
the 163 patients with NSCLC, 94 were patients with LUAD and 69 were
patients with LUSC. The mean age at diagnosis of LUAD was
62.17±9.88 years. The mean age at diagnosis of LUSC was 64.46±8.70
years. All cases were histologically diagnosed as NSCLC (10). Patients who received chemotherapy or
radiotherapy prior to surgery were excluded. Patient information,
including basic information, pathological type, location of the
tumor, TNM stage (according to the 8th edition of the American
Joint Committee on Cancer Staging Manual) (11) and prognosis were recorded. Follow-up
data were available in all cases, and the longest clinical
follow-up period was 121 months. The overall survival (OS) time was
defined from the date of surgery to the end of follow-up or the
time of death. The clinicopathological characteristics of patients
with NSCLC are presented in Table
I.
 | Table I.Clinicopathological characteristics
of patients with non-small cell lung cancer. |
Table I.
Clinicopathological characteristics
of patients with non-small cell lung cancer.
| Variables | LUAD, n (%) | LUSC, n (%) |
|---|
| Total number of
patients | 94 (100) | 69 (100) |
| Sex |
|
Male | 51 (54.3) | 43 (62.3) |
|
Female | 43 (45.7) | 26 (37.7) |
| Age at diagnosis,
years |
|
≤60 | 43 (45.7) | 20 (29.0) |
|
>60 | 51 (54.3) | 49 (71.0) |
| Smoking status |
|
Non-smoking | 39 (41.5) | 28 (40.6) |
|
Smoking | 55 (58.5) | 41 (59.4) |
| Primary tumor
location |
| Left
lung | 40 (42.6) | 27 (39.1) |
| Right
lung | 54 (57.4) | 42 (60.9) |
| Differentiation
grade |
| High
and middle | 69 (73.4) | 51 (73.9) |
|
Low | 25 (26.6) | 18 (26.1) |
| Primary tumor
size |
|
T1+T2 | 71 (75.5) | 50 (72.5) |
|
T3+T4 | 23 (24.5) | 19 (27.5) |
| Lymph node
metastasis |
| N0 | 42 (44.7) | 42 (60.9) |
|
N1-3 | 52 (55.3) | 27 (39.1) |
| Stage grouping with
TNM |
| Stage I
+ II | 55 (58.5) | 53 (76.8) |
| Stage
III + IV | 39 (41.5) | 16 (23.2) |
Immunohistochemistry (IHC)
Lung tissues were fixed in 4% paraformaldehyde at
4°C for 24 h and imbedded in paraffin. Slices (3 µm) made from 163
paraffin-embedded cancer samples and 157 adjacent normal samples
(>5 cm away from the tumor margin) were obtained. Briefly, the
tissue sections were incubated at 65°C for 60 min, dewaxed in
xylene and subsequently rehydrated in a graded ethanol series. The
antigen retrieval process was performed using citrate.
Deparaffinized sections were incubated with 3%
H2O2 for 30 min at 37°C to inhibit endogenous
peroxidase activity. Following treatment with 5% bovine serum
albumin (BSA) for 30 min at 37°C, tissue sections were incubated
with rabbit anti-KIF3A polyclonal antibody in PBS (1:200; cat. no.
ab11259; Abcam) overnight at 4°C. The sections were subsequently
incubated with the second antibody and streptavidin-biotin complex
(SABC) of HRP conjugated anti-Rabbit IgG SABC Kit (cat. no. SA1022;
Boster Biological Technology) for 30 min at 37°C. Staining was
subsequently performed using the DAB Chromogenic Substrate kit
(cat. no. AR1022; Boster Biological Technology) for 1 min and 5
sec, and the slides were counterstained with hematoxylin for 8 min
prior to covering with neutral balsam, all at room temperature. The
negative control group was processed with PBS instead of the KIF3A
antibody, and all other steps were performed as aforementioned. The
scorings of the stained sections were calculated as previously
described (12).
Cell culture and transfection of small
interfering (si)RNA
The human NCI-A549, NCI-H1975 and NCI-H520 NSCLC
cell lines, were purchased from The Cell Bank of Type Culture
Collection of the Chinese Academy of Sciences and were cultured in
RPMI-1640 medium supplemented with 10% FBS at 37°C in a humidified
atmosphere with 5% CO2.
The negative control (NC) siRNA (NC-siRNA) and
KIF3A-specific siRNAs (KIF3A-siRNA-1, −2, −3, −4) were constructed
by Shanghai GenePharma Co., Ltd. NCI-H520 cells were transfected
with siRNAs (100 pmol/per well of 6-well plate) using
Lipofectamine® 2000 (Thermo Fisher Scientific, Inc.),
according to the manufacturer's instructions. After 48 h following
transfection, cells were analyzed to determine transfection
efficiency using reverse transcription quantitative (RT-qPCR) or
used for subsequent experimentation. The sequences of KIF3A-siRNA
and the negative control (NC) are presented in Table S1.
RT-qPCR
Total RNA was extracted from KIF3A-siRNA or NC-siRNA
transfected cells using TRIzol® (Invitrogen; Thermo
Fisher Scientific, Inc.) according to the manufacturer's
instructions, and the purity and concentration of RNA were assessed
using a NanoDrop spectrophotometer (Thermo Fisher Scientific,
Inc.). Reverse transcription of the RNA was performed using Moloney
Murine Leukemia Virus Reverse Transcriptase (Ambion; Thermo Fisher
Scientific, Inc.) and a mixture of anchored Oligo(-dT) (Sangon
Biotech Co., Ltd.) and dNTPs (Thermo Fisher Scientific, Inc.). The
reaction conditions were as follows: 37°C for 50 min, 70°C for 15
min, 4°C for 5 min. The qPCR (SYBR-Green I) was subsequently
performed using UltraSYBR Mixture (CoMin Biosciences) according to
the manufacturer's instructions. The following thermocycling
conditions were used for qPCR: Initial denaturation at 95°C for 5
min; 40 (two-step) cycles at 95°C for 10 sec and 60°C for 35 sec.
Relative expression levels were calculated using the
2−ΔΔCq method and normalized to the internal reference
gene β-actin (13). The following
primer sequences were used for qPCR: KIF3A forward,
5′-AGGAGAGTCTGCGTCAGTCT-3′ and reverse, 5′-TTTCAGGCTTTGCAGAACGC-3′;
IFT57 forward, 5′-ATGGCGGAGTAACTGAACGG-3′ and reverse,
5′-ATCTTCACCAAAGGAGTGCCG-3′; and β-actin forward,
5′-CTCTTCCAGCCTTCCTTCCT-3′ and reverse,
5′-AGCACTGTGTTGGCGTACAG-3′).
Cell counting Kit-8 (CCK-8) assay
The proliferative ability of transfected cells was
assessed using a CCK-8 assay (Beyotime Institute of Biotechnology).
At 48 h following transfection, cells were seeded into 96-well
plates, at a density of 2×10³ cells/well and cultured
for 24 h. CCK-8 reagent (10 µl) was added into each well and the
plates were incubated for 2 h at 37°C. Cell proliferation was
measured every 24 h, at 450 nm using a microplate reader (Bio-Rad
Laboratories, Inc.). All experiments were performed in
triplicate.
Colony formation assay
Cells were seeded into 35 mm dishes, at a density of
500 cells/well and cultured at 37°C with 5% CO2 for 14
days, 48 h following transfection. Cells were fixed with 4%
paraformaldehyde for 30 min at 4°C and subsequently stained with
0.1% crystal violet for 30 min at room temperature. The size and
number of the cell colonies was recorded. All experiments were
performed in triplicate.
Flow cytometric analysis of
apoptosis
Cell apoptosis was determined using the Annexin
V-fluorescein isothiocyanate (FITC)/propidium iodide (PI) Apoptosis
Detection kit (KeyGEN BioTECH). Cells were collected using trypsin
without EDTA and washed three times with cold PBS, 48 h following
transfection. Cells were resuspended in 400 µl Annexin V-Binding
buffer, at a density of 1×10⁶ cells/ml, and incubated
with 5 µl Annexin V-FITC and 10 µl PI for 5 and 15 min,
respectively, at 37°C in the dark. Apoptotic cells were
subsequently analyzed using FlowJo software (version 10; Excyte).
All experiments were performed in triplicate.
Wound healing assay
The cells were seeded into 6-well plates
(1×10⁶ cells/well) and cultured until they reached full
confluency, 48 h following transfection. Adherent cells were
aspirated using a micropipette tip to create ~1-mm cell-free zones.
The cells were washed three times with PBS and the plate was
cultured in medium with 1% FBS at 37°C with 5% CO2.
Images were captured with an inverted microscope (Olympu
Corporation; magnification, ×40) at 0 and 24 h during incubation.
The wound closure rate was calculated. Scratch healing
rate=(healing area at 0 h-healing area at 24 h)/healing area at 0
h.
Transwell migration and invasion
assay
The cell migratory and invasive abilities were
determined using the polycarbonate membranes (8-µm pore size) of
Transwell migration (cat. no. 3422) and invasion chambers (cat. no.
354480) (both from Corning, Inc.), respectively, 48 h following
transfection. The migration and invasion assays were performed as
previously described (12).
Protein extraction and western blot
analysis
For protein extraction, cells were lysed in RIPA
buffer (Beyotime Biotechnology) supplemented with protease
inhibitors (Beyotime Institute of Biotechnology). After incubation
on ice for 15 min, the lysate was centrifuged at 13,800 × g for 15
min at 4°C, and the supernatant was collected. Protein
concentration was calculated using a BCA Protein Assay kit (cat.
no. P0010S; Beyotime Institute of Biotechnology). Protein extracts
were separated using 10% SDS-PAGE and transferred onto
polyvinylidene fluoride membranes. After blocking with 5% skimmed
milk and incubated with rabbit polyclonal anti-intraflagellar
transport 57 (IFT57) (1:1,000 dilution; cat. no. ab5205; Abcam) and
rabbit anti-GAPDH (1:1,000 dilution; cat. no. 2118; Cell Signaling
Technology, Inc.) overnight at 4°C, the membranes were incubated
with anti-rabbit IgG (1:5,000 dilution; cat. no. AQ132P; EMD
Millipore). After washing with TBS-Tween-20, the protein bands were
detected using an enhanced chemiluminescence western blotting
substrate kit (Thermo Fisher Scientific, Inc.). Relative protein
levels were quantified by scanning densitometry using ImageJ
software (version 1.4.3; National Institutes of Health).
Bioinformatics analysis
The Kaplan-Meier (K-M) Plotter database was used to
investigate the association between KIF3A mRNA expression levels
with OS time, first progression (FP) and post-progression survival
(PPS) (http://kmplot.com/analysis/index.php?p=service&cancer=lung)
(14). FP is the time to first
progression, and PPS is the OS time minus the time to disease
progression (15). The association
between IFT57 mRNA expression levels and OS time was also assessed.
Sources for the K-M Plotter database include Gene Expression
Omnibus (GEO), European Genome-phenome Archive (EGA), and The
Cancer Genome Atlas (TCGA). The collection and sort of data,
quality check, normalization and survival calculation were executed
by the database. The median value of mRNA expression was chosen as
the cut off value. Samples with mRNA expression values higher than
the median value were included in the high expression group, while
values below the median were included in the low expression group.
The classified cohorts were compared using K-M survival plots, and
hazard ratios (HR), 95% confidence intervals (CIs) and log-rank
P-values were recorded.
The correlation between KIF3A expression and
survival in LUAD and LUSC was also analyzed using the PrognoScan
database (16). PrognoScan searches
for associations between gene expression and patient prognosis,
including OS and relapse-free survival (RFS) time, across a large
collection of publicly available cancer microarray datasets. The
threshold was adjusted to a Cox P<0.05.
A protein-protein interaction (PPI) network of KIF3A
was constructed using the Search Tool for the Retrieval of
Interacting Genes (STRING) database (17). The differential mRNA expression
levels of KIF3B, KIF3C, IFT57, IFT52, IFT20, IFT172, DYNC2H1,
IFT88, KIFAP3, and DCTN1 between LUAD and adjacent normal tissues,
and LUSC and adjacent normal tissues, were validated using the
GEPIA online analysis tool (18).
mRNA expression levels were determined using the following
settings: ‘Multiple gene comparison’; ‘tissue order=LUAD and LUSC’;
‘log scale=yes’; and ‘match TCGA normal data’. The association
between KIF3A and IFT57 mRNA expression levels in
NSCLC was also assessed using GEPIA, using the following settings:
‘Correlation’; ‘gene A=KIF3A’; ‘gene B=IFT57’; ‘Correlation
coefficient=Spearman’ and ‘datasets=TCGA tumor’.
IFT57 mRNA expression level in 291 unique datasets
of common human cancers, including bladder cancer, breast cancer,
cervical cancer and lung cancer, was determined using the Oncomine
datasets (www.oncomine.org). The settings were as
follows: ‘Gene, KIF3A’; ‘analysis type: Cancer vs. normal
analysis’; ‘cancer type: Lung cancer’; ‘data type: mRNA’; ‘sample
type: Clinical specimen’; ‘threshold (P-value): 0.0001’; ‘threshold
(fold change): 2’ and ‘threshold (gene rank): Top 10%’.
RNA-Sequencing (RNA-Seq) microarray gene expression
levels of KIF3A and IFT57 in NSCLC cell lines were
determined using the Cancer Cell Line Encyclopedia (CCLE) (19). Robust Multi-array Average (RMA)
normalization was performed (20).
The correlation between KIF3A and IFT57 expression
levels was determined using the Pearson's rank correlation
test.
Statistical analysis
The statistical analyses were performed using SPSS
v21.0 software (IBM Corp.) and GraphPad v6.0 (GraphPad Software,
Inc.). Data are presented as the mean ± SD. An unpaired Student's
t-test was used to compare data from the cell experiments. A
Kolmogorov-Smirnov test was used to analyze the normal distribution
of variables. The mRNA levels of KIF3A in multiple NSCLC cell lines
were analyzed using one-way ANOVA and Tukey's post hoc test. The
mRNA levels of KIF3A in H520 cells transfected with NC-siRNA and
KIF3A-siRNA-1 to 4 were compared using one-way ANOVA and Dunnett's
post hoc test. The IHC scores of NSCLC and adjacent normal tissues
were compared using a paired Student's t-test. The Mann-Whitney U
test was performed to compare differences between two groups when
quantitative variables were not normally distributed. A
χ2 test was used to compare clinical variables between
groups. The K-M method and log-rank test were used to calculate the
OS rate. Univariate Cox regression proportional hazards model was
performed to calculate the effect of variables on OS. Variables
with P<0.1 in the univariate analysis were included in the
multivariate analysis. P<0.05 was considered to indicate a
statistically significant difference.
Results
Low KIF3A protein expression in
clinical NSCLC and its association with the clinicopathological
characteristics
The expression and subcellular localization of the
KIF3A protein in clinical NSCLC tissues (n=163) and adjacent normal
tissues (n=157) were determined using IHC analysis (Fig. 1A-F). The results showed that the
KIF3A protein was predominantly stained in the cellular membrane
and the cytoplasm of NSCLC cells. KIF3A protein expression level in
the tumor tissues of patients with LUAD (n=94) and LUSC (n=69) was
significantly lower compared with that in the respective adjacent
normal tissues (P<0.01 and P<0.05, respectively; Fig. 1G). Furthermore, KIF3A protein
expression was lower in patients with LUAD compared with that in
patients with LUSC (P<0.001; Fig.
1G).
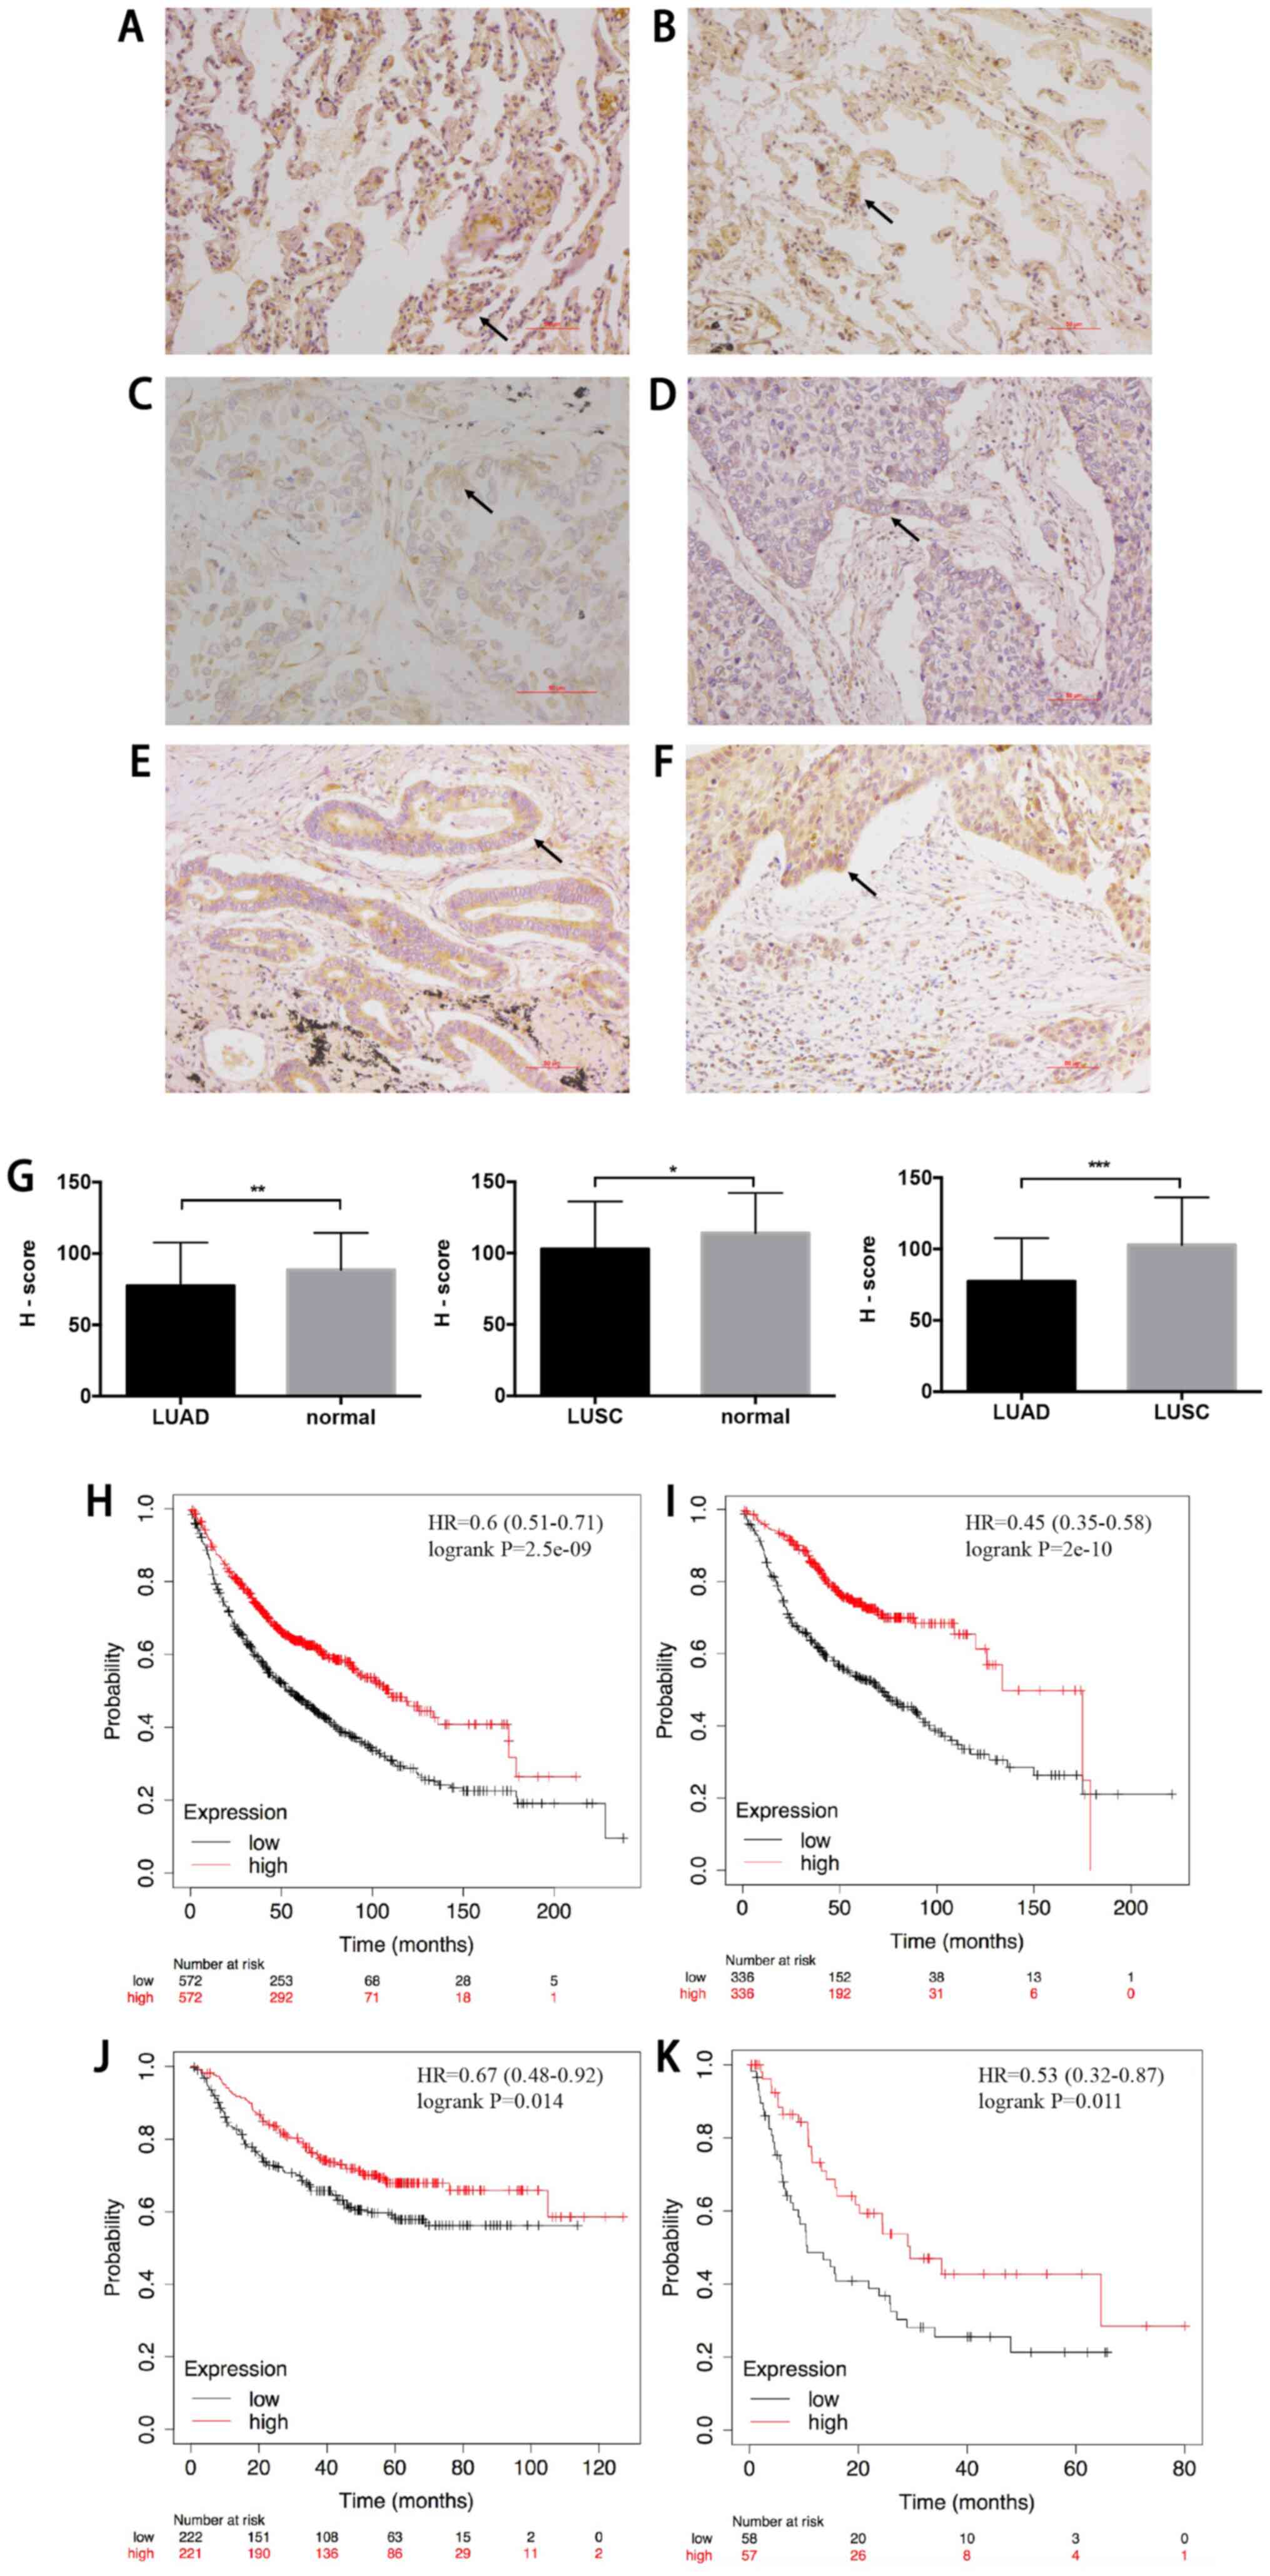 | Figure 1.Protein expression level of KIF3A in
NSCLC tissues determined using immunohistochemistry and survival
analyses. (A) and (B) KIF3A protein expression in the tumor and
adjacent normal tissues. (C) Low expression of the KIF3A protein in
the adenocarcinoma tissues. (D) Low expression of KIF3A protein in
the squamous cell carcinoma tissues. (E) High expression of KIF3A
protein in the adenocarcinoma tissues. (F) High expression of KIF3A
protein in the squamous cell carcinoma tissues. (scale bar, 50 µm).
(G) Semi-quantitative analyses of the KIF3A protein expression
level in the NSCLC and adjacent normal tissues. *P<0.05,
**P<0.01, ***P<0.001. Paired Student's t-test was used for
the comparison of NSCLC with the adjacent normal tissue, while
Mann-Whitney U test was used for the comparison of LUAD with LUSC.
(H) The OS time was shorter in the patients with low mRNA
expression level of KIF3A compared with those with a high
expression level in all of the patients with NSCLC from the K-M
Plotter database (K-M method with log-rank test). The low mRNA
expression level of KIF3A was associated with poor (I) OS, (J) FP
and (K) PPS in patients with LUAD from the K-M Plotter database
(K-M method with log-rank test). K-M, Kaplan-Meier; OS, overall
survival; FP, first progression; PPS, post-progression survival;
LUAD, lung adenocarcinoma; LUSC, lung squamous cell carcinoma;
NSCLC, non-small cell lung cancer; KIF3A, kinesin family member 3A;
H-score, IHC scores. |
The association between KIF3A protein expression
level and the clinicopathological characteristics of patients with
LUAD and LUSC are presented in Tables
II and III, respectively. In
patients with LUAD, low KIF3A expression was significantly
associated with TNM stage (P=0.021), whereas high KIF3A expression
was significantly associated with tumor differentiation grade
(P=0.036). Conversely, in patients with LUSC, low KIF3A expression
was significantly associated with smoking status (P=0.019) and
lymph node metastasis (P=0.037).
| Table II.Association of KIF3A protein
expression level in tumor tissues with the clinicopathological
characteristics in patients with lung adenocarcinoma (n=94). |
Table II.
Association of KIF3A protein
expression level in tumor tissues with the clinicopathological
characteristics in patients with lung adenocarcinoma (n=94).
|
| KIF3A
expression |
|---|
|
|
|
|---|
| Clinicopathological
characteristics | Number | Low, n (%) | High, n (%) | Pearson's
χ2 | P-value |
|---|
| Sex |
|
Male | 51 | 27 (52.9) | 24 (47.1) | 0.386 | 0.535 |
|
Female | 43 | 20 (46.5) | 23 (53.5) |
|
|
| Age at diagnosis,
years |
|
≤60 | 43 | 25 (58.1) | 18 (41.9) | 2.1 | 0.147 |
|
>60 | 51 | 22 (43.1) | 29 (56.9) |
|
|
| Smoking status |
| No
smoking | 39 | 18 (46.2) | 21 (53.8) | 0.004 | 0.947 |
|
Smoking | 55 | 25 (45.5) | 30 (54.5) |
|
|
| Primary tumor
location |
| Left
lung | 40 | 17 (42.5) | 23 (57.5) | 1.567 | 0.211 |
| Right
lung | 54 | 30 (55.6) | 24 (44.4) |
|
|
| Differentiation
grade |
| High
and middle | 69 | 39 (56.5) | 30 (43.5) | 4.414 | 0.036a |
|
Low | 25 | 8 (32.0) | 17 (68.0) |
|
|
| Primary tumor
size |
|
T1+T2 | 71 | 32 (45.1) | 39 (54.9) | 2.821 | 0.093 |
|
T3+T4 | 23 | 15 (65.2) | 8 (34.8) |
|
|
| Lymph node
metastasis |
| N0 | 42 | 20 (47.6) | 22 (52.4) | 1.172 | 0.678 |
|
N1-3 | 52 | 27 (51.9) | 25 (48.1) |
|
|
| Stage grouping with
TNM |
| Stage I
+ II | 55 | 22 (40.0) | 33 (60.0) | 5.303 | 0.021a |
| Stage
III + IV | 39 | 25 (64.1) | 14 (35.9) |
|
|
| Table III.Association of KIF3A mRNA expression
level in tumor tissues with the clinicopathological characteristics
in patients with lung squamous cell carcinoma (n=69). |
Table III.
Association of KIF3A mRNA expression
level in tumor tissues with the clinicopathological characteristics
in patients with lung squamous cell carcinoma (n=69).
|
| KIF3A
expression |
|---|
|
|
|
|---|
| Clinicopathological
characteristic | Number | Low, n (%) | High, n (%) | Pearson's
χ2 | P-value |
|---|
| Gender |
|
Male | 43 | 22 (51.2) | 21 (48.8) | 0.163 | 0.687 |
|
Female | 26 | 12 (46.2) | 14 (53.8) |
|
|
| Age at diagnosis,
years |
|
≤60 | 20 | 11 (55.0) | 9 (45.0) | 0.369 | 0.543 |
|
>60 | 49 | 23 (46.9) | 26 (53.1) |
|
|
| Smoking status |
|
Non-smoking | 28 | 9 (32.1) | 19 (67.9) | 5.534 | 0.019a |
|
Smoking | 41 | 25 (61.0) | 16 (39.0) |
|
|
| Primary tumor
location |
| Left
lung | 27 | 13 (48.1) | 14 (51.9) | 0.023 | 0.881 |
| Right
lung | 42 | 21 (50.0) | 21 (50.0) |
|
|
| Differentiation
grade |
| High
and middle | 51 | 25 (49.0) | 26 (51.0) | 0.005 | 0.943 |
|
Low | 18 | 9 (50.0) | 9 (50.0) |
|
|
| Primary tumor
size |
|
T1+T2 | 50 | 24 (48.0) | 26 (52.0) | 0.118 | 0.731 |
|
T3+T4 | 19 | 10 (52.6) | 9 (47.4) |
|
|
| Lymph node
metastasis |
| N0 | 43 | 17 (39.5) | 26 (60.5) | 4.332 | 0.037a |
|
N1-3 | 26 | 17 (65.4) | 9 (34.6) |
|
|
| Stage Grouping with
TNM |
| Stage I
+ II | 53 | 28 (52.8) | 25 (47.2) | 1.156 | 0.282 |
| Stage
III + IV | 16 | 6 (37.5) | 10 (62.5) |
|
|
Univariate Cox regression analysis demonstrated that
lymph node metastasis (HR, 2.427; 95% CI, 1.478–3.958; P<0.001)
and TNM stage (HR, 2.843; 95% CI, 1.748–4.624; P<0.001) were
significantly negative prognostic factors for OS time in patients
with LUAD. Multivariate Cox regression analysis demonstrated that
TNM stage was an independent prognosis factor for OS time (HR,
2.148; 95% CI, 1.167–3.952; P=0.014) (Table IV).
| Table IV.Univariate and multivariate analyses
of prognostic factors of overall survival in patients with LUSC and
LUAD. |
Table IV.
Univariate and multivariate analyses
of prognostic factors of overall survival in patients with LUSC and
LUAD.
| A, Overall survival
in patients with LUAD |
|---|
|
|---|
|
| Univariate
analysis | Multivariate
analysis |
|---|
|
|
|
|
|---|
| Clinicopathological
characteristics | HR | P-value | 95% CI | HR | P-value | 95% CI |
|---|
| KIF3A expression
(low vs. high) | 1.007 | 0.976 | 0.629–1.612 |
|
|
|
| Sex (male vs.
female) | 0.733 | 0.198 | 0.457–1.176 |
|
|
|
| Age at diagnosis
(≤60 vs. >60 years) | 1.011 | 0.962 | 0.632–1.619 |
|
|
|
| Smoking status
(non-smoking vs. smoking) | 1.598 | 0.774 | 1.023–1.984 |
|
|
|
| Primary tumor
location (left lung vs. right lung) | 0.99 | 0.967 | 0.614–1.595 |
|
|
|
| Differentiation
grade (high and middle vs. low) | 0.982 | 0.947 | 0.568–1.696 |
|
|
|
| Primary tumor size
(T1+T2 vs. T3+T4) | 1.424 | 0.191 | 0.838–2.419 |
|
|
|
| Lymph node
metastasis (N0 vs. N1-3) | 2.427 |
<0.001a | 1.478–3.958 | 1.569 | 0.158 | 0.840–2.931 |
| Stage grouping with
TNM (I + II vs. III + IV) | 2.843 |
<0.001a | 1.748–4.624 | 2.148 | 0.014b | 1.167–3.952 |
|
| B, Overall
survival in patients with LUSC |
|
|
| Univariate
analysis | Multivariate
analysis |
|
|
|
|
|
Clinicopathological
characteristics | HR | P-value | 95% CI | HR | P-value | 95% CI |
|
| KIF3A expression
(low vs. high) | 1.692 | 0.143 | 0.837–3.420 |
|
|
|
| Sex (male vs.
female) | 1.024 | 0.946 | 0.512–2.048 |
|
|
|
| Age at diagnosis
(≤60 vs. >60 years) | 2.041 | 0.114 | 0.842–4.948 |
|
|
|
| Smoking status
(non-smoking vs. smoking) | 0.625 | 0.203 | 0.303–1.289 |
|
|
|
| Primary tumor
location (left lung vs. right lung) | 0.745 | 0.402 | 0.373–1.485 |
|
|
|
| Differentiation
grade (high and middle vs. low) | 1.477 | 0.305 | 0.701–3.111 |
|
|
|
| Primary tumor size
(T1+T2 vs. T3+T4) | 1.616 | 0.194 | 0.783–3.336 |
|
|
|
| Lymph node
metastasis (N0 vs. N1-3) | 1.544 | 0.216 | 0.776–3.070 |
|
|
|
| Stage grouping with
TNM (I + II vs. III + IV) | 2.448 | 0.017b | 1.170–5.122 |
|
|
|
In patients with LUSC, TNM stage (HR, 2.448; 95% CI,
1.170–5.122; P=0.017) was also demonstrated to be a negative
prognostic factor for OS time following univariate Cox regression
analysis. However, no significant difference between OS time and
KIF3A protein expression level were observed following multivariate
Cox regression (Table IV). And
there was no significant association between OS time and KIF3A
protein expression in LUAD and LUSC using K-M survival analyses
(both P>0.05; Fig. S1A and B,
respectively).
Low KIF3A expression predicts poor
prognosis in K-M Plotter and the PrognoScan database
The prognostic value of KIF3A mRNA expression on
NSCLC was further investigated using the K-M Plotter database. Low
KIF3A expression was significantly associated with adverse OS time
(HR, 0.6; P<0.001; Fig. 1H) in
1,144 patients with NSCLC. In patients with LUAD (n=672), low KIF3A
expression was associated with adverse OS time (HR, 0.45;
P<0.001; Fig. 1I). Furthermore,
low KIF3A expression was associated with first progression (FP; HR,
0.67; P=0.014; Fig. 1J) and the
post-progression survival (PPS; HR, 0.53; P=0.011; Fig. 1K) of patients with LUAD. However, no
significant association was observed between KIF3A expression and
OS time in patients with LUSC (n=271).
To further validate the prognostic effect of KIF3A,
the data was analyzed using a second database PrognoScan. Notably,
the results demonstrated that the GSE31210 cohort (21), which included 226 samples of patients
with LUAD, showed that low KIF3A expression was significantly
associated with poor prognosis (OS HR, 0.13, 95% CI, 0.05 to 0.33,
Cox P<0.001; Fig. S2A; RFS HR,
0.19, 95% CI, 0.09 to 0.39, Cox P<0.001; Fig. S2B). There was no prognostic value of
KIF3A expression in patients with LUSC (GSE4573 and GSE17710)
(22,23).
Prognostic value of KIF3A in patients
with NSCLC according to clinicopathological characteristics and
treatment, using the K-M Plotter database
The association between KIF3A expression and smoking
status, sex, clinical stages, and different chemotherapeutic
treatments of patients with NSCLC was determined. As presented in
Table V, low KIF3A mRNA expression
level was associated with adverse OS time in patients with a
smoking history (HR, 0.56; P=0.0068; Fig. S3A) and without a smoking history
(HR, 0.15; P<0.001; Fig. S3B).
Furthermore, low KIF3A mRNA expression was associated with poor OS
time in female (HR,0.41; P<0.001; Fig. S3C) and male (HR, 0.69; P<0.001;
Fig. S3D). For patients in clinical
stage I (HR, 0.43; P<0.001; Fig.
S3E) and T1 stage (HR, 0.65; P=0.0302; Fig. S3F), low KIF3A mRNA expression was
associated with adverse OS. In addition, low KIF3A expression was
significantly associated with poor OS time in surgically successful
patients (HR=0.21; P<0.001; Fig.
S3G). However, KIF3A failed to exhibit prognostic value in
patients with stage II–IV, T2-3, lymph node metastasis and
chemotherapeutic treatment history.
| Table V.Prognostic value of kinesin family
member 3A expression level in patients with non-small cell lung
cancer according to clinicopathological characteristics and
treatment using the K-M Plotter database. |
Table V.
Prognostic value of kinesin family
member 3A expression level in patients with non-small cell lung
cancer according to clinicopathological characteristics and
treatment using the K-M Plotter database.
|
|
|
| Median survival,
months | K-M |
|---|
|
|
|
|
|
|
|---|
| Clinicopathological
characteristics | Number | Cutoff value | Low expression
cohort | High expression
cohort | HR | P-value | 95% CI |
|---|
| Cancer type |
|
|
|
|
|
|
|
|
LUAD | 672 | 376 | 71.27 | 133.57 | 0.45 | <0.001 | 0.35–0.58 |
|
LUSC | 271 | 212 | 63 | 51.53 | 1.06 | 0.7246 | 0.78–1.44 |
| Smoking status |
|
|
|
|
|
|
|
|
Smoked | 300 | 367 | 35 | 48 | 0.56 | 0.0068 | 0.37–0.86 |
| Never
smoked | 141 | 643 | / | / | 0.15 | <0.001 | 0.05–0.45 |
| Sex |
|
|
|
|
|
|
|
|
Female | 374 | 393 | 23 | 69.93 | 0.41 | <0.001 | 0.28–0.59 |
|
Male | 659 | 304 | 52 | 90 | 0.69 | <0.001 | 0.56–0.85 |
| Stage |
|
|
|
|
|
|
|
| I | 449 | 390 | 33.37 | 72.33 | 0.43 | <0.001 | 0.3–0.6 |
| II | 161 | 350 | 57 | 88.7 | 0.66 | 0.075 | 0.42–1.05 |
|
III | 44 | 312 | 14.93 | 26.09 | 0.79 | 0.5156 | 0.4–1.59 |
| IV | 4 | / | / | / | / | / | / |
| Primary tumor
size |
|
|
|
|
|
|
|
| T1 | 224 | 243 | 71 | 175 | 0.65 | 0.0302 | 0.43–0.96 |
| T2 | 190 | 211 | 76 | 48 | 1.45 | 0.0591 | 0.98–2.13 |
| T3 | 29 | 270 | 35 | 13 | 1.55 | 0.2917 | 0.68–3.52 |
| T4 | 23 | 397 | 9 | 28 | 0.57 | 0.2004 | 0.23–1.37 |
| Lymph node
metastasis |
|
|
|
|
|
|
|
| N0 | 324 | 235 | 107 | 91 | 1.07 | 0.6735 | 0.78–1.46 |
| N1 | 102 | 189 | 60 | 36 | 0.93 | 0.7677 | 0.56–1.53 |
| N2 | 32 | 402 | 21 | 11 | 1.3 | 0.4806 | 0.63–2.71 |
| Metastasis |
|
|
|
|
|
|
|
| M0 | 462 | 239 | 70 | 72 | 1.1 | 0.45 | 0.86–1.41 |
| M1 | 10 | / | / | / | / | / | / |
| Treatment |
|
|
|
|
|
|
|
| Surgery
successa | 204 | 664 | / | / | 0.21 | <0.001 | 0.09–0.52 |
| Chemotherapy |
|
|
|
|
|
|
|
| No | 22 | 505 | 26.09 | 43.07 | 0.94 | 0.9387 | 0.19–4.69 |
|
Yes | 34 | 430 | 32.95 | 36.24 | 1.44 | 0.5354 | 0.45–4.62 |
KIF3A expression in the NSCLC cell
lines
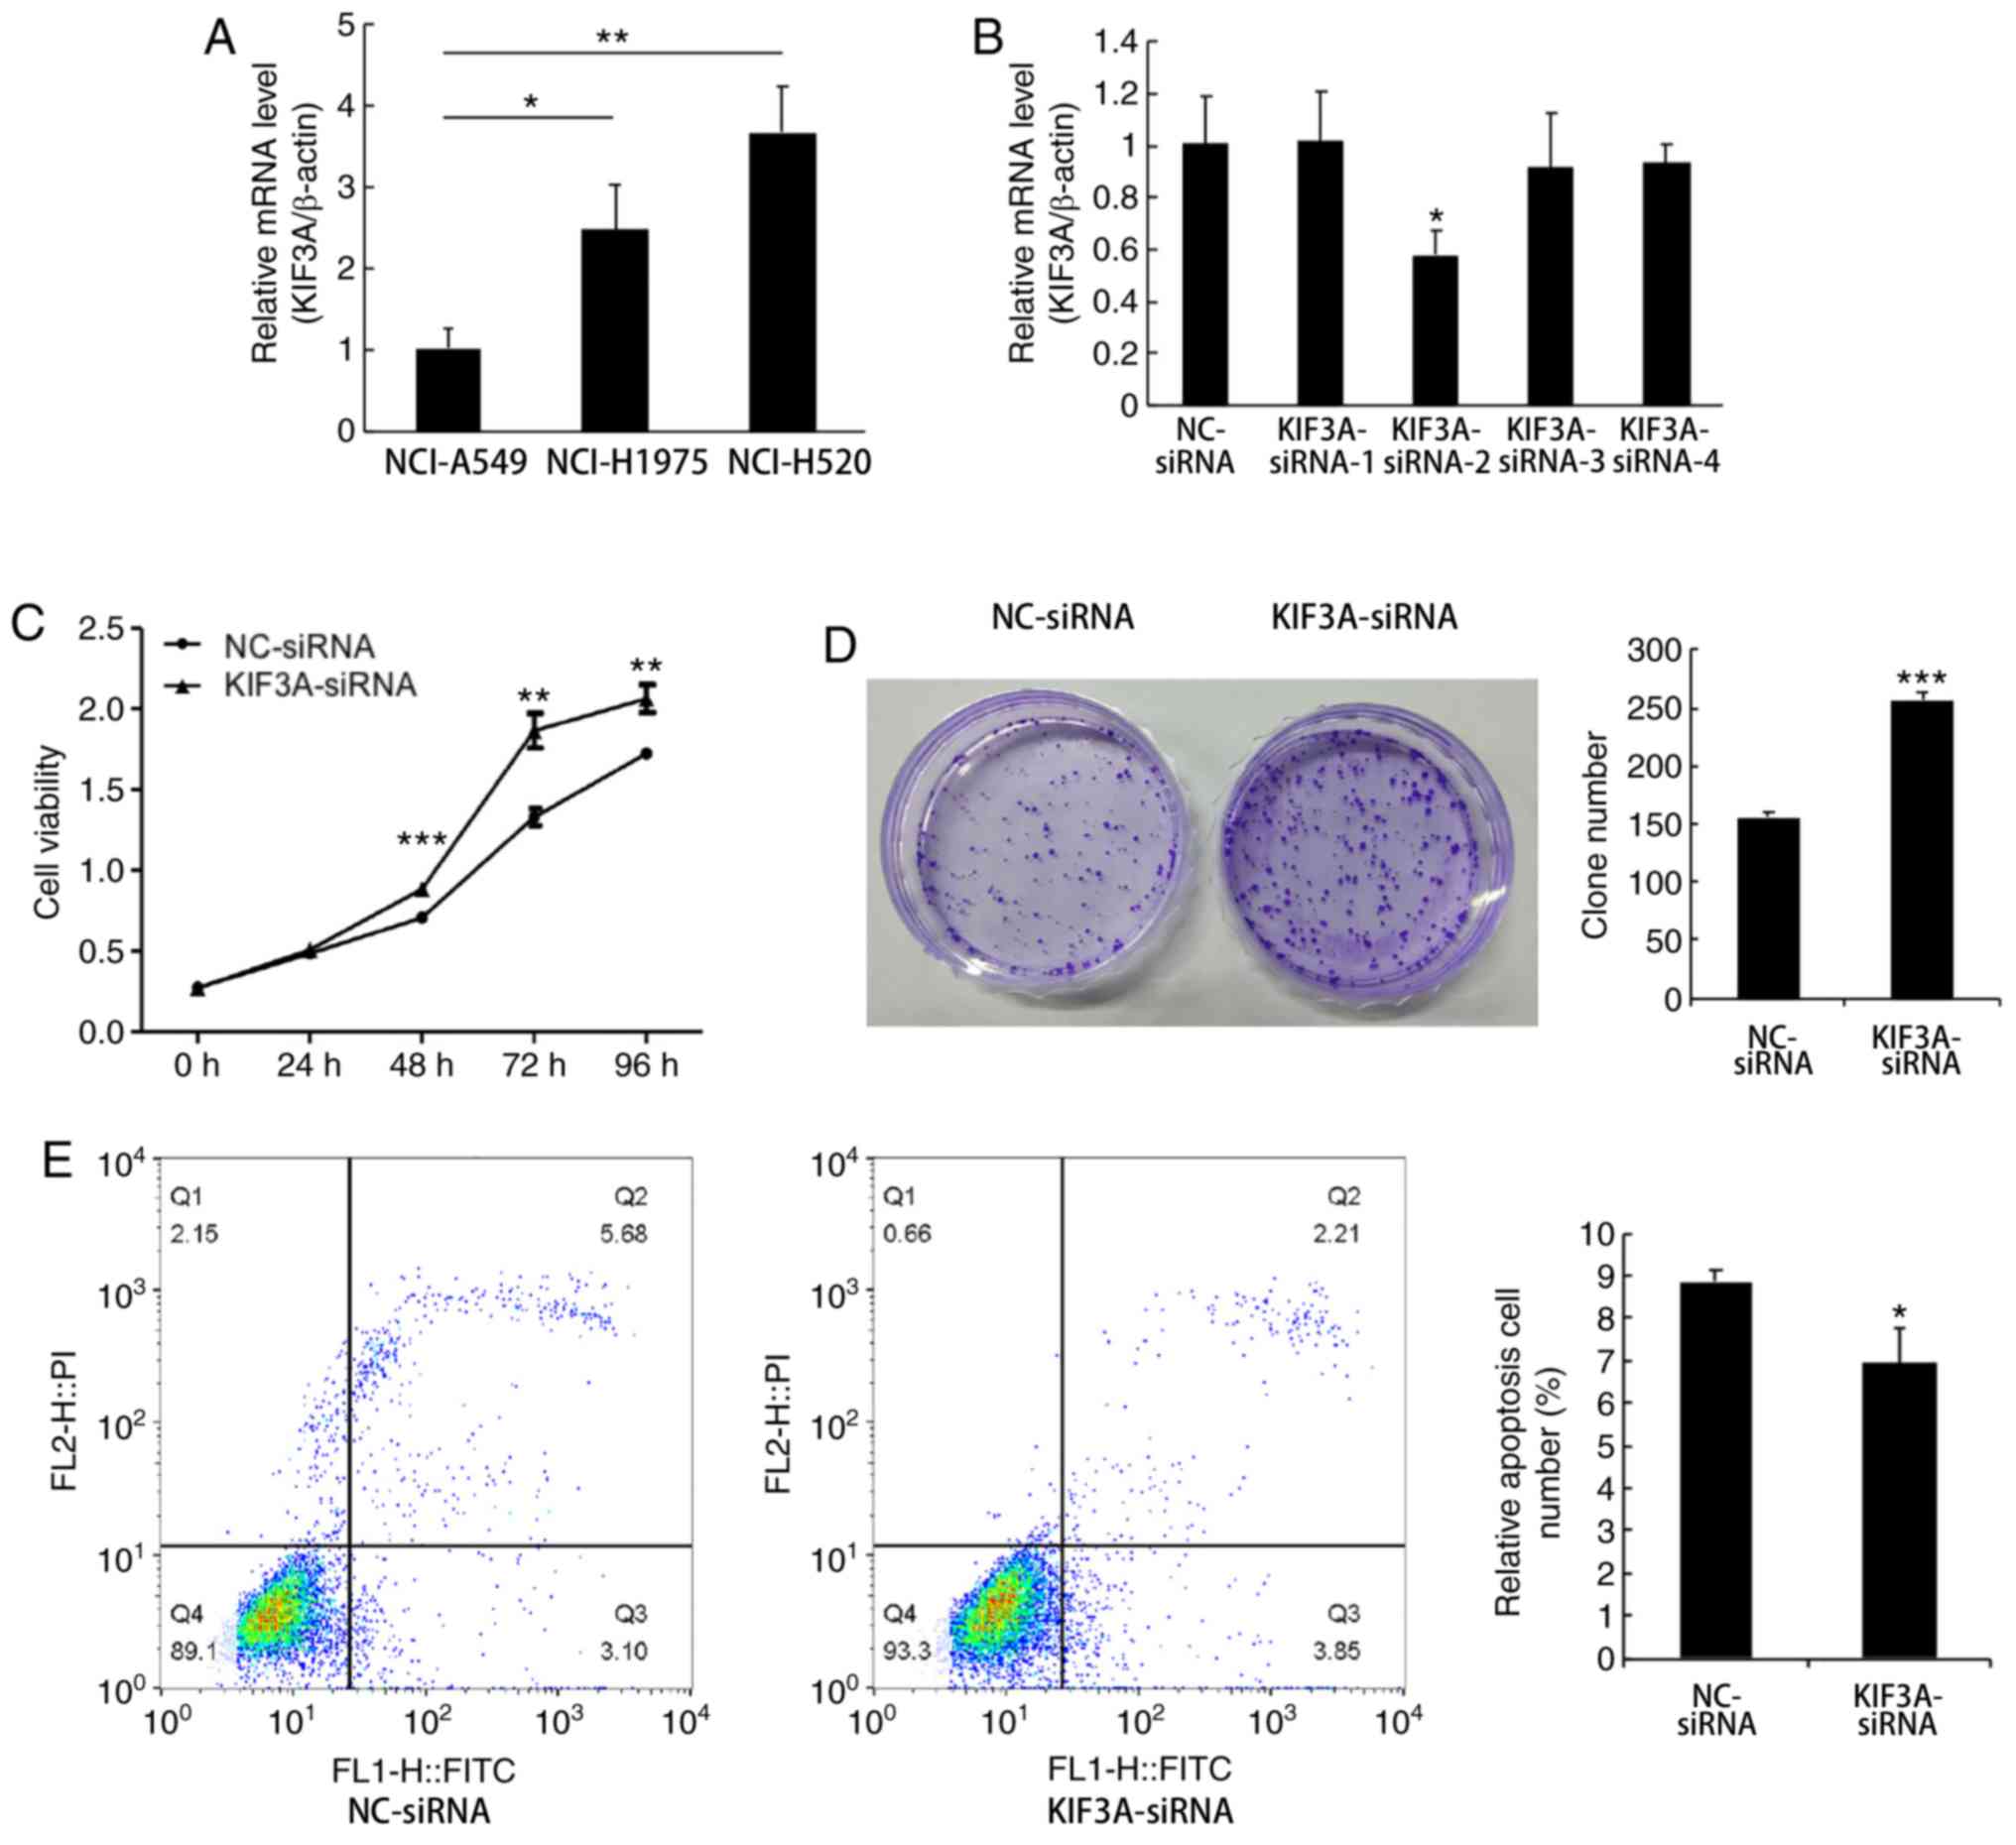
KIF3A mRNA expression was determined in 3 NSCLC cell
lines (NCI-A549, NCI-H1975 and NCI-H520). The results demonstrated
that the relative mRNA expression levels of KIF3A in NCI-H1975 and
NCI-H520 cells were higher compared with that in the NCI-A549 cells
(NCI-A549 vs. NCI-H1975, P<0.05; NCI-A549 vs. NCI-H520,
P<0.01; Fig. 2A). Therefore, the
following functional experiments were performed using the NCI-H520
cell line.
RNA interference efficiently
suppresses KIF3A expression in NCI-H520 cells
The NCI-H520 cells were divided into two groups, the
NC group (NC-siRNA transfected cells) and the siRNA group
(KIF3A-siRNA transfected cells). The knockdown efficiency of four
siRNAs was determined using RT-qPCR. The results demonstrated that
the KIF3A mRNA expression level was significantly downregulated by
KIF3A-siRNA-2, compared with that in the NC-siRNA groups, and was
the most effective (42%; P<0.05; Fig.
2B).
KIF3A knockdown promotes proliferation
and inhibits apoptosis of NCI-H520 cells
To investigate the effect of KIF3A downregulation on
cell proliferation, the CCK-8 assay was performed in transfected
NCI-H520 cells. The results demonstrated that the proliferative
ability was enhanced in the KIF3A-siRNA group compared with that in
the NC-siRNA group (P<0.01; Fig.
2C). The colony formation assay demonstrated that cells in the
KIF3A-siRNA group formed significantly larger and more colonies
compared with that in the NC-siRNA group (P<0.001; Fig. 2D).
Cell apoptosis was investigated using flow
cytometric analysis, and Annexin V-FITC/PI double staining. The
results demonstrated that the apoptotic rate of transfected
NCI-H520 cells was significantly downregulated in the KIF3A-siRNA
group compared with that in the NC-siRNA group (P<0.05; Fig. 2E).
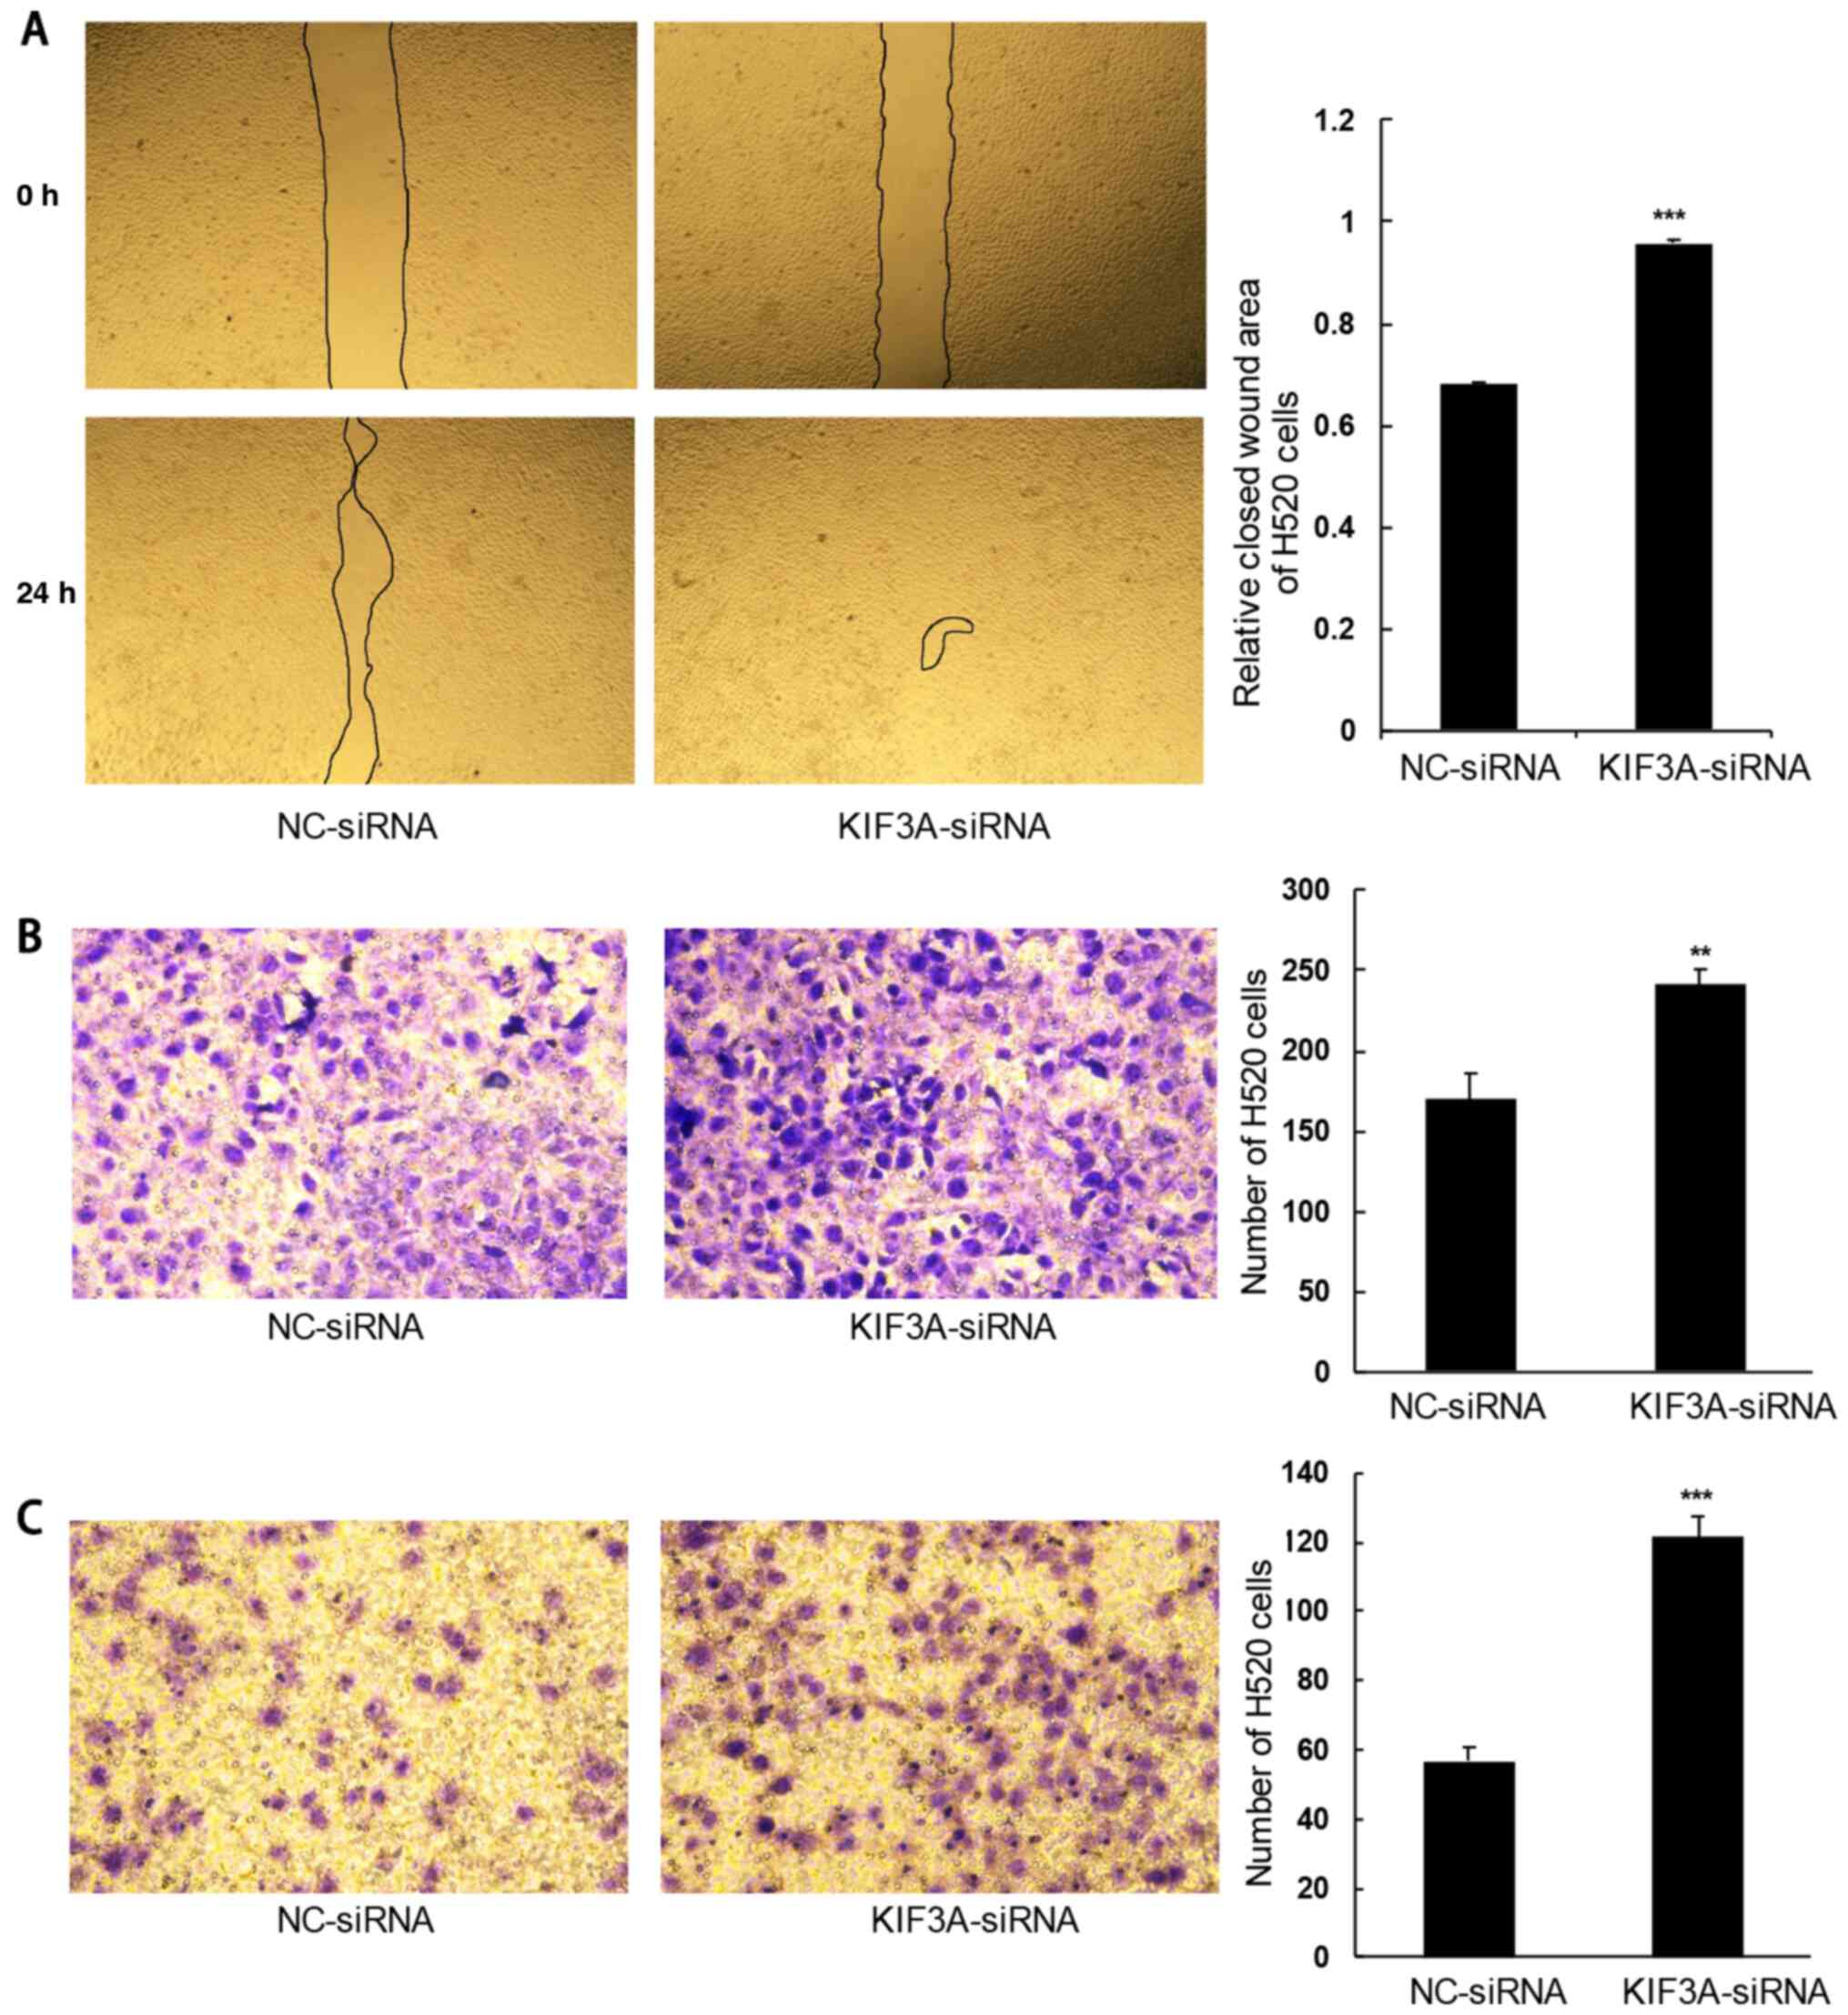
KIF3A knockdown promotes metastasis
and invasion of the NCI-H520 cells
The wound healing assay was performed using the
NCI-H520 cells and the results demonstrated an enhanced migratory
ability in KIF3A-siRNA cells compared with that in the NC-siRNA
group (P<0.001; Fig. 3A). The
Transwell migration and invasion assays demonstrated enhanced
migratory and invasive abilities in the KIF3A-siRNA group
(P<0.01 and P<0.001; Fig. 3B and
C, respectively).
KIF3A expression correlates with IFT57
expression in patients with NSCLC and NSCLC cell lines
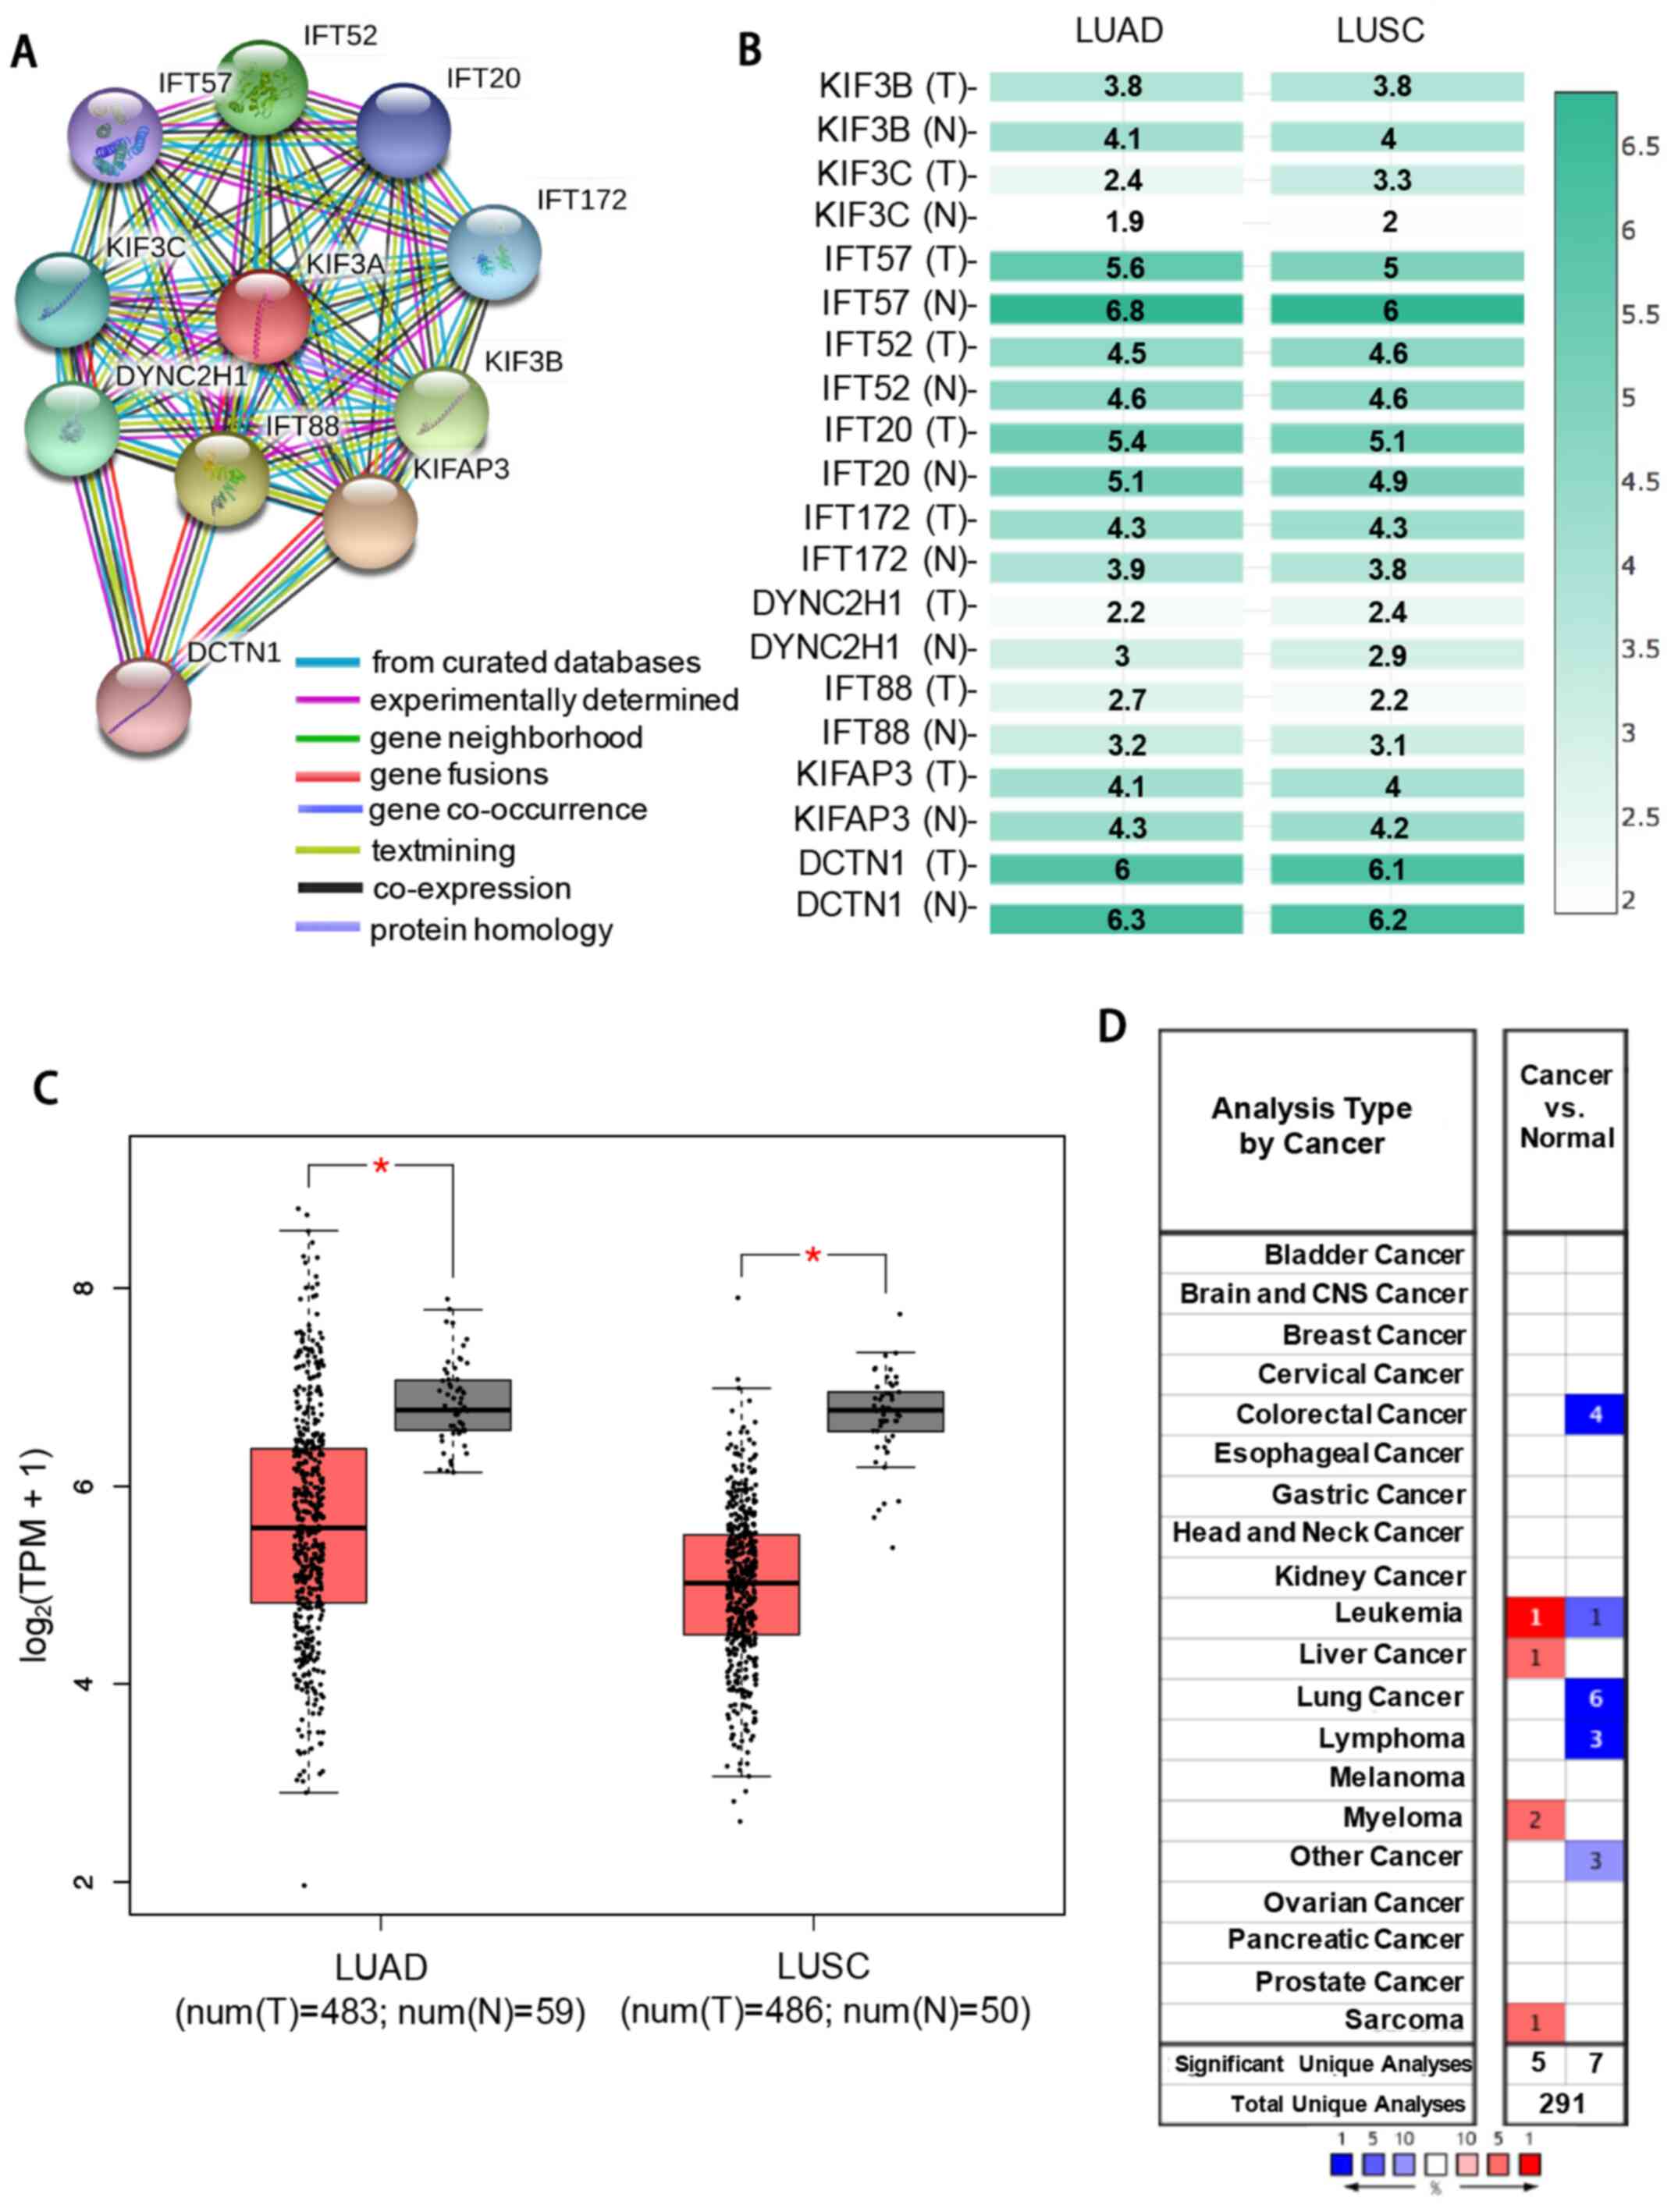
To identify the proteins interacting with KIF3A, a
PPI network of KIF3A was constructed using the STRING database
(Fig. 4A). The mRNA expression
levels of these 11 molecules in the NSCLC samples were assessed
using GEPIA (Fig. 4B). The density
of color in each block of Fig. 4B
represents the median expression value of the molecule in tissues.
The results demonstrated that only IFT57 was significantly
expressed at low levels in both LUAD and LUSC samples compared with
that in the adjacent normal samples (Fig. 4C). Thus, IFT57 was selected for
further analyses.
IFT57 mRNA expression level in 291 datasets was
assessed using the Oncomine database, comparing expression between
tumor and adjacent normal samples (Fig.
4D). A total of 22 datasets exhibited statistically significant
differences in IFT57 expression between tumor and adjacent normal
samples. Among these 22 datasets, 5 studies demonstrated increased
IFT57 expression, while 17 studies demonstrated decreased IFT57
expression in the cancer groups. Among the common malignant tumors,
4 studies had low expression in colorectal cancer, 3 studies had
low expression in lymphoma and 2 studies had high expression in
myeloma. There were 6 studies with low expression and no studies
with high expression of IFT57 in lung cancer.
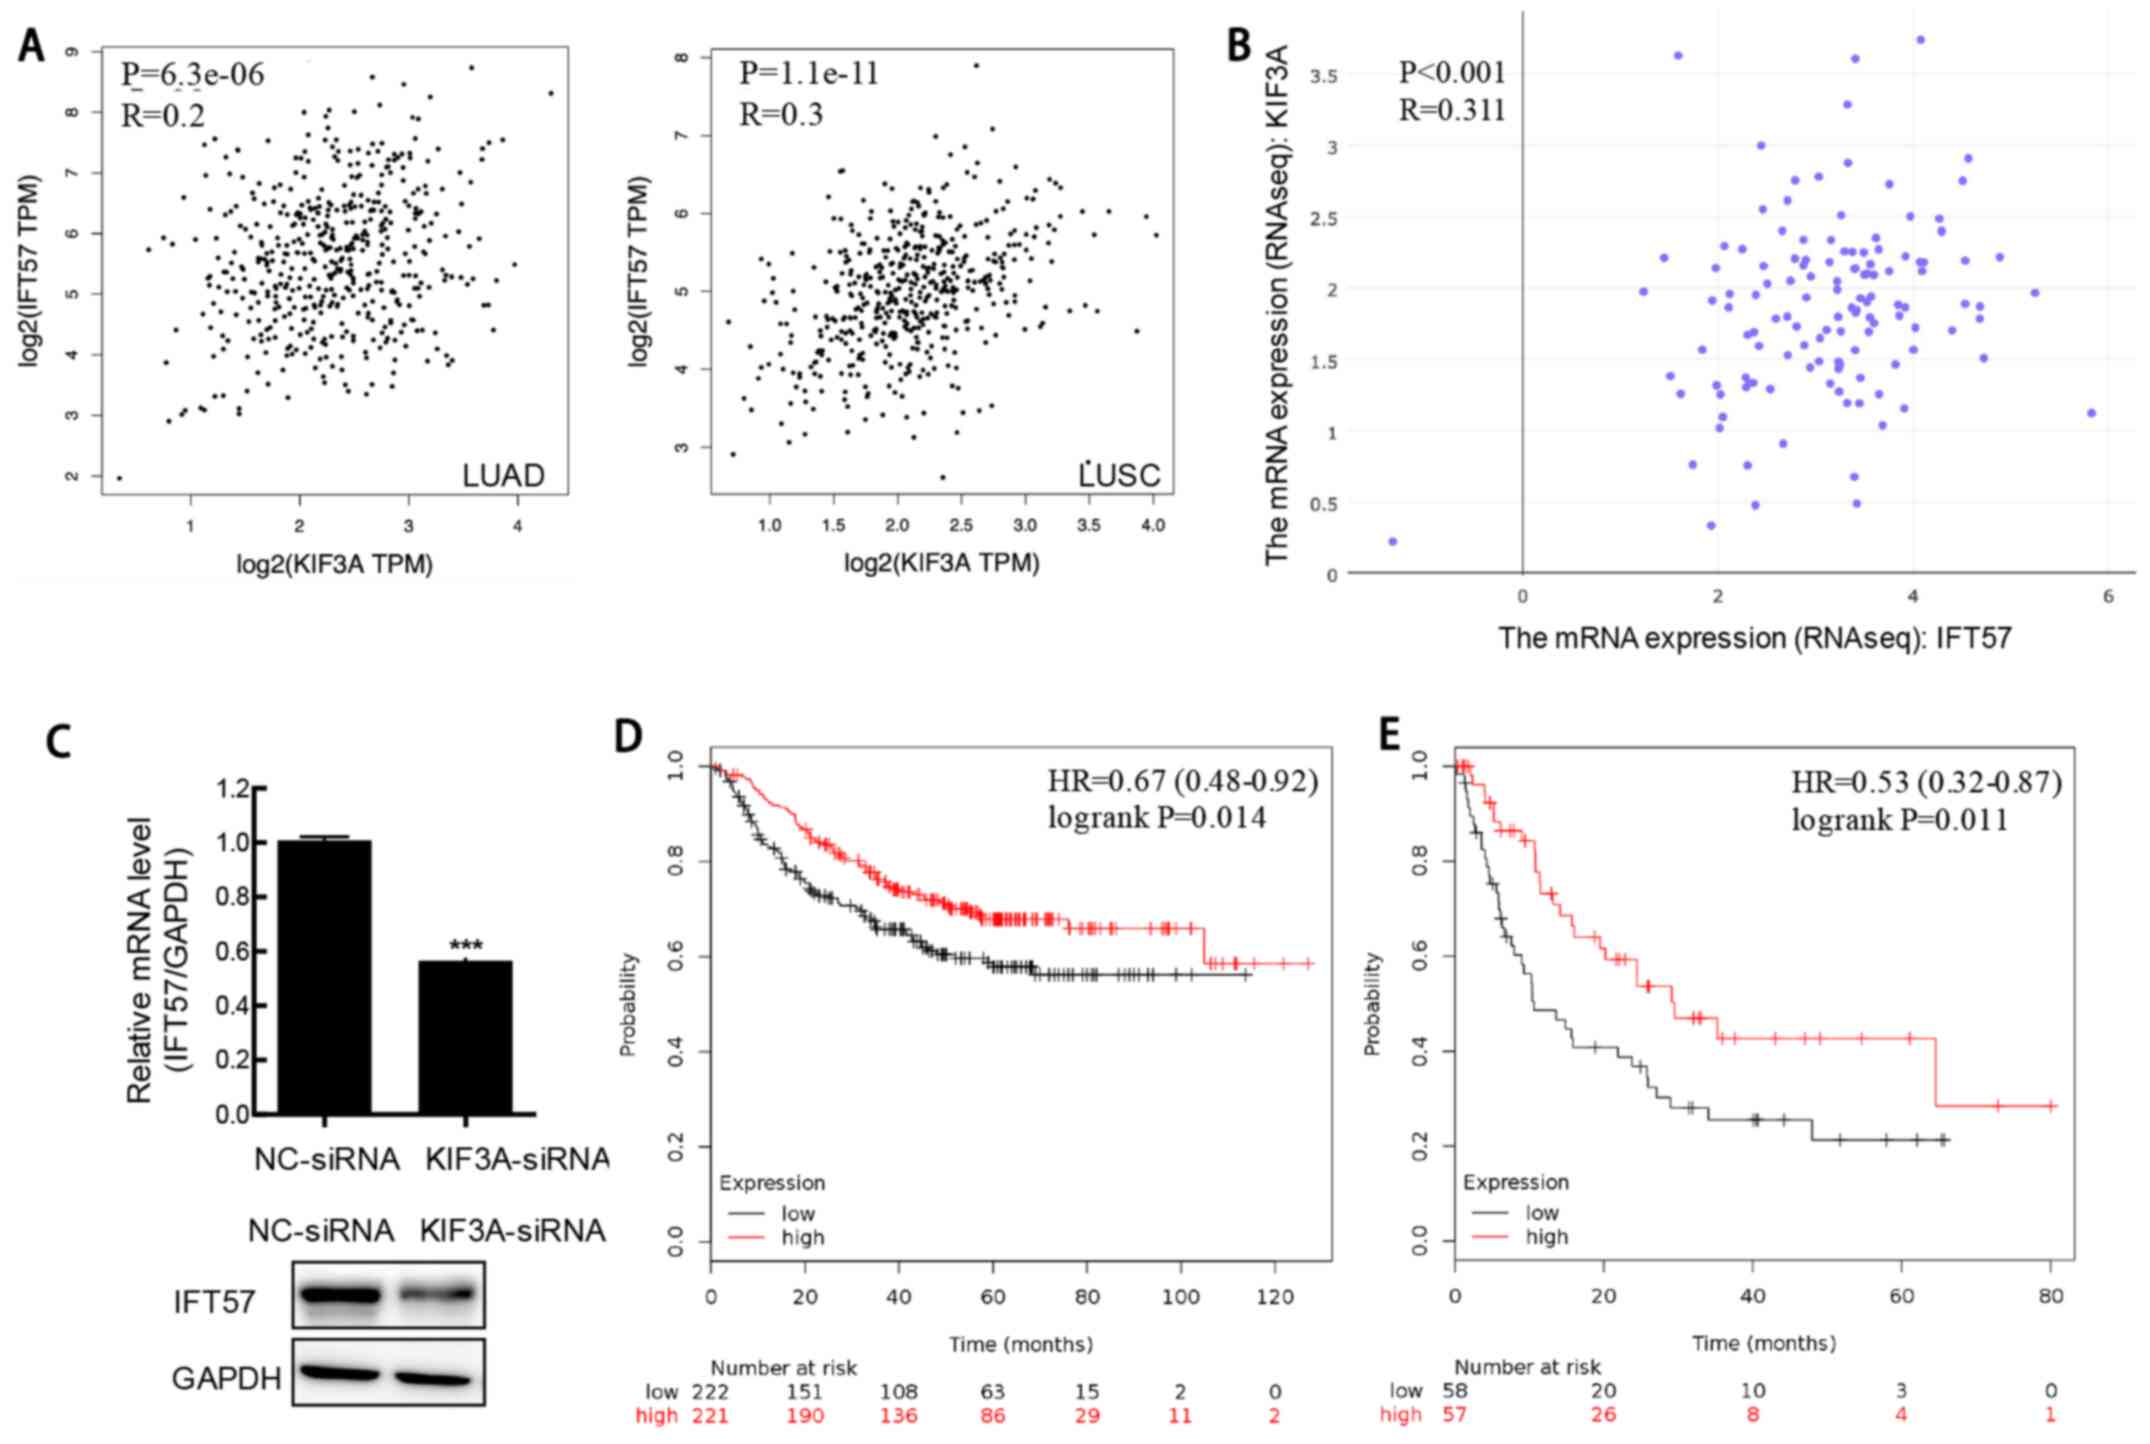
Correlation analysis of the clinical NSCLC samples
from TCGA was performed, and the results demonstrated a
significantly positive correlation between KIF3A and IFT57
expression in LUAD and LUSC samples (both P<0.001; r=0.2 and
r=0.3, respectively; Spearman's rank correlation test; Fig. 5A). To further validate this result,
correlation analysis between KIF3A and IFT57 mRNA expression was
performed in multiple NSCLC cell lines using CCLE, and RNA-Seq.
Similarly, the results demonstrated a significantly positive
correlation between KIF3A and IFT57 mRNA expression levels
(P<0.001; r=0.311; Spearman's rank correlation test; Fig. 5B).
Furthermore, the IFT57 mRNA and protein expression
level was determined at 48 h following transfection with siRNA in
the H520 cells and the results showed that the mRNA and protein
expression levels of IFT57 were downregulated in KIF3A-siRNA cells
compared with that in the siNC cells (P<0.001; Fig. 5C).
Low IFT57 expression indicates poor
prognosis in NSCLC
The association between IFT57 mRNA expression level
and prognosis was determined using the K-M Plotter database and the
results demonstrated that low IFT57 mRNA expression in NSCLC was
associated with adverse OS time (HR, 0.67; P=0.014; Fig. 5D). A similar result was also found in
patients with LUAD (HR, 0.55; P=0.011; Fig. 5E). However, no significant
association was observed between IFT57 mRNA expression and OS time
in patients with LUSC.
Discussion
Progress has been made in the diagnosis and
treatment of NSCLC; however, the survival outcome of patients
remains poor due to metastasis and occurrence (2). Thus, there is an urgent requirement to
further investigate the molecular mechanisms underlying NSCLC
occurrence and metastasis. The results of the present study
demonstrated that KIF3A protein expression level was decreased in
patients with NSCLC. Furthermore, KIF3A knockdown increased the
proliferative, invasive and metastatic abilities, and inhibited
apoptosis of NSCLC cells in vitro. KIF3A mRNA expression
level was positively correlated with IFT57 mRNA expression level in
NSCLC. In addition, poor survival of patients with NSCLC was
associated with low IFT57 expression. Taken together, these results
suggested that KIF3A may act as a potential tumor suppressor in
NSCLC.
Low KIF3A protein expression level was associated
with TNM stage in LUAD and lymph node metastasis in LUSC. Based on
the analyses using the K-M plotter database, low KIF3A mRNA
expression level was associated with a low OS time in patients with
NSCLC. In addition, low KIF3A mRNA expression level was an
independent risk factor and was associated with poor prognosis in
LUAD using PrognoScan. Furthermore, the same outcome was exhibited
in patients with NSCLC, with clinical stage I and T1 grade,
indicating the prognostic value of KIF3A in patients with
early-stage NSCLC. The survival time of patients with NSCLC usually
varies, even in patients with similar clinical stages and those who
receive similar treatment strategies (24,25).
Further studies are required to identify novel prognostic
biomarkers. Previously, potential factors with promising prognostic
value have been reported in patients with NSCLC, like increased
infiltration of regulatory T cells into core tumor regions and
tripartite motif-containing 37 (26,27). The
results of the present study demonstrated that low mRNA and protein
expression level of KIF3A may be an effective diagnostic and
prognostic marker of NSCLC.
KIF3 is a heterotrimeric complex comprising of
KIF3A, KIF3B and kinesis-associated protein 3 (KAP3) (28). Previous studies reported the function
of KIF3A in different types of lung diseases. KIF3A mRNA and
protein expression was decreased in asthma, while KIF3A knockdown
promoted the apoptosis of bronchial epithelia (29). Another study demonstrated that the
defective KIF3A-mediated loss of ciliary in human type II alveolar
epithelial cell lines disrupts the Sonic hedgehog signaling pathway
(30). In addition, it has been
reported that KIF3A binds to β-arrestin and suppresses the
Wnt/β-catenin signaling pathway independently of primary cilia in
lung cancer (9). The results of our
study demonstrated that KIF3A was involved in the proliferation and
metastasis of NSCLC, whereby KIF3A knockdown resulted in inhibition
of cell proliferation, migration and invasion in vitro.
The potential molecular mechanisms underlying KIF3A
in NSCLC were also investigated. IFT57 was demonstrated to interact
with KIF3A, and IFT57 mRNA expression level was significantly
reduced in NSCLC. Furthermore, KIF3A mRNA expression was positively
correlated with IFT57 mRNA expression level in the clinical NSCLC
samples and NSCLC cell lines. In addition, the mRNA and protein
expression levels of IFT57 were decreased following KIF3A knockdown
in the H520 cell line. The results demonstrated that low IFT57 mRNA
expression level was associated with adverse survival of patients
with NSCLC. However, to the best of our knowledge, the clinical
significance of IFT57 and its potential function have not been
investigated in any cancer studies. Previous studies have
demonstrated that IFT, containing IFT-A and IFT-B complexes, was
essential for the formation and maintenance of cilia (31–33). The
bidirectional transportation of ciliary proteins along the axonemal
microtubules and ciliary entry and exit are regulated by IFT
molecules, including IFT-A and IFT-B (31–33). A
recent study reported a three-to-four protein interaction,
including the kinesin-II trimer KIF3A-KIF3B-KAP3 and the
IFT-B-connecting tetramer IFT38-IFT52-IFT57-IFT88 (34). However, to the best of our knowledge,
the interaction between KIF3A and IFT57 has not yet been reported.
Collectively, the results of the present study suggested that KIF3A
may interact with IFT57 in NSCLC, and IFT57 may also be a potential
diagnostic and prognostic biomarker for NSCLC.
The present study is not without limitations.
Firstly, large-scale prospective studies are required to further
assess the diagnostic and prognostic values of KIF3A and IFT57 in
NSCLC. The results from the public databases were not verified
using clinical samples. These conflicting results may be due to
different sample sources and sample sizes. Secondly, the molecular
mechanism underlying the interaction between KIF3A and IFT57 in
NSCLC required verification in future studies.
In conclusion, the results of the present study
demonstrated that KIF3A mRNA and protein expression levels were
decreased in NSCLC. Furthermore, KIF3A knockdown promoted the
proliferative, invasive and metastatic abilities, and suppressed
the apoptosis of NSCLC cells. KIF3A was demonstrated to inhibit the
occurrence and development of NSCLC by interacting with IFT57. In
addition, low mRNA and protein expression levels of both KIF3A and
IFT57 were associated with adverse survival times of patients with
NSCLC. Collectively, these results suggested that KIF3A may
function as a tumor suppressor in NSCLC and could be developed as a
therapeutic target for the treatment of NSCLC.
Supplementary Material
Supporting Data
Acknowledgements
Not applicable.
Funding
The present study was supported by grants from the
Major Scientific and Technological Innovation Project of Shandong
Province (grant no. 2018CXGC1212), the Science and Technology
Foundation of Shandong Province (grant no. 2014GSF118084), the
CSCO-QiLu Oncology Research Fund (grant no. Y-Q201802-014), the
Medical and Health Technology Innovation Plan of Jinan City (grant
no. 201805002) and the National Natural Science Foundation of China
(grant no. 81372333).
Availability of data and materials
The datasets used and/or analyzed during the present
study are available from the corresponding author upon reasonable
request.
Authors' contributions
YQ and YY conceived and designed the present study.
XL and RL performed the experiments. MZ and HW collected the
clinical samples and analyzed the clinical data. YY and XL analyzed
the data, performed the bioinformatic analysis and drafted the
initial manuscript. All authors read and approved the final
manuscript and agreed to be accountable for all aspects of the
research.
Ethics approval and consent to
participate
The present study was approved by the Ethics
Committee of Qilu Hospital of Shandong University (Jinan, China;
approval no. KYLL-2018-048). Patients or their families agreed and
provided written informed consent.
Patient consent for publication
Not applicable.
Competing interests
The authors declare that they have no competing
interests.
References
|
1
|
Bray F, Ferlay J, Soerjomataram I, Siegel
RL, Torre LA and Jemal A: Global cancer statistics 2018: GLOBOCAN
estimates of incidence and mortality worldwide for 36 cancers in
185 countries. CA Cancer J Clin. 68:394–424. 2018. View Article : Google Scholar : PubMed/NCBI
|
|
2
|
Gridelli C, Rossi A, Carbone DP, Guarize
J, Karachaliou N, Mok T, Petrella F, Spaggiari L and Rosell R:
Non-small-cell lung cancer. Nat Rev Dis Primer. 1:150092015.
View Article : Google Scholar
|
|
3
|
Boloker G, Wang C and Zhang J: Updated
statistics of lung and bronchus cancer in United States (2018). J
Thorac Dis. 10:1158–1161. 2018. View Article : Google Scholar : PubMed/NCBI
|
|
4
|
Kolpakova-Hart E, Jinnin M, Hou B, Fukai N
and Olsen BR: Kinesin-2 controls development and patterning of the
vertebrate skeleton by Hedgehog- and Gli3-dependent mechanisms. Dev
Biol. 309:273–284. 2007. View Article : Google Scholar : PubMed/NCBI
|
|
5
|
Rosenbaum JL and Witman GB: Intraflagellar
transport. Nat Rev Mol Cell Biol. 3:813–825. 2002. View Article : Google Scholar : PubMed/NCBI
|
|
6
|
Hirokawa N: Kinesin and dynein superfamily
proteins and the mechanism of organelle transport. Science.
279:519–526. 1998. View Article : Google Scholar : PubMed/NCBI
|
|
7
|
Barakat MT, Humke EW and Scott MP: Kif3a
is necessary for initiation and maintenance of medulloblastoma.
Carcinogenesis. 34:1382–1392. 2013. View Article : Google Scholar : PubMed/NCBI
|
|
8
|
Liu Z, Rebowe RE, Wang Z, Li Y, Wang Z,
DePaolo JS, Guo J, Qian C and Liu W: KIF3a promotes proliferation
and invasion via Wnt signaling in advanced prostate cancer. Mol
Cancer Res. 12:491–503. 2014. View Article : Google Scholar : PubMed/NCBI
|
|
9
|
Kim M, Suh YA, Oh JH, Lee BR, Kim J and
Jang SJ: KIF3A binds to β-arrestin for suppressing Wnt/β-catenin
signalling independently of primary cilia in lung cancer. Sci Rep.
6:327702016. View Article : Google Scholar : PubMed/NCBI
|
|
10
|
Travis WD, Brambilla E, Burke AP, Marx A
and Nicholson AG: WHO Classification of Tumours of the Lung,
Pleura, Thymus and Heart. 4th edition. International Agency for
Research on Cancer; Lyon: 2015
|
|
11
|
Amin MB, Edge S, Greene F, Byrd DR,
Brookland RK, Washington MK, Gershenwald JE, Compton CC, Hess KR,
Sullivan DC, et al: AJCC Cancer Staging Manual. 8th edition.
Springer International Publishing; New York, NY: 2017, View Article : Google Scholar
|
|
12
|
Liu X, Li C, Yang Y, Liu X, Li R, Zhang M,
Yin Y and Qu Y: Synaptotagmin 7 in twist-related protein 1-mediated
epithelial-mesenchymal transition of non-small cell lung cancer.
EBioMedicine. 46:42–53. 2019. View Article : Google Scholar : PubMed/NCBI
|
|
13
|
Livak KJ and Schmittgen TD: Analysis of
relative gene expression data using real-time quantitative PCR and
the 2(-Delta Delta C(T)) method. Methods. 25:402–408. 2001.
View Article : Google Scholar : PubMed/NCBI
|
|
14
|
Gyorffy B, Surowiak P, Budczies J and
Lanczky A: Online survival analysis software to assess the
prognostic value of biomarkers using transcriptomic data in
non-small-cell lung cancer. PLoS One. 8:e822412013. View Article : Google Scholar : PubMed/NCBI
|
|
15
|
Broglio KR and Berry DA: Detecting an
overall survival benefit that is derived from progression-free
survival. J Natl Cancer Inst. 101:1642–1649. 2009. View Article : Google Scholar : PubMed/NCBI
|
|
16
|
Mizuno H, Kitada K, Nakai K and Sarai A:
PrognoScan: A new database for meta-analysis of the prognostic
value of genes. BMC Med Genomics. 2:182009. View Article : Google Scholar : PubMed/NCBI
|
|
17
|
Jensen LJ, Kuhn M, Stark M, Chaffron S,
Creevey C, Muller J, Doerks T, Julien P, Roth A, Simonovic M, et
al: STRING 8-a global view on proteins and their functional
interactions in 630 organisms. Nucleic Acids Res. 37:D412–D416.
2009. View Article : Google Scholar : PubMed/NCBI
|
|
18
|
Tang Z, Li C, Kang B, Gao G, Li C and
Zhang Z: GEPIA: A web server for cancer and normal gene expression
profiling and interactive analyses. Nucleic Acids Res. 45:W98–W102.
2017. View Article : Google Scholar : PubMed/NCBI
|
|
19
|
Ghandi M, Huang FW, Jane-Valbuena J,
Kryukov GV, Lo CC, McDonald ER III, Barretina J, Gelfand ET,
Bielski CM, Li H, et al: Next-generation characterization of the
cancer cell line encyclopedia. Nature. 569:503–508. 2019.
View Article : Google Scholar : PubMed/NCBI
|
|
20
|
Irizarry RA, Bolstad BM, Collin F, Cope
LM, Hobbs B and Speed TP: Summaries of affymetrix GeneChip probe
level data. Nucleic Acids Res. 31:e152003. View Article : Google Scholar : PubMed/NCBI
|
|
21
|
Okayama H, Kohno T, Ishii Y, Shimada Y,
Shiraishi K, Iwakawa R, Furuta K, Tsuta K, Shibata T, Yamamoto S,
et al: Identification of genes upregulated in ALK-positive and
EGFR/KRAS/ALK-negative lung adenocarcinomas. Cancer Res.
72:100–111. 2012. View Article : Google Scholar : PubMed/NCBI
|
|
22
|
Raponi M, Zhang Y, Yu J, Chen G, Lee G,
Taylor JM, Macdonald J, Thomas D, Moskaluk C, Wang Y and Beer DG:
Gene expression signatures for predicting prognosis of squamous
cell and adenocarcinomas of the lung. Cancer Res. 66:7466–7472.
2006. View Article : Google Scholar : PubMed/NCBI
|
|
23
|
Wilkerson MD, Yin X, Hoadley KA, Liu Y,
Hayward MC, Cabanski CR, Muldrew K, Miller CR, Randell SH, Socinski
MA, et al: Lung squamous cell carcinoma mRNA expression subtypes
are reproducible, clinically important, and correspond to normal
cell types. Clin Cancer Res. 16:4864–4875. 2010. View Article : Google Scholar : PubMed/NCBI
|
|
24
|
Molina JR, Yang P, Cassivi SD, Schild SE
and Adjei AA: Non-small cell lung cancer: Epidemiology, risk
factors, treatment, and survivorship. Mayo Clin Proc. 83:584–594.
2008. View
Article : Google Scholar : PubMed/NCBI
|
|
25
|
Wouters MW, Siesling S, Jansen-Landheer
ML, Elferink MA, Belderbos J, Coebergh JW and Schramel FM:
Variation in treatment and outcome in patients with non-small cell
lung cancer by region, hospital type and volume in the Netherlands.
Eur J Surg Oncol. 36 (Suppl 1):S83–S92. 2010. View Article : Google Scholar : PubMed/NCBI
|
|
26
|
Barua S, Fang P, Sharma A, Fujimoto J,
Wistuba I, Rao AUK and Lin SH: Spatial interaction of tumor cells
and regulatory T cells correlates with survival in non-small cell
lung cancer. Lung Cancer. 117:73–79. 2018. View Article : Google Scholar : PubMed/NCBI
|
|
27
|
Li Y, Deng L, Zhao X, Li B, Ren D, Yu L,
Pan H, Gong Q, Song L, Zhou X and Dai T: Tripartite
motif-containing 37 (TRIM37) promotes the aggressiveness of
non-small-cell lung cancer cells by activating the NF-KB pathway. J
Pathol. 246:366–378. 2018. View Article : Google Scholar : PubMed/NCBI
|
|
28
|
Guo X, Macleod GT, Wellington A, Hu F,
Panchumarthi S, Schoenfield M, Marin L, Charlton MP, Atwood HL and
Zinsmaier KE: The GTPase dMiro is required for axonal transport of
mitochondria to Drosophila synapses. Neuron. 47:379–393.
2005. View Article : Google Scholar : PubMed/NCBI
|
|
29
|
Geng G, Du Y, Dai J, Tian D, Xia Y and Fu
Z: KIF3A knockdown sensitizes bronchial epithelia to apoptosis and
aggravates airway inflammation in asthma. Biomed Pharmacother.
97:1349–1355. 2018. View Article : Google Scholar : PubMed/NCBI
|
|
30
|
Lee J, Oh DH, Park KC, Choi JE, Kwon JB,
Lee J, Park K and Sul HJ: Increased primary cilia in idiopathic
pulmonary fibrosis. Mol Cells. 41:224–233. 2018.PubMed/NCBI
|
|
31
|
Taschner M and Lorentzen E: The
intraflagellar transport machinery. Cold Spring Harb Perspect Biol.
8:a0280922016. View Article : Google Scholar : PubMed/NCBI
|
|
32
|
Prevo B, Scholey JM and Peterman EJG:
Intraflagellar transport: Mechanisms of motor action, cooperation,
and cargo delivery. FEBS J. 284:2905–2931. 2017. View Article : Google Scholar : PubMed/NCBI
|
|
33
|
Nakayama K and Katoh Y: Ciliary protein
trafficking mediated by IFT and BBSome complexes with the aid of
kinesin-2 and dynein-2 motors. J Biochem. 163:155–164. 2018.
View Article : Google Scholar : PubMed/NCBI
|
|
34
|
Funabashi T, Katoh Y, Okazaki M, Sugawa M
and Nakayama K: Interaction of heterotrimeric kinesin-II with
IFT-B-connecting tetramer is crucial for ciliogenesis. J Cell Biol.
217:2867–2876. 2018. View Article : Google Scholar : PubMed/NCBI
|