Introduction
Esophageal squamous cell carcinoma (ESCC) is one of
the deadliest cancer types and accounts for ~90% of all incidental
esophageal cancers in China (1,2).
Although the causes of ESCC have been increasingly clarified and
various treatment strategies have been applied in recent decades,
there remains a lack of effective ESCC therapies (1). Usually, ESCC has a poor prognosis as
most patients lack symptoms at an early stage and are diagnosed too
late to achieve curative treatment (3). In China, the survival rate of patients
with ESCC with a late diagnosis is <10%, but if it is diagnosed
at an early stage, the survival rate can be as high as 85%
(4). Therefore, the understanding of
the pathogenesis of ESCC, the identification of the risk factors
that are significantly associated with prognosis, and the search
for novel effective diagnostic modalities for early-stage ESCC are
urgently required (5).
It is widely accepted that abnormal molecular
alterations, including aberrant gene expression and promoter
methylation, are usually associated with the pathogenesis of ESCC,
a multifactorial disease. It has been reported that genes involved
in cell cycle and apoptosis regulation are mutated in 99% of ESCC
cases, and mutations in the epigenetic modulators are associated
with prognosis, with potential therapeutic implications (6). Furthermore, epigenetic alterations,
particularly DNA methylation, serve a crucial role in cancer, and
aberrant promoter island methylation of tumor suppressor genes has
been established as a common epigenetic mechanism underlying
tumorigenesis (7,8). Considering that the overall survival
(OS) time of cancer patients is usually associated with a variety
of risk factors, it is increasingly recognized that incorporating
multiple variables into cancer prediction models would be more
accurate than an estimation based on a single predictor (9). Recently, several risk assessment models
have been developed to identify the high-risk patients and have
proved to be useful in estimating the likelihood of patients with a
specific set of risk factors suffering from diseases of interest
(10,11). However, the majority of the existing
analytical tools only analyze individual groups independently. It
is a difficult and urgent issue to integrate data from multiple
groups with different technical protocols to acquire more useful
prognosis-related information (12).
Deep learning (DL), a new category of machine
learning methods, has been successfully applied in solving numerous
structural analysis problems (13,14). A
DL computation framework has been used to successfully predict
survival in several cancer types, based on large-scale omics data,
including liver cancer, pan-cancer, and kidney renal clear cell
carcinoma (15–17). However, no autoencoder-based DL
models have been applied to multi-omics data of various cancer
types. Autoencoder is an unsupervised feed-forward neural network
which may be built using different strategies, including
early-fusion autoencoder and joint multimodal representation
(15).
The Cancer Genome Atlas (TCGA) database is an
application platform for large-sample genome sequencing analysis of
33 types of cancer. In the present study, large quantities of mRNA
and methylation data of patients with ESCC were downloaded from
TCGA, along with their clinical information. The representation
features were screened using an autoencoder framework. Univariate
Cox proportional hazards (PH) analysis was used to screen out the
features that were significantly associated with prognosis.
According to these features, K-means grouping was used to cluster
the prognosis-related features, and its robustness was evaluated.
Furthermore, two ArrayExpress datasets was were used to verify the
reliability of the clinical prognosis-related features. The present
study aimed to develop a reliable stratification method for
identifying the ESCC patients with high risk of mortality and to
provide potential clinical diagnostic biomarkers for patients with
ESCC.
Materials and methods
Data collection and preprocessing
Methylation beta-value of 202 esophageal cancer
(ESCA) cases generated on Illumina Human Methylation 450 platform
and FPKM values of 196 cases generated from RNA-Seq Illumina HiSeq
2000 platform were downloaded from TCGA database (18) (https://gdc-portal.nci.nih.gov/), and their clinical
data were also downloaded. A total of 194 samples possessing
RNA-seq and methylation array data were obtained, including 99 ESCC
samples and 95 esophageal adenocarcinoma samples. Ninety-six ESCC
samples had overall survival (OS) information and were used as the
training set (TCGA set).
Raw data were preprocessed using the following
steps: i) the probes that were missing in >50% of samples were
filtered out; ii) the methylation data were initially annotated
using Illumina Human Methylation 450 kanno.ilmn12. hg19 package
(19) of R software, and the mean
beta values of multiple methylation sites in the promoter region
were subsequently calculated and used as promoter methylation
values. The promoter region referred to all CpG islands within
1,500 bp ahead of the transcription start site (TSS); iii) the
samples that were missing across >20% of the promoter features
were filtered out; iv) the missing values of the two-omics data
were filled with impute package of R software (version 3.5.2)
(20); and v) the gene features with
zero values across all samples were filtered out.
Two validation datasets
E-GEOD-53624 (https://www.ebi.ac.uk/arrayexpress/experiments/E-GEOD-53624/;A-
GEOD- 18109 platform) and E-GEOD-53625 (https://www.ebi.ac.uk/arrayexpress/experiments/E-GEOD-53625/;A-GEOD-
18109 platform) datasets consisting of RNA expression profile data
of ESCC were downloaded from ArrayExpress database (https://www.ebi.ac.uk/arrayexpress/), which
included 119 and 179 cases, respectively. The probes and samples
were filtered and preprocessed according to the steps stated above
steps. The average eigenvalue of all probes corresponding to a
single RNA was selected as the eigenvalue of the RNA. The two
datasets were used as validation datasets in the present analysis.
As no methylation dataset with clinical prognostic information
could be found, only the two RNA datasets were used for
verification.
Clinical characteristics of the TCGA set and of the
two validation datasets are presented in Table I.
 | Table I.Clinical characteristics of three
datasets. |
Table I.
Clinical characteristics of three
datasets.
| Clinical index | TCGA cohort
(n=96) | E-GEOD-53624
(n=119) | E-GEOD-53624
(n=179) |
|---|
| Age, mean ± SD | 58.29±10.24 | 59.03±8.93 | 59.35±9.03 |
| Sex,
female/male | 14/82 | 21/98 | 33/146 |
| OS, years, mean ±
SD | 1.25±0.96 | 3.09±2.02 | 3.02±1.91 |
| OS status,
alive/dead | 63/33 | 46/73 | 73/106 |
| DFS, mean years ±
SD) | 1.11±1.02 | – | – |
| DFS status,
0/1/- | 59/32/5 | – | – |
| Stage,
I/II/III/IV/- | 7/55/27/4/3 | 8/44/67/0/0 | 10/77/92/0/0 |
| Pathological T,
T1/T2/T3/T4/- | 8/31/50/4/3 | 8/20/62/29 | 12/27/110/30 |
| Pathologic N,
N0/N1/N2/N3- | 54/29/6/3/4 | 54/42/13/10/0 | 83/62/22/12/0 |
| Pathological M,
M0/M1/- | 83/4/9 | – | – |
| Eastern cancer
oncology group, 0/1/2/3/- | 3/28/5/3/57 | – | – |
Autoencoder construction using two
strategies
Autoencoder is an unsupervised feedforward neural
network (15). In this technique,
according to the reconstruction error between input layer X (input
layers) and output layer X ‘(output layers), the depth neural
network is trained to reproduce input layer X. For example, if you
use the reconstructed square difference, the train model could be
used to optimize the following loss function: L(X,
X′=||X–X′||2. A key feature of
Autoencoder is to learn a useful feature representation of data,
usually compressed data. The input layer X is firstly transformed
to the middle layer Z, and the mapping from layer X to Z is
completed by the encoder part of the network. For example, if the
encoder contains only one neural network layer,
Z=α(WeX + be),
where, α is a nonlinear activation function, and
We and be are linear weights
and deviations, the second part of the Autoencoder network is the
decoder, from layer Z to reconstructed output layer X′:
X′=α(WdZ +
bd).
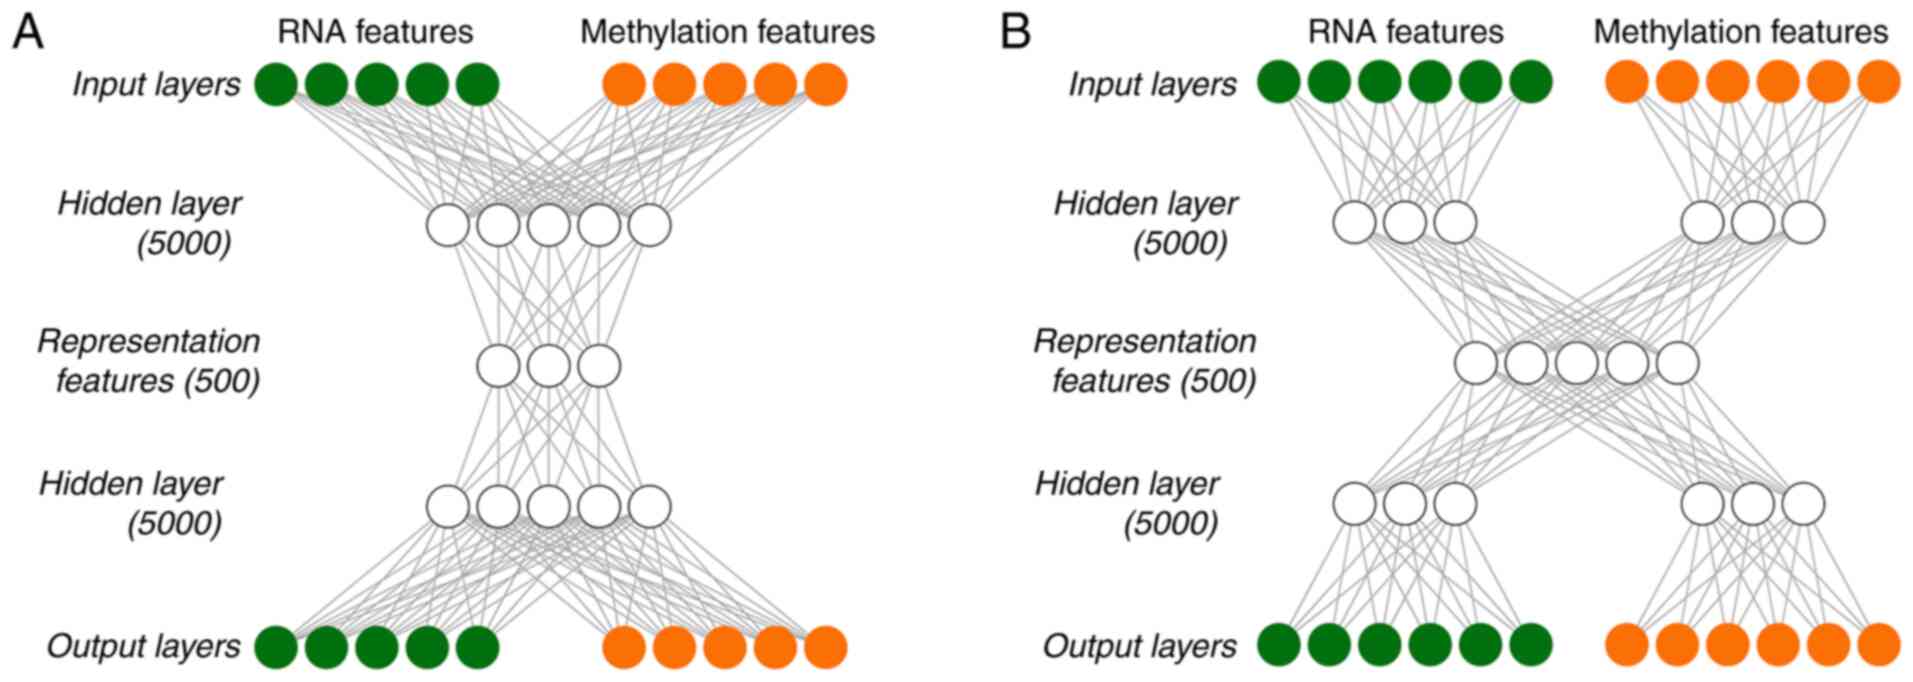
In the present study, autoencoder was built using
two different strategies. One was early-fusion autoencoder
(Fig. 1A), which was the traditional
autoencoder used as the benchmark model, and the other one was a
joint multimodal representation strategy (Fig. 1B). Early-fusion involves fusing data
from multiple sources into a single feature vector, which is then
used as an input for the DL algorithm (Fig. 1A). The fused data was original or
preprocessed data from sensors. If data fusion is performed without
feature extraction, it will be very challenging. For example, the
sampling rates of different sensors may vary. If a data source
generates discrete data and another data source provides a
continuous data stream, simultaneous interpretation of data from
multiple sources may be unavailable. In order to alleviate certain
problems associated with fusion of original data, higher-level
characterization features were extracted from each mode, which may
be common learning representations in DL, and were then fused at a
specified level.
As DL essentially involves learning the hierarchical
representation from the original data, it produces an
intermediate-level fusion. A common autoencoder of
intermediate-level fusion is joint multimodal representation
strategy (Fig. 1B). A neural network
transforms the original input into a higher-level representation.
Each layer usually alternates linear and non-linear operations,
scales, shifts and tilts the input, resulting in a new
representation of the original data. In a multimodal environment,
when all modes are transformed into representations, different
representations may be fused into a separate hidden layer, and
consequently a joint multimodal representation strategy may be
learned. The majority of the work of deep multimodal fusion adopts
the intermediate fusion method.
Tanh was used as the activation function of each
layer in the in-DL process. To train Autoencoder, a gradient
descent algorithm with 128 epochs and a 20% dropout was used. The
Hidden layernodes and Hidden layer presentation nodes
were set to be 5,000 and 500, respectively. The TCGA data were
integrated and recoded by implementing Autoencoder with Python
lasagne library, and 500 representation features were eventually
obtained.
Selection of transformed features and
K-means clustering
For the representation features obtained
using joint multimodal representation or early-fusion autoencoder,
the coefficient of variation of each feature was analyzed using
survival package of R language (https://cran.r-project.org/web/packages/survival/index.html),
from which the significant transformed features with a coefficient
of variation of <0.1 were screened out. Next, the remaining
features underwent a univariate Cox-PH analysis, using survival
package of R language. Subsequently, according to the
representation features with P<0.05, K-means clustering was
applied to the 96 samples of the TCGA set using R nbclust package
(https://cran.r-project.org/web/packages/NbClust/index.html)
(21), which can set several
evaluation parameters and automatically generate the optimal
clustering number. In the present study, Silhouette index and
Calski-Harabasz criterion were calculated to generate the optimal
clustering number, and the classification label of each sample was
consequently obtained. Kaplan-Meier survival curves of different
survival groups were drawn, and concordance index (C-index) and
log-rank P-values were calculated. When the optimal clustering
number was generated, the survival risk subgroups of samples were
also obtained. In the subsequent parts, the ‘risk subgroups’ were
used instead of the ‘optimal clustering number’.
Data grouping and robustness
evaluation
In order to evaluate the robustness of the obtained
risk subgroups, a cross-validation (CV)-like procedure was used to
partition the TCGA set as follows: TCGA data was split into
training set/test set (60/40%) to have enough test samples to
generate the evaluation indicators. Specifically, the 96 ESCC
samples were randomly divided into 5-folds, and then 2-folds were
used as the test set and the remaining 3-folds were used as the
training set. This way, a total of 10 new combinations were
obtained. For each of the 10 new combinations, the 60% samples
(training set) were used to construct a model and predict the risk
subgroups in the test set. Finally, C-index and Brier scores were
used to evaluate the robustness of the grouping model. Data
grouping was implemented using caret package of R language.
C-index refers to the proportion of the samples
whose predicted survival times are ordered correctly. A C-index
score of ~0.70 suggests that the model performs well, while a score
of ~0.50 suggests random background. In the present study, C-index
was calculated using survcomp package of R language (https://www.bioconductor.org/packages/release/bioc/html/survcomp.html)
(22).
Brier score is another scoring function to measure
the accuracy of probability prediction. It ranges between 0 and 1,
with a greater score indicating greater inaccuracy. In survival
analysis, Brier score measures the average difference between the
observed survival and the estimated survival over a given period of
time. Brier score was calculated using sbrier.score2proba function
of survcomp package.
Supervised classification
After determining the risk subgroups using K-means
clustering, RNAs and methylation features of the TCGA set were
analyzed using analysis of variance (ANOVA). Based on the ANOVA F
value, the top 75 RNAs and 75 methylation features that were most
relevant to the risk subgroups were selected, respectively, to
construct support vector machine (SVM) classifiers for predicting
the validation set. Additionally, C-index and Brier score values
were calculated.
The SVM classifiers were constructed using penalize
SVM package of R (https://cran.r-project.org/web/packages/penalizedSVM/index.html)
(23). The package used 5-fold CV to
perform a grid search for the optimal hyperparameters for the SVM
model and constructed SVM models.
Verification of the risk subgroups in
two independent datasets
In order to verify the robustness of the two risk
subgroups obtained from K-means clustering in predicting the
survival risk, two independent RNA-seq validation sets
(E-GEOD-53624 and E-GEOD-53625) were used. Firstly, the probes were
converted into the corresponding gene names according to the
platform probe annotation. When there were several probes for the
same RNA, the average eigenvalues of these probes was selected as
the eigenvalue of the RNA. Secondly, the common genes between the
TCGA set and the validation sets were selected, respectively.
Thirdly, the common genes were scaled twice via Median scale
normalization and Robust scale normalization, as follows:
Median absolute deviation (mad) is a robust
evaluation method for the variability of a univariate sample. For a
set of eigenvectors,
x=(x1,…,xn):mad(x)=median({|xi-median(x)|,xi∈x})Medianscalenormalization:xscaled=(x-median(x)).1mad(x)Robustscalenormalization:xwhitened={xi-mean25-75(xi)std25-75(xi),xi∈x}
Regarding robust scale normalization, the values
between 1/4 and 3/4 quantiles in the training set were used to
calculate the mean and the standard deviation of each gene feature.
This normalization method eliminated the effect of the outliers and
was helpful to calculate robust means and standard deviations.
The two normalizations were completed using R
software. Following the normalizations, the top 75 RNA features in
the training set were selected based on ANOVA F values and were
used to construct the SVM models. The risk subgroups in the
validation sets were predicted using the SVM model. Kaplan-Meier
survival curves of different risk subgroups were drawn, and C-index
and log-rank P-values were calculated.
Bioinformatics analysis
Differential expression analysis was performed
between the two risk subgroups of the TCGA set. For RNA-seq data of
the TCGA set, differentially expressed genes (DEGs) between the two
risk subgroups were analyzed using DESeq2 package of R (https://bioconductor.org/packages/release/bioc/html/DESeq2.html)
(24), and |logFC|>0.585 and an
FDR <0.05 were selected as the threshold values for identifying
significant DEGs. For methylation data of the TCGA set,
differential methylation genes (DMGs) between the two risk
subgroups were identified using moderate t-test test and limma
package of R (https://bioconductor.org/packages/release/bioc/html/limma.html)
(25), with |beta difference|>0.1
and an FDR<0.05 as the threshold for identifying significant
DMGs.
In order to obtain the functional pathways involving
the significant DEGs, Kyoto Encyclopedia of Genes and Genomes
(KEGG) pathway enrichment analysis was performed using KEGG
orthology-based annotation system (KOBAS) (26). An FDR <0.05 was selected as the
threshold for the significantly enriched pathways.
Statistical analysis
Firstly, the risk subgroups and clinical
characteristics of patients from the TCGA set were subjected to
univariate Cox regression to evaluate their associations with
survival. The significant variables with a log-rank P<0.05 were
then included in multivariate Cox regression analysis to identify
independent prognostic factors.
Results
Risk subgroups of ESCC
A total of 96 ESCC cases, including coupled RNA-seq
and DNA methylation data, were obtained from the TCGA database.
Following data preprocessing, 16,772 genes from RNA-seq and 20,112
genes from DNA methylation data were acquired. Early-fusion
autoencoder and joint multimodal representation framework were
constructed using sklearn library for deep learning of the
two-omics data, and 500 representation features were generated
using each of the two strategies. After filtering out the features
with a CV <0.1, the remaining features underwent univariate
Cox-PH analysis using OS data. The resulting representation
features significantly associated with OS (P<0.005) were used
for K-means clustering of all ESSC samples of the TCGA set. Two
risk subgroups (G1 and G2) were obtained using K-means clustering,
and the detailed grouping information of the TCGA set is shown in
Table SI. There were significant
differences in the OS time between G1 and G2 subgroups. The C-index
and log-rank P-value using joint multimodal representation strategy
were 0.760 and 8.40×10⁻⁴, respectively (Fig. 2A), while the two metrics using
early-fusion autoencoder strategy were 0.686 and
3.98×10⁻³, respectively (Fig.
2B). The results showed that joint multimodal representation
strategy was superior to early-fusion autoencoder strategy.
The two risk subgroups were
independent prognostic factors
In order to evaluate whether the two risk subgroups
obtained using the joint multimodal representation-based
classification model may be used as independent prognostic factors,
a univariate Cox regression model was used to analyze these risk
subgroups, as well as the clinical factors of patients. The risk
subgroup G2 was significantly associated with prognosis with a
hazard ratio (HR) of 3.465, a 95% CI of 1.618–7.421, and a
significant P-value of 1.38×10⁻³ (Table II). Pathologic_N, stage, sex,
additional pharmaceutical therapy and additional radiation therapy
were significantly associated with prognosis, with P-values of
6.03×10⁻³, 1.07×10⁻³, 4.53×10⁻³,
4.25×10⁻² and 3.16×10⁻², respectively
(Table II). Furthermore, in
multivariate Cox regression analysis, only the risk subgroup G2 was
found to be an independent predictor of prognosis (HR=2.469, 95%
CI=1.061–5.747, P-value=3.60×10⁻², Table II), indicating that the risk
subgroup G2 was a significant prognostic factor independent of
pathologic_N, stage, sex, additional pharmaceutical and radiation
therapy.
| Table II.Univariate and multivariate cox
regression analysis of clinical factors in two risk subgroups. |
Table II.
Univariate and multivariate cox
regression analysis of clinical factors in two risk subgroups.
|
| Univariate | Multivariate |
|---|
|
|
|
|
|---|
| Clinical
features | HR | 95% CI | Z | P-value | HR | 95% CI | Z | P-value |
|---|
| Group |
|
|
|
8.40×10⁻⁴ |
|
|
|
|
| G1 | 1.000 | – | – | – | 1.000 | – | – | – |
| G2 | 3.465 | 1.618–7.421 | 3.198 |
1.38×10⁻³ | 2.469 | 1.061–5.747 | 2.097 | 0.036 |
| Pathological N |
|
|
|
6.03×10⁻³ |
|
|
|
|
| N0 | 0.217 | 0.091–0.519 | −3.434 |
5.95×10⁻⁴ | 0.682 | 0.200–2.326 | −0.611 | 0.541 |
| N1 | 0.339 | 0.135–0.851 | −2.304 |
2.12×10⁻² | 0.549 | 0.183–1.652 | −1.066 | 0.286 |
| Stage |
|
|
|
1.07×10⁻³ |
|
|
|
|
|
I+II | 0.067 | 0.018–0.248 | −4.052 |
5.08×10⁻⁵ | 0.171 | 0.028–1.034 | −1.923 | 0.055 |
|
III++IV | 0.160 | 0.043–0.593 | −2.745 |
6.00×10⁻³ | 0.221 | 0.042–1.163 | −1.782 | 0.075 |
| Sex |
|
|
|
4.53×10⁻³ |
|
|
|
|
|
Female | 1.000 | – | – | – | 1.000 | – | – | – |
|
Male | 5.365 | 1.246–23.094 | 2.256 |
2.41×10⁻² | 4.704 | 0.991–22.322 | 1.949 | 0.051 |
| Additional
pharmaceutical therapy |
|
|
|
4.25×10⁻² |
|
|
|
|
| No | 1.017 | 0.348–2.977 | 0.031 | 0.975 | 0.471 | 0-Inf | 0.000 | 1.000 |
|
Yes | 0.000 | 0.000-Inf | −0.004 | 0.997 | 0.000 | 0-Inf | −0.001 | 0.999 |
| Additional
radiation therapy |
|
|
|
3.16×10⁻² |
|
|
|
|
| No | 0.979 | 0.34–2.822 | −0.038 | 0.969 | 2.805 | 0-Inf | 0.000 | 1.000 |
|
Yes | 0.000 | 0.000-Inf | −0.004 | 0.997 | 0.000 | 0-Inf | −0.001 | 1.000 |
Robustness evaluation of the two risk
subgroups
The robustness of the two risk subgroups obtained
using the joint multimodal representation-based model was evaluated
using an SVM classification model, which was built with the two
risk subgroups as labels using a CV procedure. The 96 TCGA samples
were split into 10 combinations of training and test sets (60/40%).
The geometric means of the C-indexes and Brier scores were
0.77±0.04 and 0.13±0.03 for the training set, and 0.75±0.06 and
0.14±0.04 for the test set, respectively (Table III).
| Table III.C-index and Brier score of the SVM
classifier for robustness evaluation of the risk subgroups using CV
procedure. |
Table III.
C-index and Brier score of the SVM
classifier for robustness evaluation of the risk subgroups using CV
procedure.
| Dataset | 10-fold cv | C-index | Brier score |
|---|
| Training | JMR (60%) | 0.77±0.04 | 0.13±0.03 |
|
| Methylation
only | 0.72±0.10 | 0.14±0.03 |
|
| RNA only | 0.74±0.05 | 0.13±0.03 |
| Test | JMR (40%) | 0.75±0.06 | 0.14±0.04 |
|
| Methylation
only | 0.65±0.17 | 0.16±0.05 |
|
| RNA only | 0.73±0.11 | 0.14±0.04 |
Regarding single-omics data, the performance of the
two-omics model was also good. According to the ANOVA F values, the
top 75 RNAs (Table SII) and the top
75 methylation genes (Table SIII)
were selected to construct the SVM classification model,
respectively. Using methylation data only, the training set
generated a C-index of 0.72±0.10 and a Brier score of 0.14±0.03,
while the test set achieved a C-index of 0.65±0.17 and a Brier
score of 0.16±0.05 (Table III).
Using RNA-seq data only, the C-index and Brier score of the
training set were 0.74±0.05 and 0.13±0.03, while the two metrics of
the test set were 0.73±0.11 and 0.14±0.04, respectively (Table III). These results showed that our
classification model had good robustness to predict the survival
subgroups.
Validation of the two risk subgroups
in two independent RNA-seq datasets
The joint multimodal representation-based
classification model on two independent datasets of RNA-seq data
(E-GEOD-53624 and E-GEOD-53625), which had 119 and 179 samples,
respectively, was validated. There were 5,776 and 5,776 common RNAs
between the two independent validation datasets with the TCGA set,
respectively. According to the results of risk subgroup
classification and ANOVA F values, the top 75 genes from the common
RNAs were screened to construct an SVM model and to predict the two
independent datasets.
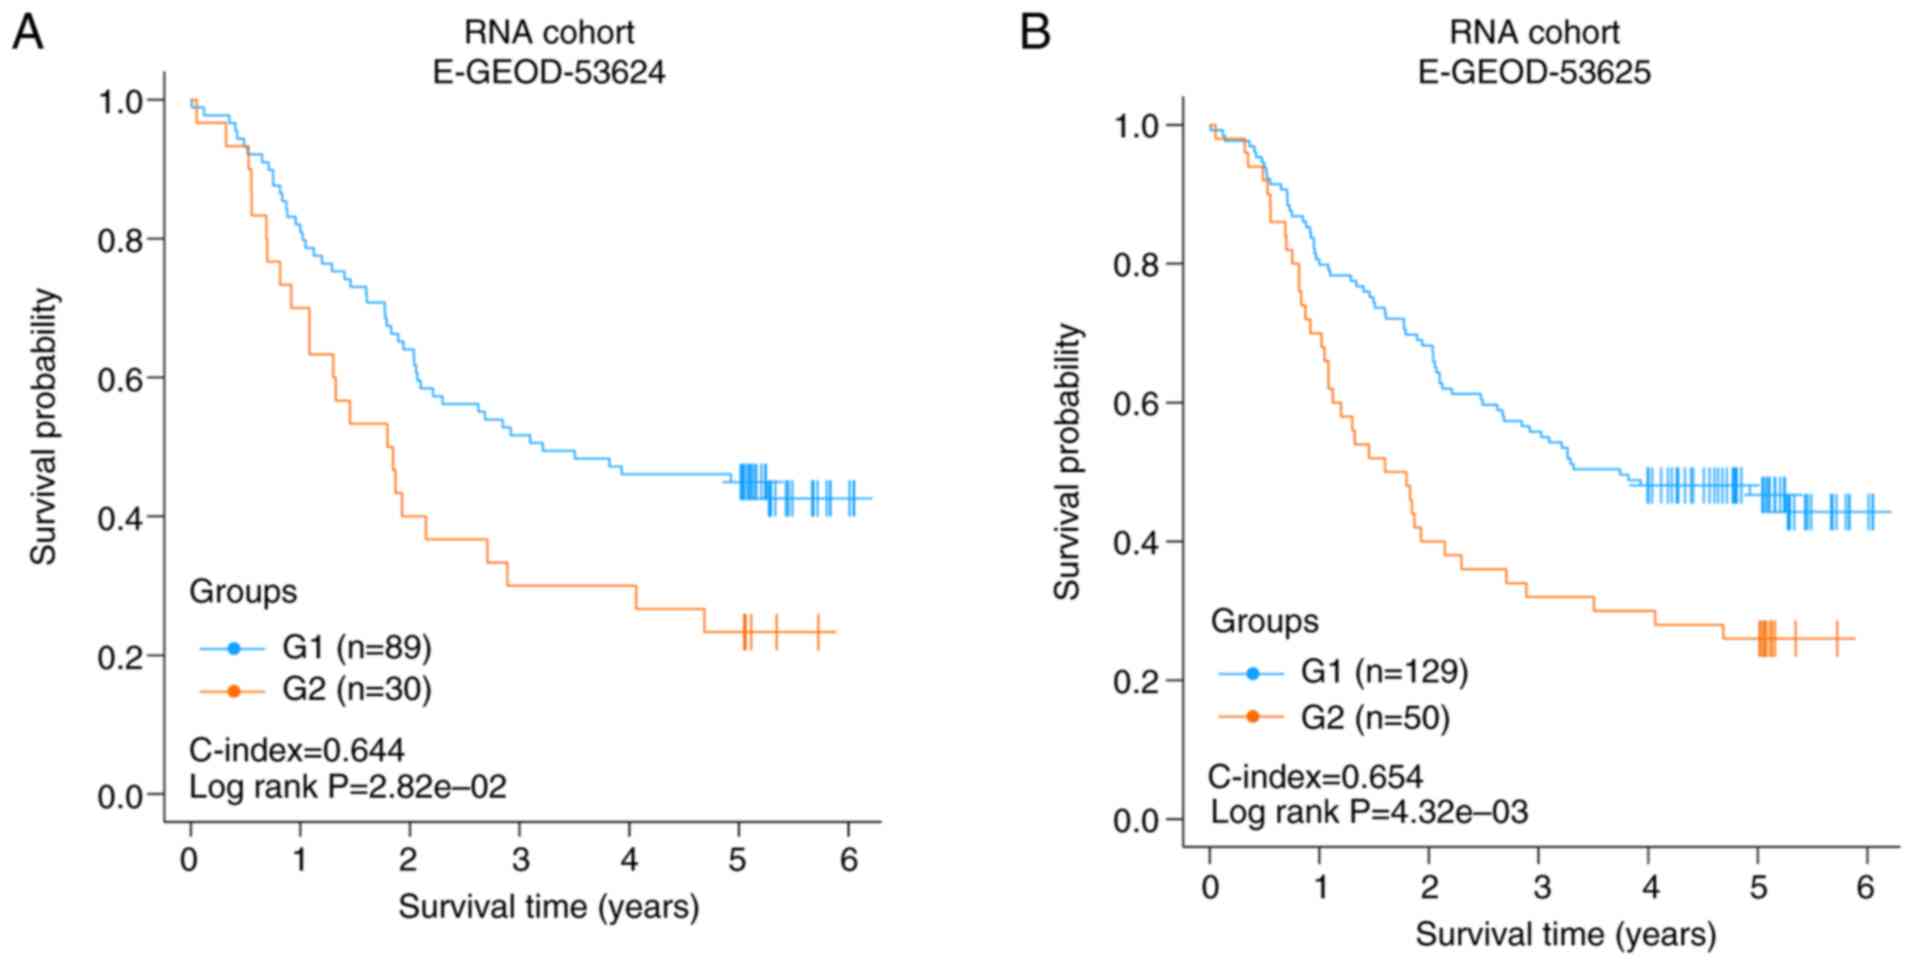
Each validation set was divided into two risk
subgroups using the SVM model. In E-GEOD-53624 or E-GEOD-53625, the
two risk groups had a significantly different OS time
(C-index=0.644, log rank P-value=2.82×10⁻², Fig. 3A; C-index=0.654, log rank
P-value=4.32×10⁻³, Fig.
3B). The results of the two independent validation sets
suggested that the two risk subgroups obtained using the joint
multimodal representation-based model had good stability.
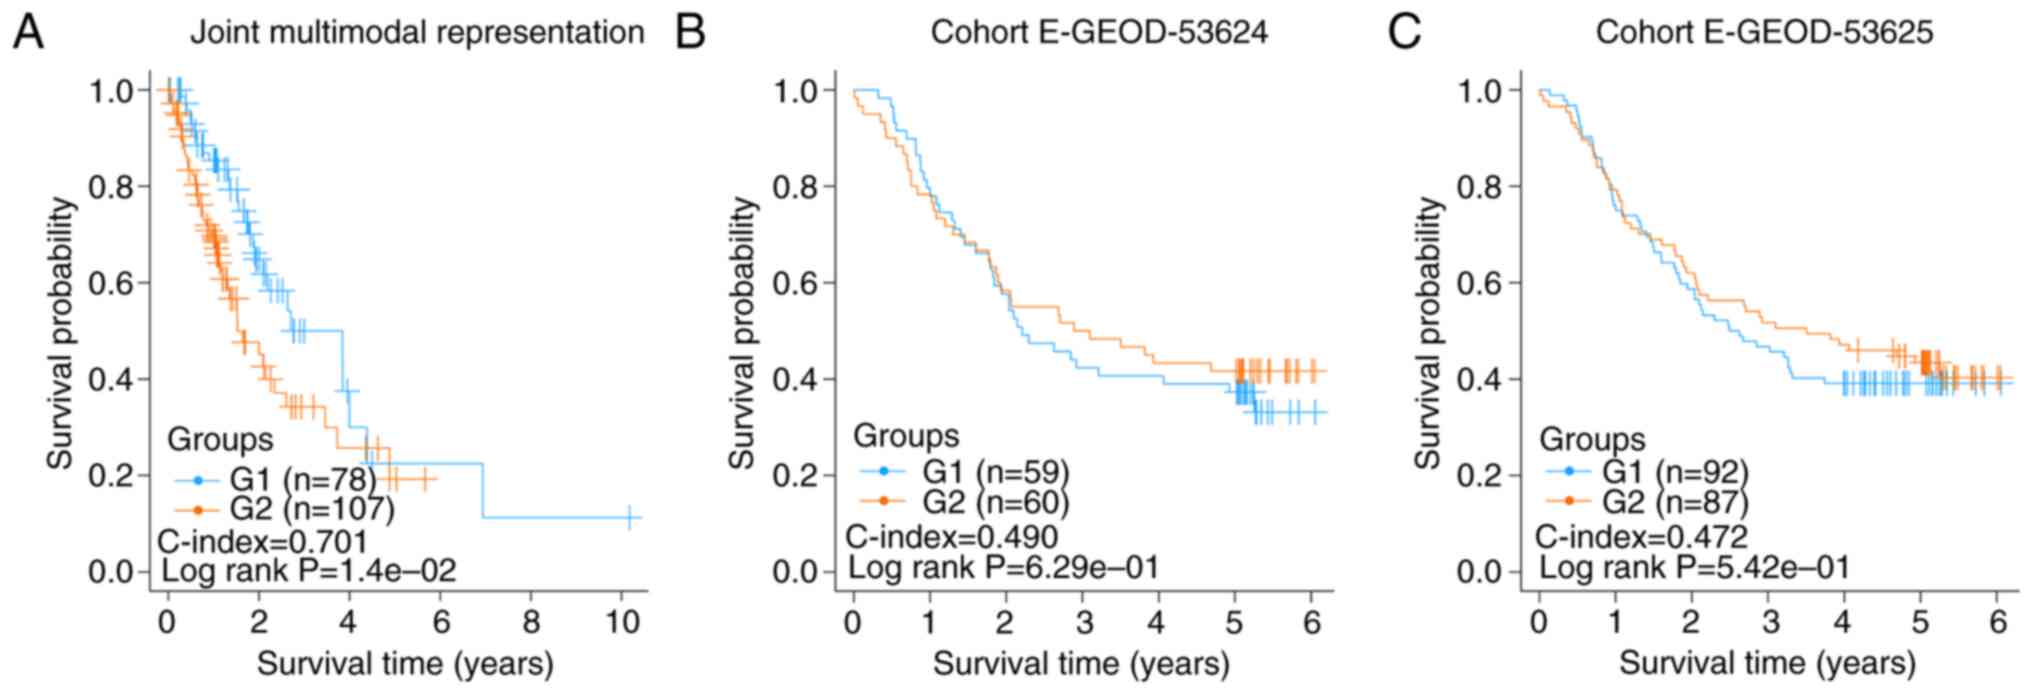
Failed validation of the two risk
subgroups of esophageal cancer samples
A total of 185 esophageal cancer samples with OS
information were downloaded from TCGA database. From the RNA-seq
and DNA methylation data of these samples, 500 representation
features were produced using the autoencoder based on joint
multimodal representation strategy. Consequently, two risk
subgroups (G1a and G2) were obtained using the same procedure as
described earlier. The C-index and log-rank P-value were 0.701 and
1.40×10⁻², respectively (Fig.
4A).
Similarly, according to the results of the risk
subgroups classification and ANOVA F values, the top 75 genes were
screened to construct SVM models and predict in E-GEOD-53624 and
E-GEOD-53625 datasets using the aforementioned procedure. The
C-index and log-rank P-value of E-GEOD-53624 were 0.490 and
6.29×10⁻¹, respectively (Fig.
4B), and those of E-GEOD-53625 were 0.472 and
5.42×10⁻¹, respectively (Fig.
4C). These insignificant results showed that the two risk
subgroups of the esophageal cancer samples could not be
successfully verified in E-GEOD-53624 and E-GEOD-53625, indicating
that the risk factors of esophageal adenocarcinoma and ESCC may be
different.
Bioinformatics analysis of the risk
subgroups in TCGA ESCC samples
Differential gene expression between the risk
subgroup G1 and G2 of the TCGA set was analyzed using DESeq2
package of R software, and the genes with |logFC|>0.585 and an
FDR<0.05 were considered significant. A total of 1,107 DEGs were
screened out, consisting of 773 upregulated and 334 downregulated
genes in the risk subgroup G2. Their detailed information is
presented in Table SIV. The top 10
genes, including PIWIL2, ZFP57, GPR77, MUC5B, DCC, MUC6,
ADAMTS18, FIBCD1, ANXA10 and ABCC2, are presented in
Fig. 5A. The significant DMGs
between the two subgroups were analyzed using limma package and
moderate t-test test. An FDR <0.05 and |delta
methylation|>0.1 were selected as the threshold values of
significance. A total of 199 DMGs, including 195 upregulated and 4
downregulated DMGs were screened out and their detailed information
are presented in Table SV. The top
10 DMGs were comprised of ELSPBP1_promoter, REG3G_promoter,
PWRN1_promoter, REG1P_promoter, MIR1468_promoter, OR10W1_promoter,
OR9I1_promoter, OR2L2_promoter, OR2M4_promoter and OR2L8_promoter
and are presented in Fig. 5B.
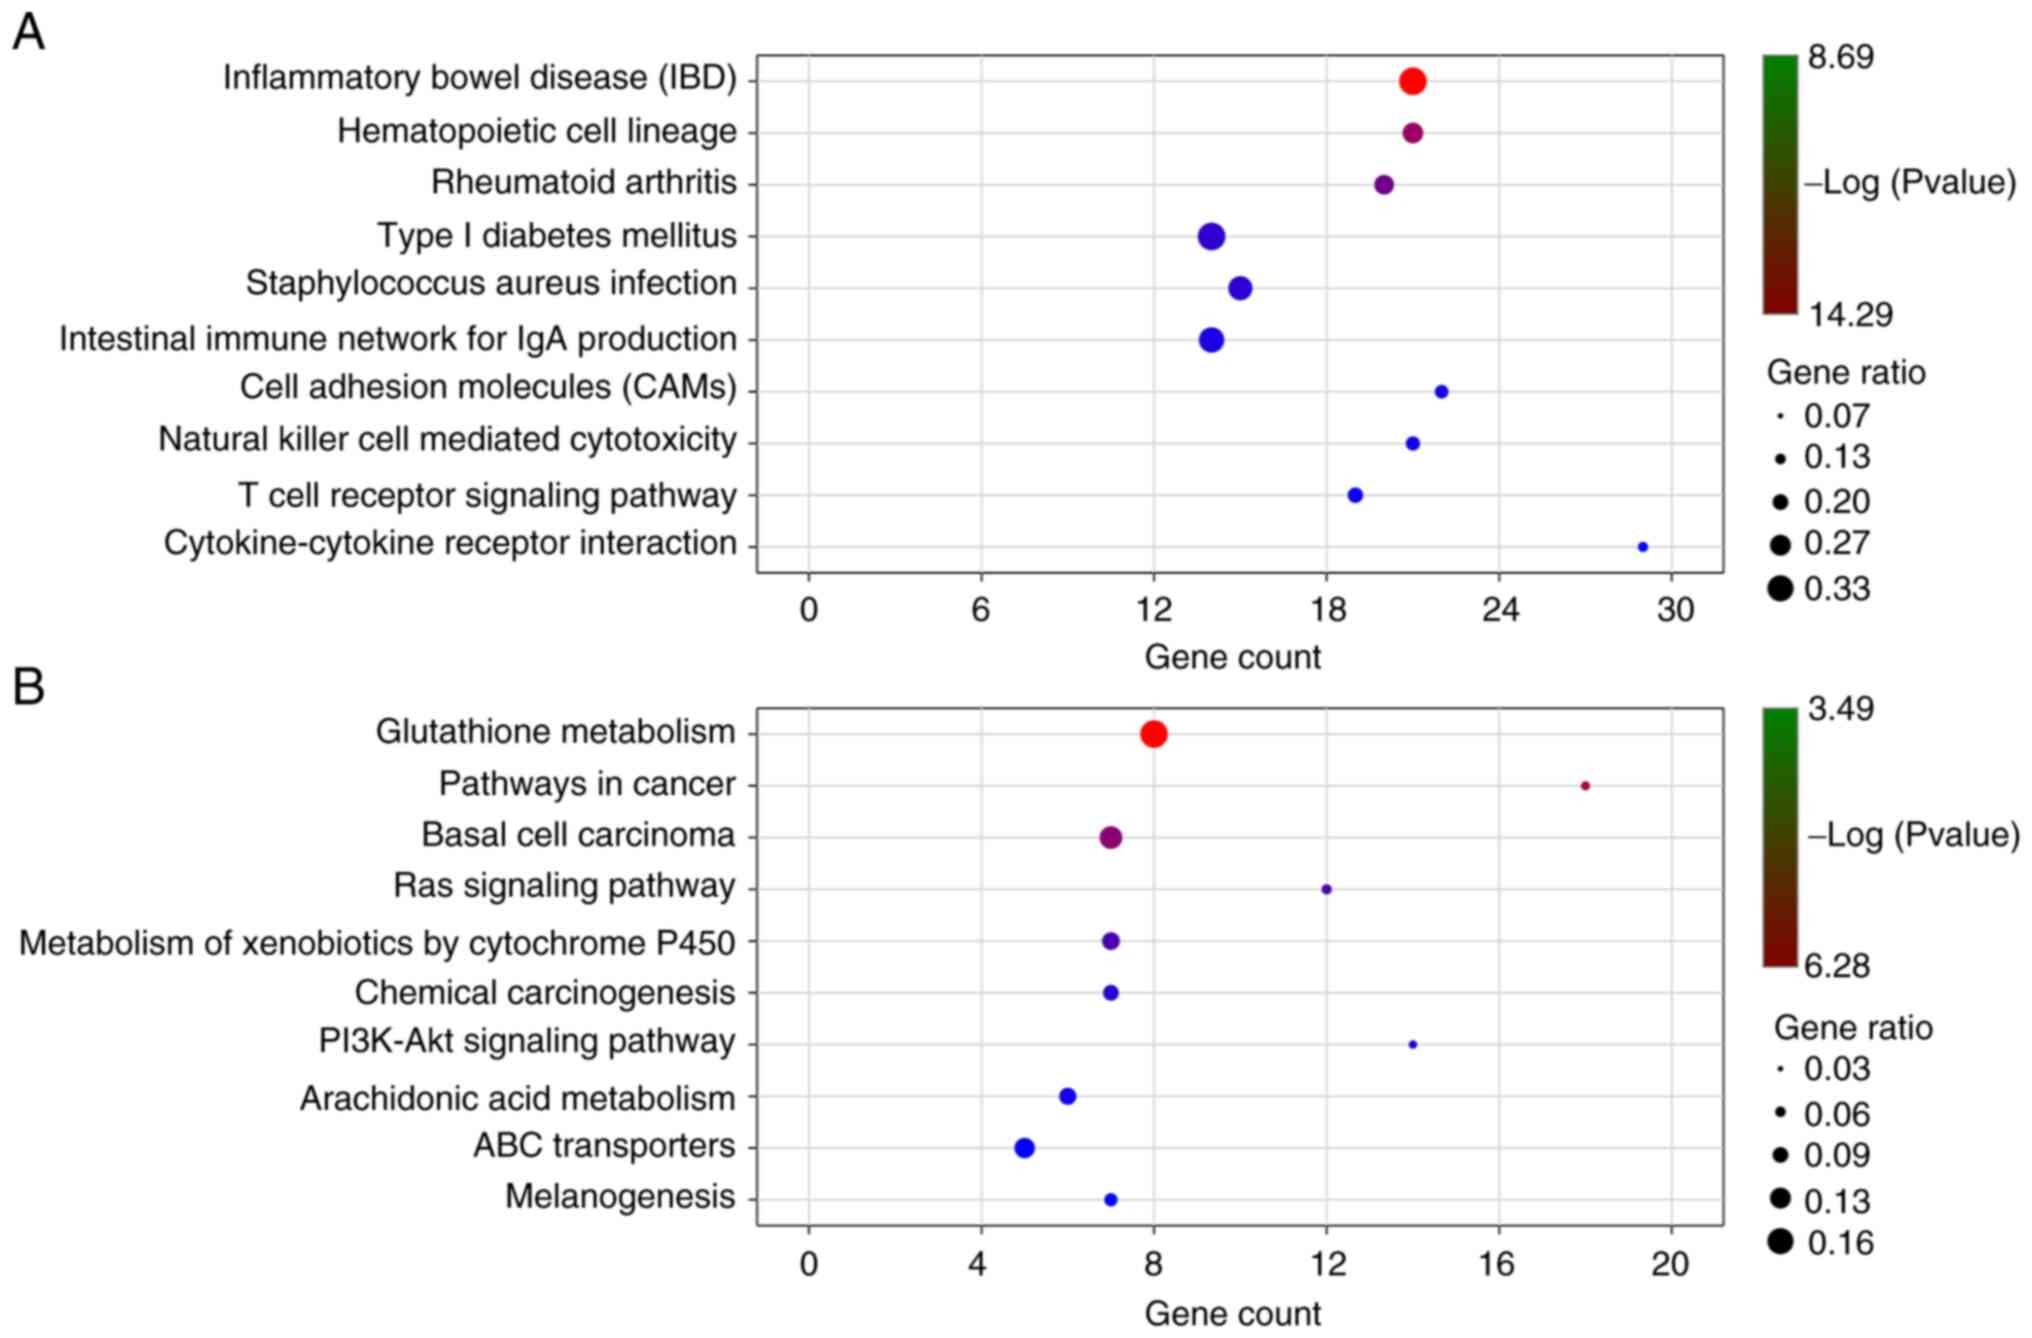
KEGG enrichment pathways of the significant DEGs
were analyzed with a P-value <0.05 using KOBAS. There were 46
significant pathways for the upregulated DEGs (Fig. 6A and Table SVI) and 24 significant pathways for
the downregulated DEGs (Fig. 6B and
Table SVII), including
cytokine-cytokine receptor interaction, cell adhesion molecules
(CAMs) cAMP signaling pathway, PPAR signaling pathway, pathways in
cancer, basal cell carcinoma, Ras signaling pathway,
PI3K-Akt signaling pathway, transcriptional
misregulation in cancer, mTOR signaling pathway and ECM-receptor
interaction.
Discussion
It is important to identify the risk factors
significantly associated with prognosis and to search for novel
effective diagnostic modalities for early-stage ESCC. In recent
years, cancer has been widely accepted as a genetic disease, and
aberrant expression of various mRNAs and aberrant promoter island
methylation of tumor suppressor genes have been considered as the
common epigenetic mechanisms underlying the pathogenesis of ESCC
(6,27,28). Due
to the rapid development of bioinformatics, multi-omics data,
including whole genome gene expression and methylation, are
increasingly used in cancer research (17). In the present study, a large quantity
of RNA-seq and methylation data of patients with ESCC and their
clinical information was integrated to screen gene features for the
following construction of an Autoencoder framework.
Autoencoder is a complex three-layer neural network,
which may reconstruct multi-omics data to generate new features,
and has achieved good performance in various fields (29). So far, an autoencoder-based model has
been reported to be efficient and accurate in predicting the
prognosis of multiple cancer types, using RNA-seq data (30). In the present study, two different
strategies were used to construct an autoencoder, and the joint
multimodal representation strategy was better than the early fusion
autoencoder strategy. This was consistent with a previous study, in
which it was believed that the joint multimodal representation
strategy may alleviate the problems associated with the fusion of
original data (31). The present
study identified two risk subgroups of ESCC with significantly
different survival by using the joint multimodal
representation-based classification model. Wang et al
determined and validated two molecular subtypes of ESCC by using
consensus clustering, which have different functional implications,
yet are not significantly different regarding OS time (32). Through comprehensive but analysis
based on iCluster, three molecular subtypes of ESCC displaying a
geographical trend were obtained, but the survival difference was
not studied (33). Liu et al
reported the identification of 3 subtypes possessing different
clinical features, genomic complexity, p53 mutational status, and
RNA expression; however they did not focus on survival comparison
of the different subtypes (34). In
contrast to these studies on the molecular subtypes of ESCC, the
results of the present study may aid in improving the prognosis of
patients with ESCC. Furthermore, risk subgroup G2 may be an
independent prognostic factor for patients with ESCC. However, the
obtained risk subgroups based on data of all esophageal cancer
samples could not be verified in two independent validation sets,
indicating that the risk factors of ESCC may be different from
those of esophageal adenocarcinoma. As the accuracy of the
autoencoder-based DL model in risk stratification of patients is
significantly superior to that of similarity network (16), in the present study, an SVM model was
constructed and it was proved that the present risk subgroup
classification had good robustness and stability. The present
autoencoder-based DL model may be helpful for cancer detection
using gene expression data, and these highly interactive genes may
be useful cancer biomarkers for the detection of ESCC, which
requires further study.
In the present study, the differential expression
between risk subgroups G1 and G2 of the TCGA set was analyzed, and
1,107 DEGs and 199 DMGs were screened out in the risk subgroup G2.
Furthermore, KEGG enrichment pathways of the significant DEGs were
analyzed. A total of 46 enrichment pathways, including
cytokine-cytokine receptor interaction, cell adhesion molecules
(CAMs), cAMP signaling pathway, and PPAR signaling pathway were
identified for the upregulated DEGs, and 24 enrichment pathways,
including pathways in cancer, basal cell carcinoma, Ras signaling
pathway, PI3K-Akt signaling pathway, transcriptional
misregulation in cancer, mTOR signaling pathway and ECM-receptor
interaction were identified for the downregulated DEGs. The
majority of these KEGG pathways are correlated with metastasis and
proliferation of various cancer types, and may be important
predictors (35–38). The results of the present study
provided candidate genes for further functional research.
It should be noted that the present study is an
extensive bioinformatics study based on published data. These
results require further validation using in vitro or in
vivo models. A TCGA study suggests that race is an important
clinical factor for subtyping in esophageal cancer (33). Therefore, it is necessary to verify
the obtained two risk subgroups of ESCC in different races in
future studies.
In the present study, a joint multimodal
representation strategy-based classification model that is able to
robustly discriminate two subgroups of patients with ESCC with
significantly different OS time was developed. Several cancer
metastasis- and proliferation-related pathways were identified.
This study provides more insights into the underlying molecular
mechanisms of ESCC progression. Further studies are demanded to
validate the feasibility of this prognostic model.
Supplementary Material
Supporting Data
Acknowledgements
Not applicable.
Funding
The present study was supported by the Project of
Jiang-su Province Health and Family (grant no. H2017035) and the
Social Development Project of Jiangsu Provincial Science and
Technology Department (grant no. BE2017759).
Availability of data and materials
All data used and/or analyzed in this study are
available from the TCGA database (https://gdc-portal.nci.nih.gov/) or the EBI Array
database (https://www.ebi.ac.uk/arrayexpress/).
Authors' contributions
JH and QZ designed the study. JY, XW, ML, YZ, XZ, JL
and MZ performed all the statistical analyses. JY and XW finished
the manuscript. All authors read and approved the final
manuscript.
Ethics approval and consent to
participate
Not applicable.
Patient consent for publication
Not applicable.
Competing interests
The authors declare that they have no competing
interests.
References
|
1
|
Lin DC, Wang MR and Koeffler HP: Genomic
and epigenomic aberrations in esophageal squamous cell carcinoma
and implications for patients. Gastroenterology. 154:374–389. 2018.
View Article : Google Scholar : PubMed/NCBI
|
|
2
|
Zhao J, He YT, Zheng RS, Zhang SW and Chen
WQ: Analysis of esophageal cancer time trends in China, 1989–2008.
Asian Pac J Cancer Prev. 13:4613–4617. 2012. View Article : Google Scholar : PubMed/NCBI
|
|
3
|
Liang H, Fan JH and Qiao YL: Epidemiology,
etiology, and prevention of esophageal squamous cell carcinoma in
China. Cancer Biol Med. 14:33–41. 2017. View Article : Google Scholar : PubMed/NCBI
|
|
4
|
Wang GQ, Jiao GG, Chang FB, Fang WH, Song
JX, Lu N, Lin DM, Xie YQ and Yang L: Long-term results of operation
for 420 patients with early squamous cell esophageal carcinoma
discovered by screening. Ann Thorac Surg. 77:1740–1744. 2004.
View Article : Google Scholar : PubMed/NCBI
|
|
5
|
Abnet CC, Arnold M and Wei WQ:
Epidemiology of esophageal squamous cell carcinoma.
Gastroenterology. 154:360–373. 2018. View Article : Google Scholar : PubMed/NCBI
|
|
6
|
Gao YB, Chen ZL, Li JG, Hu XD, Shi XJ, Sun
ZM, Zhang F, Zhao ZR, Li ZT, Liu ZY, et al: Genetic landscape of
esophageal squamous cell carcinoma. Nat Genet. 46:1097–1102. 2014.
View Article : Google Scholar : PubMed/NCBI
|
|
7
|
Baylin SB: DNA methylation and gene
silencing in cancer. Nat Clin Pract Oncol. 2 (Suppl 1):S4–S11.
2005. View Article : Google Scholar : PubMed/NCBI
|
|
8
|
Yamada N, Yasui K, Dohi O, Gen Y, Tomie A,
Kitaichi T, Iwai N, Mitsuyoshi H, Sumida Y, Moriguchi M, et al:
Genome-wide DNA methylation analysis in hepatocellular carcinoma.
Oncol Rep. 35:2228–2236. 2016. View Article : Google Scholar : PubMed/NCBI
|
|
9
|
Riley RD, Hayden JA, Steyerberg EW, Moons
KG, Abrams K, Kyzas PA, Malats N, Briggs A, Schroter S, Altman DG,
et al: Prognosis research strategy (PROGRESS) 2: Prognostic factor
research. PLoS Med. 10:e10013802013. View Article : Google Scholar : PubMed/NCBI
|
|
10
|
Iida M, Ikeda F, Hata J, Hirakawa Y, Ohara
T, Mukai N, Yoshida D, Yonemoto K, Esaki M, Kitazono T, et al:
Development and validation of a risk assessment tool for gastric
cancer in a general Japanese population. Gastric Cancer.
21:383–390. 2018. View Article : Google Scholar : PubMed/NCBI
|
|
11
|
Pavlou M, Ambler G, Seaman SR, Guttmann O,
Elliott P, King M and Omar RZ: How to develop a more accurate risk
prediction model when there are few events. BMJ. 351:h38682015.
View Article : Google Scholar : PubMed/NCBI
|
|
12
|
Hoffman MM, Ernst J, Wilder SP, Kundaje A,
Harris RS, Libbrecht M, Giardine B, Ellenbogen PM, Bilmes JA,
Birney E, et al: Integrative annotation of chromatin elements from
ENCODE data. Nucleic Acids Res. 41:827–841. 2013. View Article : Google Scholar : PubMed/NCBI
|
|
13
|
Bengio Y: Learning Deep Architectures for
AI. Foundations and Trends® in Machine Learning, 2009.
simplehttps://doi.org/10.1561/2200000006
|
|
14
|
Papazafeiropoulos G, Vu QV, Truong VH,
Luong MC and Pham VT: Prediction of buckling coefficient of
stiffened plate girders using deep learning algorithm. CIGOS 2019,
Innovation for Sustainable Infrastructure Springer. Ha-Minh C, Dao
D, Benboudjema F, Derrible S, Huynh D and Tang A: Lecture Notes in
Civil Engineering. Vol 54. Springer; Singapore: simplehttps://doi.org/10.1007/978-981-15-0802-8_183
|
|
15
|
Chaudhary K, Poirion OB, Lu L and Garmire
LX: Deep learning-based multi-omics integration robustly predicts
survival in liver cancer. Clin Cancer Res. 24:1248–1259. 2018.
View Article : Google Scholar : PubMed/NCBI
|
|
16
|
Poirion OB, Chaudhary K, Huang S and
Garmire LX: Multi-omics-based pan-cancer prognosis prediction using
an ensemble of deep-learning and machine-learning models. medRxiv.
doi: https://doi.org/10.1101/19010082.
|
|
17
|
Xie G, Dong C, Kong Y, Zhong JF, Li M and
Wang K: Group lasso regularized deep learning for cancer prognosis
from multi-omics and clinical features. Genes (Basel). 10:2402019.
View Article : Google Scholar
|
|
18
|
Lu T, Chen D, Wang Y, Sun X, Li S, Miao S,
Wo Y, Dong Y, Leng X, Du W and Jiao W: Identification of DNA
methylation-driven genes in esophageal squamous cell carcinoma: A
study based on the cancer genome atlas. Cancer Cell Int. 19:522019.
View Article : Google Scholar : PubMed/NCBI
|
|
19
|
Hansen KD:
IlluminaHumanMethylation450kanno. ilmn12. hg19: Annotation for
illumina's 450k methylation arrays. R package version 0.2 12016.
doi:
10.18129/B9.bioc.IlluminaHumanMethylation450kanno.ilmn12.hg19.
|
|
20
|
Hastie T, Tibshirani R, Narasimhan B and
Chu G: Impute: Impute: Imputation for microarray data. R package
version. 2019.
|
|
21
|
Malika C, Ghazzali N, Boiteau V and
Niknafs A: NbClust: An R package for determining the relevant
number of clusters in a data set. J Stat Software. 61:1–36.
2014.
|
|
22
|
Schröder MS, Culhane AC, Quackenbush J and
Haibe-Kains B: Survcomp: An R/Bioconductor package for performance
assessment and comparison of survival models. Bioinformatics.
27:3206–3208. 2011. View Article : Google Scholar : PubMed/NCBI
|
|
23
|
Becker N, Werft W, Toedt G, Lichter P and
Benner A: PenalizedSVM: A R-package for feature selection SVM
classification. Bioinformatics. 25:1711–1712. 2009. View Article : Google Scholar : PubMed/NCBI
|
|
24
|
Love MI, Huber W and Anders S: Moderated
estimation of fold change and dispersion for RNA-seq data with
DESeq2. Genome Biol. 15:5502014. View Article : Google Scholar : PubMed/NCBI
|
|
25
|
Ritchie ME, Phipson B, Wu D, Hu Y, Law CW,
Shi W and Smyth GK: limma powers differential expression analyses
for RNA-sequencing and microarray studies. Nucleic Acids Res.
43:e472015. View Article : Google Scholar : PubMed/NCBI
|
|
26
|
Brembilla-Perrot B, de la Chaise Terrier
A, Skeik L, Cherrier F and Pernot C: Factors predicting the
response to an antiarrhythmic during an electrophysiologic study
for ventricular tachycardia. Arch Mal Coeur Vaiss. 80:1497–1503.
1987.(In French). PubMed/NCBI
|
|
27
|
Chen J, Kwong DL, Cao T, Hu Q, Zhang L,
Ming X, Chen J, Fu L and Guan X: Esophageal squamous cell carcinoma
(ESCC): Advance in genomics and molecular genetics. Dis Esophagus.
28:84–89. 2015. View Article : Google Scholar : PubMed/NCBI
|
|
28
|
Song G, Xu J, He L, Sun X, Xiong R, Luo Y,
Hu X, Zhang R, Yue Q, Liu K and Feng G: Systematic profiling
identifies PDLIM2 as a novel prognostic predictor for oesophageal
squamous cell carcinoma (ESCC). J Cell Mol Med. 23:5751–5761. 2019.
View Article : Google Scholar : PubMed/NCBI
|
|
29
|
Wang Y, Yao H and Zhao S: Auto-encoder
based dimensionality reduction. Neurocomputing. 184:232–242. 2016.
View Article : Google Scholar
|
|
30
|
Xiao Y, Wu J, Lin Z and Zhao X: A
semi-supervised deep learning method based on stacked sparse
auto-encoder for cancer prediction using RNA-seq data. Comput
Methods Programs Biomed. 166:99–105. 2018. View Article : Google Scholar : PubMed/NCBI
|
|
31
|
Qiao Y, Luo X, Li C, Tian H and Ma J:
Heterogeneous graph-based joint representation learning for users
and POIs in location-based social network. Information Processing
Management. 57:1021512020. View Article : Google Scholar
|
|
32
|
Wang F, Yan Z, Lv J, Xin J, Dang Y, Sun X,
An Y, Qi Y, Jiang Q, Zhu W, et al: Gene expression profiling
reveals distinct molecular subtypes of esophageal squamous cell
carcinoma in Asian populations. Neoplasia. 21:571–581. 2019.
View Article : Google Scholar : PubMed/NCBI
|
|
33
|
Cancer Genome Atlas Research Network;
Analysis Working Group: Asan University; BC Cancer Agency; Brigham
and Women's Hospital; Broad Institute; Brown University; Case
Western Reserve University; Dana-Farber Cancer Institute; Duke
University, et al, . Integrated genomic characterization of
oesophageal carcinoma. Nature. 541:169–174. 2017. View Article : Google Scholar : PubMed/NCBI
|
|
34
|
Liu W, Snell JM, Jeck WR, Hoadley KA,
Wilkerson MD, Parker JS, Patel N, Mlombe YB, Mulima G, Liomba NG,
et al: Subtyping sub-saharan esophageal squamous cell carcinoma by
comprehensive molecular analysis. JCI Insight. 1:e887552016.
View Article : Google Scholar : PubMed/NCBI
|
|
35
|
Albelda S: Role of integrins and other
cell adhesion molecules in tumor progression and metastasis. Lab
Invest. 68:4–17. 1993.PubMed/NCBI
|
|
36
|
Chen YZ, Xue JY, Chen CM, Yang BL, Xu QH,
Wu F, Liu F, Ye X, Meng X, Liu GY, et al: PPAR signaling pathway
may be an important predictor of breast cancer response to
neoadjuvant chemotherapy. Cancer Chemother Pharmacol. 70:637–644.
2012. View Article : Google Scholar : PubMed/NCBI
|
|
37
|
Dong C, Wang X, Xu H, Zhan X, Ren H, Liu
Z, Liu G and Liu L: Identification of a cytokine-cytokine receptor
interaction gene signature for predicting clinical outcomes in
patients with colorectal cancer. Int J Clin Exp Med. 10:9009–9018.
2017.
|
|
38
|
Ertel A, Verghese A, Byers SW, Ochs M and
Tozeren A: Pathway-specific differences between tumor cell lines
and normal and tumor tissue cells. Mol Cancer. 5:552006. View Article : Google Scholar : PubMed/NCBI
|