Introduction
The latest epidemiological data in 2018 showed that
lung cancer had the highest incidence rate among all malignancies
in China, with ~781,000 cases recorded annually (1). Lung cancer includes a variety of tumor
entities, with non-small cell lung cancer (NSCLC) being the most
common. More specifically, the histological types of NSCLC include
adenocarcinoma, squamous cell carcinoma and large cell carcinoma,
which have distinct pathological and clinical features (2). The 5-year survival time of patients
with NSCLC at stage IIIB/IV was only ~15% in the United States in
2010, revealing the urgent demand for a new and improved
therapeutic approach, as well as biomarkers for prognosis
prediction (2). During the last
decade, progress has been made in the treatment of adenocarcinoma
following the discovery of epidermal growth factor receptor (EGFR)
(3). Tyrosine kinase inhibitors
(TKIs), targeting EGFR and its downstream signaling proteins, have
changed conventional chemotherapy and radiotherapy towards the
development of targeted therapy in lung cancer (3). Except for alterations in EGFR, KRAS
oncogene mutations and MET gene amplification have also been shown
to play an important role in the progression of lung cancer, and
have contributed to the development of biomarker and targeted
therapy (4). Despite the
improvements in targeted therapy for lung cancer, certain subgroups
of patients with lung cancer show little response to targeted
therapy, leading to a 5-year survival rate of <20% (3). Therefore, a comprehensive understanding
of molecular targets and the development of new biomarkers are
necessary for the improvement of therapeutic approaches for
NSCLC.
Bioinformatics is an efficient and convenient
approach, that connects certain genes with the biological behavior
and clinical outcomes of different tumors (5). For example, Oncomine is a tumor gene
chip-based database, that integrates RNA and DNA-sequencing data
from multiple databases and published literature, covering 65 gene
chip datasets, 4,700 chips and 480 million gene expression data
(6). Oncomine can also perform
co-expression analysis to show which genes in the dataset are
similarly expressed to the selected target gene and provide
correlation values. It can identify an oncogene expression profile,
where high gene expression is found in a fraction of samples in the
total population within a cancer type, using Cancer Outlier Profile
Analysis. This database can also be used to analyze the mRNA
expression level of target genes in different tumors and enable
comparisons with non-tumor tissues. Furthermore, the setup of the
analysis can be specified to important clinical annotations,
including secreted proteins, kinases, membrane proteins and known
molecular drug targets, which facilitate the discovery of new
biomarkers and therapeutic targets (6). Oncomine also provides access to
important clinical parameters, such as tumor size, tumor cell
differentiation, metastasis and survival time (6). In addition to the Oncomine database,
the Kaplan-Meier survival analysis database integrates gene
expression data with clinical information, in particular survival
data (7). The tumor types included
in this database mainly include lung, breast, gastric and cervical
cancer (7). The database also
provides an appropriate grouping of patients, according to the
expression level of a specific gene, which enables the association
of the specific gene with patient survival time (7). MicroRNAs (miRNAs/miRs) are small RNAs,
that play an important role in tumorigenesis, development and
survival (8,9). The OncomiR website is an online
resource that contains information on miRNA research associated
with >30 different cancer types, and provides tools for the
identification and validation of miRNAs without the requirement for
a professional computer language foundation (10). The tumor database contains
miRNA-Sequencing (Seq) and RNA-Seq information and clinical data
from nearly 10,000 patients with cancer, and enables connections
with tumor development, staging and overall survival (OS) time
(10). Bioinformatics analysis based
on the online databases described enables the identification of
potential molecular targets in NSCLC tumorigenesis.
E2F transcription factor (E2F) proteins are defined
as a family of transcription regulators, that are involved in
numerous cellular processes, such as cell cycle progression, DNA
replication, DNA repair and apoptosis (11). Different E2F family members have
various effects on the initiation and progression of several types
of cancer. Typically, the E2F family members are divided into
transcriptional activators (E2F1-E2F3) or transcriptional
repressors (E2F4-E2F8) of target genes (12). E2F3, a positive regulator, has been
shown to interact with histone acetyltransferase, and be involved
in DNA replication by stimulating the entry of quiescent cells into
the G1/S phase of the cell cycle (13,14).
Specifically, E2F3 mRNA encodes two isoforms, E2F3a and E2F3b, both
of which contribute to the activation of E2F3 target gene
transcription; however, the 2 isoforms of E2F3 showed different
activity in regulating biological functions, such as cell
proliferation (14,15). A previous study found that the
downregulation of E2F3 using short-hairpin RNA (shRNA) could
suppress cell proliferation, migration and invasion ability of the
DU145 prostate cancer cell line (14). However, another previous study has
focused on the impact of E2F3 on the tumorigenesis and prognosis in
patients with NSCLC (13).
The present study aimed to investigate if E2F3 was
differentially expressed in the NSCLC tissues compared with
non-tumor lung tissues by using a bioinformatics approach. By
analyzing the level of E2F3 protein in lung cancer cell line and
patient tissues, the importance and potential value of E2F3 were
assessed in patients with NSCLC as a potential biomarker.
Functional analysis was used to analyze the effect of E2F3 on tumor
cell proliferation and apoptosis to ascertain the underlying
mechanism of how E2F3 was involved in the tumorigenesis of NSCLC.
The present study revealed a new aspect of E2F3 in promoting NSCLC
progression, which emphasized the value of E2F3 as a potential
biomarker for the prediction of prognosis in patients with
NSCLC.
Materials and methods
Patient material
A total of 50 pairs of lung cancer tissues and
adjacent normal lung tissues, which were >2 cm away from the
tumor tissues, were collected from patients with lung cancer,
between January, 2016 and January, 2017 at the Department of
Pathology of The Second Affiliated Hospital of Soochow University
(Jiangsu, China). All patients underwent standard lung resection
plus lymphadenectomy by the same surgical team, and no patients
received any preoperative therapy. All sample collection processes
were performed with the permission of the ethical review committee
of Soochow University, and standard operating procedures were
strictly followed for the processing of tissue samples. The
collected tissues were immediately stored at −80°C until further
use. The clinicopathological features of the patients are provided
in Table I. Histological assessment
of tumor differentiation and clinical stages were confirmed by the
World Health Organization guidelines previously described in lung
cancer studies (3). Histological
classification of collected lung cancer tissue include squamous
cell lung carcinoma (LUSC, n=23) and lung adenocarcinoma (LUAD,
n=27). The collection of tissue samples from patients with lung
cancer, for the present study, was approved by the Ethics Committee
of Soochow University (Jiangsu, China). All patients involved were
informed before the collection of tissue samples. Written informed
consent was obtained from all patients for their participation in
the study, in accordance with the 1964 Declaration of Helsinki and
its later amendments.
 | Table I.Association between E2F3 and
clinicopathological parameters in patients with lung cancer. |
Table I.
Association between E2F3 and
clinicopathological parameters in patients with lung cancer.
|
|
| E2F3 expression
level |
|
|---|
|
|
|
|
|
|---|
| Variables | Number | High n=29 | Low n=21 | P-value |
|---|
| Sex |
|
|
| 0.815 |
|
Male | 30 | 17 (56.7%) | 13 (43.3%) |
|
|
Female | 20 | 12 (60.0%) | 8 (40.0%) |
|
| Age, years |
|
|
| 0.261 |
|
≤60 | 17 | 8 (47.1%) | 9 (52.9%) |
|
|
>60 | 33 | 21 (63.6%) | 12 (36.4%) |
|
| Tumor size, cm |
|
|
| 0.083 |
| ≤2 | 3 | 2 (66.7%) | 1 (33.3%) |
|
|
2–5 | 27 | 8 (29.6%) | 19 (70.4%) |
|
|
>5 | 20 | 12 (60.0%) | 8 (40.0%) |
|
| Lymphatic
metastasis |
|
|
| 0.003 |
|
Yes | 29 | 22 (75.9%) | 7 (24.1%) |
|
| No | 21 | 7 (33.3%) | 14 (66.7%) |
|
| TNM stage |
|
|
| 0.979 |
|
I–II | 38 | 22 (57.9%) | 16 (42.1%) |
|
|
III–IV | 12 | 7 (58.3%) | 5 (41.7%) |
|
Tissue microarray (TMA)
preparation
Tissue samples were fixed in 10% formalin for 2 days
at room temperature. Paraffin embedded tissues were cut in 2–3 µm
sections using a microtome and dried overnight. The tissue slides
were routinely stained with eosin (30 sec) and hematoxylin (2 min)
at room temperature for the confirmation of the diagnosis of each
sample by pathologists under a light microscope (magnifications,
×100 and ×400). The tumor area and surrounding non-tumor tissues in
paraffin were drilled out and transferred to an acceptor of a
predesigned array using a puncher. After all tissue samples from
the original paraffin blocks were transferred to the microarray
acceptor, the complete tissue microarray was briefly warmed at 65°C
in an oven for 30 min. When slightly dissolved by heating, the
tissue microarray was reformed in a plastic cassette. Each dot on
the microarray had a diameter of 2 µm, which was 1 µm away from
adjacent dots.
Immunohistochemistry (IHC)
Tissue samples from patients were fixed with 10%
formalin for 2 days at room temperature, followed by paraffin
embedment for TMA preparation. The tissue sections (2–3 µm) from
TMA were deparaffinized and rehydrated using the following washing
steps: 3×5 min xylene, 2×3 min 100% ethanol, 3 min 95% ethanol and
3 min 75% ethanol, followed by rinsing with water. Sodium citrate
buffer (10 mM; Ph 6.0; cat. no. AR0024; Boster Biological
Technology) was incubated with the TMA using a microwave, twice for
15 min. After antigen retrieval, the tissue sections were incubated
with 3% peroxidase (Yonghua Chemical Co., Ltd.) at room temperature
for 10 min, blocked with 5% (w/v) BSA (Guangzhou Saiguo Biotech
Co., Ltd.) at room temperature for 20 min and incubated with E2F3
primary antibody (cat. no. ab50917; dilution, 1:200; Abcam)
overnight at 4°C. The tissue sections were then incubated with a
biotinylated anti-rabbit secondary antibody (cat. no. BA1003;
Boster Biological Technology) at room temperature for 2 h.
Streptavidin-horseradish peroxidase (cat. no. BA1088; Boster
Biological Technology) and peroxidase substrate solution (cat. no.
MAX-001; MXB Biotechnologies) were added to the tissue sections at
room temperature for 5–30 min for signal development. IHC stains
were analyzed at ×100 and ×400 magnifications under a light
microscope.
IHC of TMA was scored blindly by 2 pathologists from
the Department of Pathology, The Second Affiliated Hospital of
Zhejiang University School of Medicine, (Hangzhou, China) according
to the intensity and percentage of positive tumor cells.
Pathological stages of lung cancer were confirmed by the 2
pathologists according to the WHO guidelines of the NSCLC (3). Intensity was scored as follows: 0,
Negative; 1, low nuclear stain; 2, medium nuclear stain; 3, strong
nuclear stain. The percentage of positivity was defined as follows:
0, Negative; 1, <1%; 2, <9%; 3, 10–50%; 4, >51%. The final
score was calculated by multiplying the qualitative and
quantitative parameters. Median value of IHC scores were analyzed
in lung cancer tissue or adjacent lung tissue. Difference of median
value of IHC scores were used to indicate the differential
expression of proteins between lung cancer and adjacent tissue.
Western blot analysis
The total protein lysate was extracted from fresh
tissue or cell lines using RIPA buffer (cat. no. 5871, Cell
Signaling Technology, Inc.). The total protein concentration was
measured using a BCA protein quantitative kit (Beyotime Institute
of Biotechnology) and denatured by heating at 95°C for 10 min. The
protein samples (50 µg) were separated using 8–12% SDS-PAGE,
transferred to a PVDF membrane (EMD Millipore), blocked with 5%
(w/v) skimmed milk in TBST (0.1% Tween 20 in TBS, v/v) at room
temperature for 1 h, and incubated with the primary antibodies in
the same blocking buffer against E2F3 (1:1,000; cat. no. ab152126;
Abcam), caspase-3 (1:200; cat. no. ab32150; Abcam), Bcl-2 (1:1,000;
cat. no. 12789-1-AP; ProteinTech Group, Inc.) and Bax (1:1,000;
cat. no. 50599-2-Ig; ProteinTech Group, Inc.) overnight at 4°C.
Detection of β-actin (1:1,000; cat. no. sc-47778; Santa Cruz
Biotechnology Inc.) served as a loading control. Following which,
the PVDF membrane was washed with TBS (0.1% Tween-20) three times
and incubated with a specific secondary antibody (dilution,
1:3,000; Boster Biological Technology) for 2 h at room temperature.
Immunoreactivity was visualized using an ECL (Pierce; Thermo Fisher
Scientific Inc.) detection system.
Reverse transcription-quantitative
(RT-q) PCR
For total RNA extraction from cultured A549 cells,
the NucleoSpin RNA II kit (Macherey-Nagel GmbH & Co. KG) was
used according to the manufacturer's instructions. A total of 2 µg
mRNA was used for cDNA synthesis using RevertAid H Minus Reverse
Transcriptase (0.9 µl; Thermo Fisher Scientific Inc.) according to
manufacturer's instructions. Real-time PCR reactions were set up
using the ABsolute qPCR SYBR Green ROX Mix (Thermo Fisher
Scientific Inc.) and E2F3 specific primers (forward sequence,
5′-GTATGATACGTCTCTTGGTCTGC-3′, reverse sequence,
5′-CAAATCCAATACCCCATCGGG-3′). Glyceraldehyde-3-phosphate
dehydrogenase (GAPDH, forward sequence,
5′-CAAGGTCATCCATGACAACTTTG-3′, reverse sequence,
5′-GTCCACCACCCTGTTGCTGTAG-3′) was used as the housekeeping gene.
Thermocycling conditions contained 1 cycle of initial denaturation
at 95°C for 15 min, 40 cycles of denaturation (95°C for 15 sec),
followed by combined annealing and extension (60°C for 60 sec), and
1 cycle of melting curve at 60- 95°C with increase of temperature
at 0.5°C/min. The standard curve method was used for
quantification. Different dilutions of cDNA from A549 cells
(1:12.5, 1:25, 1:50, 1:100, 1:200, and 1:400) were used for
generation of the standard curves for quantification. Data was
quantified the 2−ΔΔCq method (16).
Bioinformatics analysis
Oncomine database (6)
was used to analyze the expression level of the E2F3 gene in the
selected tumor types, including gastric cancer, lung cancer, breast
cancer, hematological tumor and sarcoma. To determine the
biological function of E2F3 in cancer, patient clinical data from
the datasets were analyzed and characterized as ‘cancer’ and
‘normal’. ‘Ranking of genes’ was used to identify the differential
expression of E2F3 in different tumor types. The overexpression of
E2F3 was compared between 19 NSCLC studies using meta-analysis,
based on the fold change of the median levels of E2F3, as compared
with non-tumor lung tissues.
The Kaplan-Meier plotter website (7) was used to compare survival rates in
patients with NSCLC (n=141) grouped by the expression levels of
E2F3 and E2F3-associated miRNAs. The endpoint was either 5 years or
the death of the patient. Time of patients without reaching the
endpoint was shown as the follow-up periods. To confirm the
expression data of E2F3 in lung cancer, The Cancer Genome Atlas
(TCGA) database was used for the analysis (https://cancergenome.nih.gov/).
Using TCGA visualization website FireBrowse
(http://firebrowse.org), the E2F3 expression
levels were compared between the tumor and non-tumor tissues from
the lung and squamous cell epithelium from tongue. The ‘filter’
included using lung adenocarcinoma (LUAD) and lung squamous cell
carcinoma (LUSC). The expression data of the genes of interest was
displayed as ‘tumor vs. normal’, according to the analysis filter.
For the identification of E2F3-associated miRNAs in lung cancer,
the top 10 miRNAs targeting E2F3 were selected by using the Exiqon
database (https://www.exiqon.com/miRSearch). The OncomiR website
(10) was used to analyze the
expression level of the top 10 miRNAs in LUAD and LUSC and their
effects on patient survival rates with a statistically significant
difference of P<0.01. The interaction of E2F3 with other
proteins was analyzed using GeneMANIA (http://genemania.org/) (17).
The biological processes and pathway analyses of 15
E2F3 and E2F3-associated genes, based on the protein-protein
interaction data were performed using the Protein Analysis THrough
Evolutionary Relationships (PANTHER) online classification tool
with a cut-off of P<0.05 (http://www.pantherdb.org/).
Cell lines and cell culture
A human NSCLC A549 cell line was purchased from the
Institute of Biochemistry and Cell Biology of the Chinese Academy
of Sciences. The A549 cells were cultured in RPMI-1640 medium
(Hyclone; GE Healthcare Life Sciences), supplemented with 10% fetal
bovine serum (FBS, Gibco; Thermo Fisher Scientific Inc.), 2 mM
L-glutamine (Gibco; Thermo Fisher Scientific Inc.), 100 units/ml
penicillin and 100 µg/ml streptomycin (Gibco; Thermo Fisher
Scientific Inc.). The cell line was cultured at 37°C in a
humidified atmosphere with 5% CO2.
Cell transfection
The cells were transfected with 50 nM small
interfering (si)RNAs targeting at E2F3 (targeting sequence #1,
GCGATCTCTTCGATGCTTA; targeting sequence #2, AGACCAAACTGTTATAGTT;
targeting sequence #3, CATTGAGGTTTACTTATGT; Guangzhou RiboBio Co.,
Ltd.) when the cell density reached 80–90% confluence.
Lipofectamine® 2000 reagent (Thermo Fisher Scientific,
Inc.) was used for siRNA transfection at room temperature for 6 h
before change of transfection medium to complete RPMI-1640 with 10%
FBS. Non-specific siRNA (scrambled control)-transfected cells
served as a negative control. The subsequential protein and
functional analyses were performed 24, 48 and 72 h after
transfection.
Cell Counting Kit-8 (CCK-8) assay
The cells were seeded in 96-well plates
(5×10³ cells/per well) for 24 h before transfection.
After transfection with siRNA, the cells were incubated at 37°C in
a humidified atmosphere with 5% CO2. Next, 10 µl CCK-8
solution (MedChemExpress LLC) was added to each well at 24, 48 and
72 h. After incubation for 1 h, absorbance was measured at 450 nm
using a microplate reader.
Invasion and motility assays
For the invasion assay, after transfection for 24 h,
the cells were resuspended in serum-free RPMI-1640 medium in the
upper chamber at a cell density of 100,000 cells/well of the
Matrigel-coated chamber, which was pre-coated at 37°C for 2 h
before cell seeding. Complete RPMI-1640 medium with 10% FCS was
added to the lower chamber. After wiping off the upper chamber
cells with a cotton swab, the cells were incubated for 48 h,
followed by fixation with 4% paraformaldehyde at room temperature
for 10 min and staining with 0.2% crystal violet at room
temperature for 30 min. Invaded cells on the underlying layer of
the chamber were counted in 6 different regions at ×100
magnification under a light microscope.
A wound healing assay was then used to evaluate the
motility of the A549 cells. The cells were cultured in RPMI-1640
medium with 10% FBS for the sustenance of cell viability according
to a protocol previously discussed (18). A wound was created by scraping the
cell monolayer at 100% confluency with a 200 µl pipette tip. The
cells on the culture dish were incubated at 37°C for 72 h. Images
were captured at 0, 24 and 48 h using a light microscope
(magnification, ×100). Image J v.2 software (National Institutes of
Health) was used to calculate the wound healing rate (19).
Statistical analysis
Statistical analysis was performed either using SPSS
v16.0 (SPSS, Inc.) and GraphPad Prism v8 (GraphPad Software, Inc.)
software. The association between E2F3 expression level and the
clinicopathological features of the patients with NSCLC was
analyzed by grouping patients according to E2F3 IHC scores
(high-expression, 3–12; low-expression, 0–2). Statistical analysis
of clinicopathological features was performed by using a
χ2 test. For an expected count <5, the Fisher's exact
test was used. Comparisons of mRNA and protein expression levels
between two groups were performed either using a Student's t-test
and the non-parametric Mann-Whitney U test. One-way ANOVA, followed
by Tukey's HSD post hoc test, was used for the comparisons of
datasets containing multiple groups. Wilcoxon test was used to
analyze the IHC scores of paired tissue samples. Spearman's
correlation was performed for the co-expression of the proteins of
interest in the TMA. P<0.05 (two-sided) was considered to
indicate a statistically significant difference.
Results
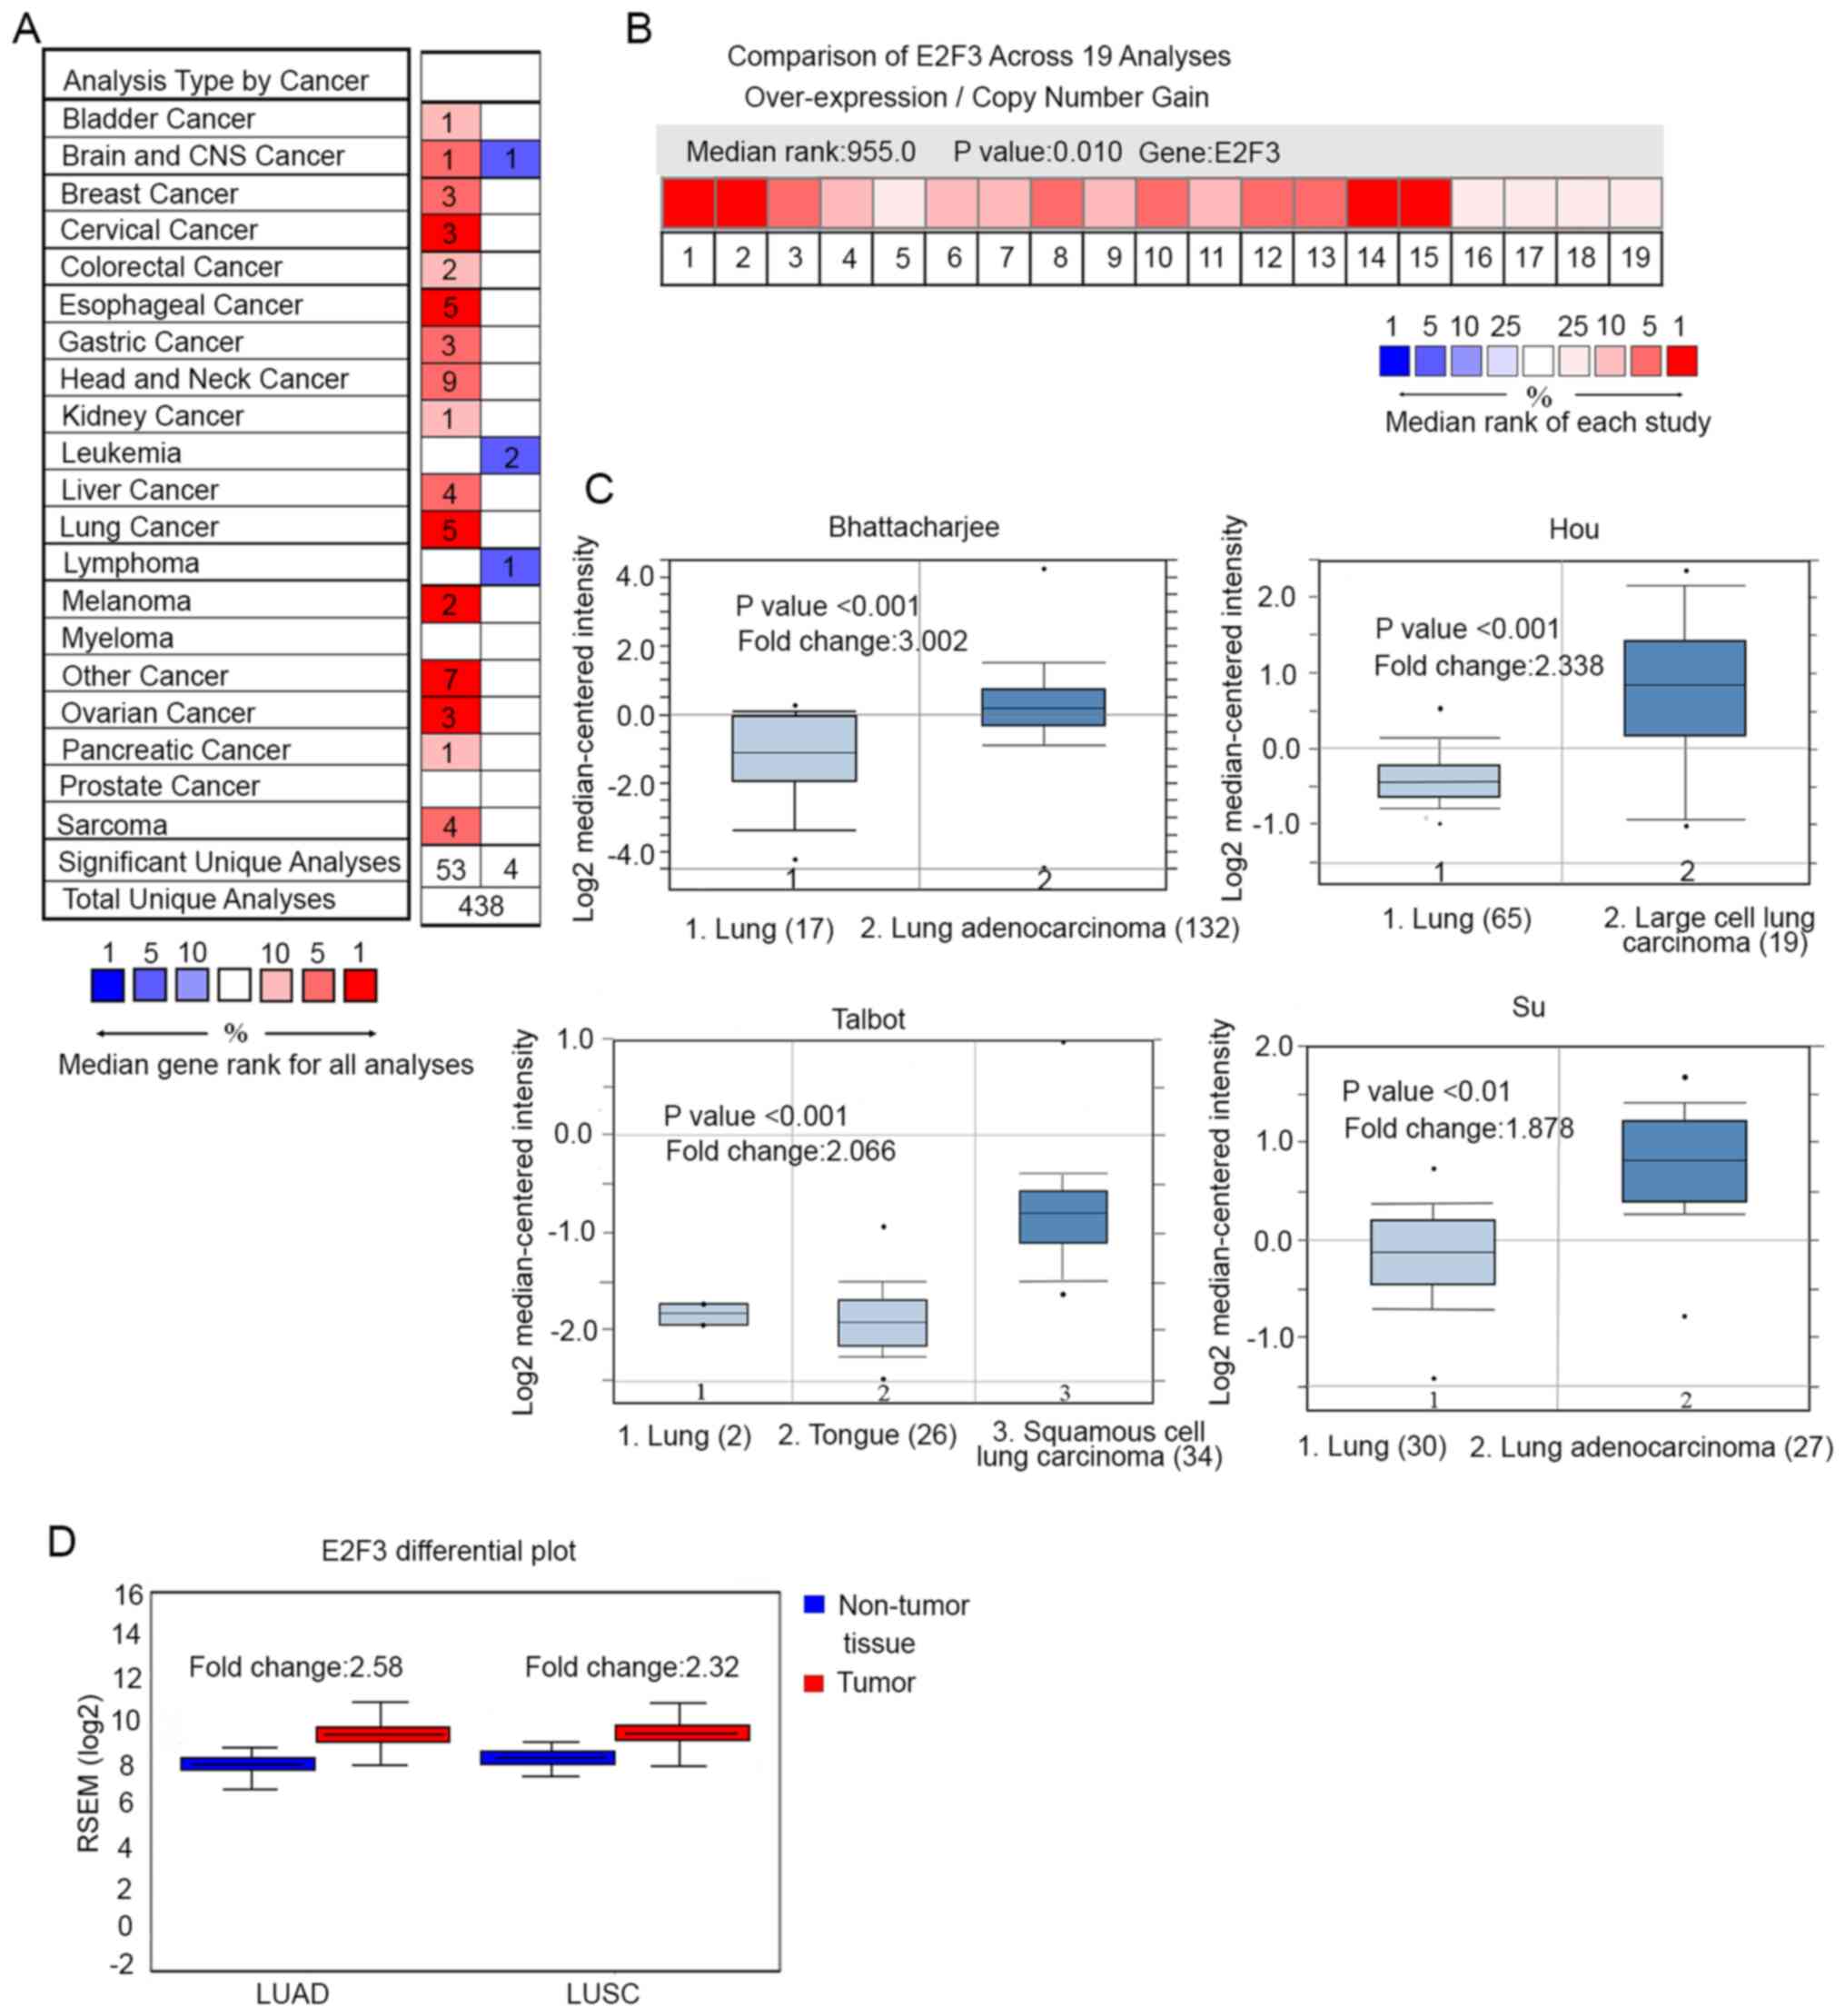
Bioinformatics analysis reveals a high
expression level of E2F3 in NSCLC
To verify the association between E2F3 expression
level and lung cancer progression, data were downloaded from the
Oncomine database. A total of 438 results associated with the mRNA
expression level of E2F3 in different tumor types were found. Among
these data, 58 studies showed significant differences between
tumors and surrounding non-tumor tissues (P<0.01). Specifically,
54 studies reported an upregulation of E2F3, and 4 studies reported
a downregulation of E2F3 in tumor tissues, as compared with that in
the non-tumor tissues (Fig. 1A).
Among the different tumor types, E2F3 expression level was highest
in cervical cancer (3 studies), esophageal cancer (5 studies), lung
cancer (5 studies), melanoma (2 studies) and ovarian cancer (3
studies), according to the ranking of the studies. Considering
there are 5 studies supporting the upregulation of E2F3 in lung
cancer, it was selected for further investigation in the present
study. The expression level of E2F3 was further investigated in 19
lung cancer studies, which revealed an upregulation of E2F3 in
tumor tissue, as compared with that in unpaired non-tumor tissues
(fold change, >1.0). By comparing the E2F3 mRNA expression
levels in each of the studies, 4 studies were selected due to the
significant differences (P<0.01) identified between the tumor
and non-tumor tissues (Fig. 1B). The
studies included the Bhattacharjee, Hou, Talbot and Su cohorts
(Fig. 1C). In the Bhattacharjee
cohort, E2F3 was overexpressed in LUAD (n=132), as compared with
that in the non-tumor lung tissues without malignancy (n=17; fold
change, 3.0). In the Hou cohort, E2F3 expression level was compared
between large cell lung carcinoma (n=19) and non-tumor lung tissues
(n=65; fold change, 2.3). In the Talbot cohort, E2F3 was
overexpressed in squamous cell carcinoma (n=34), as compared with
squamous cell epithelium from tongue tissue (n=26; fold change,
1.7). In the Su cohort, E2F3 was elevated in adenocarcinoma (n=27),
as compared with that in the non-tumor lung tissues without
malignancy (n=30; fold change, 1.9). The results were confirmed
using TCGA database, where E2F3 mRNA was significantly
overexpressed in LUAD tissue (n=517), as compared with that in
non-tumor tissues (n=59; fold change, 2.6; P<0.01). E2F3
mRNA was also overexpressed in squamous cell carcinoma tissue
(n=501), as compared with that in non-tumor tissues without
malignancy (n=51; fold change, 2.3; P<0.01; Fig. 1D). These results from the mRNA-based
databases revealed an association between E2F3 expression level and
NSCLC tumorigenesis.
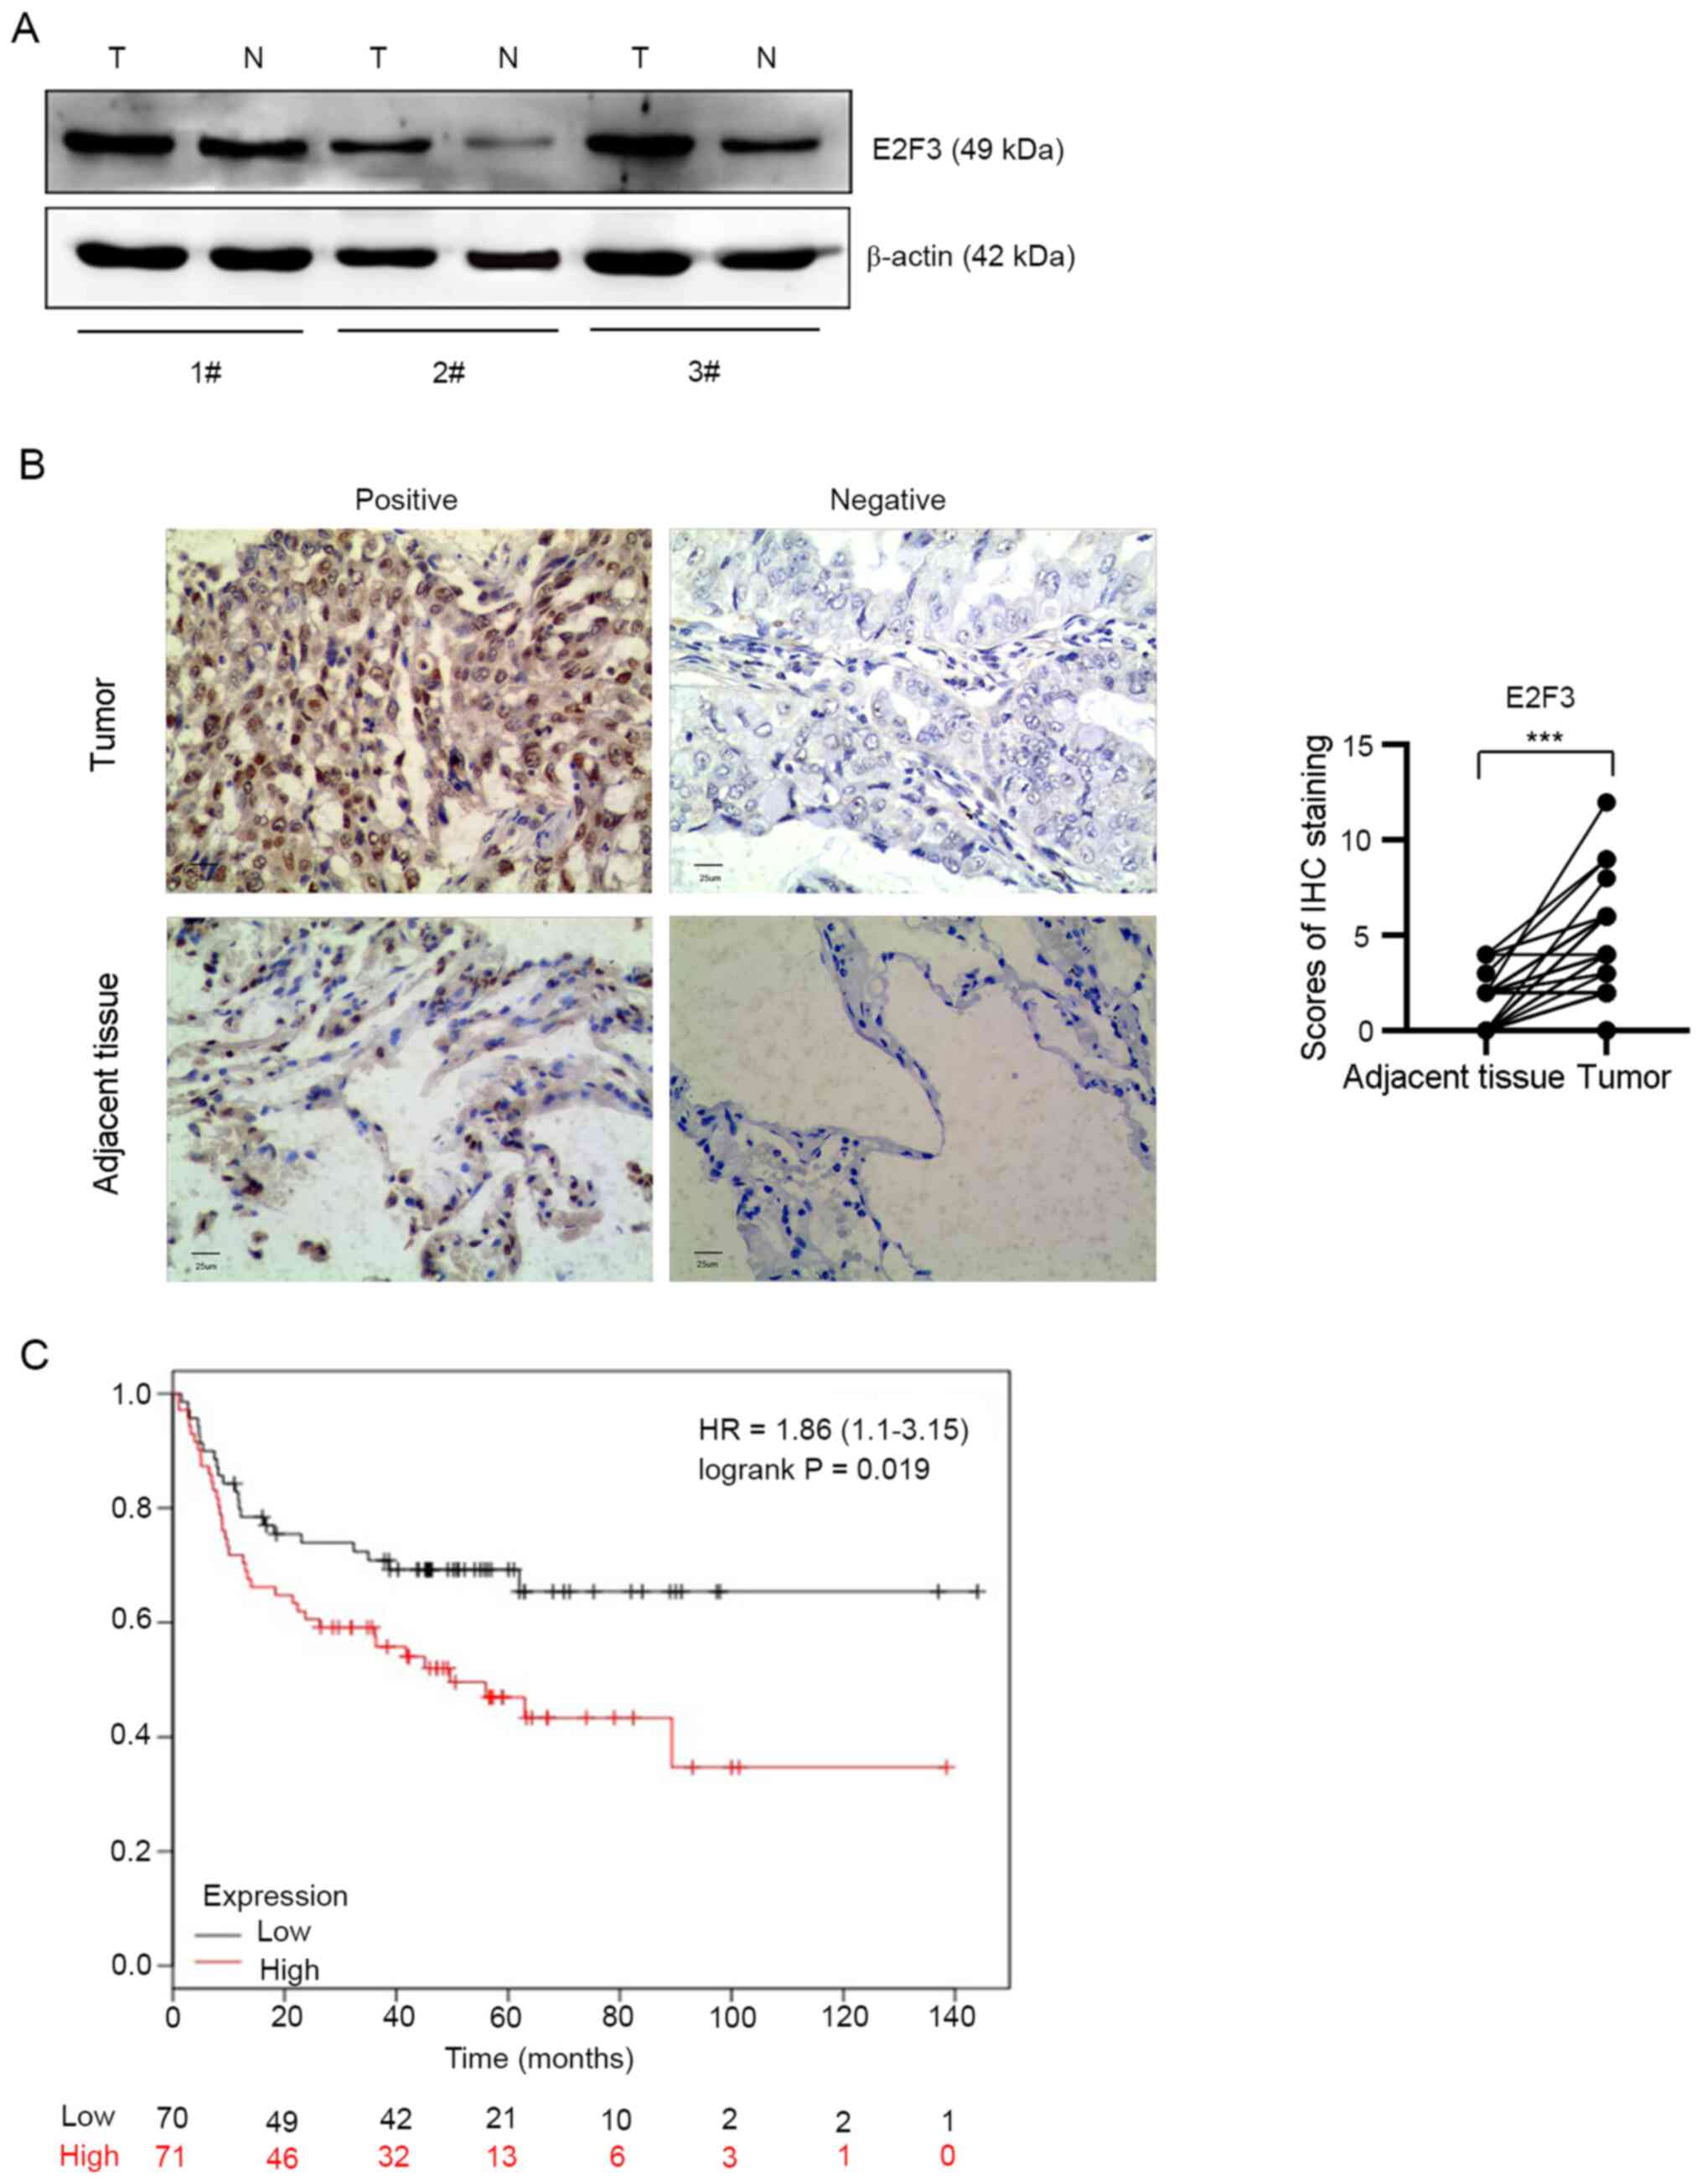
Overexpression of E2F3 in NSCLC
tissues is associated with patient survival
To investigate the expression level of the E2F3
protein in tumors, the E2F3 protein expression level was analyzed
in fresh tumor (n=3) and respective surrounding adjacent lung
tissue (n=3) from obtained from 50 patients with NSCLC. Western
blot analysis showed that E2F3 protein expression level was
markedly upregulated in fresh lung cancer tissues, as compared with
non-tumor tissues (P<0.05; Fig.
2A). To further investigate the expression level of E2F3 in
NSCLC tissues, a TMA containing NSCLC tumor (n=50) and the
corresponding adjacent lung tissues (n=50) was prepared (Fig. S1). The IHC score of the E2F3 protein
in the tumor tissues was significantly higher compared with that in
the adjacent normal tissues (difference of median, 2.0; P<0.001;
Fig. 2B).
To determine the clinical relevance of E2F3
overexpression, survival analysis was performed. Kaplan-Meier
Plotter was used and the results revealed that the patients in the
high E2F3 mRNA expression subgroup had a worse OS time, as compared
with that in patients in the low expression subgroup within 2.5
years (P=0.019; Fig. 2C).
Furthermore, the clinical parameters of the 50 patients with NSCLC
were collected and compared in the E2F3 high-expression (IHC score,
3–12; n=29) and low-expression (IHC score, 0–2; n=21; Table I) groups. The statistical results
showed that E2F3 overexpression had no association with sex, age,
tumor diameter or TNM stage (P<0.05). However, E2F3
overexpression was significantly associated with lymphatic
metastasis (75.9% in the high-expression group; P<0.01).
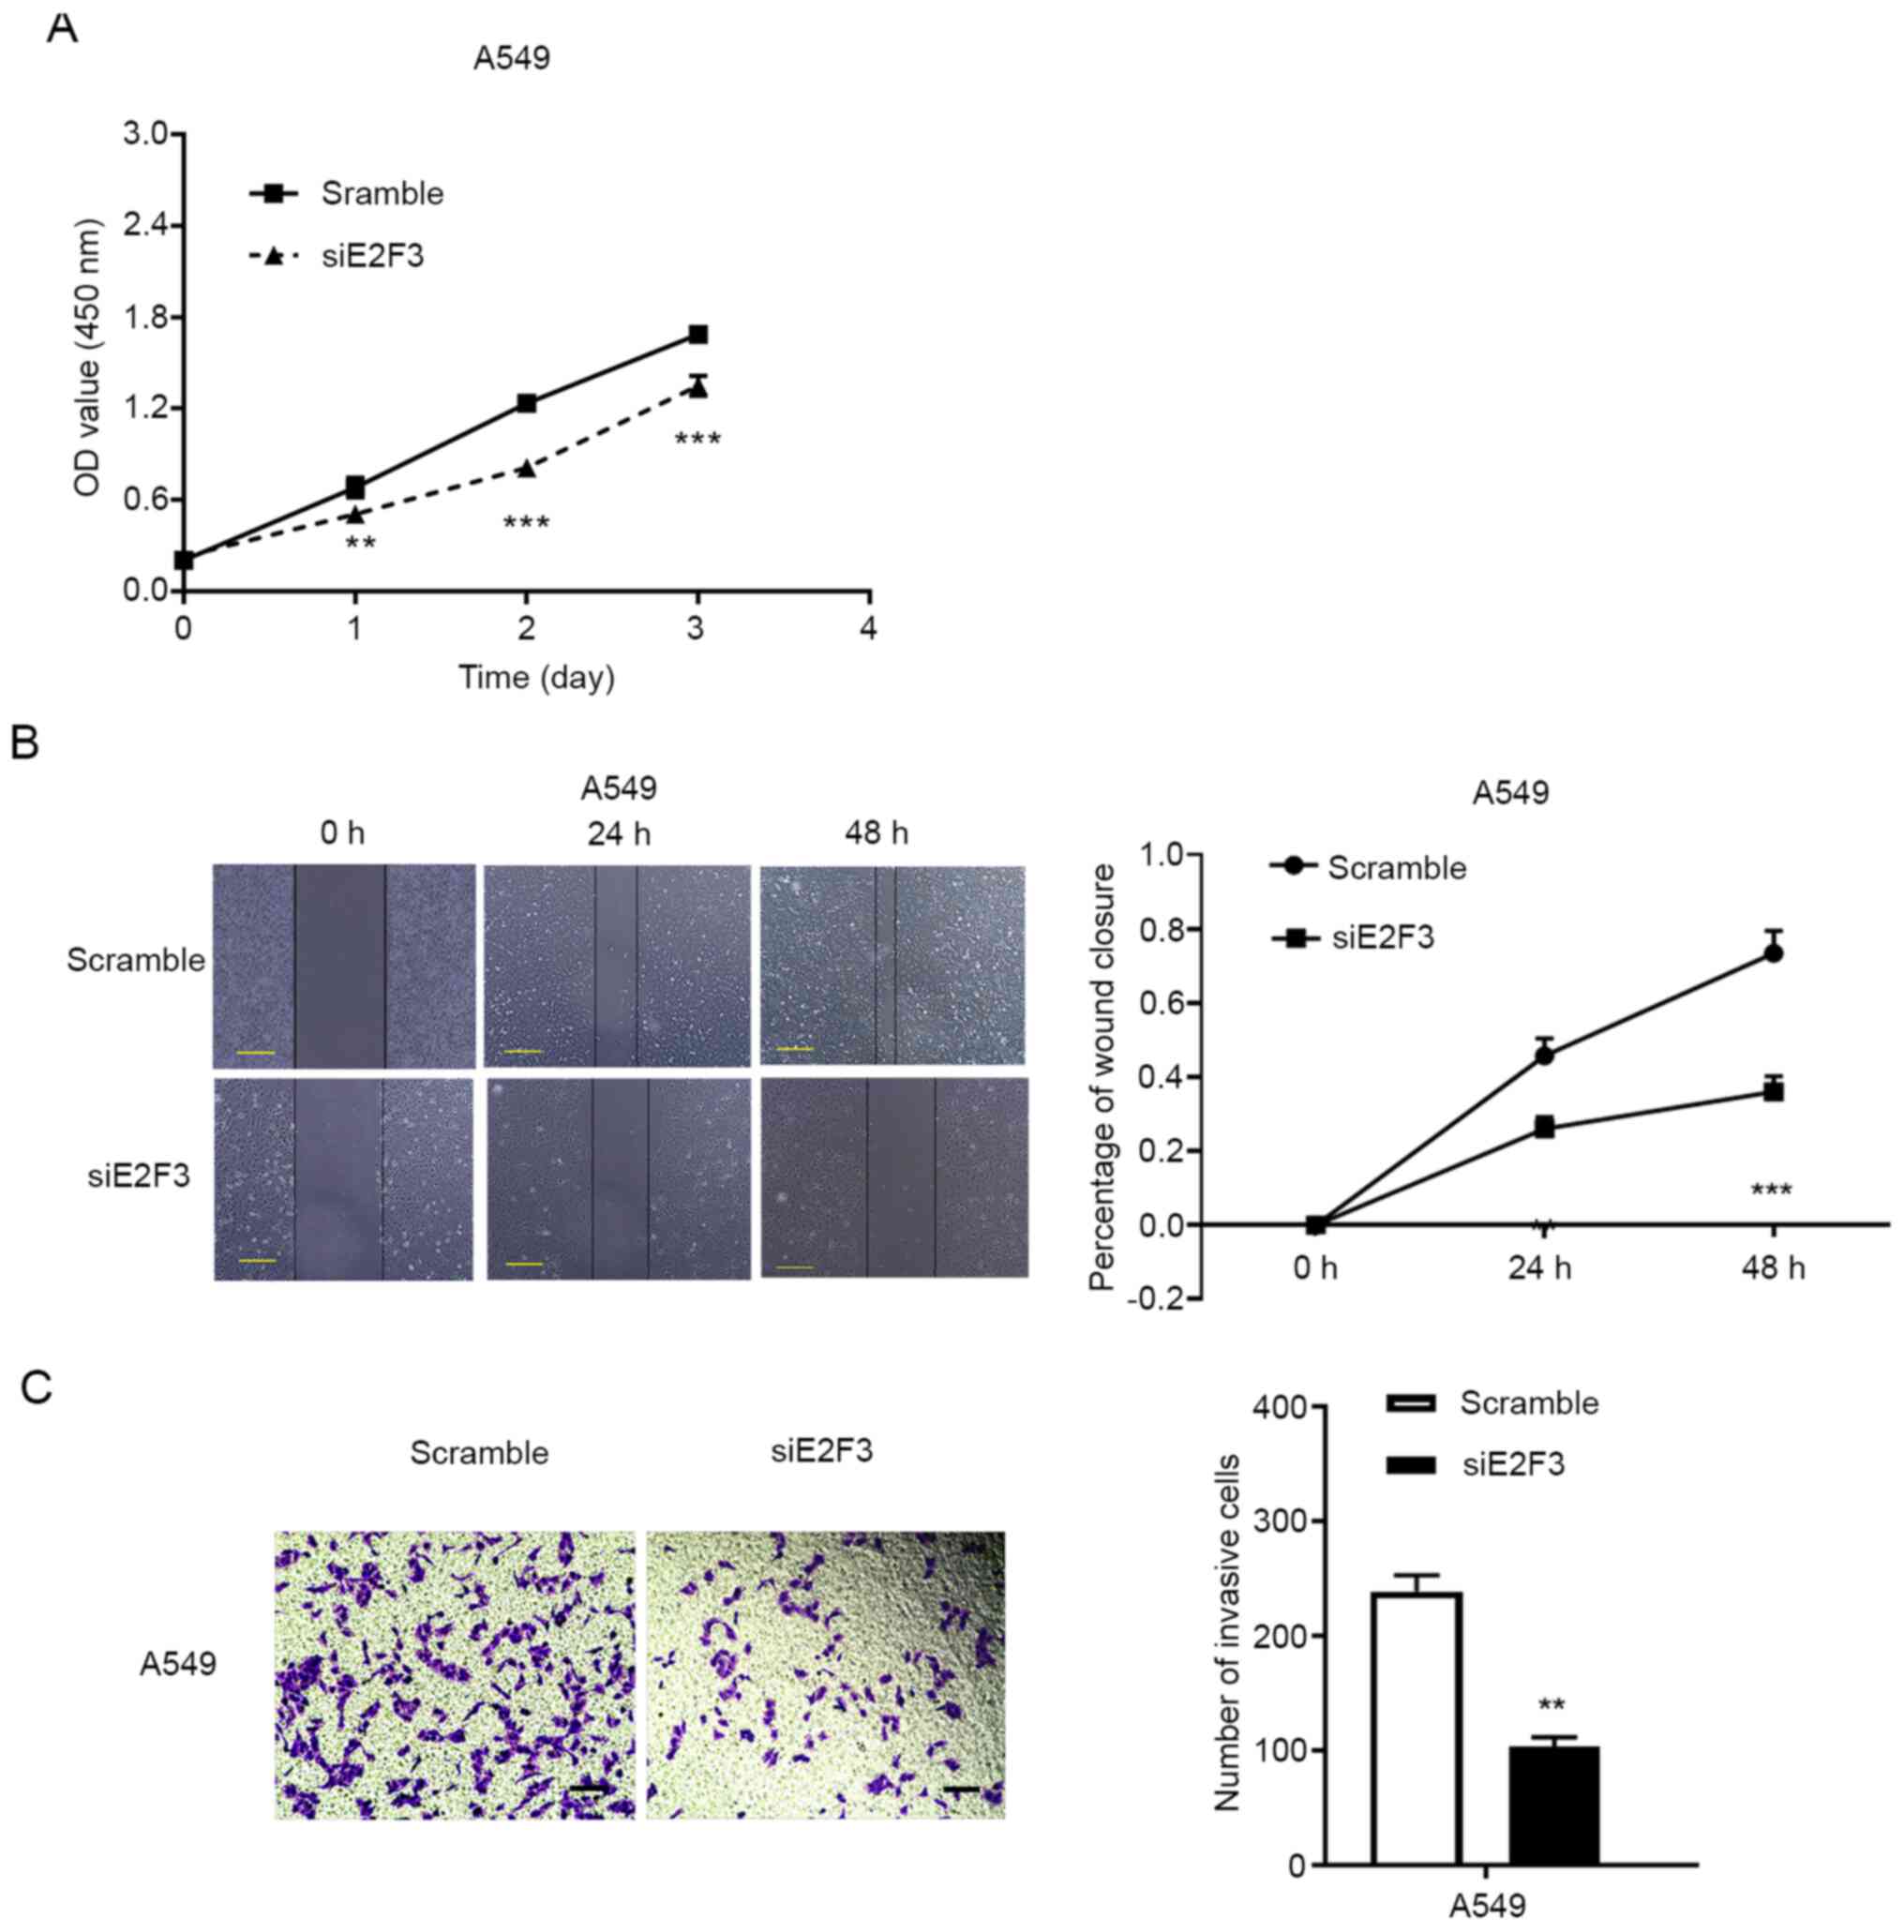
Downregulation of E2F3 inhibits cell
proliferation and promotes apoptosis in the NSCLC cell line
To investigate the role of E2F3 in lung cancer, the
A549 NSCLC cell line was used for the in vitro studies.
siRNAs targeting E2F3 mRNA were designed and transfected into NSCLC
A549 cell line. As compared with the non-specific siRNA (scrambled
control)-transfected cells, the third E2F3 siRNA with the highest
silencing efficiency was used in subsequent experiments (Fig. S2). The CCK-8 assay revealed that
E2F3 knockdown significantly suppressed NSCLC cell proliferation in
the A549 cells (Fig. 3A).
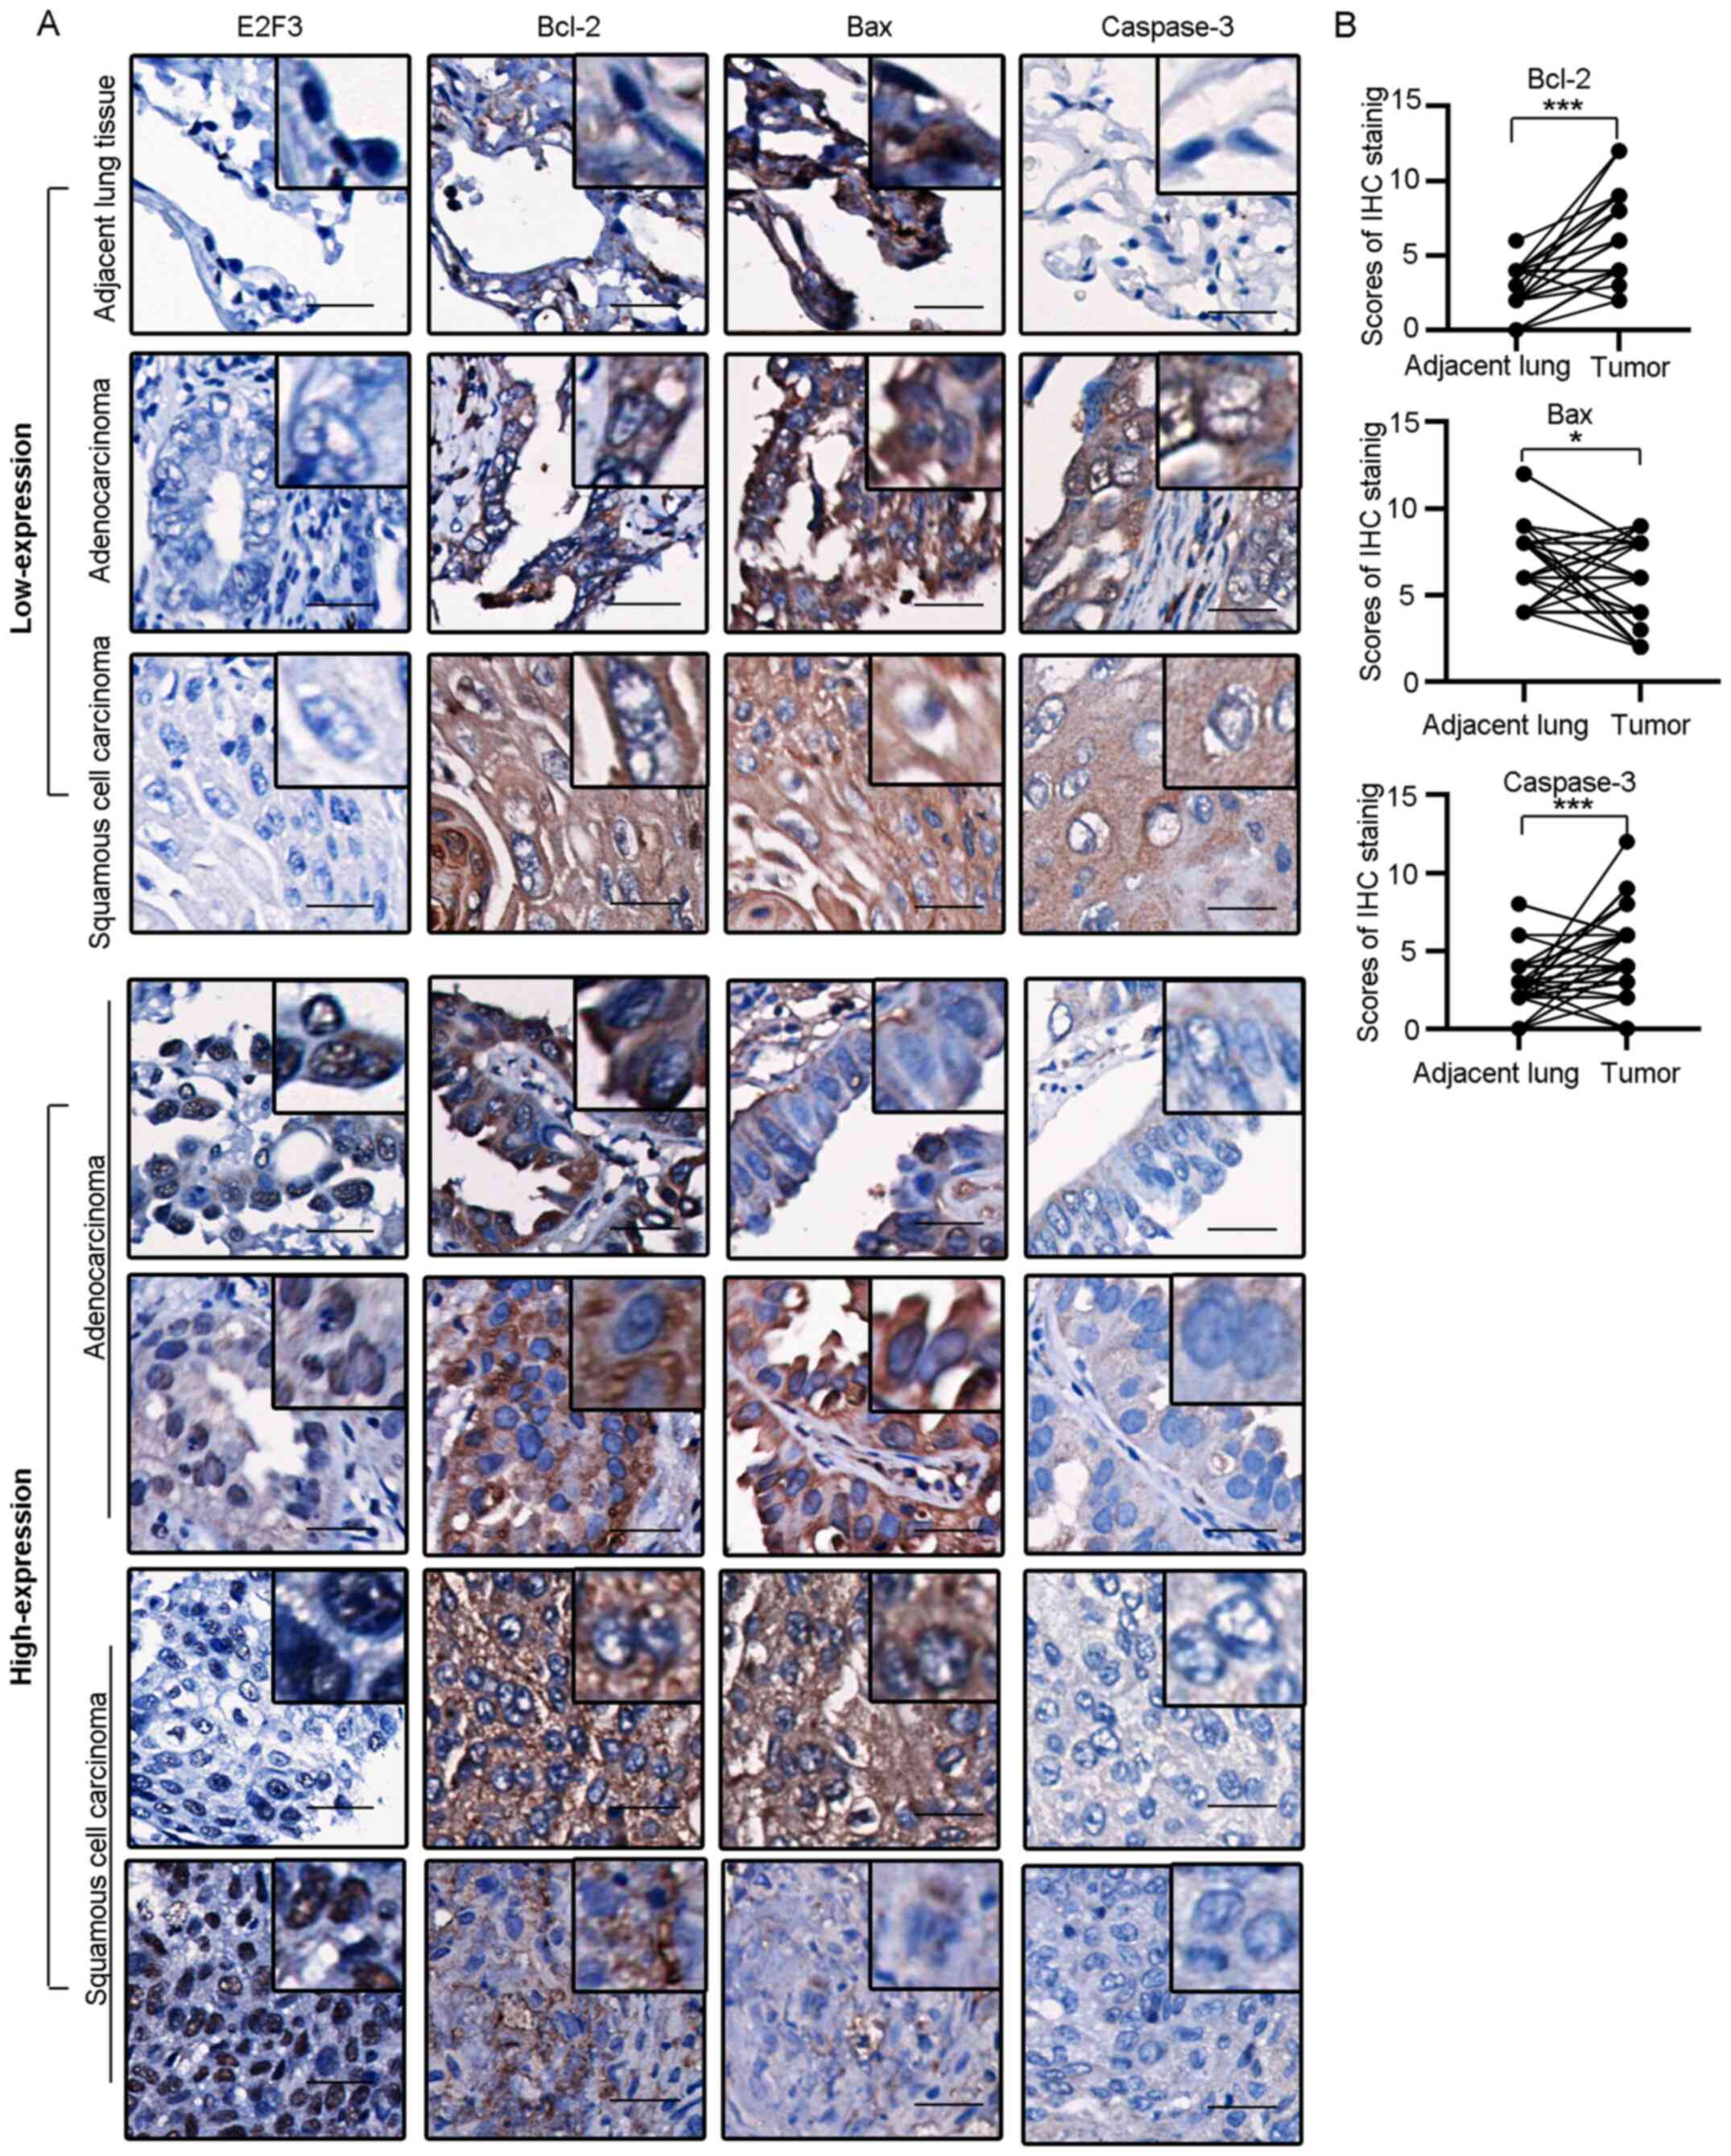
To confirm the effect of E2F3 on apoptosis in
tissues, IHC staining was performed on the TMA sections from 50
patients with NSCLC, to investigate the expression of Bcl-2, Bax
and caspase-3 (Fig. 4A). The IHC
scores at different stages of LUSC (n=23) and LUAD (n=27) were
compared with their respective surrounding non-tumor lung tissues
(Fig. 4B). Of note, Bcl-2 was
overexpressed in the tumor tissues, as compared with that in the
non-tumor tissues (median of differences, 4.0; P<0.001). By
contrast, Bax was downregulated in tumor tissues, as compared with
that in the non-tumor tissues (median of differences =−0.5;
P<0.05). Caspase-3 was also upregulated in the NSCLC tissue
samples (median of differences, 2.0; P<0.001). A correlation
test was performed between the nuclear expression of E2F3 with IHC
scores of Bcl-2, Bax and Caspase-3 in tumor samples. Bcl-2 was
positively correlated with E2F3 expression level (r=0.32; P=0.02),
while Bax expression level was negatively correlated with E2F3
expression level, although this was not statistically significant
(r=−0.22, P=0.13). Caspase-3 did not show correlation with E2F3
expression in the patients analyzed (r=0.13; P=0.37).
E2F3 promotes tumor cell migration and
invasion in NSCLC cells
The association between E2F3 mRNA expression levels
with lymphatic spreading in patients with NSCLC revealed a
potential role of E2F3 in the regulation of tumor cell
invasiveness. To validate the biological function of E2F3 in NSCLC,
wound healing and Matrigel assays were performed in the A549 cell
line. The knockdown of E2F3 expression by siRNA significantly
inhibited tumor cell migration at 24 and 48 h in A549 cell
(Fig. 3B). Furthermore, the Matrigel
assay detected a reduction in invasive cells following the
inhibition of E2F3 expression in A549 cell (fold change, 0.43;
P<0.01; Fig. 3C). These data
revealed the potential role of E2F3 in the regulation of NSCLC
invasiveness, in addition to its effect on uncontrolled tumor
proliferation.
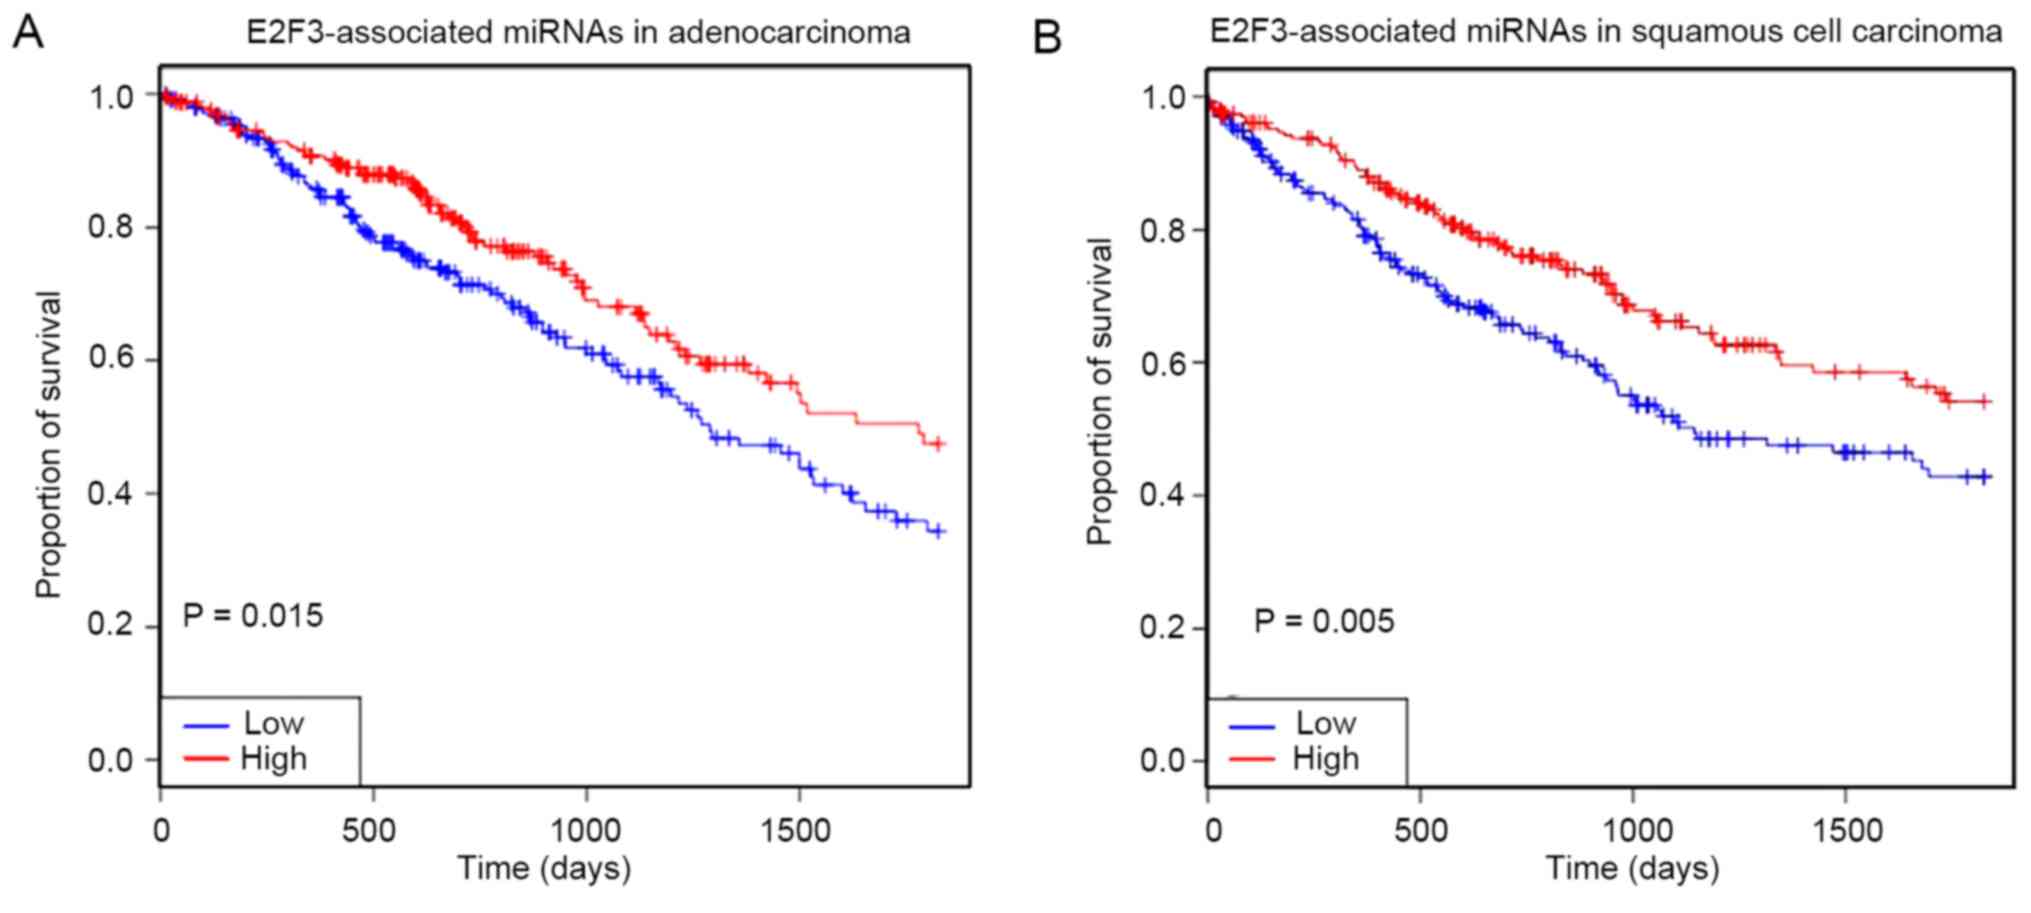
Downregulation of E2F3 upstream miRNAs
is associated with poor prognosis in NSCLC
The top 10 confirmed miRNAs targeting E2F3 were
investigated using Exiqon (https://www.exiqon.com/miRSearch). The OncomiR
database showed that the expression levels of these 10 E2F3 miRNAs
were significantly different between LUSC and normal tissues
(Table II). Among the 10 miRNAs, 7
were overexpressed in normal tissues. In addition, 7 miRNAs
exhibited a statistically significant difference in expression
between LUAD and normal tissues, among which 3 exhibited an
upregulation in tumor tissues compared with normal tissues. From
the OncomiR database, survival analysis showed that the lower
expression level of E2F3-associated miRNAs in LUSC and LUAD was
correlated with poor prognosis in patients within 5 years (Fig. 5).
| Table II.miRNAs targeting E2F3 were
downregulated in the subgroups of lung cancer patients with LUAD or
LUSC. |
Table II.
miRNAs targeting E2F3 were
downregulated in the subgroups of lung cancer patients with LUAD or
LUSC.
| A, miRNAs in
LUSC |
|---|
|
|---|
| miRNA | P-value | T-test FDR | Tissue upregulated
in | Log2
expression level in tumor | Log2
expression level in normal tissue |
|---|
| hsa-miR-101-3p |
6.49×10⁻¹⁶ |
4.60×10⁻¹⁴ | Normal | 13.56 | 15.14 |
|
hsa-miR-125b-5p |
4.74×10⁻³ |
1.15×10⁻² | Normal | 9.25 | 9.63 |
| hsa-miR-128-3p |
9.52×10⁻¹² |
1.14×10⁻¹⁰ | Tumor | 8.05 | 6.82 |
| hsa-miR-141-3p |
7.70×10⁻¹² |
9.52×10⁻¹¹ | Tumor | 9.66 | 8.12 |
| hsa-miR-195-3p |
2.05×10⁻⁹ |
1.53×10⁻⁸ | Normal | 1.65 | 3.04 |
| hsa-miR-210-3p |
1.30×10⁻²⁰ |
5.07×10⁻¹⁸ | Tumor | 11.08 | 6.16 |
| hsa-miR-221-3p |
2.16×10⁻² |
4.40×10⁻² | Normal | 8.33 | 8.66 |
| hsa-miR-32-5p |
1.11×10⁻³ |
2.99×10⁻³ | Normal | 4.53 | 4.99 |
| hsa-miR-34a-5p |
1.12×10⁻⁴ |
3.62×10⁻⁴ | Normal | 7.35 | 7.79 |
| hsa-miR-34c-5p |
1.33×10⁻⁴ |
4.23×10⁻⁴ | Normal | 4.48 | 6.33 |
|
| B, miRNAs in
LUAD |
|
| miRNA | P-value | T-test
FDR | Tissue
upregulated in | Log2
expression level in tumor | Log2
expression level in normal tissue |
|
|
hsa-miR-125b-5p |
2.59×10⁻² |
6.16×10⁻² | Normal | 8.41 | 8.85 |
| hsa-miR-128-3p |
4.2×10⁻⁹ |
7.41×10⁻⁸ | Tumor | 7.04 | 6.12 |
| hsa-miR-141-3p |
1.69×10⁻⁷ |
2.09×10⁻⁶ | Tumor | 9.21 | 7.25 |
| hsa-miR-195-3p |
4.24×10⁻⁷ |
4.84×10⁻⁶ | Normal | 1.19 | 2.26 |
| hsa-miR-210-3p |
8.74×10⁻²¹ |
3.40×10⁻¹⁸ | Tumor | 8.34 | 4.02 |
| hsa-miR-32-5p |
2.89×10⁻² |
6.62×10⁻² | Normal | 4.36 | 4.96 |
| hsa-miR-34a-5p |
1.76×10⁻⁶ |
1.73×10⁻⁵ | Normal | 6.42 | 7.29 |
Protein-protein interaction network of
E2F3 and biological process annotation
GeneMANIA was used to analyze the protein-protein
interactions between E2F3 and other proteins. The results showed
that E2F3 interacted directly with a total of 15 proteins (Fig. S3A) and among them, E2F3 had a
physical interaction with TEA domain transcription factor-3,
transcription factor binding to IGHM enhancer-3, lethal (3) malignant brain tumor like-2, vacuolar
protein sorting-associated protein-72, RING1 and YY1 binding
protein, transcription factor SP1 and bromodomain containing-8.
E2F3 was co-expressed with E74 like ETS transcription factor-1,
ribonucleotide reductase catalytic subunit M1 and thymidylate
synthetase. E2F3 was also co-expressed and co-localized with DNA
methyltransferase-1. E2F3 was co-localized and had strong physical
interactions with cyclin A2 and MutS homolog-2, had physical
interactions and similar protein domains with transcription factor
Dp-1, and was co-expressed and shared the same protein domains with
E2F2. Biological pathway enrichment and biological process
annotation was performed on the genes that had protein-protein
interactions with E2F3 using the PANTHER database. The pathway
enrichment analysis revealed 8 biological processes (P<0.05;
Fig. S3B).
Discussion
Lung cancer is the leading cause of cancer-specific
mortality in China, and NSCLC is the most common type of lung
cancer tumor (1). Numerous advances
have been made in the molecular diagnosis of lung cancer; however,
the survival rate of patients with this malignant tumor remains low
(20). Therefore, the identification
of new biomarkers is important to improve the subclassification of
NSCLC for the planning of appropriate treatment, and establishment
of a prognostic evaluation system (21).
The E2F family includes important transcriptional
factors responsible for the regulation of cell mitosis and control
of cell cycle (11–15). The overexpression of E2F was reported
in human gastric cancer, colon cancer and hepatocellular carcinoma
and was also found in neuroendocrine tumors of the lung (22–24). In
gastric cancer, the non-coding small RNA miR-449a could affect the
proliferation and apoptosis of cancer cells by inhibiting the
expression level of E2F3 (25).
These studies illustrated multiple biological functions of the E2F
family in regulating the development of different tumors.
Bioinformatics has become an important tool for
biomedical research. Databases from large-scale study samples have
provided convincing data with reduced errors (26). The Oncomine and TCGA databases were
used to examine the expression level of E2F3 mRNA in lung cancer
and non-tumor tissue from patients without malignancies. The
results showed that the mRNA expression level of E2F3 in lung
cancer tissues was significantly higher compared with that in
normal tissues, suggesting that E2F3 might play a vital role in the
development of lung cancer. Due to the diversity of lung cancer
subtypes, the expression level of E2F3 mRNA was analyzed in
different histological subtypes. E2F3 mRNA expression level was
significantly overexpressed in adenocarcinoma and squamous cell
carcinoma, which suggested a wide effect of E2F3 in the development
of NSCLC.
To investigate whether a miRNA-mRNA interaction was
involved in the development of NSCLC, the Exiqon database was used
to identify the top 10 confirmed miRNAs targeting E2F3. The results
of the OncomiR database analysis showed that most of these 10
miRNAs had a low expression level in lung cancer, and survival
analysis showed that the downregulation of the E2F3-associated
miRNAs was associated with low survival rate in patients with lung
cancer. This was consistent with the results that the
overexpression of E2F3 mRNA was associated with low survival time
in patients with LUSC and LUAD, suggesting that these miRNAs may
play an important role in the progression of lung cancer through
E2F3.
To evaluate the biological function of E2F3 in NSCLC
development, siRNA-based inhibition of E2F3 was performed in a A549
lung cancer cell line. Functional analysis also supported the
important function of E2F3 in promoting tumor cell proliferation.
Other studies have reported the effect of E2F on tumor cell
apoptosis in gastric cancer and head and neck carcinoma, suggesting
an intensive impact of E2F3 in inhibiting tumor cell apoptosis
(25,27). From the IHC analysis of a NSCLC TMA,
the overexpression of E2F3 was significantly correlated with the
expression level of Bcl-2 in adenocarcinoma and squamous cell
carcinoma tissues (Fig. 4A). E2F3
expression level was negatively correlated with the pro-apoptotic
regulator Bax; however, the result was not statistically
significant. These data in the lung cancer cell line and the TMA
suggested that the anti-apoptotic effect of E2F3 was exerted
through its regulation of Bcl-2 expression.
Clinical data from the same cohort of patients with
NSCLC (n=50) showed no association between the high expression
level of E2F3, and sex, age, tumor diameter, differentiation degree
and TNM stage (P>0.05); however an association was found with
lymph node metastasis (P<0.05). E2F3 was widely overexpressed in
patients with lymph node metastasis (75.9% of patients had a high
E2F3 expression), as compared with that in patients without lymph
node metastasis (33.3% of patients had a high E2F3 high
expression). In addition, studies have shown that miR-141 inhibited
the proliferation and metastasis of gastrointestinal cancers by
targeting E2F3 (28,29). In the present study, E2F3 inhibition
led to a reduction in tumor cell migration and invasion of the A549
cell line. In combination, these results revealed a potential role
of E2F3 in regulating NSCLC invasiveness.
In the present study, the overexpression of E2F3 in
lung cancer was verified by bioinformatics and clinical samples,
which was associated with the progression of NSCLC, particularly in
squamous cell lung carcinoma and adenocarcinoma. In A549 cell and
human tissues, various biological functions of E2F3 in NSCLC have
been identified, particularly through the inhibition of tumor cell
apoptosis, which was associated with the overexpression of the
anti-apoptotic regulator Bcl-2. As a result, the present study has
revealed a new aspect, that E2F3 promoted tumor proliferation by
inhibiting tumor cell apoptosis through the regulation of the Bcl-2
and apoptotic signaling pathway. The increased expression level of
E2F3 in tumor tissue suggests that it could become a potential
biomarker for the subclassification and the prediction in prognosis
of NSCLC, which could also be used for the development of targeted
therapy.
The important role of E2F3 in promoting tumor
proliferation in the progression of NSCLC was identified in the
present study. In the clinic, EGFR molecular assessment was
routinely performed in patients with NSCLC for administration of
TKIs, such as gefitinib and erlotinib (3). However, during the treatment of TKIs in
patients with activating mutations in EGFR, tumor cells developed
resistance to TKIs, where alterations of E2F-target genes were
frequently found (30). In this
situation, activation of E2F3 and related signaling pathway may
account for the development of TKI-resistant population of tumor
cells, which indicated the importance of detecting E2F3 expression
level in parallel to EGFR for the treatment of patients with
NSCLC.
Due to the limited number of fresh samples collected
in the present study, expression level of E2F3 was only performed
at the protein level and in paraffin-embedded tissue. The datasets
of lung cancer cohorts (the Bhattacharjee, Hou, Talbot, and Su
cohorts) were used for the selection of genes at the mRNA level.
Transcriptional analysis of E2F3 will be performed in the future
for the confirmation of the prognostic value of E2F3 in NSCLC.
Supplementary Material
Supporting Data
Acknowledgements
Tissue samples were provided by the tissue bank of
the Second Affiliated Hospital of Soochow University (Jiangsu,
China) with the approval of the Ethics Committee of the Soochow
University. The authors would like to thank Ms. Fei Zhao from the
Sanitation and Environment Technology Institute of Soochow
University (Jiangsu, China) for his technical support of tissue
sample preparation and Ms. Yue Wu from the Sanitation and
Environment Technology Institute of Soochow University (Jiangsu,
China) for the performance of IHC staining.
Funding
The study was supported by the National Key Research
and Development Program of China (grant no. 2016YFC1303800), the
Priority Academic Program Development of Jiangsu Higher Education
Institutions, the Natural Science Foundation of the Jiangsu Higher
Education Institutions of China (grant no. 18KJB320017) and the
Youth Program of National Natural Science Foundation of China
(grant no. 81902400).
Availability of data and materials
All data generated or analyzed during this study are
included in this published article.
Authors' contributions
LW and SW performed the experiments, analyzed and
interpreted the data, and wrote the manuscript. JL performed
histological assessment of TMA from patients with NSCLC. YX
performed the cell culture experiments and analyzed the data. XL
analyzed the immunohistology data. SLW and MS designed the study.
LW, SW and SLW confirm the authenticity of all the raw data. All
authors have read and approved the manuscript.
Ethical approval and consent to
participate
Tissue samples and clinical data collection were
approved by the Ethics Committee of the Soochow University
(Jiangsu, China). Written informed consent for publication was
obtained from all participants.
Patient consent for publication
Not applicable.
Competing interests
The authors declare that they have no competing
interests.
References
|
1
|
Chen WQ, Li H, Sun KX, Zheng RS, Zhang SW,
Zeng HM, Zou XN, Gu XY and He J: Report of cancer incidence and
mortality in China, 2014. Zhonghua Zhong Liu Za Zhi. 40:5–13.
2018.(In Chinese). PubMed/NCBI
|
|
2
|
Oliver TG, Patel J and Akerley W: Squamous
non-small cell lung cancer as a distinct clinical entity. Am J Clin
Oncol. 38:220–226. 2015. View Article : Google Scholar : PubMed/NCBI
|
|
3
|
Osmani L, Askin F, Gabrielson E and Li QK:
Current WHO guidelines and the critical role of immunohistochemical
markers in the subclassification of non-small cell lung carcinoma
(NSCLC): Moving from targeted therapy to immunotherapy. Semin
Cancer Biol. 52:103–109. 2018. View Article : Google Scholar : PubMed/NCBI
|
|
4
|
Cancer Genome Atlas Research Network, .
Comprehensive molecular profiling of lung adenocarcinoma. Nature.
511:543–550. 2014. View Article : Google Scholar : PubMed/NCBI
|
|
5
|
Segundo-Val IS and Sanz-Lozano CS:
Introduction to the gene expression analysis. Methods Mol Biol.
1434:29–43. 2016. View Article : Google Scholar : PubMed/NCBI
|
|
6
|
Rhodes DR, Yu J, Shanker K, Deshpande N,
Varambally R, Ghosh D, Barrette T, Pandey A and Chinnaiyan AM:
ONCOMINE: A cancer microarray database and integrated data-mining
platform. Neoplasia. 6:1–6. 2004. View Article : Google Scholar : PubMed/NCBI
|
|
7
|
Gyorffy B, Surowiak P, Budczies J and
Lánczky A: Online survival analysis software to assess the
prognostic value of biomarkers using transcriptomic data in
non-small-cell lung cancer. PLoS One. 8:e822412013. View Article : Google Scholar : PubMed/NCBI
|
|
8
|
Lánczky A, Nagy A, Bottai G, Munkácsy G,
Szabó A, Santarpia L and Győrffy B: MiRpower: A web-tool to
validate survival-associated miRNAs utilizing expression data from
2178 breast cancer patients. Breast Cancer Res Treat. 160:439–446.
2016. View Article : Google Scholar : PubMed/NCBI
|
|
9
|
Zhu Y, Peng Q, Lin Y, Zou L, Shen P, Chen
F, Min M, Shen L, Chen J and Shen B: Identification of biomarker
microRNAs for predicting the response of colorectal cancer to
neoadjuvant chemoradiotherapy based on microRNA regulatory network.
Oncotarget. 8:2233–2248. 2017. View Article : Google Scholar : PubMed/NCBI
|
|
10
|
Sarver AL, Sarver AE, Yuan C and
Subramanian S: OMCD: OncomiR cancer database. BMC Cancer.
18:12232018. View Article : Google Scholar : PubMed/NCBI
|
|
11
|
Zhan L, Zhang Y, Wang W, Song E, Fan Y and
Wei B: E2F1: A promising regulator in ovarian carcinoma. Tumour
Biol. 37:2823–2831. 2016. View Article : Google Scholar : PubMed/NCBI
|
|
12
|
Park SA, Platt J, Lee JW, López-Giráldez
F, Herbst RS and Koo JS: E2F8 as a novel therapeutic target for
lung cancer. J Natl Cancer Inst. 107:1512015. View Article : Google Scholar
|
|
13
|
Kurtyka CA, Chen L and Cress WD: E2F
inhibition synergizes with paclitaxel in lung cancer cell lines.
PLoS One. 9:e963572014. View Article : Google Scholar : PubMed/NCBI
|
|
14
|
Rotgers E, Rivero-Müller A, Nurmio M,
Parvinen M, Guillou F, Huhtaniemi I, Kotaja N, Bourguiba-Hachemi S
and Toppari J: Retinoblastoma protein (RB) interacts with E2F3 to
control terminal differentiation of sertoli cells. Cell Death Dis.
5:e12742014. View Article : Google Scholar : PubMed/NCBI
|
|
15
|
Danielian PS, Friesenhahn LB, Faust AM,
West JC, Caron AM, Bronson RT and Lees JA: E2f3a and E2f3b make
overlapping but different contributions to total E2f3 activity.
Oncogene. 27:6561–6570. 2008. View Article : Google Scholar : PubMed/NCBI
|
|
16
|
Lou X, Fu J, Zhao X, Zhuansun X, Rong C,
Sun M, Niu H, Wu L, Zhang Y, An L, et al: MiR-7e-5p downregulation
promotes transformation of low-grade follicular lymphoma to
aggressive lymphoma by modulating an immunosuppressive stroma
through the upregulation of FasL in M1 macrophages. J Exp Clin
Cancer Res. 39:2372020. View Article : Google Scholar : PubMed/NCBI
|
|
17
|
Montojo J, Zuberi K, Rodriguez H, Bader GD
and Morris Q: GeneMANIA: Fast gene network construction and
function prediction for cytoscape. F1000Res. 3:1532014. View Article : Google Scholar : PubMed/NCBI
|
|
18
|
Zhang C, Liu J, Jin N, Zhang G, Xi Y and
Liu H: SiRNA targeting mTOR effectively prevents the proliferation
and migration of human lens epithelial cells. PLoS One.
11:e01673492016. View Article : Google Scholar : PubMed/NCBI
|
|
19
|
Collins TJ: ImageJ for microscopy.
Biotechniques. 43:25–30. 2007. View Article : Google Scholar : PubMed/NCBI
|
|
20
|
Meyers DE, Bryan PM, Banerji S and Morris
DG: Targeting the PD-1/PD-L1 axis for the treatment of
non-small-cell lung cancer. Curr Oncol. 25:e324–e334. 2018.
View Article : Google Scholar : PubMed/NCBI
|
|
21
|
Guinde J, Frankel D, Perrin S, Delecourt
V, Lévy N, Barlesi F, Astoul P, Roll P and Kaspi E: Lamins in lung
cancer: Biomarkers and key factors for disease progression through
miR-9 regulation? Cells. 7:782018. View Article : Google Scholar
|
|
22
|
Suzuki T, Yasui W, Yokozaki H, Naka K,
Ishikawa T and Tahara E: Expression of the E2F family in human
gastrointestinal carcinomas. Int J Cancer. 81:535–538. 1999.
View Article : Google Scholar : PubMed/NCBI
|
|
23
|
Oliveira A, Beyer G, Chugh R, Skube SJ,
Majumder K, Banerjee S, Sangwan V, Li L, Dawra R, Subramanian S, et
al: Triptolide abrogates growth of colon cancer and induces cell
cycle arrest by inhibiting transcriptional activation of E2F. Lab
Invest. 95:648–659. 2015. View Article : Google Scholar : PubMed/NCBI
|
|
24
|
Salon C, Merdzhanova G, Brambilla C,
Brambilla E, Gazzeri S and Eymin B: E2F-1, Skp2 and cyclin E
oncoproteins are upregulated and directly correlated in high-grade
neuroendocrine lung tumors. Oncogene. 26:6927–6936. 2007.
View Article : Google Scholar : PubMed/NCBI
|
|
25
|
Li X, Li H, Zhang R and Liu J and Liu J:
MicroRNA-449a inhibits proliferation and induces apoptosis by
directly repressing E2F3 in gastric cancer. Cell Physiol Biochem.
35:2033–2042. 2015. View Article : Google Scholar : PubMed/NCBI
|
|
26
|
Sherlock G and Ball CA: Storage and
retrieval of microarray data and open source microarray database
software. Mol Biotechnol. 30:239–251. 2005. View Article : Google Scholar : PubMed/NCBI
|
|
27
|
Frank DK, Liu TJ, Frederick MJ and Clayman
GL: Combination E2F-1 and p53 gene transfer does not enhance growth
inhibition in human squamous cell carcinoma of the head and neck.
Clin Cancer Res. 4:2265–2272. 1998.PubMed/NCBI
|
|
28
|
Zhou X, Ji G, Ke X, Gu H, Jin W and Zhang
G: MiR-141 inhibits gastric cancer proliferation by interacting
with long noncoding RNA MEG3 and down-regulating E2F3 expression.
Dig Dis Sci. 60:3271–3282. 2015. View Article : Google Scholar : PubMed/NCBI
|
|
29
|
Xue J, Niu YF, Huang J, Peng G, Wang LX,
Yang YH and Li YQ: MiR-141 suppresses the growth and metastasis of
HCC cells by targeting E2F3. Tumour Biol. 35:12103–12107. 2014.
View Article : Google Scholar : PubMed/NCBI
|
|
30
|
Naeini MM, Tavassoli M and Ghaedi K:
Systematic bioinformatic approaches reveal novel gene expression
signatures associated with acquired resistance to EGFR targeted
therapy in lung cancer. Gene. 667:62–69. 2018. View Article : Google Scholar : PubMed/NCBI
|