Introduction
Globally, primary liver cancer ranks as the sixth
most prevalent cancer and was the third leading cause of
cancer-related deaths in 2022. Estimates indicate ~860,000 new
diagnoses and ~750,000 fatalities worldwide per year (1). In total, 75–85% of all primary liver
cancer cases are classified as hepatocellular carcinoma (HCC)
(2). The principal treatment
modalities currently available for HCC include surgical
intervention, liver transplantation, chemotherapy and radiation
therapy (3). However, ~70% of
patients with HCC will experience a recurrence within 5 years
despite notable therapeutic advancements in recent decades, which
impacts their long-term survival outcomes and quality of life
(4,5). For clinicians, recurrence-free
survival (RFS) time serves as a critical parameter when formulating
individualized therapeutic strategies for patients with HCC
(6). Consequently, developing a
robust predictive model for the probability of HCC recurrence
represents a crucial clinical need.
Advances in large-scale sequencing technology have
enabled the development of multiple prognostic models utilizing
bulk RNA sequencing (RNA-seq) to predict HCC RFS. Gu et al
(7) designed a six-long non-coding
RNA signature for HCC RFS estimation and Wang et al
(8) constructed a seven-gene model.
However, despite the large amount of clinical information in the
bulk dataset, limitations of this sequencing technology result in
expression data that is the average of the expression in the bulk
tissue rather than the expression at the cellular level. This
introduces biological noise that may degrade model performance.
Recently, single-cell (sc)RNA-seq has been increasingly applied in
the study of HCC. Compared with bulk approaches, scRNA-seq
distinguishes individual cell populations and captures their
transcriptional activity at a cellular resolution, providing
notably more information to researchers (9–11).
Researchers increasingly favor combined analytical
frameworks incorporating both single-cell and bulk transcriptomic
data, as they can take advantage of the respective strengths of
both sequencing technologies. Zhou et al (12) identified prognostic ferroptosis
biomarkers that could guide individualized therapeutic strategies
for HCC by integrative analysis of transcriptomic data at different
resolutions. Yu et al (13)
characterized carcinoma-associated fibroblasts in HCC and
established a clinically relevant risk assessment model.
Furthermore, Wang et al (14) reported cellular heterogeneity and
immune infiltration in HCC and uncovered how they contribute to the
immunosuppressive microenvironment.
The present study combined single-cell and bulk
transcriptomic datasets and implemented integrative analysis to
establish an innovative predictive model for HCC recurrence
outcomes.
Materials and methods
Acquisition and cleaning of datasets
from patients with HCC
The present study incorporated one scRNA-seq dataset
and two bulk transcriptomic profiles from human HCC specimens. From
the Gene Expression Omnibus (GEO) database (https://www.ncbi.nlm.nih.gov/geo/), the GSE242889
dataset was retrieved, which included single-cell transcriptomes
from five patients with HCC with corresponding peritumoral controls
(15). Among the five patients,
three were men and two were women, with a median age of 55 years
(range, 42–60 years). Bulk transcriptomic profiles with
corresponding clinical data were acquired from two independent
sources: The Cancer Genome Atlas-Liver Hepatocellular Carcinoma
(TCGA-LIHC) dataset (https://portal.gdc.cancer.gov/) and the GEO dataset,
GSE76427 (16). For analytical
purposes, the TCGA-LIHC cohort served as the training cohort,
whereas the GSE76427 cohort was used for subsequent validation.
Subsequently, data cleanup was performed. In the TCGA-HCC dataset,
only the samples in which the histological type was HCC and the new
event type was locoregional recurrence, extrahepatic recurrence or
intrahepatic recurrence were included. In addition, for these two
bulk RNA-seq datasets, cases missing either RFS data (follow-up
time/status) or RNA-seq profiles data were excluded, even when
clinical annotations were available. Finally, a total of 342
patients with HCC and 50 normal controls from the TCGA-LIHC cohort
were included. The cohort comprised 230 men and 112 women, with a
median age of 61 years (range, 16–90 years). Additionally, 108
patients with HCC from the GSE76427 cohort were analyzed,
consisting of 86 men and 22 women, with a median age of 64 years
(range, 14–93 years).
Analysis of single-cell transcriptomic
profiles
The single-cell transcriptome dataset, GSE242889,
was merged using the Harmony algorithm (17). The samples were then analyzed as
described in our previous study (18), with modifications. First, quality
control measures excluded cells demonstrating either insufficient
sequencing depth (<200 detected genes) or potential multiplets
(>4,000 genes), along with those showing elevated mitochondrial
transcript proportions (≥50%). Second, cellular clustering was
performed using the FindClusters algorithm in Seurat (resolution
parameter, 0.8) (19), which
incorporates the first 17 principal components (PCs) as inputs.
Identifying the differentially
expressed genes (DEGs) associated with RFS
After the cells in the GSE242889 dataset were
classified and annotated, hepatocyte data were extracted for
subsequent analysis. The FindMarkers algorithm in Seurat was
employed to identify DEGs in hepatocytes derived from different
origin samples (19). The
statistical thresholds for DEGs were as follows:
|log2fold-change (FC)|>0.5 and adjusted P<0.05. In
the TCGA-LIHC dataset, differential expression analysis comparing
tumor and normal samples was performed using the ‘limma’ R package
(version 3.44.3) (20), and genes
with |log2 FC|>1 and adjusted P<0.05 were regarded
as DEGs. Subsequently, the associations between the gene expression
profiles and HCC recurrence outcomes were assessed using the
‘survfit’ function in the ‘survival’ package (https://github.com/therneau/survival;
version 3.2.7). The log-rank test result was interpreted with
P<0.05 indicating statistical significance. The overlapping
genes of these results were defined as the DEGs associated with
RFS.
Construction of the prognostic
signature
Survival-related DEGs were utilized as candidate
biomarkers to construct a prognostic signature. Least absolute
shrinkage and selection operator (LASSO) Cox penalized regression
analysis was performed using the R package ‘glmnet’ (version 4.1)
(21), and genes demonstrating
non-zero coefficients were incorporated into the final risk score
calculation. The risk score for each patient with HCC was
calculated as follows: Risk score=Σ (βi × Expi), where βi
represents the non-zero coefficients from LASSO Cox regression and
Expi denotes the expression levels of selected genes. Subsequently,
patients were dichotomized into high- and low-risk groups based on
median risk score stratification, followed by Kaplan-Meier survival
analysis.
Functional enrichment and immune
infiltration analysis
To identify the underlying mechanisms that affect
HCC, the DEGs between the high- and low-risk subgroups were
obtained. Functional enrichment analysis was then performed using
the ‘clusterProfiler’ package (version 4.7.1) to identify
significantly enriched Kyoto Encyclopedia of Genes and Genomes
(KEGG) pathways and Gene Ontology (GO) terms among these DEGs
(22). Gene Set Enrichment Analysis
(GSEA) was performed for the genes in the prognostic signature to
further elucidate their biological functions. Additionally, the
relative abundances of 22 immune cell subtypes within HCC samples
were quantified using the CIBERSORT algorithm (23), and the immune-related score was
calculated using the ‘estimate’ R package (version 1.0.13)
(24).
Analysis of prognostic factors for
patients with HCC
To isolate independent recurrence predictors,
univariate Cox regression was first applied, followed by
multivariate analysis for 155 patients with HCC with complete
clinical variables. These variables included age, sex, body mass
index, tumor (T) stage, lymph node (N) stage, metastasis (M) stage,
grade, pathological stage, α-fetoprotein level, Child-Pugh score
and the risk score, which were classified using the appropriate
guidelines (25–27).
Validation of the prognostic
signature
Following prognostic signature development, external
validation was performed using the independent GSE76427 cohort. The
prognostic ability of the signature was first assessed using
time-dependent receiver operating characteristic (ROC) curve
evaluation at 6-, 12- and 24-month intervals. Patients were
subsequently dichotomized into high- and low-risk subgroups using
the median risk score as the cutoff threshold, followed by
Kaplan-Meier survival curve analysis.
Reverse transcription-quantitative PCR
(RT-qPCR)
The present study was approved by the Ethics
Committee of the Second Affiliated Hospital of Nanchang University
(Nanchang, China; approval no. 2024–078). Tissue samples were
collected at the Second Affiliated Hospital of Nanchang University
(Nanchang, China) from February 2024 to June 2024. Patients that
were diagnosed with HCC through pathological examination were
included in the present study, while any patients with coexisting
tumors were excluded from the study. A total of five HCC tissue
samples and five adjacent tissue samples were obtained following
documented informed consent from all study participants. Among the
patients, there were four men and one woman, with a median age of
51 years (range, 38–65 years).
RNA was extracted and reverse transcribed from the
HCC and normal tissues. For qPCR, the primers used are presented in
Table I. As the immunoglobulin λ
constant 2 (IGLC2) cDNA sequence was not available on the
National Center for Biotechnology Information website, it was
retrieved and aligned from Ensembl (http://ensemblgenomes.org/). The RT process proceeded
with an initial primer annealing step at 25°C for 5 min, followed
by the main cDNA synthesis reaction at 42°C for 30 min, which was
completed by a brief 5-sec heat inactivation step at 85°C. The qPCR
thermocycling conditions were as follows: Initial denaturation at
95°C for 30 sec. This was followed by 40 cycles of denaturation at
95°C for 15 sec and annealing/extension at 60°C for 30 sec.
Finally, a melting curve analysis was conducted by heating the
samples from 65 to 95°C. To ensure reliability, each experimental
procedure was performed in triplicate, and the study was
independently performed three times. Gene expression levels were
quantified using RT-qPCR with a PrimeScript™ RT Master
Mix (cat. no. RR036A; Takara Bio, Inc.) on an ABI 7500 Real-time
PCR system detection instrument (Applied Biosystems; Thermo Fisher
Scientific, Inc.), with relative expression determined using the
2−ΔΔCq method (28).
 | Table I.Primers used for reverse
transcription-quantitative PCR. |
Table I.
Primers used for reverse
transcription-quantitative PCR.
|
| Primer sequence
(5′-3′) |
|---|
|
|
|
|---|
| Gene | Forward | Reverse |
|---|
| GAPDH |
TCGTGGAAGGACTCATGACC |
TCCACCACCCTGTTGCTGTA |
| CDKN2A |
GGGTTTTCGTGGTTCACATCC |
CTAGACGCTGGCTCCTCAGTA |
| CFHR3 |
TGCATCCGTGTCAATTCTTCA |
CTCGACTCTTGACTGTGGCA |
| CYP2C9 |
GCCTGAAACCCATAGTGGTG |
GGGGCTGCTCAAAATCTTGATG |
| HMGB2 |
CTCCAATACCCTCGGGTGG |
GAAGAAGGCGTACGAGGACA |
| IGLC2 |
CCCCCACCACGGGAGACTA |
AGGGTTTATTGAGTGCAGGGAG |
| JPT1 |
ATAGCTCCCGAGTTTTGCGG |
GCCACCACTAGACTTGGCAC |
Statistical analysis
R software (https://www.r-project.org/; version 4.2.3) was
utilized for statistical analysis. The data are presented as mean ±
SD from experiments conducted more than three times. Differences
between two groups were analyzed using a two-sided unpaired
Student's t-test. The Kaplan-Meier method was employed to plot
survival curves, and differences were assessed using the log-rank
test. The Cox proportional hazards model was used to determine
independent factors. P<0.05 was considered to indicate a
statistically significant difference.
Results
Cell types in the scRNA-seq
datasets
From the original 60,284 cells in the GSE242889
dataset, the quality control pipeline retained 57,219 cells that
passed all quality thresholds for downstream processing (Fig. 1A-D). The single-cell data were
subsequently segregated into 30 distinct clusters, from which
24,630 characteristic marker genes were detected (Fig. 1E; Table
SI). The 10 most significant markers per cluster were
visualized using a heatmap (Fig.
1F). The results revealed that clusters 0, 9, 10, 11, 17, 18,
22, 26 and 28, containing 20,317 cells, were hepatocytes; clusters
3, 6, 12, 19, 20 and 25, containing 10,299 cells, were monocytes;
clusters 1, 7 and 21, containing 6,824 cells, were T cells;
clusters 2 and 24, containing 8,693 cells, were macrophages;
clusters 5, 16, 23 and 29, containing 4,667 cells, were B cells;
clusters 8, 13 and 27, containing 3,749 cells, were endothelial
cells; cluster 14, containing 1,299 cells, was tissue stem cells;
cluster 15, containing 1,091 cells, was neutrophils; and cluster
24, containing 280 cells, was common myeloid progenitors (Fig. 1G).
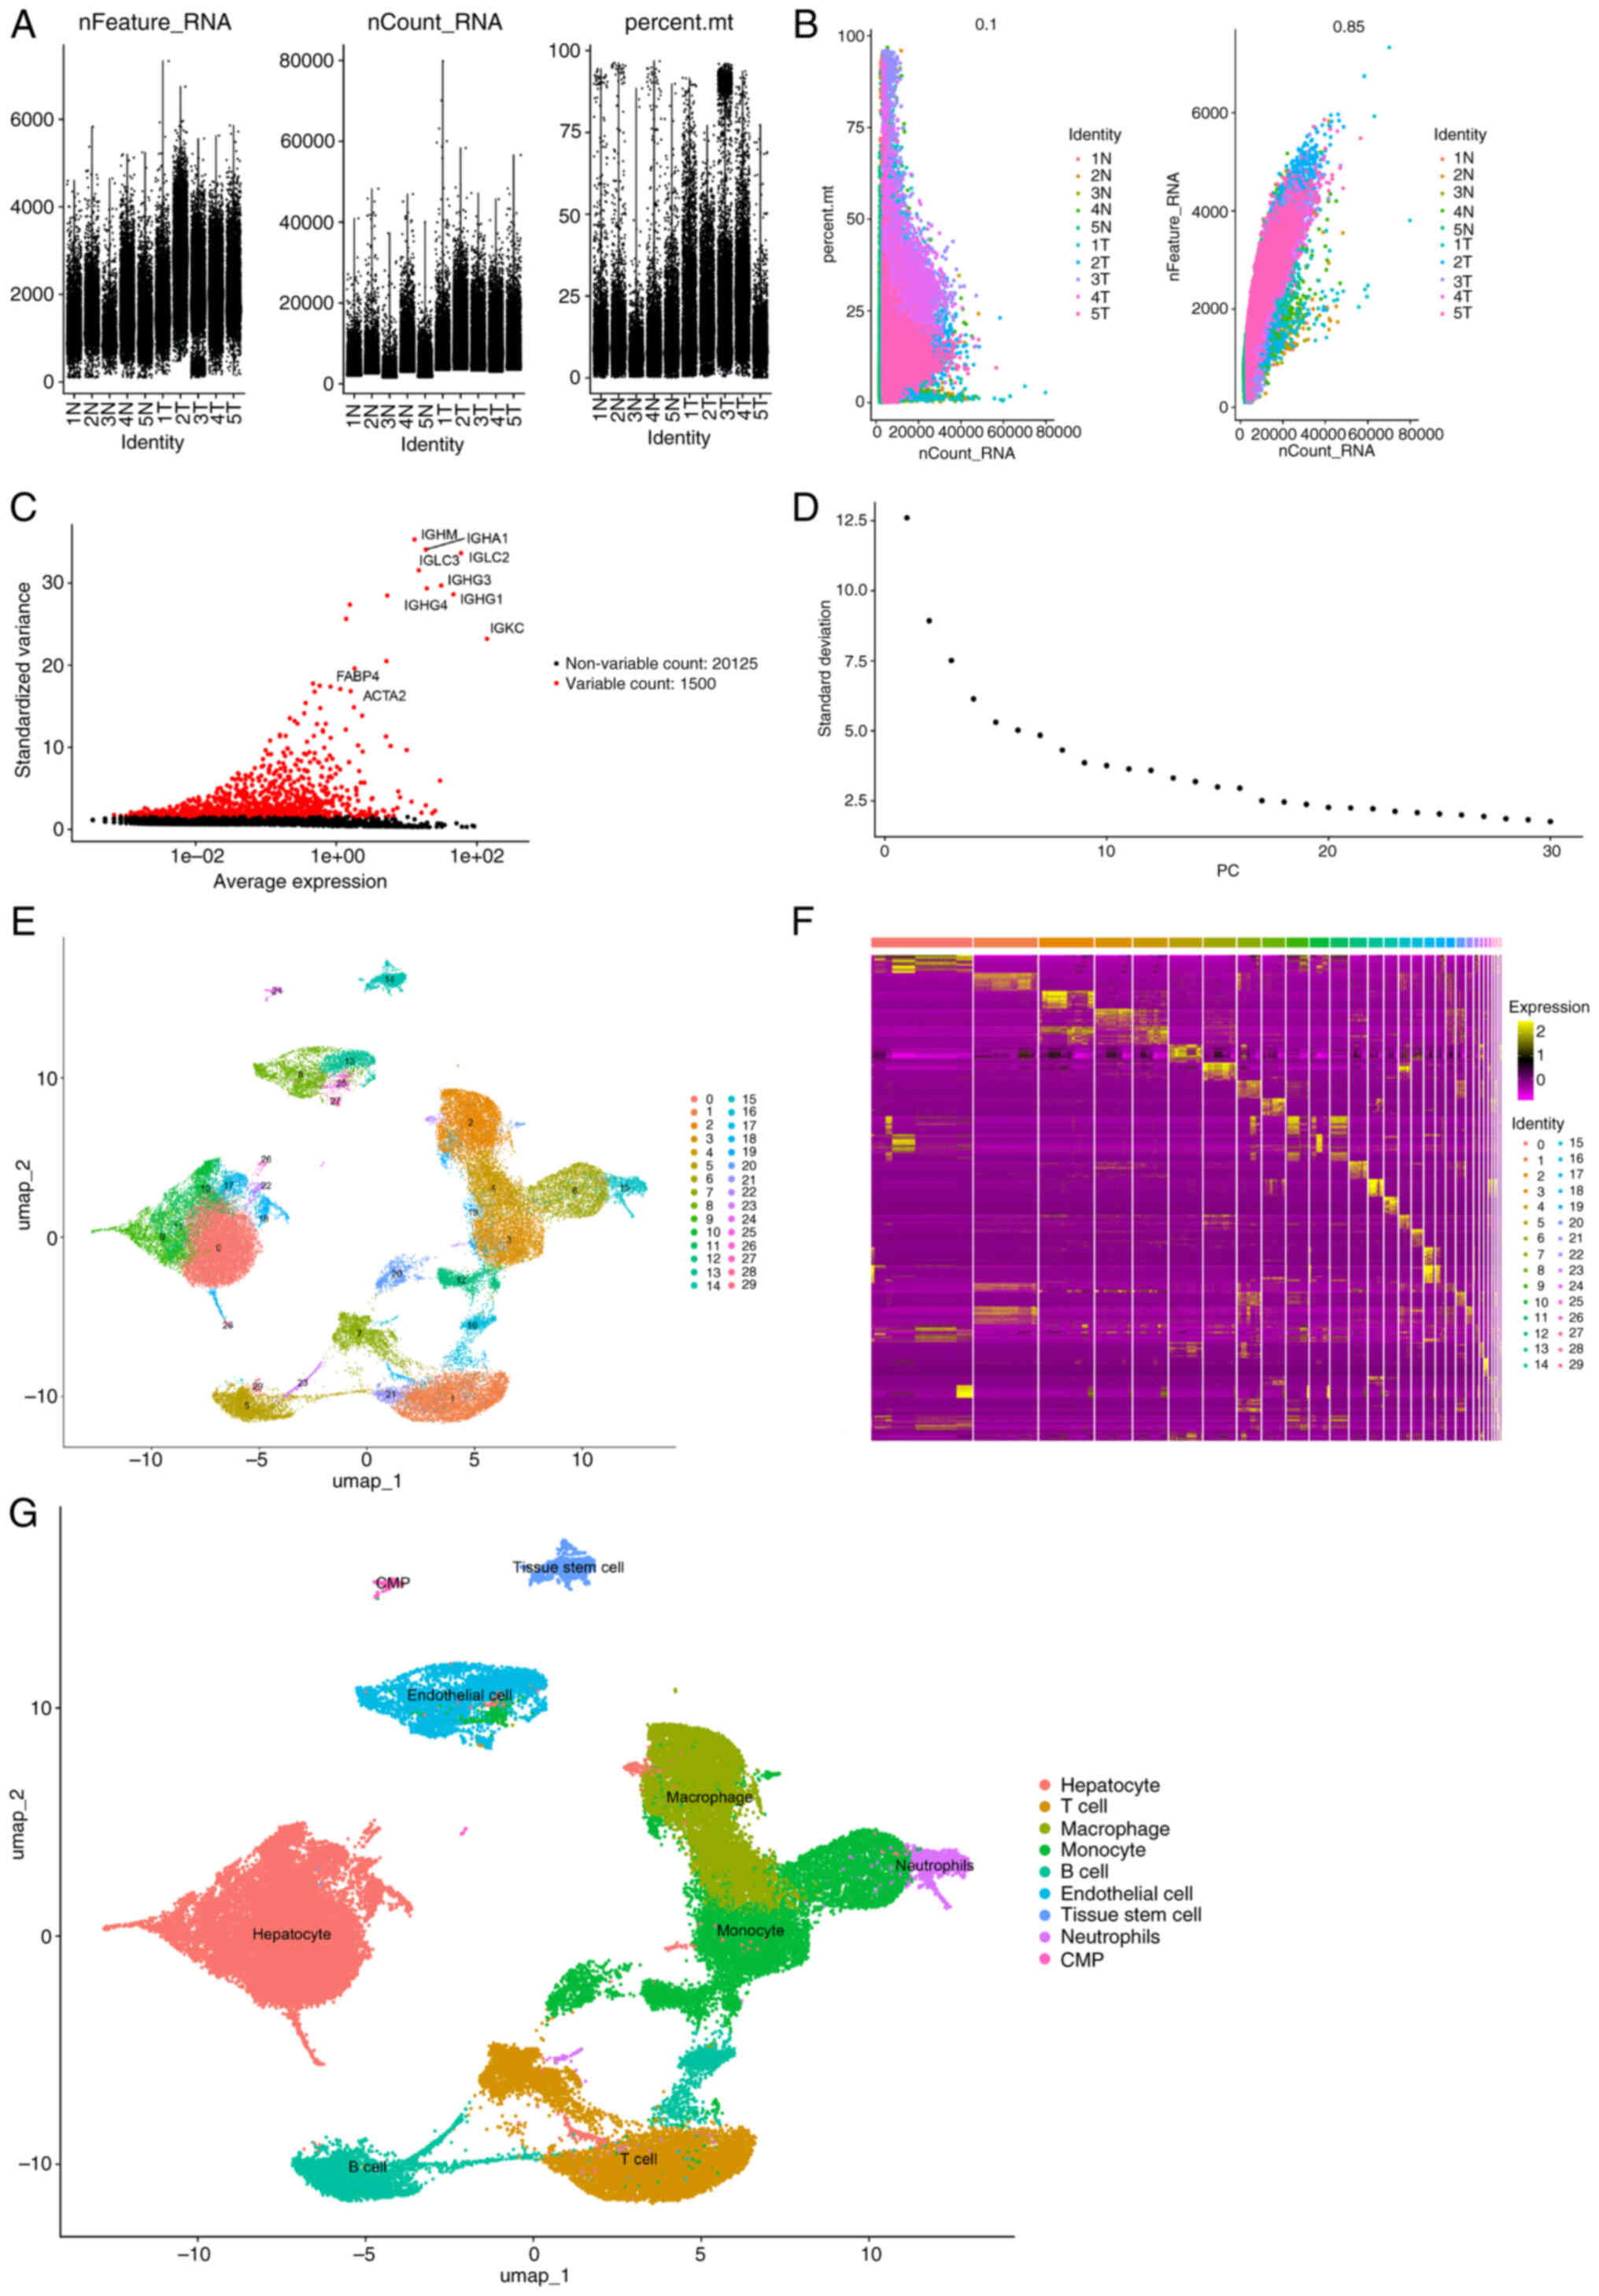 | Figure 1.Processing of the GSE242889 dataset.
(A) Data from 57,219 cells were used for classification and
annotation analysis. (B) Correlation analysis of sequencing depth,
mitochondrial gene sequences and total intracellular sequences. (C)
Among the 21,625 genes analyzed, 1,500 had high variation and
20,125 had low intercellular variation. (D) A total of 17 PCs were
selected for further analysis. (E) Cells were divided into 30
separate clusters with a resolution of 0.8. (F) Heatmap displaying
the top 10 marker genes in each cluster. (G) UMAP plot
demonstrating the different cell types. CMP, common myeloid
progenitor; UMAP, Uniform Manifold Approximation and Projection; N,
normal; T, tumor. PCs, Principal Components; percent.mt, percentage
of the mitochondrial transcriptome. |
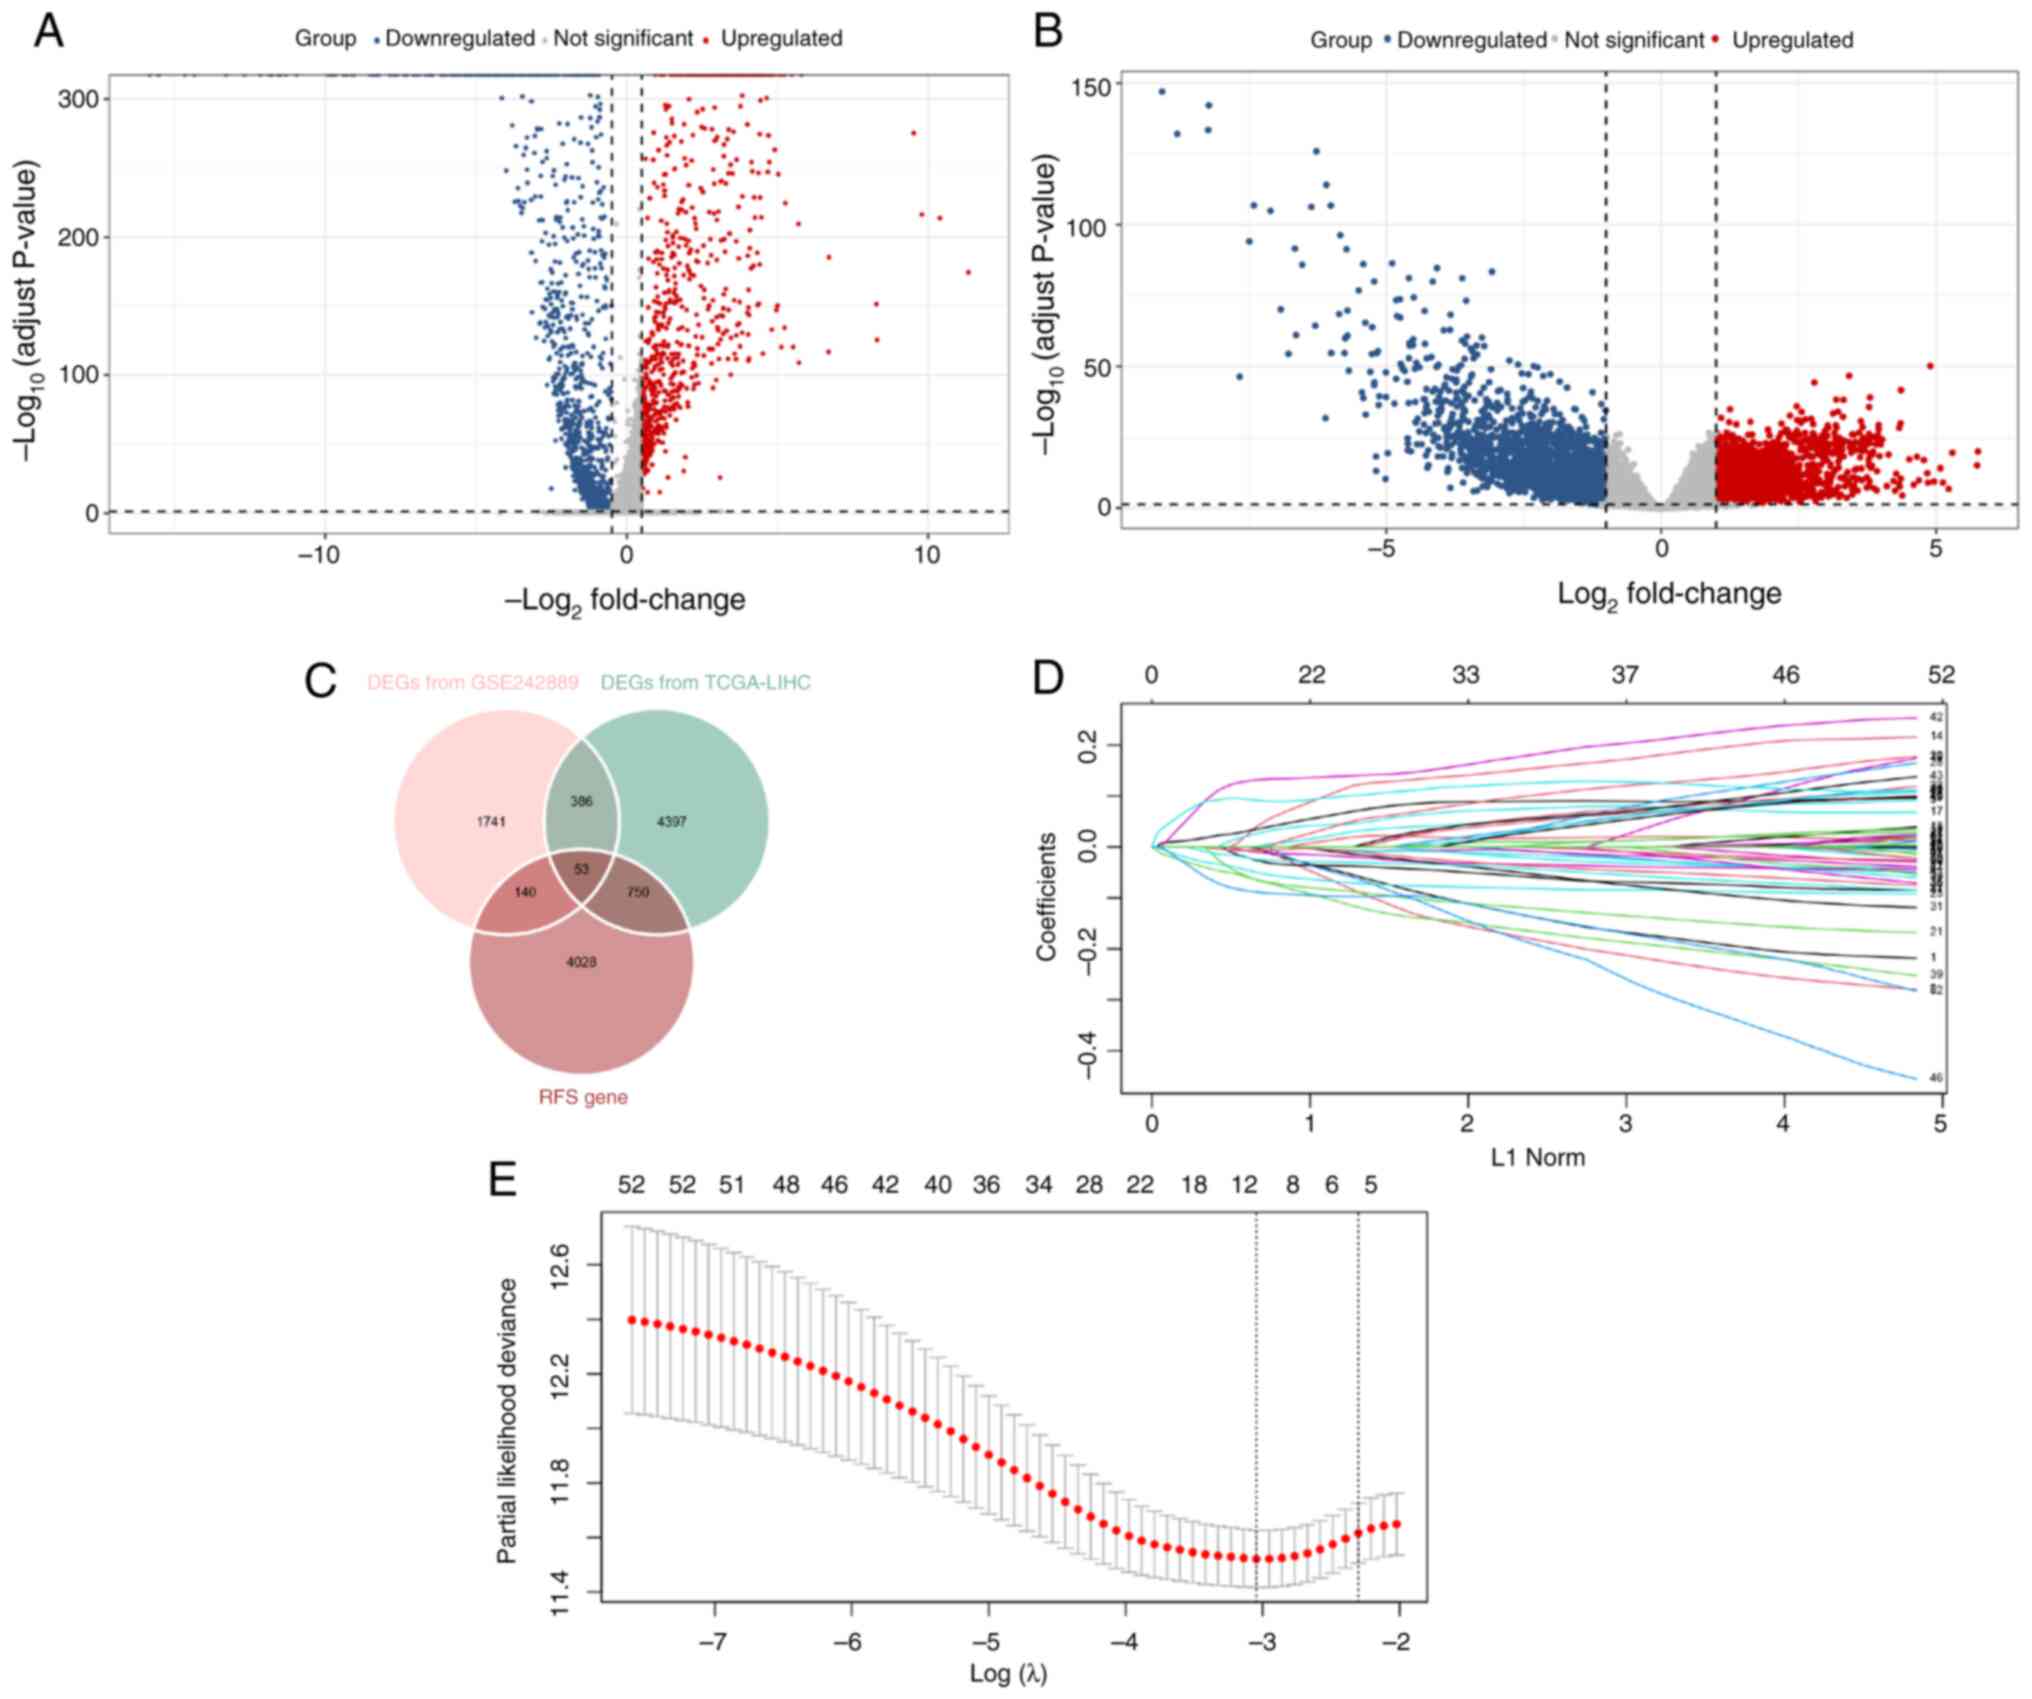
DEGs associated with RFS
Among the 20,317 hepatocytes in the GSE242889
dataset, 17,560 cells were from HCC samples, and 2,757 cells were
from adjacent nontumor samples. A total of 2,320 DEGs were
identified in these cellular populations, comprising 752
significantly upregulated genes and 1,568 significantly
downregulated genes (Fig. 2A). In
the TCGA-LIHC dataset, 5,586 DEGs were detected, with 2,637
demonstrating increased expression and 2,949 showing decreased
expression levels (Fig. 2B). In
addition, the analysis revealed that 4,971 genes were significantly
associated with HCC recurrence outcomes. By intersecting these
results, 53 RFS-related DEGs were identified that were incorporated
into the prognostic signature (Fig.
2C).
Prognostic signature construction
Through regularization with LASSO Cox regression, a
risk score prognostic signature based on six genes
[cyclin-dependent kinase inhibitor 2A (CDKN2A), complement
factor H-related 3 (CFHR3), cytochrome P450 family 2
subfamily C member 9 (CYP2C9), high mobility group box 2
(HMGB2), IGLC2 and Jupiter microtubule-associated
homolog 1 (JPT1)] was constructed (Fig. 2D and E). The risk score was
calculated as follows: Risk score=(0.009 × expression of
CDKN2A)-(0.019 × expression of CFHR3)-(0.010 ×
expression of CYP2C9) + (0.019 × expression of
HMGB2)-(0.012 × expression of IGLC2) + (0.048 ×
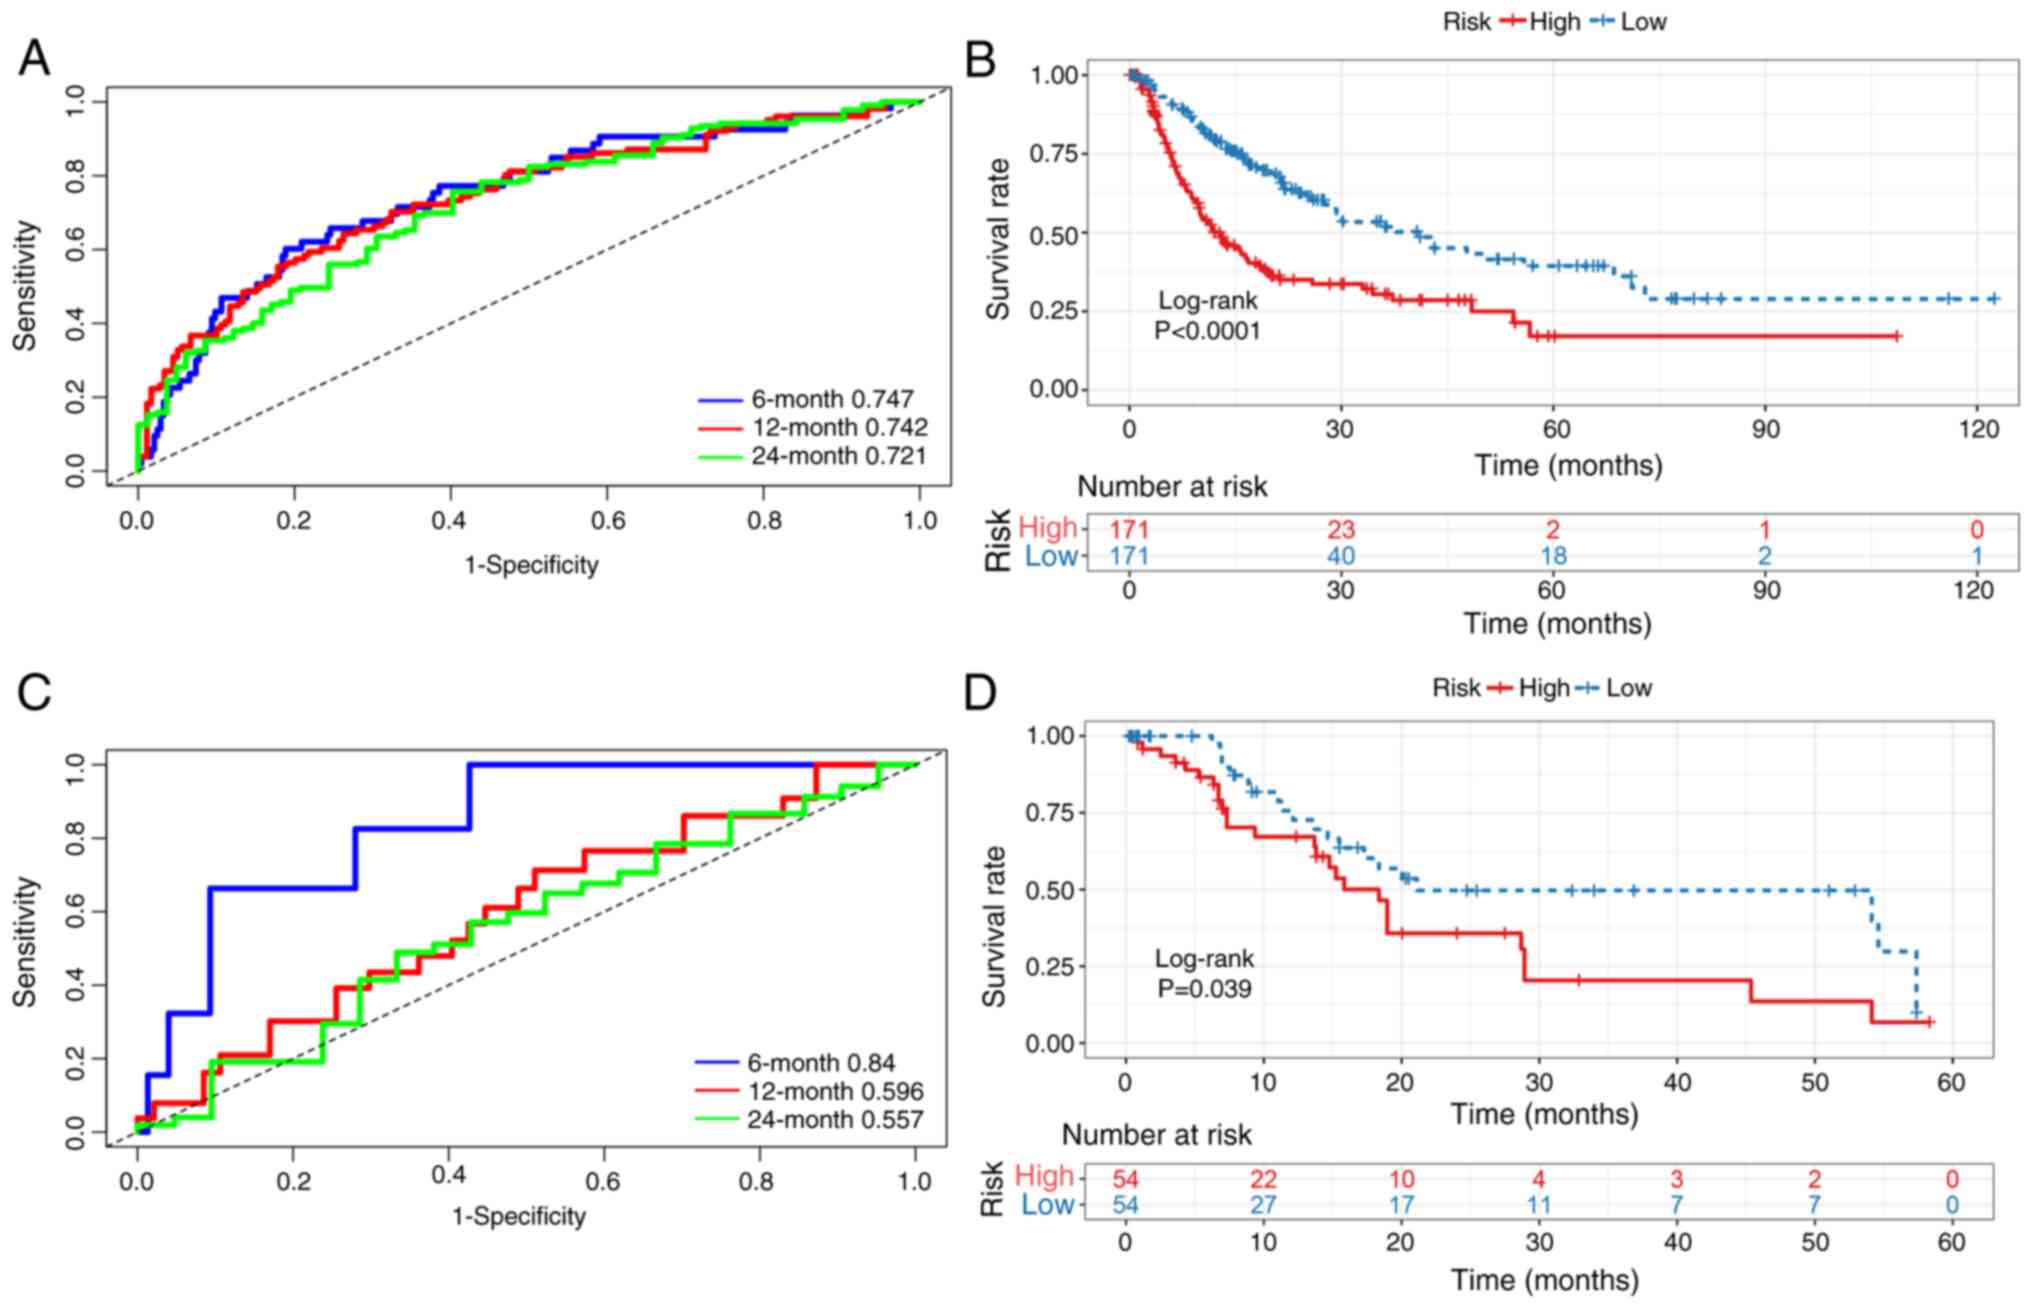
expression of JPT1). Time-dependent ROC analysis
demonstrated robust predictive accuracy for RFS, with 6-, 12- and
24-month area under the curve (AUC) values of 0.747, 0.742 and
0.721, respectively (Fig. 3A).
Furthermore, patients in the high-risk subgroup exhibited
significantly worse survival outcomes than those in the low-risk
subgroup (Fig. 3B).
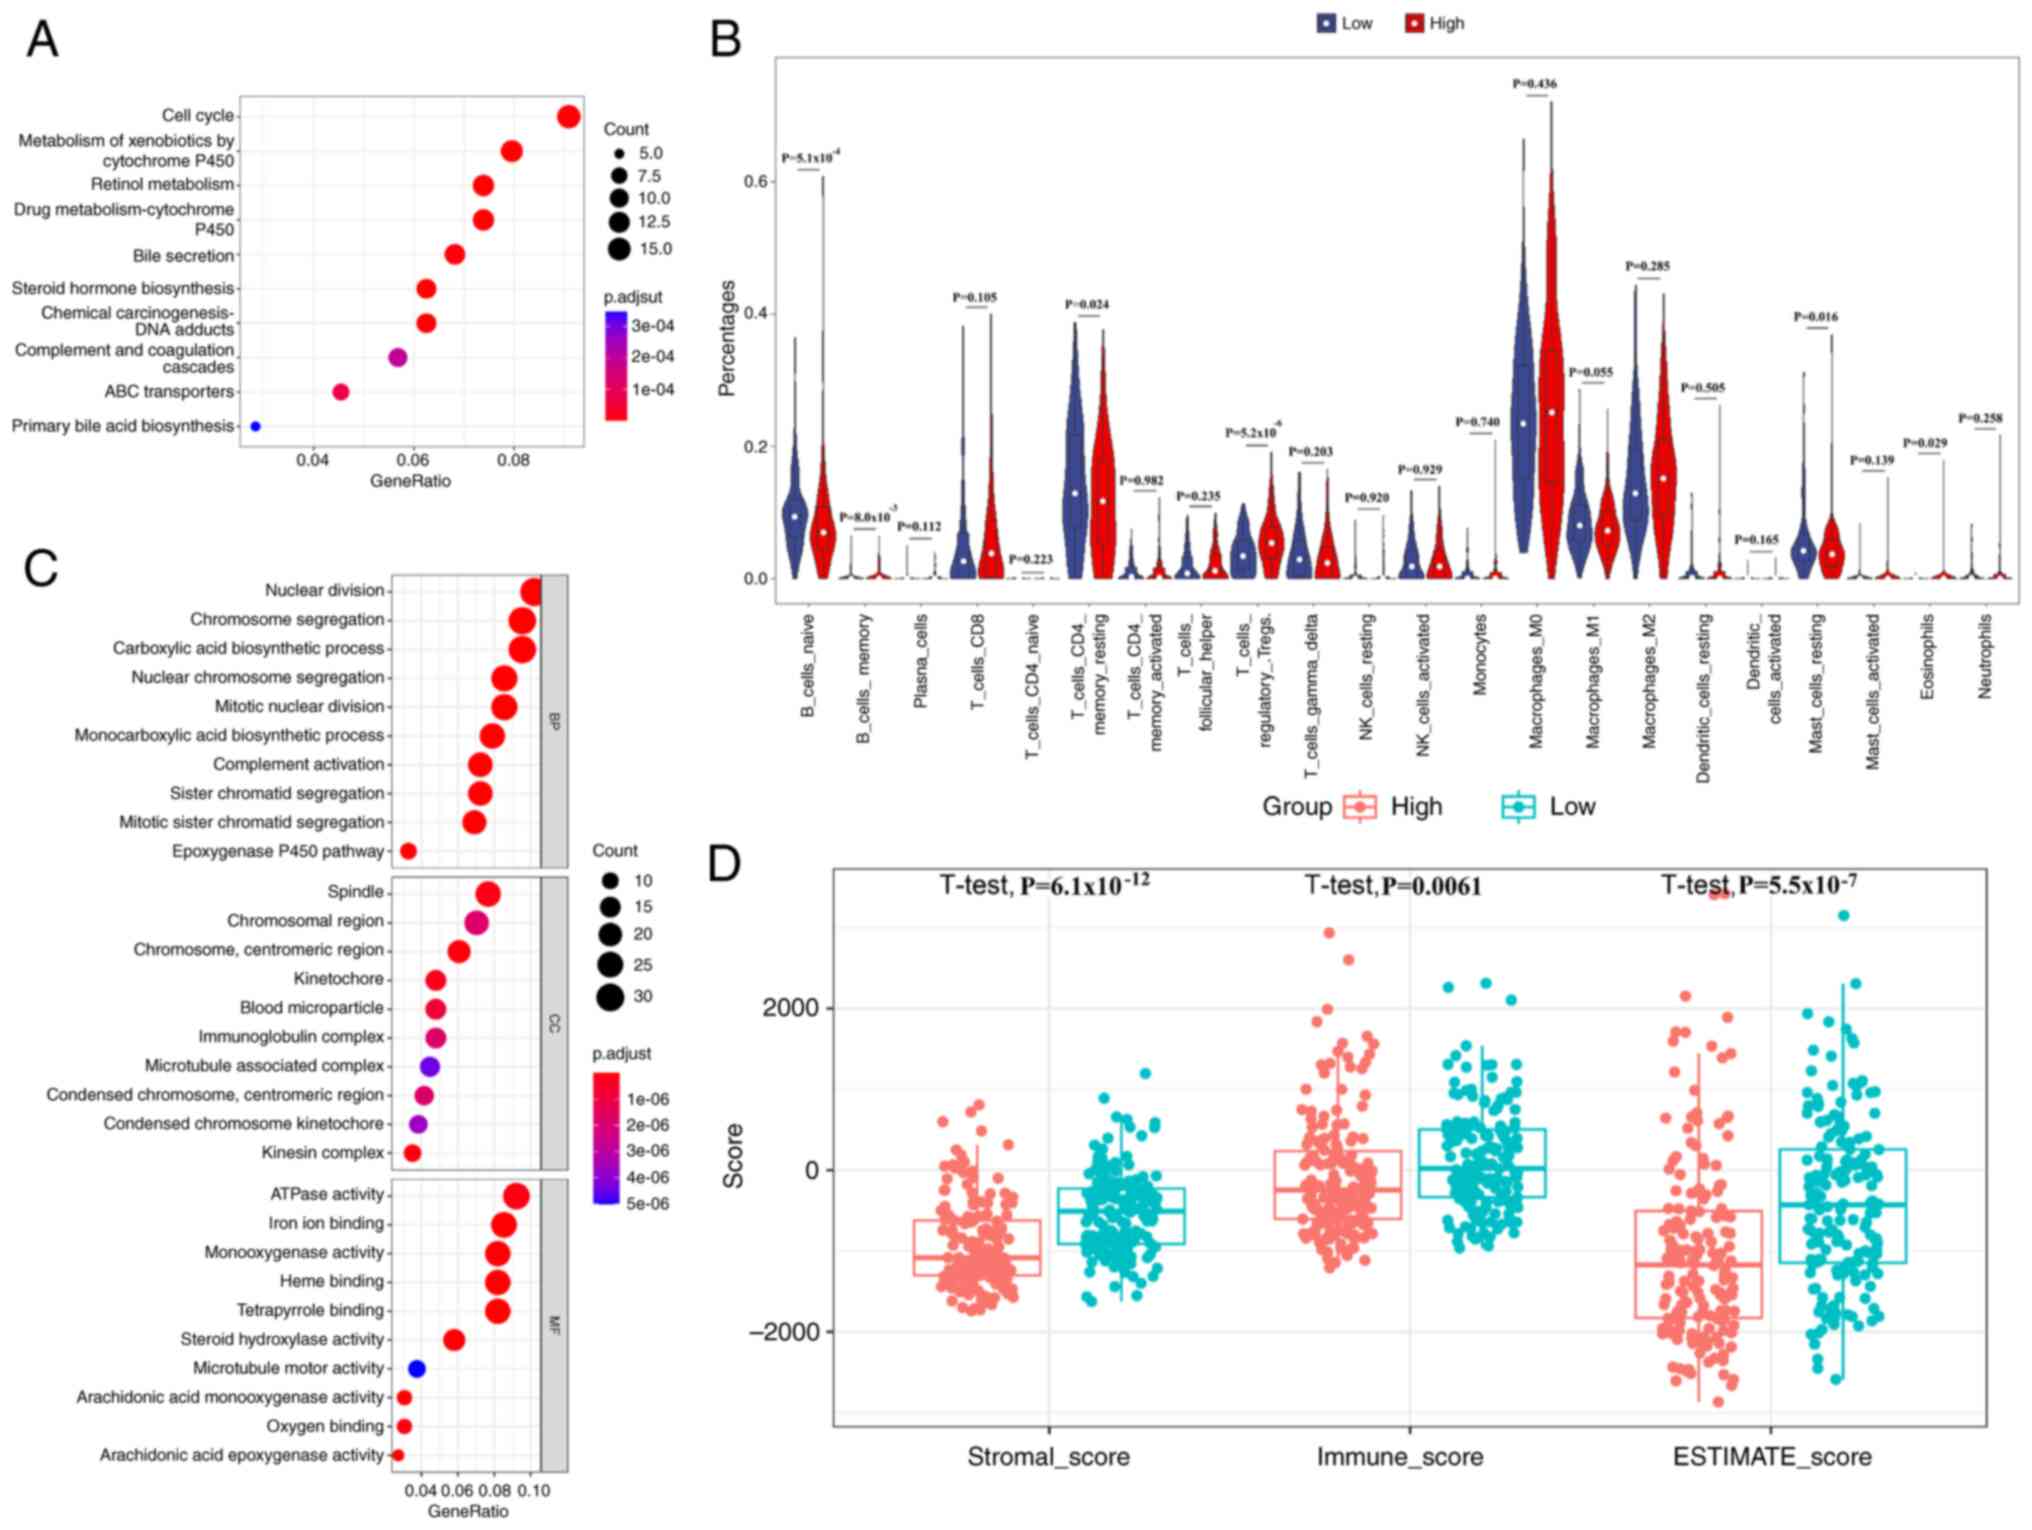
Enrichment and immune infiltration
analyses
Differential expression analysis identified 525
genes distinguishing high- and low-risk patients. KEGG pathway
enrichment revealed predominant involvement in the ‘cell cycle’,
‘metabolism of xenobiotics by cytochrome P450’, ‘retinol
metabolism’, ‘drug metabolism-cytochrome P450’, ‘bile secretion’
and ‘chemical carcinogenesis-DNA adducts’ (Fig. 4A). Furthermore, GO analysis was used
to characterize the functional attributes of the identified DEGs
systematically (Fig. 4C).
Biological processes were predominantly associated with ‘nuclear
division’, ‘chromosome segregation’ and ‘carboxylic acid
biosynthetic process’, cellular components were enriched in
‘spindle’, ‘chromosomal region’ and ‘chromosome, centromeric
region’, and molecular functions were significantly represented by
‘ATPase activity’, ‘iron ion binding’ and ‘monooxygenase activity’.
The results of the GSEA analysis of the six genes are presented in
Fig. S1. In addition, CIBERSORT
analysis revealed that the high-risk cohort had significantly fewer
naive and memory B cells, memory resting CD4+ T cells
and resting mast cells than the low-risk cohort, indicating
immunosuppression (Fig. 4B).
Moreover, the stromal score, immune score and estimate score of the
high-risk group were significantly lower than those of the low-risk
group (Fig. 4D).
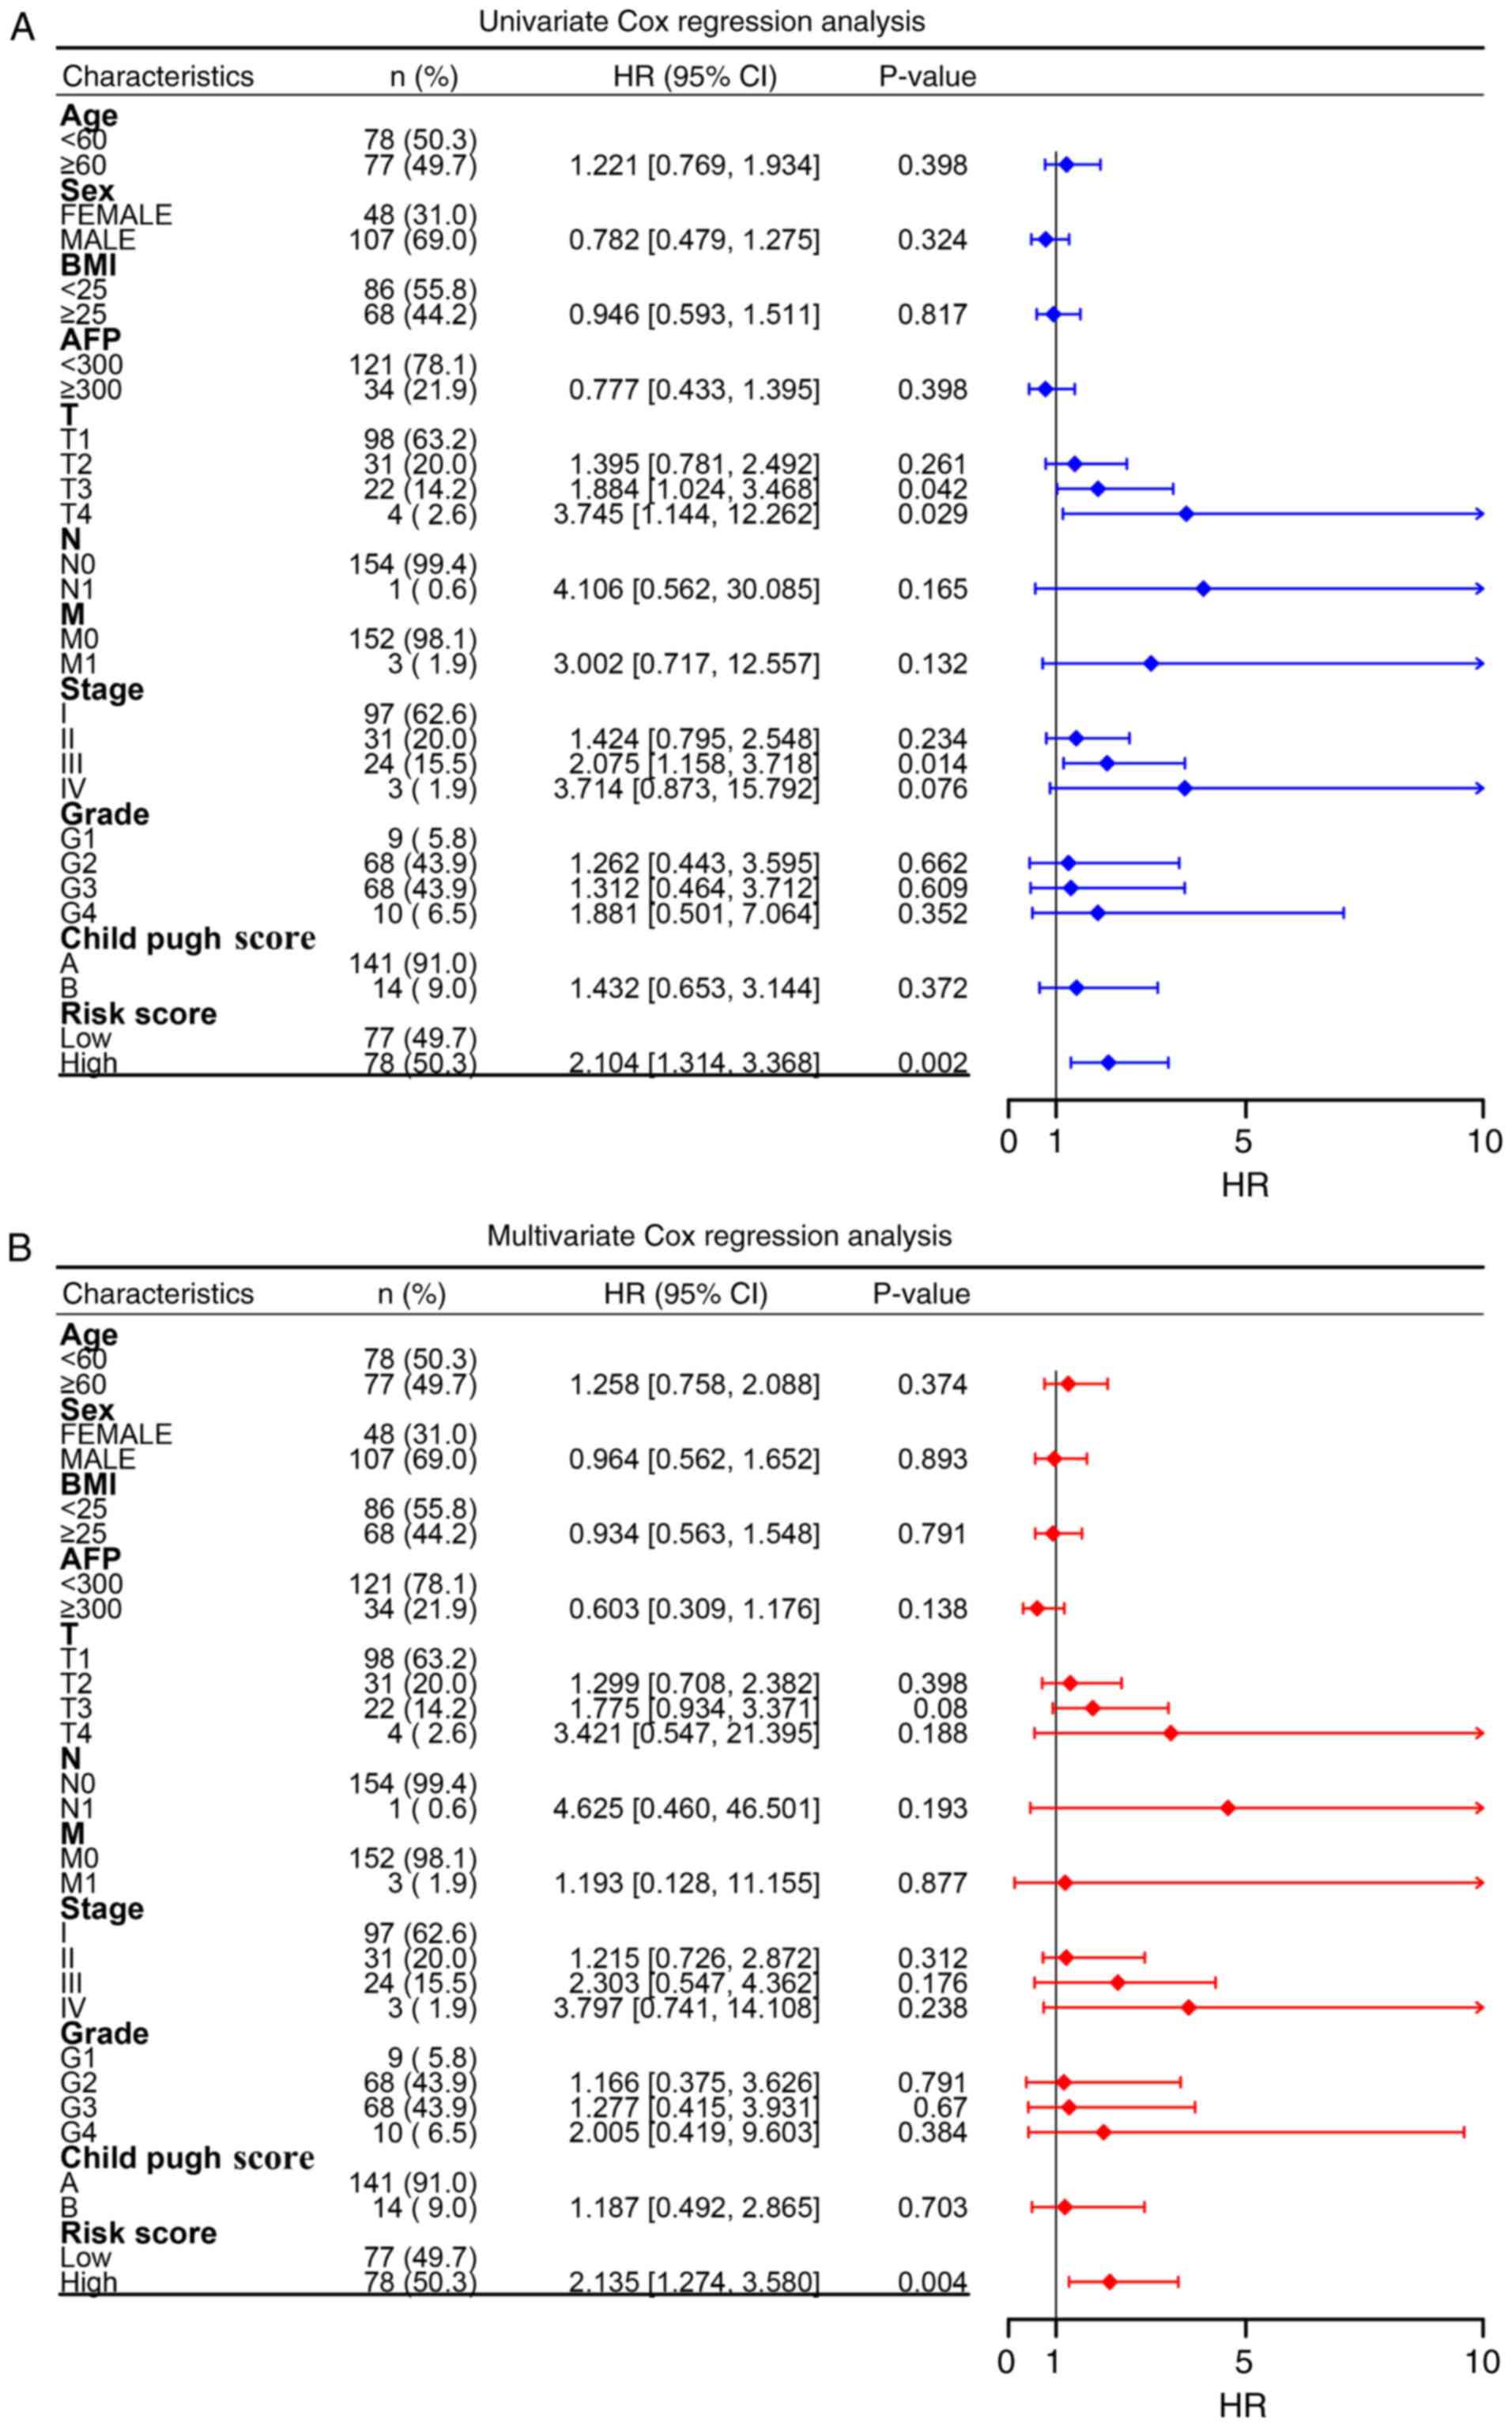
Prognostic independence of the risk
score signature
Univariate Cox regression revealed that T stage,
pathological stage and the risk score were significant predictors
of HCC recurrence (Fig. 5A).
However, subsequent adjustment demonstrated that only the
prognostic signature retained independent predictive value,
suggesting that HCC management could be augmented by incorporating
the molecular signature assessment for more precise recurrence
prediction (Fig. 5B).
Prognostic signature validation
As an externally validated dataset, the GSE76427
dataset was used to independently assess robustness and clinical
applicability of the prognostic signature. Time-dependent ROC
analysis demonstrated strong discriminative ability at 6 months
(AUC, 0.840), with a maintained predictive value at 12 months (AUC,
0.596) and 24 months (AUC, 0.557) (Fig.
3C). Consistent with these findings, Kaplan-Meier analysis
revealed significantly worse outcomes in the high-risk patients
compared with that in the low-risk patients (Fig. 3D), indicating the robust predictive
capacity of the integrated single-cell and bulk
transcriptome-derived signature.
Clinical samples validation
The RT-qPCR results revealed that CDKN2A,
HMGB2 and JPT1 were significantly upregulated in HCC
tumor tissues compared with in adjacent normal tissues (Fig. 6A-C), whereas CFHR3, CYP2C9
and IGLC2 were significantly downregulated in tumor tissues,
compared with that in adjacent normal tissues (Fig. 6D-F). Notably, these experimental
findings corroborated those of the prognostic signature,
reinforcing its validity and implying potential functional roles
for the signature genes.
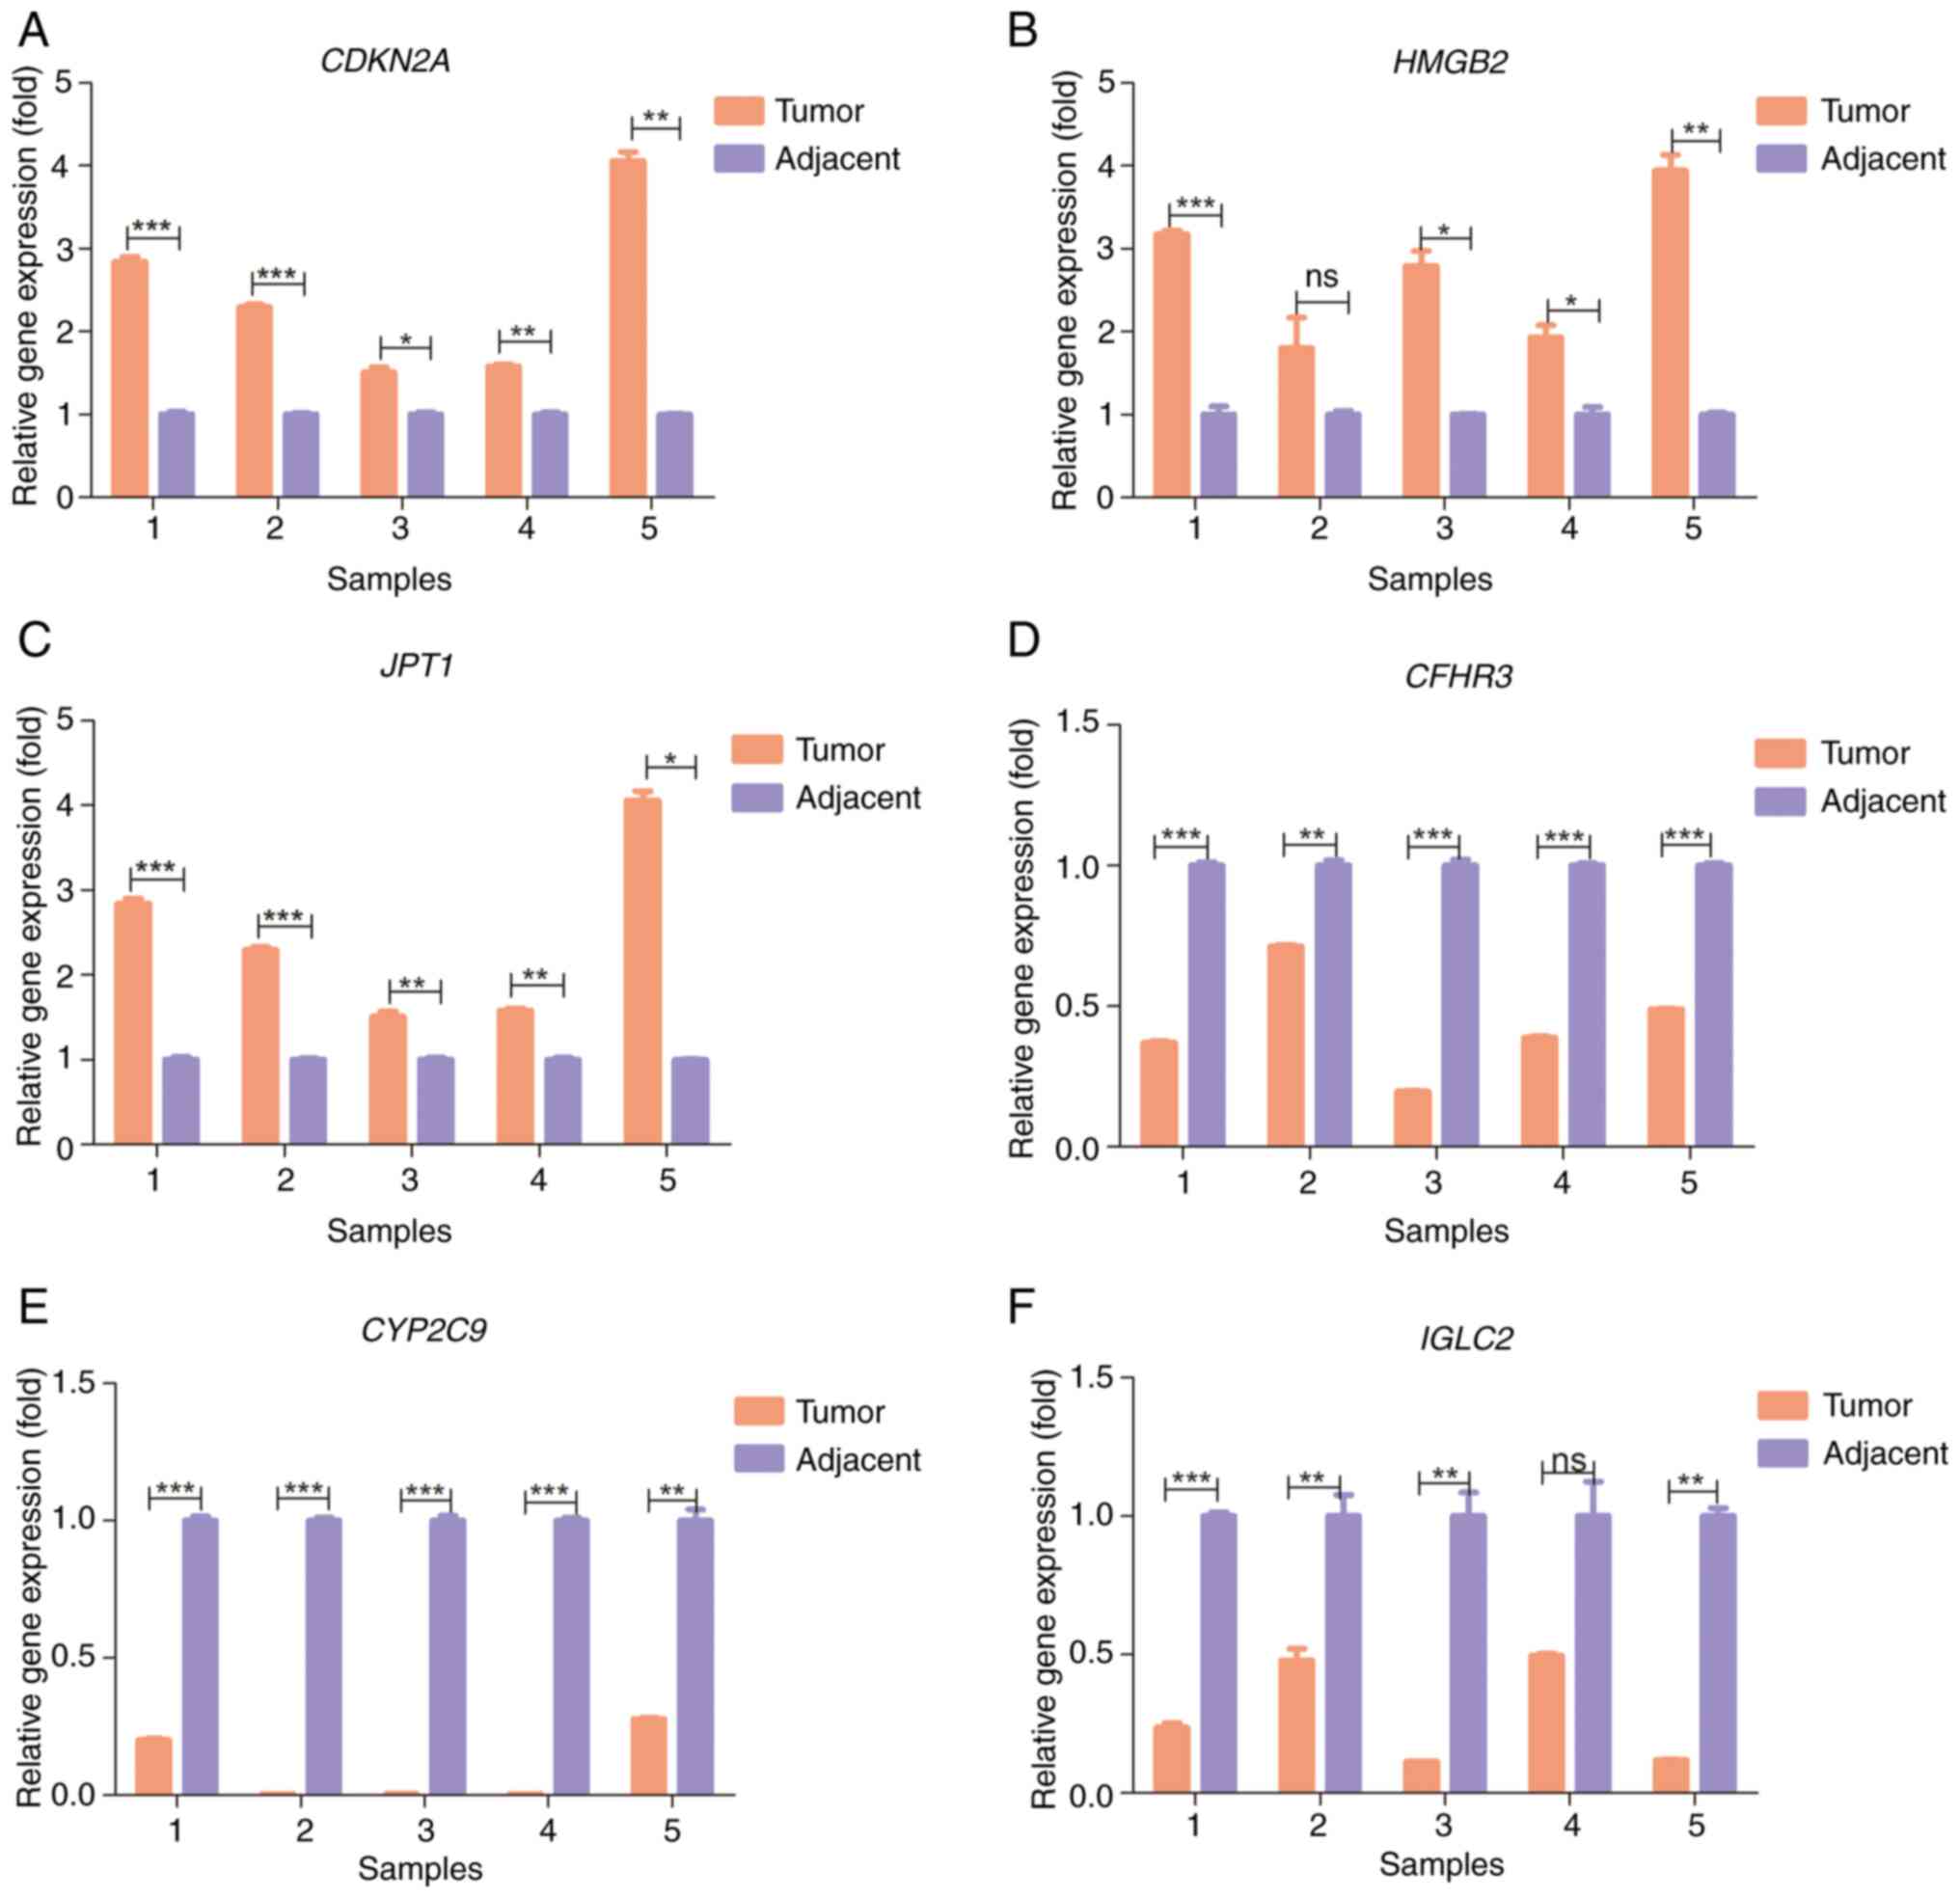 | Figure 6.Reverse transcription-quantitative
PCR of five pairs of tumor tissues and adjacent normal tissues from
patients with hepatocellular carcinoma. Relative gene expression of
(A) CDKN2A, (B) HMGB2, (C) JPT1, (D)
CFHR3, (E) CYP2C9 and (F) IGLC2. *P<0.05;
**P<0.01; ***P<0.001. CDKN2A, cyclin-dependent kinase
inhibitor 2A; CFHR3, complement factor H-related 3;
CYP2C9, cytochrome P450 family 2 subfamily C member 9;
HMGB2, high mobility group box 2; IGLC2,
immunoglobulin λ constant 2; JPT1, Jupiter
microtubule-associated homolog 1; ns, not significant. |
Discussion
The recurrence of HCC severely impairs patient
outcomes, representing a critical clinical challenge that demands
resolution. Although several prognostic models for HCC RFS have
been reported (8,29), there is a scarcity of models that
combine single-cell and bulk RNA sequencing for this purpose. The
present study first analyzed the scRNA-seq dataset GSE242889 and
extracted hepatocyte data to identify DEGs. The DEGs associated
with RFS from the bulk dataset TCGA-LIHC were simultaneously
acquired. LASSO Cox penalized regression analysis was subsequently
performed for these overlapping genes to establish the prognostic
model. External validation was performed with the GSE76427 dataset,
with additional experimental confirmation performed using RT-qPCR.
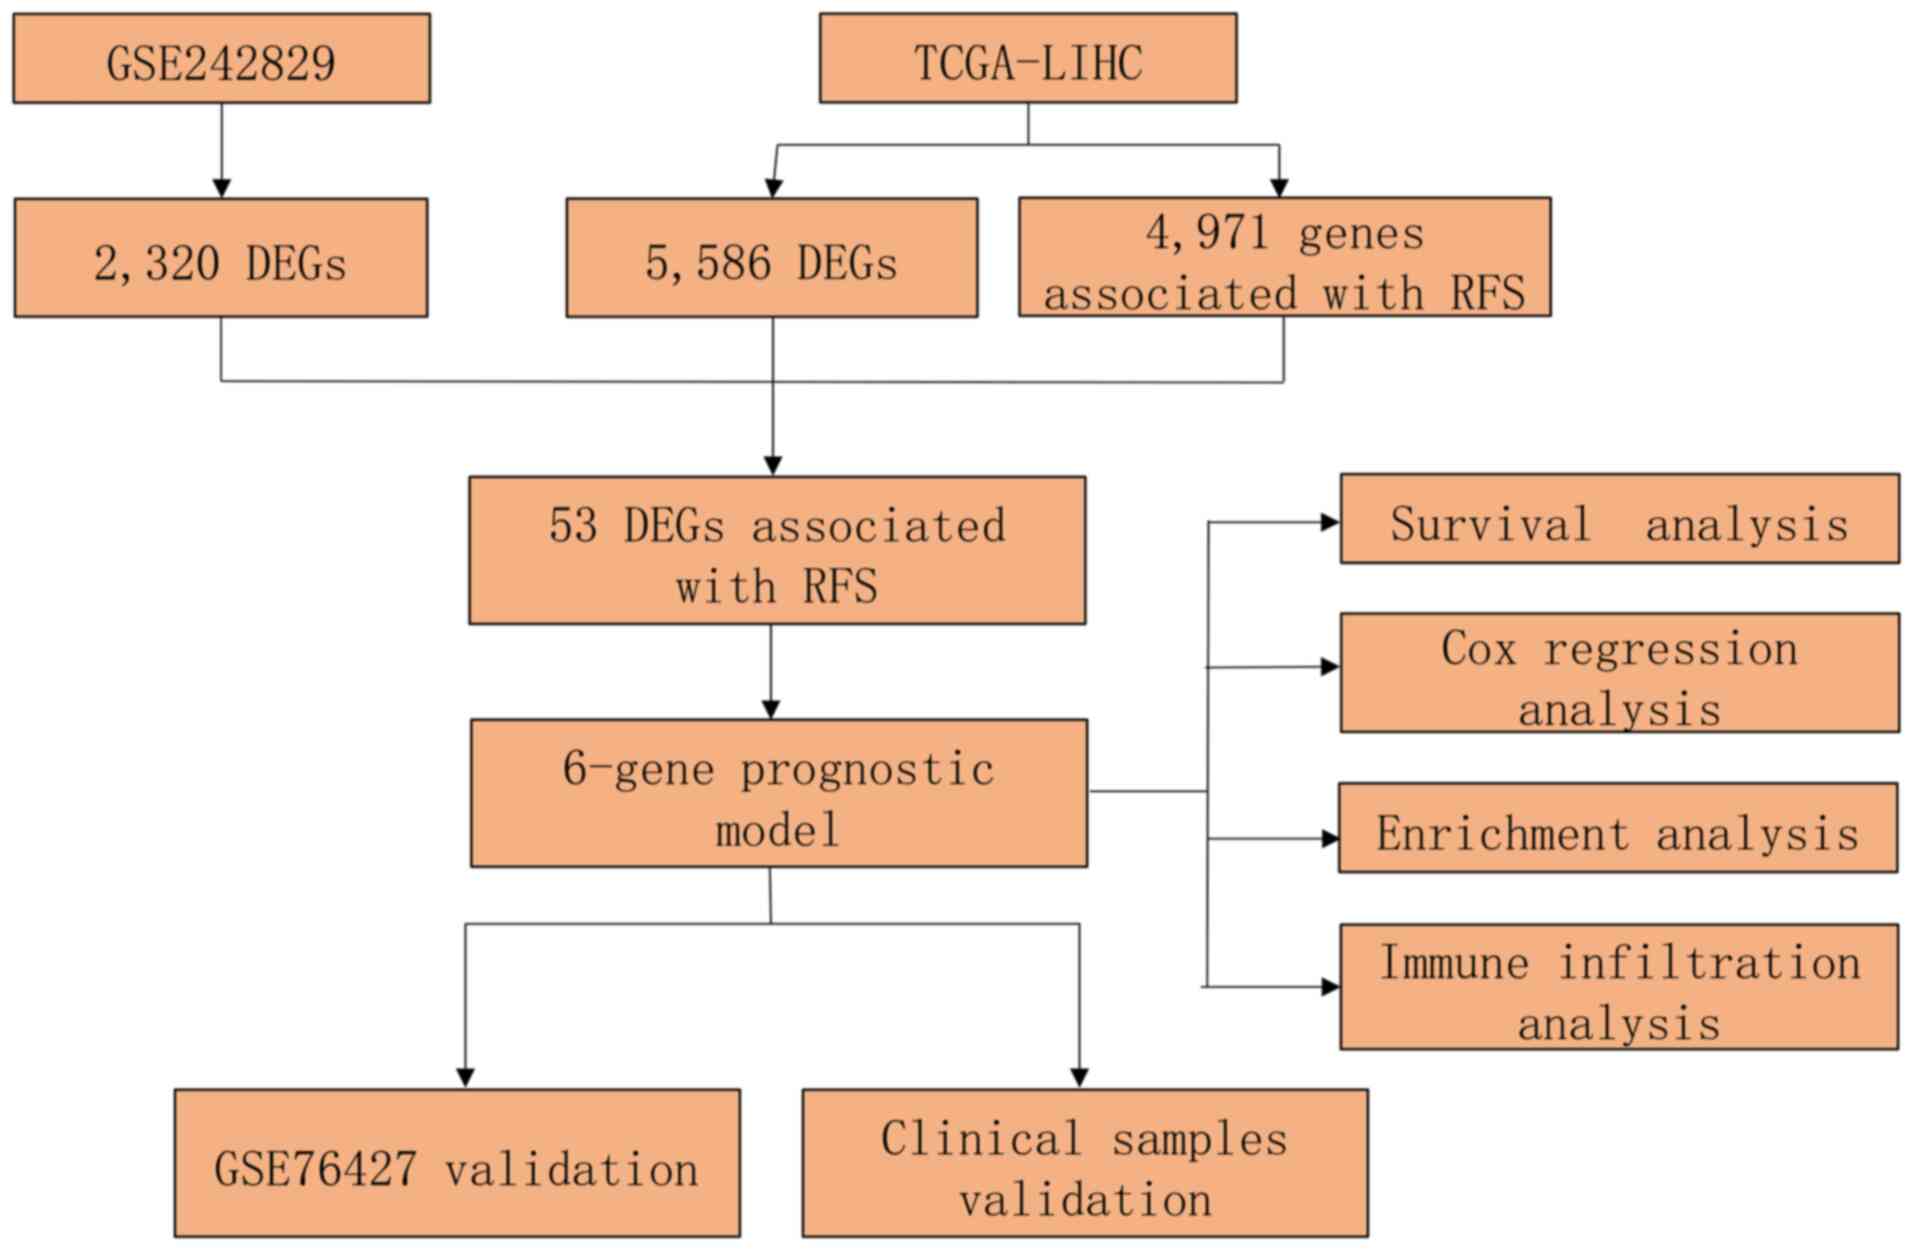
The overall study design is presented in Fig. 7.
In the training dataset, a six-gene (CDKN2A,
CFHR3, CYP2C9, HMGB2, IGLC2 and JPT1) prognostic
signature was constructed to calculate risk scores. To further
elucidate the biological functions of the six genes, GSEA was
performed and the supporting literature was searched. A previous
study suggested that, as an essential regulator of immune cell
functionality, CDKN2A could influence the outcomes of
patients with HCC through the modulation of tumor-associated
macrophages (30). CFHR3 is
a member of the complement factor H-related protein family
(31). Wan et al (32) reported that knockdown of
CFHR3 contributed to the invasion, proliferation and
migration of HCC by promoting STAT3 protein phosphorylation.
CYP2C9 mediates the breakdown of diverse carcinogens and
pharmaceutical molecules and has also been reported as a biomarker
for HCC diagnosis (33).
HMGB2 is a highly conserved nuclear protein that is a member
of the high mobility group protein family (34). Lu et al (35) reported that HMGB2 facilitates
HCC progression by activating the zinc finger E-box-binding
homeobox 1/vimentin axis. The results of the GSEA of the
aforementioned four genes are presented in Fig. S1A-D. JPT1 is also known as
HN1 and serves a critical role in HCC (36,37).
Notably, in the present study, GSEA indicated that it affects
multiple signaling pathways, such as fatty acid metabolism and bile
acid metabolism. Research on IGLC2 in HCC has not been
reported, to the best of our knowledge; however, the GSEA in the
present study suggested that epithelial mesenchymal transition,
inflammatory response and the interferon γ response could be
modulated by IGLC2.
The results of the KEGG analysis revealed
predominant enrichment of DEGs associated with the ‘cell cycle’,
‘metabolism of xenobiotics by cytochrome P450’, ‘drug
metabolism-cytochrome P450’ and ‘chemical carcinogenesis-DNA
adducts’. Several studies have suggested that the cell cycle is a
critical regulator of tumor growth and that the microenvironment
modulates HCC (38,39). Notably, in the present study,
CIBERSORT analysis revealed that the high-risk cohort had fewer
naive and memory B cells, memory resting CD4+ T cells
and resting mast cells than the low-risk cohort, which are features
of immunosuppression. Previous research has reported that
CD4+ T cells serve a pivotal role in orchestrating the
anti-HCC immune microenvironment, and their deficiency disrupts
intercellular immunological crosstalk and facilitates malignant
progression (40). Zhang et
al (41) investigated the
infiltration of B cells and their clinical significance in HCC and
reported that high infiltration of naive and memory B cells was
markedly associated with prolonged survival time. In addition, the
stromal score, immune score and estimate score of the high-risk
group in the presents study were lower than those of the low-risk
group. These findings indicate that there is a significant
difference in the immune microenvironment between the two groups,
and that this difference may be an important factor influencing
recurrence. Therefore, the aforementioned six genes could affect
HCC RFS via these molecular pathways.
In the validation dataset, GSE76427, the AUCs for
6-, 12- and 24-month RFS were 0.840, 0.596 and 0.557, respectively.
Kaplan-Meier analysis also revealed significantly worse outcomes in
high-risk patients than in low-risk patients. In addition, Cox
regression analysis revealed that only the prognostic signature
retained independent predictive value. Notably, the expression
levels of six genes were validated using RT-qPCR. The results
indicate that the prognostic signature has good credibility and
offers value as an independent predictor of the prognosis of
patients with HCC. Unlike previously reported models for predicting
RFS in patients with HCC, the prognostic signature in the present
study was constructed by integrating scRNA-seq and bulk RNA-seq
datasets. Using the prognostic signature, the individualized
survival probability could be calculated for each patient according
to the expression levels of the six genes. For patients at high
risk of recurrence, the model could prompt physicians to pay
greater attention to these patients and offer support for
physicians in making clinical decisions.
In summary, the present study constructed a
prognostic model for predicting RFS in patients with HCC via
integrated analysis of scRNA-seq and bulk RNA-seq data. Unlike most
studies, the present study combined the model with the clinical
information of patients to evaluate whether the model is an
independent prognostic factor affecting survival. Furthermore,
experiments were used to assess the expression of the genes in the
model using clinical samples. This may partially compensate for the
shortcomings of other studies and greatly enhances the clinical
applicability of the model in the present study. Moreover, the
model could serve as a valuable reference tool for clinicians.
However, there are several limitations of the present study. First,
in the validation dataset, the time-dependent AUCs at 12 and 24
months (0.596 and 0.557, respectively) were relatively low,
possibly because as the follow-up period increases, the proportion
of patient deaths caused by non-tumor-related factors increases.
Additionally, as the present study was retrospective, further
prospective, large-scale trials are needed to validate the model.
Finally, the present study did not perform an in-depth experimental
exploration of how the six model genes affect HCC RFS, which needs
to be further explored.
Supplementary Material
Supporting Data
Supporting Data
Acknowledgements
Not applicable.
Funding
The present study was funded by the National Natural Science
Foundation of China (grant no. 91210050).
Availability of data and materials
The data generated in the present study may be
requested from the corresponding author.
Authors' contributions
LZ, WY and WL designed the study. WL, QH and ZL
performed the bioinformatic and statistical analyses. HL and XG
collected the stored clinical samples and acquired the data for
analysis. WY, JM and QL performed the experiments. WY and WL wrote
the original manuscript. LZ reviewed and revised the manuscript.
LZ, WY and WL confirm the authenticity of all the raw data. All
authors have read and approved the final manuscript.
Ethics approval and consent to
participate
The present study was approved by the Ethics
Committee of the Second Affiliated Hospital of Nanchang University
(Nanchang, China; approval no. 2024-078). Documented written
informed consent was obtained from all study participants.
Patient consent for publication
Not applicable.
Competing interests
The authors declare that they have no competing
interests.
Glossary
Abbreviations
Abbreviations:
|
DEGs
|
differentially expressed genes
|
|
FC
|
fold-change
|
|
GEO
|
Gene Expression Omnibus
|
|
GO
|
Gene Ontology
|
|
GSEA
|
Gene Set Enrichment Analysis
|
|
HCC
|
hepatocellular carcinoma
|
|
KEGG
|
Kyoto Encyclopedia of Genes and
Genomes
|
|
LASSO
|
least absolute shrinkage and selection
operator
|
|
RT-qPCR
|
reverse transcription-quantitative
PCR
|
|
ROC
|
receiver operating characteristic
|
|
RFS
|
recurrence-free survival
|
|
RNA-seq
|
RNA sequencing
|
|
scRNA-seq
|
single-cell RNA-seq
|
|
TCGA
|
The Cancer Genome Atlas
|
References
|
1
|
Bray F, Laversanne M, Sung H, Ferlay J,
Siegel RL, Soerjomataram I and Jemal A: Global cancer statistics
2022: GLOBOCAN estimates of incidence and mortality worldwide for
36 cancers in 185 countries. CA Cancer J Clin. 74:229–263.
2024.PubMed/NCBI
|
|
2
|
Arnold M, Abnet CC, Neale RE, Vignat J,
Giovannucci EL, McGlynn KA and Bray F: Global burden of 5 major
types of gastrointestinal cancer. Gastroenterology.
159:335–349.e15. 2020. View Article : Google Scholar : PubMed/NCBI
|
|
3
|
Daher S, Massarwa M, Benson AA and Khoury
T: Current and future treatment of hepatocellular carcinoma: An
updated comprehensive review. J Clin Transl Hepatol. 6:69–78. 2018.
View Article : Google Scholar : PubMed/NCBI
|
|
4
|
Villanueva A: Hepatocellular carcinoma. N
Engl J Med. 380:1450–1462. 2019. View Article : Google Scholar : PubMed/NCBI
|
|
5
|
Martínez-Chantar ML, Avila MA and Lu SC:
Hepatocellular carcinoma: Updates in pathogenesis, detection and
treatment. Cancers (Basel). 12:27292020. View Article : Google Scholar : PubMed/NCBI
|
|
6
|
Singal AG, Kudo M and Bruix J:
Breakthroughs in hepatocellular carcinoma therapies. Clin
Gastroenterol Hepatol. 21:2135–2149. 2023. View Article : Google Scholar : PubMed/NCBI
|
|
7
|
Gu JX, Zhang X, Miao RC, Xiang XH, Fu YN,
Zhang JY, Liu C and Qu K: Six-long non-coding RNA signature
predicts recurrence-free survival in hepatocellular carcinoma.
World J Gastroenterol. 25:220–232. 2019. View Article : Google Scholar : PubMed/NCBI
|
|
8
|
Wang W, Wang L, Xie X, Yan Y, Li Y and Lu
Q: A gene-based risk score model for predicting recurrence-free
survival in patients with hepatocellular carcinoma. BMC Cancer.
21:62021. View Article : Google Scholar : PubMed/NCBI
|
|
9
|
Guo DZ, Zhang X, Zhang SQ, Zhang SY, Zhang
XY, Yan JY, Dong SY, Zhu K, Yang XR, Fan J, et al: Single-cell
tumor heterogeneity landscape of hepatocellular carcinoma:
Unraveling the pro-metastatic subtype and its interaction loop with
fibroblasts. Mol Cancer. 23:1572024. View Article : Google Scholar : PubMed/NCBI
|
|
10
|
Li X, Li R, Miao X, Zhou X, Wu B, Cao J,
Wang C, Li S and Cai J: Integrated single cell analysis reveals an
atlas of tumor associated macrophages in hepatocellular carcinoma.
Inflammation. 47:2077–2093. 2024. View Article : Google Scholar : PubMed/NCBI
|
|
11
|
Sun Y, Wu L, Zhong Y, Zhou K, Hou Y, Wang
Z, Zhang Z, Xie J, Wang C, Chen D, et al: Single-cell landscape of
the ecosystem in early-relapse hepatocellular carcinoma. Cell.
184:404–421.e16. 2021. View Article : Google Scholar : PubMed/NCBI
|
|
12
|
Zhou Q, Tao C, Ge Y, Yuan J, Pan F, Lin X
and Wang R: A novel single-cell model reveals
ferroptosis-associated biomarkers for individualized therapy and
prognostic prediction in hepatocellular carcinoma. BMC Biol.
22:1332024. View Article : Google Scholar : PubMed/NCBI
|
|
13
|
Yu L, Shen N, Shi Y, Shi X, Fu X, Li S,
Zhu B, Yu W and Zhang Y: Characterization of cancer-related
fibroblasts (CAF) in hepatocellular carcinoma and construction of
CAF-based risk signature based on single-cell RNA-seq and bulk
RNA-seq data. Front Immunol. 13:10097892022. View Article : Google Scholar : PubMed/NCBI
|
|
14
|
Wang T, Dang N, Tang G, Li Z, Li X, Shi B,
Xu Z, Li L, Yang X, Xu C and Ye K: Integrating bulk and single-cell
RNA sequencing reveals cellular heterogeneity and immune
infiltration in hepatocellular carcinoma. Mol Oncol. 16:2195–2213.
2022. View Article : Google Scholar : PubMed/NCBI
|
|
15
|
Li K, Zhang R, Wen F, Zhao Y, Meng F, Li
Q, Hao A, Yang B, Lu Z, Cui Y and Zhou M: Single-cell dissection of
the multicellular ecosystem and molecular features underlying
microvascular invasion in HCC. Hepatology. 79:1293–1309. 2024.
View Article : Google Scholar : PubMed/NCBI
|
|
16
|
Grinchuk OV, Yenamandra SP, Iyer R, Singh
M, Lee HK, Lim KH, Chow PK and Kuznetsov VA: Tumor-adjacent tissue
co-expression profile analysis reveals pro-oncogenic ribosomal gene
signature for prognosis of resectable hepatocellular carcinoma. Mol
Oncol. 12:89–113. 2018. View Article : Google Scholar : PubMed/NCBI
|
|
17
|
Korsunsky I, Millard N, Fan J, Slowikowski
K, Zhang F, Wei K, Baglaenko Y, Brenner M, Loh PR and Raychaudhuri
S: Fast, sensitive and accurate integration of single-cell data
with Harmony. Nat Methods. 16:1289–1296. 2019. View Article : Google Scholar : PubMed/NCBI
|
|
18
|
Lai W, Xie R, Chen C, Lou W, Yang H, Deng
L, Lu Q and Tang X: Integrated analysis of scRNA-seq and bulk
RNA-seq identifies FBXO2 as a candidate biomarker associated with
chemoresistance in HGSOC. Heliyon. 10:e284902024. View Article : Google Scholar : PubMed/NCBI
|
|
19
|
Butler A, Hoffman P, Smibert P, Papalexi E
and Satija R: Integrating single-cell transcriptomic data across
different conditions, technologies, and species. Nat Biotechnol.
36:411–420. 2018. View Article : Google Scholar : PubMed/NCBI
|
|
20
|
Ritchie ME, Phipson B, Wu D, Hu Y, Law CW,
Shi W and Smyth GK: limma powers differential expression analyses
for RNA-sequencing and microarray studies. Nucleic Acids Res.
43:e472015. View Article : Google Scholar : PubMed/NCBI
|
|
21
|
Friedman J, Hastie T and Tibshirani R:
Regularization paths for generalized linear models via coordinate
descent. J Stat Softw. 33:1–22. 2010. View Article : Google Scholar : PubMed/NCBI
|
|
22
|
Yu G, Wang LG, Han Y and He QY:
clusterProfiler: An R package for comparing biological themes among
gene clusters. OMICS. 16:284–287. 2012. View Article : Google Scholar : PubMed/NCBI
|
|
23
|
Newman AM, Liu CL, Green MR, Gentles AJ,
Feng W, Xu Y, Hoang CD, Diehn M and Alizadeh AA: Robust enumeration
of cell subsets from tissue expression profiles. Nat Methods.
12:453–457. 2015. View Article : Google Scholar : PubMed/NCBI
|
|
24
|
Yoshihara K, Shahmoradgoli M, Martínez E,
Vegesna R, Kim H, Torres-Garcia W, Treviño V, Shen H, Laird PW,
Levine DA, et al: Inferring tumour purity and stromal and immune
cell admixture from expression data. Nat Commun. 4:26122013.
View Article : Google Scholar : PubMed/NCBI
|
|
25
|
Amin MB, Greene FL, Edge SB, Compton CC,
Gershenwald JE, Brookland RK, Meyer L, Gress DM, Byrd DR and
Winchester DP: The eighth edition AJCC cancer staging manual:
Continuing to build a bridge from a population-based to a more
‘personalized’ approach to cancer staging. CA Cancer J Clin.
67:93–99. 2017.PubMed/NCBI
|
|
26
|
Daniele B, Annunziata M, Barletta E,
Tinessa V and Di Maio M: Cancer of the liver italian program (CLIP)
score for staging hepatocellular carcinoma. Hepatol Res. 37 (Suppl
2):S206–S209. 2007. View Article : Google Scholar : PubMed/NCBI
|
|
27
|
Moris D, Martinino A, Schiltz S, Allen PJ,
Barbas A, Sudan D, King L, Berg C, Kim C, Bashir M, et al: Advances
in the treatment of hepatocellular carcinoma: An overview of the
current and evolving therapeutic landscape for clinicians. CA
Cancer J Clin. May 20–2025.(Epub ahead of print). PubMed/NCBI
|
|
28
|
Livak KJ and Schmittgen TD: Analysis of
relative gene expression data using real-time quantitative PCR and
the 2(−Delta Delta C(T)) method. Methods. 25:402–408. 2001.
View Article : Google Scholar : PubMed/NCBI
|
|
29
|
Kong J, Wang T, Shen S, Zhang Z, Yang X
and Wang W: A genomic-clinical nomogram predicting recurrence-free
survival for patients diagnosed with hepatocellular carcinoma.
PeerJ. 7:e79422019. View Article : Google Scholar : PubMed/NCBI
|
|
30
|
Luo JP, Wang J and Huang JH: CDKN2A is a
prognostic biomarker and correlated with immune infiltrates in
hepatocellular carcinoma. Biosci Rep. 41:BSR202111032021.
View Article : Google Scholar : PubMed/NCBI
|
|
31
|
Skerka C, Chen Q, Fremeaux-Bacchi V and
Roumenina LT: Complement factor H related proteins (CFHRs). Mol
Immunol. 56:170–180. 2013. View Article : Google Scholar : PubMed/NCBI
|
|
32
|
Wan Z, Li X, Luo X, Wang B, Zhou X and
Chen A: The miR-590-3p/CFHR3/STAT3 signaling pathway promotes cell
proliferation and metastasis in hepatocellular carcinoma. Aging
(Albany NY). 14:5783–5799. 2022. View Article : Google Scholar : PubMed/NCBI
|
|
33
|
Yu D, Green B, Marrone A, Guo Y, Kadlubar
S, Lin D, Fuscoe J, Pogribny I and Ning B: Suppression of CYP2C9 by
microRNA hsa-miR-128-3p in human liver cells and association with
hepatocellular carcinoma. Sci Rep. 5:85342015. View Article : Google Scholar : PubMed/NCBI
|
|
34
|
Starkova T, Polyanichko A, Tomilin AN and
Chikhirzhina E: Structure and functions of HMGB2 protein. Int J Mol
Sci. 24:83342023. View Article : Google Scholar : PubMed/NCBI
|
|
35
|
Lu K, Zhao T, Yang L, Liu Y, Ruan X, Cui L
and Zhang Y: HMGB2 upregulation promotes the progression of
hepatocellular carcinoma cells through the activation of
ZEB1/vimentin axis. J Gastrointest Oncol. 14:2178–2191. 2023.
View Article : Google Scholar : PubMed/NCBI
|
|
36
|
Li M, Pang X, Xu H and Xiao L: CircSCMH1
accelerates sorafenib resistance in hepatocellular carcinoma by
regulating HN1 expression via miR-485-5p. Mol Biotechnol.
67:304–316. 2025. View Article : Google Scholar : PubMed/NCBI
|
|
37
|
Wang R, Fu Y, Yao M, Cui X, Zhao Y, Lu X,
Li Y, Lin Y and He S: The HN1/HMGB1 axis promotes the proliferation
and metastasis of hepatocellular carcinoma and attenuates the
chemosensitivity to oxaliplatin. FEBS J. 289:6400–6419. 2022.
View Article : Google Scholar : PubMed/NCBI
|
|
38
|
Qu M, Zhang G, Qu H, Vu A, Wu R, Tsukamoto
H, Jia Z, Huang W, Lenz HJ, Rich JN and Kay SA: Circadian regulator
BMAL1::CLOCK promotes cell proliferation in hepatocellular
carcinoma by controlling apoptosis and cell cycle. Proc Natl Acad
Sci USA. 120:e22148291202023. View Article : Google Scholar : PubMed/NCBI
|
|
39
|
Wu D, Zhang C, Liao G, Leng K, Dong B, Yu
Y, Tai H, Huang L, Luo F, Zhang B, et al: Targeting
uridine-cytidine kinase 2 induced cell cycle arrest through dual
mechanism and could improve the immune response of hepatocellular
carcinoma. Cell Mol Biol Lett. 27:1052022. View Article : Google Scholar : PubMed/NCBI
|
|
40
|
Wang S, Meng L, Xu N, Chen H, Xiao Z, Lu
D, Fan X, Xia L, Chen J, Zheng S, et al: Hepatocellular
carcinoma-specific epigenetic checkpoints bidirectionally regulate
the antitumor immunity of CD4 + T cells. Cell Mol Immunol.
21:1296–1308. 2024. View Article : Google Scholar : PubMed/NCBI
|
|
41
|
Zhang Z, Ma L, Goswami S, Ma J, Zheng B,
Duan M, Liu L, Zhang L, Shi J, Dong L, et al: Landscape of
infiltrating B cells and their clinical significance in human
hepatocellular carcinoma. Oncoimmunology. 8:e15713882019.
View Article : Google Scholar : PubMed/NCBI
|