Introduction
Ovarian epithelial carcinoma is classified into four
morphologically distinct categories: serous, mucinous, endometrioid
and clear-cell. Serous adenocarcinoma accounts for ~50% of all
ovarian carcinoma (1). Ovarian
serous adenocarcinoma cases (~70%) have progressed into the
abdominal cavity at the time of diagnosis, giving them a stage III
classification, based on the International Federation of Gynecology
and Obstetrics (FIGO) criteria. As it is difficult to completely
remove most such tumors by surgery, response to chemotherapy
determines their prognosis. Although ovarian serous adenocarcinoma
is highly sensitive to chemotherapy, many cases relapse. Corrected
actuarial survival rates are 41.0% at 5 years for all stages of
ovarian serous adenocarcinoma, 35.1% for stage III, and 19.2% for
stage IV (1). Reduction of
recurrence for patients with partial or complete response to
chemotherapy would greatly improve their prognoses.
Mitotic-arrest deficiency 2 (MAD2) was
the first gene of the mammalian mitotic spindle checkpoint pathway
to be characterized (2). MAD2
localizes at kinetochores after chromosome condensation and before
anaphase (3); it significantly
affects the transition from metaphase to anaphase by inhibiting the
anaphase-promoting complex/cyclosome (APC/C). This process ensures
that the chromosomes are correctly aligned at the metaphase plate
prior to daughter-cell segregation (4,5).
Therefore, MAD2 is a key component of the mitotic spindle
checkpoint pathway, which plays a crucial role in preventing loss
or gain of chromosomes within cells (6). A compromised mitotic spindle
checkpoint results in an abnormal number of chromosomes, known as
chromosomal instability (CIN) (7).
CIN is characterized by alterations in chromosome number and is
commonly detected as aneuploidy (8,9); it
has been reported in most types of human cancer. Although the
underlying molecular mechanisms are unclear, MAD2 overexpression in
transgenic mice notably results in CIN and initiates carcinogenesis
in a wide variety of tumors (10).
Some studies suggest that a compromised mitotic spindle checkpoint,
through MAD2 overexpression, is a significant step in malignancy
progression; in fact, MAD2 overexpression is observed in several
cancers (11–15).
We have previously reported that MAD2 overexpression
occurs in most cases of mucinous ovarian carcinomas and that it is
potentally correlated to mucinous ovarian carcinogenesis (16). However, MAD2 overexpression alone
may not be sufficient for mucinous ovarian carcinogenesis. Some
studies suggest a correlation between MAD2 overexpression and
various clinicopathological characteristics, such as histological
grade (differentiation), metastasis and prognosis (11,12,14,15).
However, reduced MAD2 expression occurs in some human cancers
(4,17) and is associated with in vitro
resistance to chemotherapies that use microtubule-targeting agents
or DNA-damaging agents (18,19).
In this study, we examined the relationship between MAD2 expression
and chemotherapy resistance in ovarian serous adenocarcinoma.
Materials and methods
Patients and samples
We initially treated 63 cases of ovarian serous
adenocarcinoma at Osaka City University Medical School Hospital
(Osaka, Japan), between 2000 and 2007. In this study, we reviewed
41 cases in which maximum debulking surgery and platinum-based
anticancer drugs as first-line chemotherapy were used, and from
patients who had partial or complete responses from this
chemotherapy. Tumor samples were obtained following primary
surgery. Written informed consent was obtained from all patients
prior to immunohistochemical examination. This study was approved
by the Ethics Committee of Osaka City University (IRB no.
2201).
Of the 41 cases, 24 were recurrent (relapsed group),
and 17 were disease-free (relapse-free group). Based on the FIGO
criteria, 1 case in the relapsed group was classified as stage I, 1
as stage II, 19 as stage III and 3 as stage IV. In the relapse-free
group, 3 cases were classified as stage I, 0 as stage II, 14 as
stage III and 0 as stage IV (Table
I).
 | Table IPatient characteristics. |
Table I
Patient characteristics.
| Relapsed | Relapse-free | P-value |
|---|
| No. of cases | 24 | 17 | |
| Age | | | NS |
| Mean | 56.0 | 53.2 | |
| Range | 36–82 | 26–73 | |
| FIGO stage | | | NS |
| I | 1 | 3 | |
| II | 1 | 0 | |
| III | 19 | 14 | |
| IV | 3 | 0 | |
| Chemotherapy | | | NS |
| Taxane +
carboplatin | 20 | 15 | |
| Platinum only | 4 | 2 | |
Immunohistochemical analysis
The expression of MAD2 was investigated in
paraffin-embedded sections, using a MAD2 antibody and the
avidin-biotin peroxidase complex method. Paraffin sections (4-μm)
were de-paraffinized and immersed in 3% hydrogen peroxidase in
methanol to block endogenous peroxidase activity. Next, an antigen
retrieval procedure was performed by immersing the slides in 10 mM
citrate buffer (pH 6.0) and heating in an autoclave at 110°C for 20
min. The sections were then washed in phosphate-buffered saline
(PBS). The protocol for the Dako LSAB 2 peroxidase kit (Dako,
Kyoto, Japan) was followed. The sections were incubated with the
primary antibodies for 2 h at room temperature. The primary
antibody used for this study was monoclonal rabbit anti-human MAD2
(1:200; Proteintech Group, Inc., Chicago, IL, USA). Sections were
rinsed with PBS for 15 min and incubated for 10 min with secondary
antibody (biotinylated goat anti-mouse and rabbit immunoglobulin G;
Dako). Sections were then incubated with the
streptavidin-peroxidase complex; 3,3′-diaminobenzidine was used as
chromogen. Sections were then counterstained with Mayer's
hematoxylin. Specificity of immunohistochemical reactions was
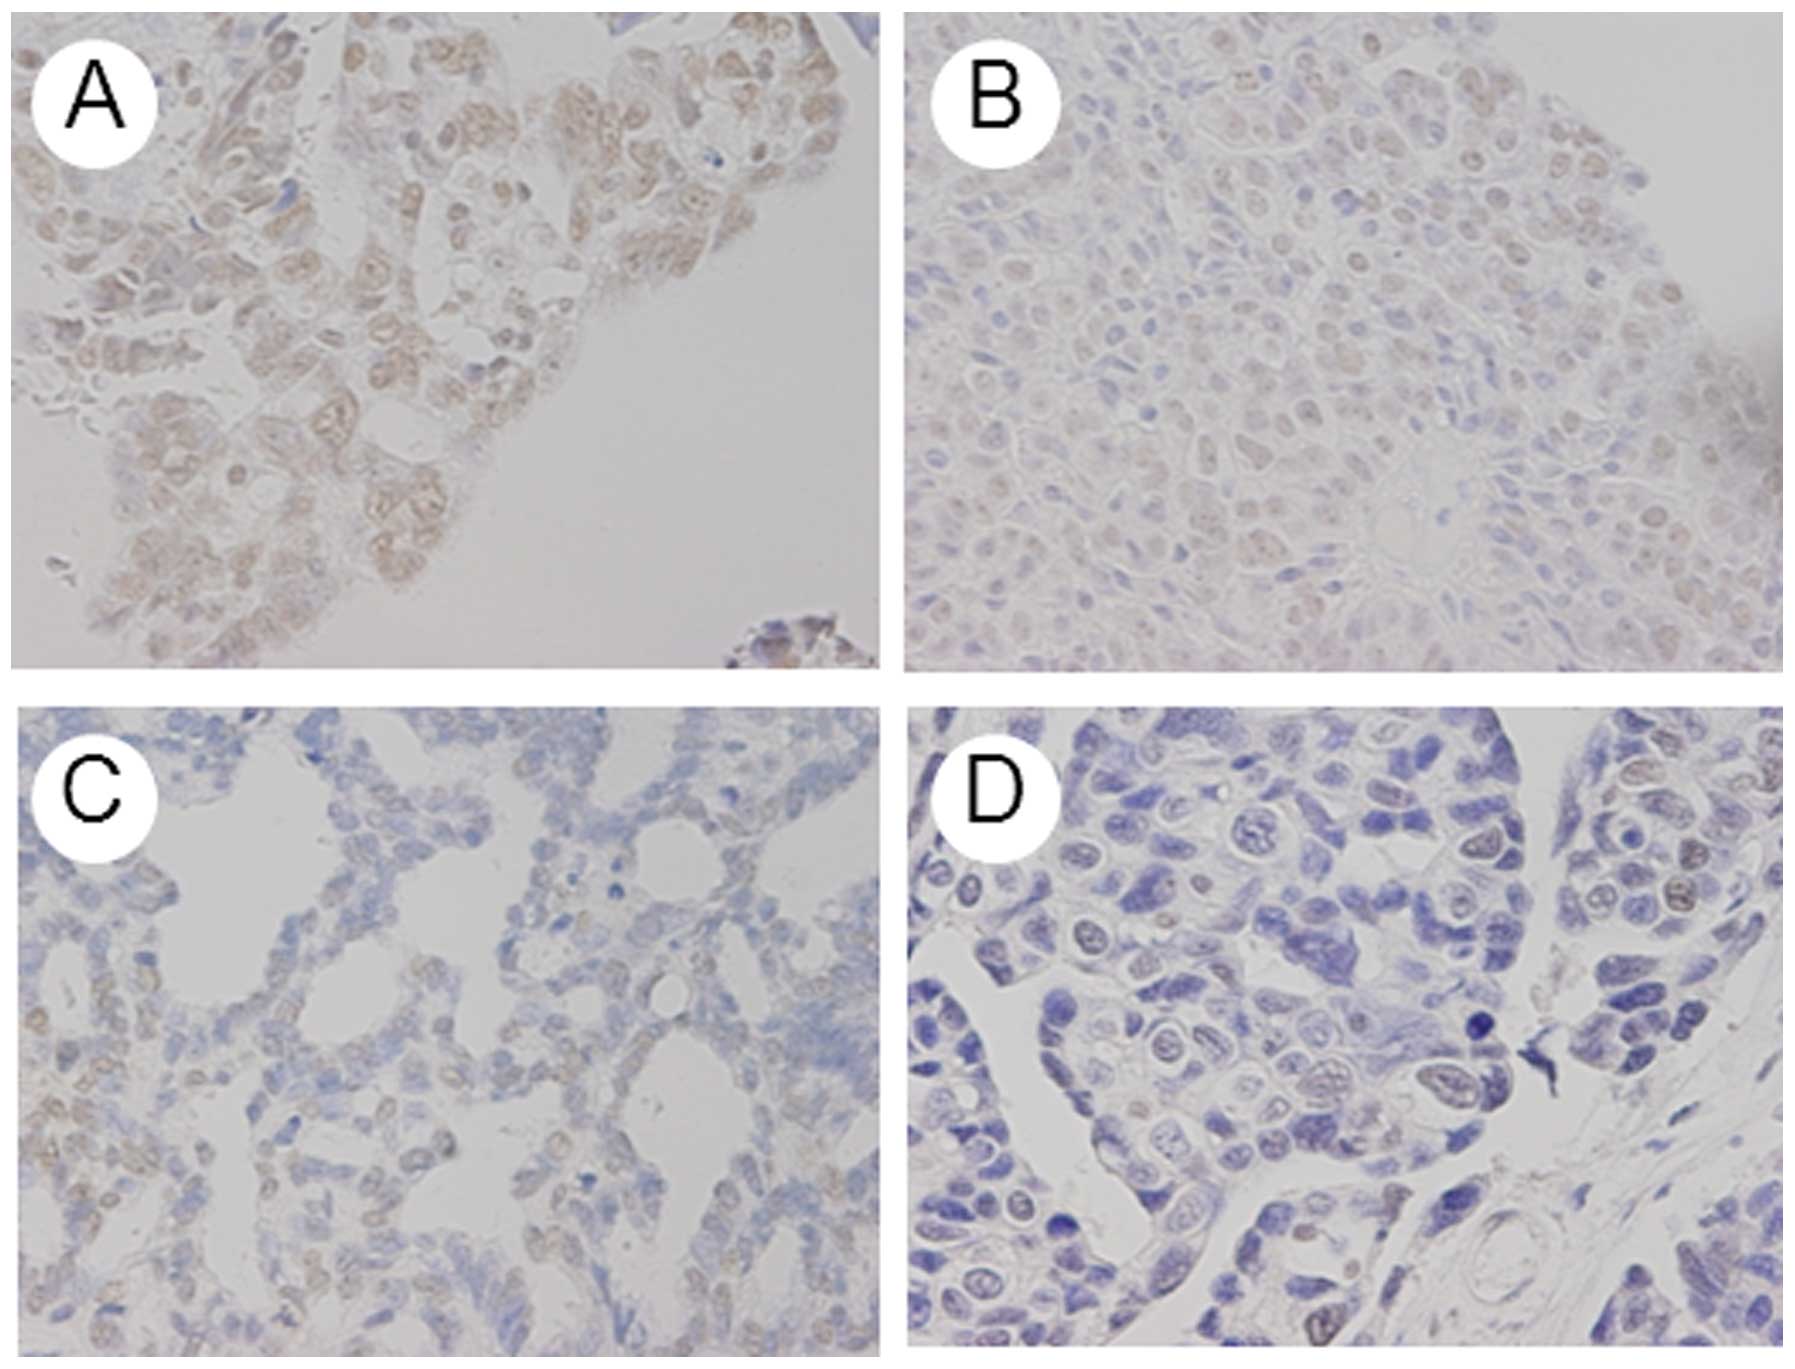
checked by omitting the primary antibody. Quantitative analysis of
MAD2 expression was based on the scoring method of Sinicrope et
al (20). Briefly, mean
percentages of positive tumor cells were determined in five
separate areas (magnification, ×400) and assigned to the following
values: 0, <5%; 1, 5–25%; 2, 25–50%; 3, 50–75% or 4, >75%.
Immunostaining intensity was scored as: 1+, weak; 2+, moderate or
3+, intense. For each specimen, percentage of positive tumor cells
was multiplied by staining intensity to produce a weighted
score.
Statistical analysis
Kaplan-Meier and log-rank tests were used for the
prognostic analyses. StatView 5.0 (Abacus Concepts, Berkeley, CA,
USA) was used for data analysis and P<0.05 was considered
significant. Continuous variables were expressed as mean ± standard
deviation (SD) or mean ± standard error (SE), as shown in the
figures. Weighted scores were compared using the Mann-Whitney U
test.
Results
Patient characteristics
The mean age was 56.0 years (range, 36–82) in the
relapsed group and 53.2 years (range: 26–73) in the relapse-free
group. No significant difference was observed among the two groups
(Table I). All patients recieved
platinum-based chemotherapy, which was mostly taxane (paclitaxel or
docetaxel)/carboplatin.
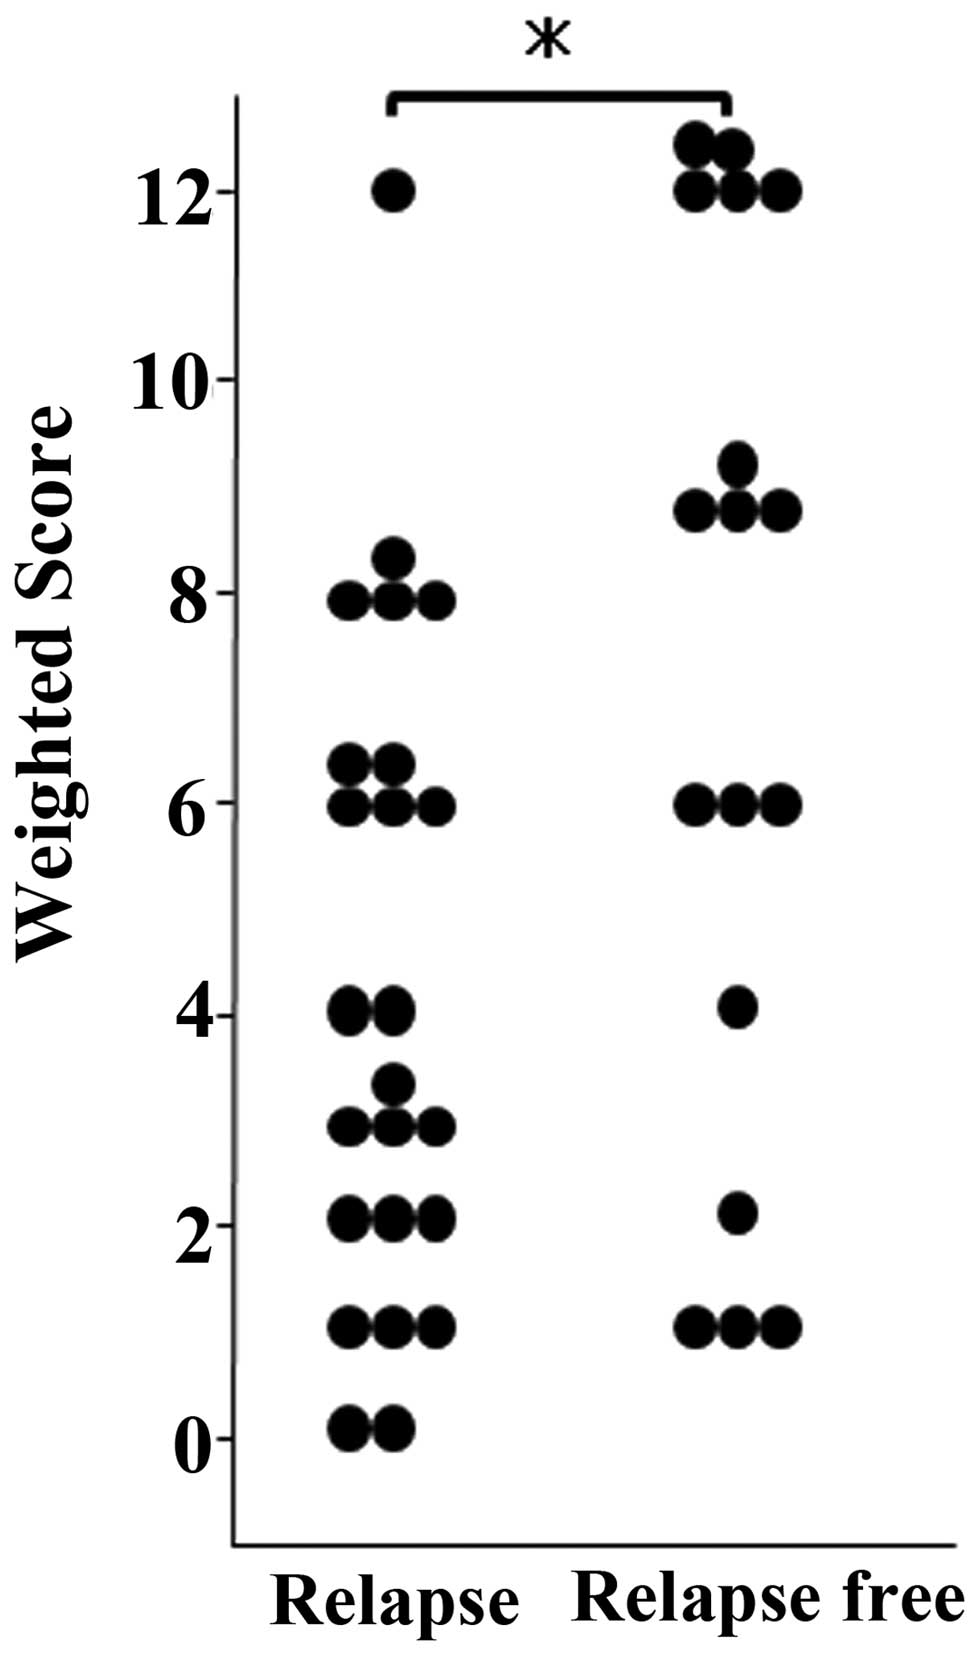
MAD2 expression
MAD2 was expressed in tumor cell nuclei (Fig. 1). Mean weighted scores were 4.3 in
the relapsed and 7.2 in the relapse-free group (Table II), and were thus significantly
greater in the relapse-free than in the relapsed group (Fig. 2).
| Table IIWeighted scores in relapsed and
relapse-free groups. |
Table II
Weighted scores in relapsed and
relapse-free groups.
| Weighted-score | Relapsed (n) | Relapse-free (n) | Total (n) |
|---|
| 0 | 2 | 0 | 2 |
| 1 | 3 | 3 | 6 |
| 2 | 3 | 1 | 4 |
| Total, n (%) | 8 (33.3) | 4 (23.5) | 12 (29.3) |
| 3 | 4 | 0 | 4 |
| 4 | 2 | 1 | 3 |
| 6 | 5 | 3 | 8 |
| Total, n (%) | 11 (45.8) | 4 (23.5) | 15 (36.6) |
| 8 | 4 | 0 | 4 |
| 9 | 0 | 4 | 4 |
| 12 | 1 | 5 | 6 |
| Total, n (%) | 5 (20.8) | 9 (52.9) | 14 (34.1) |
| Weighted score,
mean | 4.3 | 7.2 | 5.5 |
Survival
In the relapsed group, mean progression-free
survival was 18.8 months (range, 3–49). Mean overall survival was
36.7 months (range, 8–66) for the relapsed group and 73.9 months
(range, 46–119) for the relapse-free group.
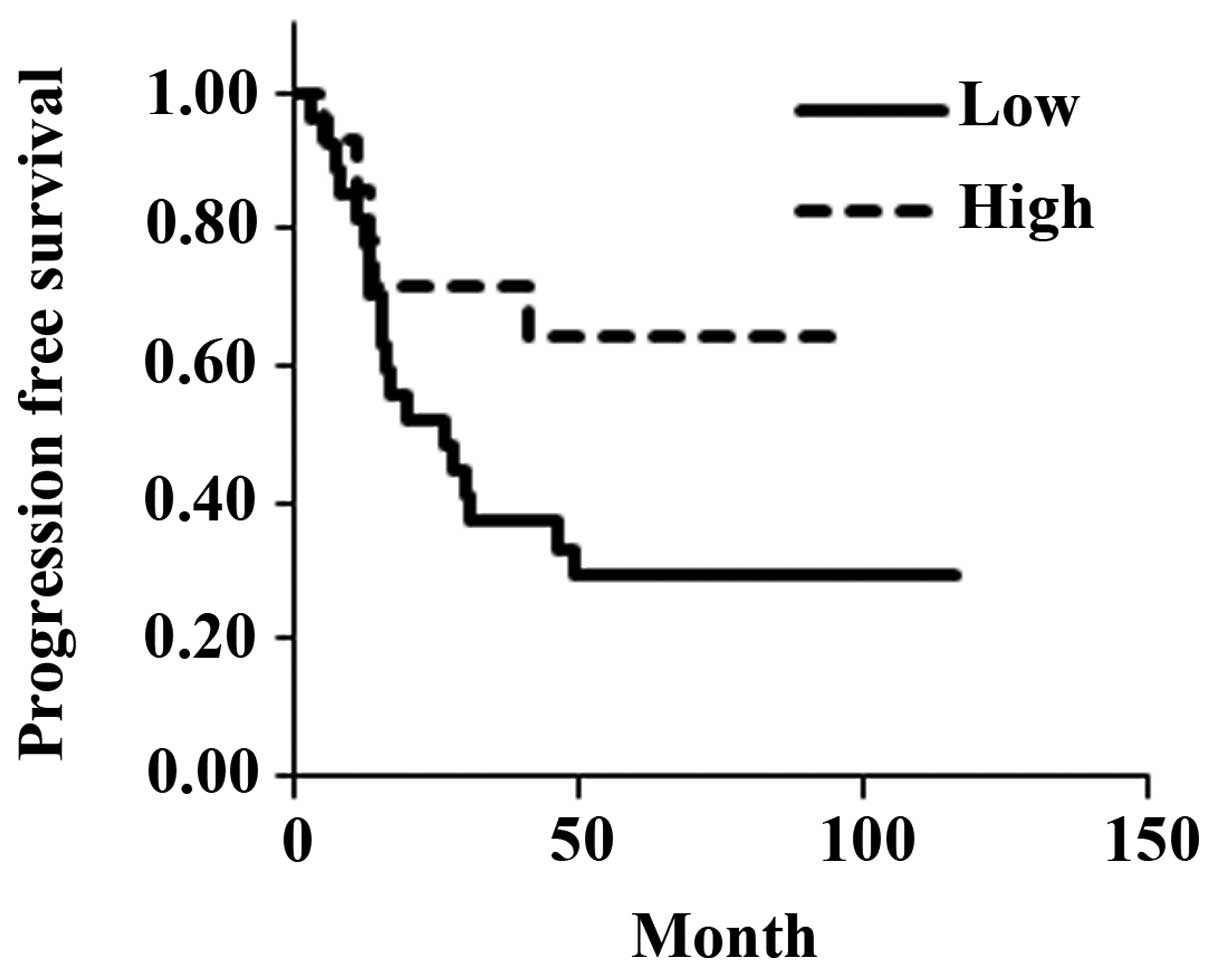
Grade of MAD2 expression
The 41 cases were re-classified as showing low or
high MAD2 expression. The low expression group contained 24 cases
with weighted scores from 0–6 and the high expression group
contained 17 cases with weighted scores from 8–12. The mean age of
the low expression group was 57.1 years (range, 26–82) and that of
high expression group was 50.4 years (range, 34–73). Based on the
FIGO criteria, 3 low-expression cases were classified as stage I, 1
as stage II, 20 as stage III and 3 as stage IV; among
high-expression cases, 1 was classified as stage I, 0 as stage II,
13 as stage III and 0 as stage IV. In the low-expression group, 19
patients relapsed and 17 died; in the high-expression group, 5
patients relapsed and 3 died (Table
III). There was no significant difference in the estimated mean
progression-free survival between the low-expression group (47.6
months) and the high-expression group (67.1 months) (P=0.0685;
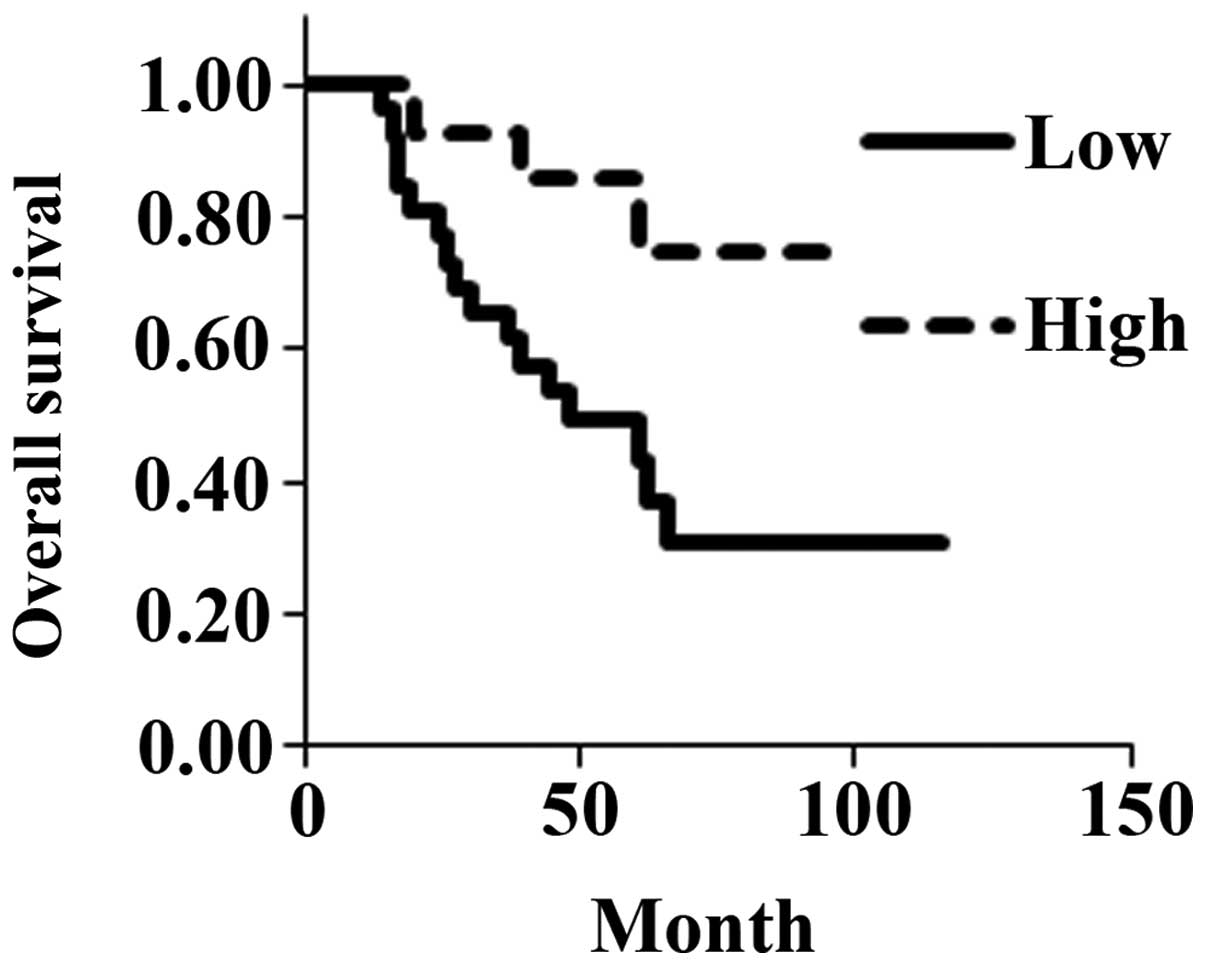
Fig. 3). However, overall estimated
mean survival was significantly shorter for the low-expression
(61.7 months) than for the high-expression group (82.0 months)
(P=0.0188; Fig. 4).
| Table IIIClinical background of cases with low
and high expression of MAD2. |
Table III
Clinical background of cases with low
and high expression of MAD2.
| Low expression
(score: 0, 1, 2, 3, 4, 6) | High expression
(score: 8, 9, 12) | P-value |
|---|
| No. of cases | 27 | 14 | |
| Age | | | NS |
| Mean | 57.1 | 50.4 | |
| Range | 26–82 | 34–73 | |
| FIGO stage, n | | | NS |
| I | 3 | 1 | |
| II | 1 | 0 | |
| III | 20 | 13 | |
| IV | 3 | 0 | |
| Relapses, n(%) | 19 (70.3) | 5 (35.7) | <0.05 |
| Deaths, n(%) | 17 (63.0) | 3 (21.4) | <0.05 |
Discussion
MAD2 is a key component of the mitotic spindle
checkpoint pathway, which if compromised, can result in CIN and
tumorigenesis. MAD2 overexpression has been shown to promote
aneuploidy, tumorigenesis and tumor progression (21). Reportedly, MAD2 overexpression is a
critical mediator of CIN, as seen in inactivation of p53 and Rb
pathways (22). MAD2 overexpression
has also been observed in some human cancers (11–15). A
correlation has been implied between MAD2 overexpression and
various clinicopathological characteristics, such as histological
grade (differentiation), metastasis and prognosis (11,12,14,15).
In a study that assessed incidence of metastasis and survival time
in 48 cases of human osteosarcoma, MAD2 overexpression was
associated with early metastasis and poor prognosis (14). Another study showed MAD2
overexpression to be associated with lung cancer recurrence in mice
(23).
In the present study, 39 of 41 samples (95.2%) were
stained positively for MAD2. Of the 41 cases, 24 were recurrent and
17 disease-free (Table I). Mean
weighted scores for MAD2 expression were significantly less for the
relapsed (4.3) than for the relapse-free group (7.2) (Fig 2; Table
II). When the 41 cases were classified into 24 low-expression
(weighted score, 0–6) and 17 high-expression (weighted score, 8–12)
cases (Table III), they showed no
significant difference in progression-free survival, but overall
survival for the low-expression group was significantly shorter for
the high-expression group (Figs. 3
and 4). In this study, 87.8%
(36/41) of cases were in advanced stages. However, the
above-mentioned study (14)
indicated significant association between MAD2 expression and
clinical staging, which implies that poor prognoses reflect
clinical staging rather than MAD2 expression. Adjuvant chemotherapy
in our study could have affected prognoses, implying a relationship
between MAD2 expression and chemotherapy resistance.
MAD2 is a key component of spindle assembly
checkpoint (SAC) function which meditates attachment of spindle
microtubules to kinetochores and accurate chromosomal segregation
during mitosis (24,25). One review focused on chemoresistance
to taxane treatment in breast cancer, particularly in relation to
the SAC and dysfunctional regulation of apoptotic signaling
(26). Reportedly, cellular
senescence induced by the low MAD2 expression affects paclitaxel
sensitivity (27). Low MAD2
expression is also reportedly associated with resistance to
paclitaxel in ovarian cancer cells (28) and gastric cancer cells (29), and Bcl-2 may be involved in this
process. While failure of SAC function does not fully explain
chemotherapy-resistant acquisition, it appears to take an important
role. By extension, MAD2 expression level could be a predictor of
chemoresistance. Our previous study suggested MAD2 expression to
predict efficacy of neoadjuvant chemotherapy for locally advanced
uterine cervical cancer (30). In
this study, while progression-free survival between groups
expressing low and high levels of MAD2 did not significantly differ
(P=0.0685; Fig. 3), those
expressing lower MAD2 levels had significantly shorter overall
survival (P=0.0188; Fig. 4).
Therefore, MAD2 expression may be an important predictor of
prognosis for ovarian serous adenocarcinoma.
In conclusion, the results of the present study
suggest that levels of MAD2 expression can help predict sensitivity
to anticancer agents and risk of recurrence for these patients.
Acknowledgements
We thank the gynecologists at Osaka City University
Medical School Hospital for their support (Osaka, Japan). This
study was supported by the Osaka Medical Research Foundation for
Incurable Diseases.
References
|
1
|
Heintz AP, Odicino F, Maisonneuve P, et
al: Carcinoma of the ovary. FIGO 26th annual report on the results
of treatment in gynecological cancer. Int J Gynecol Obstet.
95:S161–S192. 2006.PubMed/NCBI
|
|
2
|
Hardwick KG: Checkpoint signaling: Mad2
conformers and signal propagation. Curr Biol. 15:R122–R124. 2005.
View Article : Google Scholar : PubMed/NCBI
|
|
3
|
Lopez-Girona A, Furnari B, Mondesert O and
Russell P: Nuclear localization of Cdc25 is regulated by DNA damage
and a 14-3-3 protein. Nature. 397:172–175. 1999. View Article : Google Scholar : PubMed/NCBI
|
|
4
|
Wang X, Jin DY, Ng RW, Feng H, Wong YC,
Cheung AL and Tsao SW: Significance of MAD2 expression to mitotic
checkpoint control in ovarian cancer cells. Cancer Res.
62:1662–1668. 2002.PubMed/NCBI
|
|
5
|
Li R and Murray A: Feedback control of
mitosis in budding yeast. Cell. 66:519–531. 1991. View Article : Google Scholar : PubMed/NCBI
|
|
6
|
Orr-Weaver TL and Weinberg RA: A
checkpoint on the road to cancer. Nature. 392:223–224. 1998.
View Article : Google Scholar : PubMed/NCBI
|
|
7
|
Yoon DS, Wersto RP, Zhou W, Chrest FJ,
Garret ES, Kwon TK and Gabrielson E: Variable levels of chromosomal
instability and mitotic spindle checkpoint defects in breast
cancer. Am J Pathol. 161:391–397. 2002. View Article : Google Scholar : PubMed/NCBI
|
|
8
|
Lengauer C, Kinzler KW and Vogelstein B:
Genetic instability in colorectal cancer. Nature. 386:623–627.
1997. View
Article : Google Scholar : PubMed/NCBI
|
|
9
|
Lengauer C, Kinzler KW and Vogelstein B:
Genetic instability in human cancer. Nature. 396:643–649. 1998.
View Article : Google Scholar
|
|
10
|
Sotillo R, Hernando E, Diaz-Rodriguez E,
Teruya-Feldstein J, Cordon-Cardo C, Lowe SW and Benezra R: Mad2
overexpression promotes aneuploidy and tumorigenesis in mice.
Cancer Cell. 11:9–23. 2007. View Article : Google Scholar : PubMed/NCBI
|
|
11
|
Li GQ, Li H and Zhang HF: Mad2 and p53
expression profiles in colorectal cancer and its clinical
significance. World J Gastroenterol. 9:1972–1975. 2003.PubMed/NCBI
|
|
12
|
Wang L, Yin F, Du Y, Du W, Chen B, Zhang
Y, Wu K, Ding J, Liu J and Fan D: MAD2 as a key component of
mitotic checkpoint: A probable prognostic factor for gastric
cancer. Am J Clin Pathol. 131:793–801. 2009. View Article : Google Scholar : PubMed/NCBI
|
|
13
|
Chen X, Cheung ST, So S, et al: Gene
expression patterns in human liver cancers. Mol Biol Cell.
13:1929–1939. 2002. View Article : Google Scholar PubMed/NCBI
|
|
14
|
Yu L, Guo WC, Zhao SH, Tang J and Chen JL:
Mitotic arrest defective protein 2 expression abnormality and its
clinicopathologic significance in human osteosarcoma. APMIS.
118:222–229. 2010. View Article : Google Scholar : PubMed/NCBI
|
|
15
|
Zhang SH, Xu AM, Chen XF, Li DH, Sun MP
and Wang YJ: Clinicopathologic significance of mitotic arrest
defective protein2 overexpression in hepatocellular carcinoma. Hum
Pathol. 39:1827–1834. 2008. View Article : Google Scholar : PubMed/NCBI
|
|
16
|
Nakano Y, Sumi T, Morishita M, Fukuda T,
Nobeyama H, Yoshida H, Matsumoto Y, Yasui T and Ishiko O: Mitotic
arrest deficiency 2 induces carcinogenesis in mucinous ovarian
tumors. Oncol Lett. 3:281–286. 2012.PubMed/NCBI
|
|
17
|
Wang X, Jin DY, Wong YC, Cheung AL, Chun
AC, Lo AK, Liu Y and Tsao SW: Correlation of defective mitotic
checkpoint with aberrantly reduced expression of MAD2 protein in
nasopharyngeal carcinoma cells. Carcinogenesis. 21:2293–2297. 2000.
View Article : Google Scholar : PubMed/NCBI
|
|
18
|
Fung MK, Cheung HW, Ling MT, Cheung AL,
Wong YC and Wang X: Role of MEK/ERK pathway in the MAD2-mediated
cisplatin sensitivity in testicular germ cell tumor cells. Br J
Cancer. 95:475–484. 2006. View Article : Google Scholar : PubMed/NCBI
|
|
19
|
Cheung HW, Chun AC, Wang Q, Deng W, Hu L,
Guan XY, Nicholls JM, Ling MT, Chuan Wong Y, Tsao SW, et al:
Inactivation of human MAD2B in nasopharyngeal carcinoma cells leads
to chemosensitization to DNA-damaging agents. Cancer Res.
66:4357–4367. 2006. View Article : Google Scholar : PubMed/NCBI
|
|
20
|
Sinicrope FA, Ruan SB, Cleary KR, Stephens
LC, Lee JJ and Levin B: Bcl-2 and p53 oncoprotein expression during
colorectal tumorigenesis. Cancer Res. 55:237–241. 1995.PubMed/NCBI
|
|
21
|
Wu CW, Chi CW and Huang TS: Elevated level
of spindle checkpoint MAD2 correlates with cellular mitotic arrest,
but not with aneuploidy and clinicopathological characteristics in
gastric cancer. World J Gastroenterol. 10:3240–3244.
2004.PubMed/NCBI
|
|
22
|
Schvartzman JM, Duijf PH, Sotillo R, Coker
C and Benezra R: Mad2 is a critical mediator of the chromosome
instability observed upon Rb and p53 pathway inhibition. Cancer
Cell. 19:701–714. 2011. View Article : Google Scholar : PubMed/NCBI
|
|
23
|
Sotillo R, Schvartzman JM, Socci ND and
Beneztra R: Mad2-induced chromosome instability leads to lung tumor
relapse after oncogene withdrawal. Nature. 464:436–440. 2010.
View Article : Google Scholar : PubMed/NCBI
|
|
24
|
Zhou J, Yao J and Joshi HC: Attachment and
tension in the spindle assembly checkpoint. J Cell Sci.
115:3547–3555. 2002. View Article : Google Scholar : PubMed/NCBI
|
|
25
|
Buke DJ and Stukenberg PT: Linking
kinetochoremicrotubule binding to the spindle checkpoint. Dev Cell.
14:474–479. 2008. View Article : Google Scholar : PubMed/NCBI
|
|
26
|
McGrogan BT, Gilmartin B, Carney DN and
McCann A: Taxanes, microtubules and chemoresistant breast cancer.
Biochim Biophys Acta. 1785:96–132. 2008.PubMed/NCBI
|
|
27
|
Prencipe M, Fitzpatrick P, Gorman S,
Tosetto M, Klinger R, Furlong F, Harrison M, O'Connor D, Roninson
IB, O'Sullivan J and McCann A: Cellular senescence induced by
aberrant MAD2 levels impacts on paclitaxel responsiveness in vitro.
Br J Cancer. 101:1900–1908. 2009. View Article : Google Scholar : PubMed/NCBI
|
|
28
|
Hao X, Zhou Z, Ye S, Zhou T, Lu Y, Ma D
and Wang S: Effect of Mad2 on paclitaxel-induced cell death in
ovarian cancer cells. J Huazhong Univ Sci Technolog Med Sci.
30:620–625. 2010. View Article : Google Scholar : PubMed/NCBI
|
|
29
|
Du Y, Yin F, Liu C, Hu S, Qang J, Xie H,
Hong L and Fan D: Depression of Mad2 inhibits apoptosis of gastric
cancer cells by upregulating Bcl-2 and interfering mitochondrion
pathway. Biochem Biophys Res Commun. 345:1092–1098. 2006.
View Article : Google Scholar : PubMed/NCBI
|
|
30
|
Morishita M, Sumi T, Nakano Y, Fukuda T,
Nobeyama H, Yoshida H, Matsumoto Y, Yasui T and Ishiko O:
Expression of mitotic-arrest deficiency 2 predicts the efficacy of
neoadjuvant chemotherapy for locally advanced uterine cervical
cancer. Exp Ther Med. 3:341–346. 2012.PubMed/NCBI
|