Introduction
Multiple myeloma (MM) is a hematological malignant
disease characterized by abnormal bone marrow plasma cell
proliferation (1). Despite the fact
that the application of new chemotherapeutic agents has led to
great progress in the treatment of MM, it remains incurable. The
outcome or prognosis for MM patients with traditional or cytotoxic
chemotherapeutic agents has not been satisfactory (2). Therefore, the identification of novel
targets for MM patients to improve outcome is crucial.
Peroxisome proliferator activated receptor-γ
coactivator-1α (PGC-1α) is a transcriptional coactivator that
regulates the genes participating in energy metabolism and
mitochondrial biogenesis (3). After
years of investigation regarding the onset of malignant diseases,
it is recognized that PGC-1α is also a master integrator of
external signals such as reactive oxygen species (ROS), which is
formed during cellular metabolism, but upregulated when
experiencing cellular stress (4,5), cold
exposure (6), endurance exercise
(7), and changes of cAMP (8). Increasingly, investigators have
focused their attention on examining the role of PGC-1α in tumors
(9–13). Results of those studies reveal that
PGC-1α has dynamic, diverse, even paradoxical roles in tumor
development by promoting cancer cell survival under cellular stress
and enhancing the apoptosis of cancer cells through the coordinated
regulation of Bcl-2 and Bax expression. In a previously published
study, we found that PGC-1α is overexpressed in MM, and PGC-1α
integrates angiogenesis and glucose metabolism by regulating VEGF
and GLUT-4 (14). Consequently,
PGC-1α appears to have a pro-cancer role in MM. However, whether
PGC-1α has other roles in the development of MM remains to be
elucidated.
ROS are the by-products of cell metabolism. The
primary source of cellular ROS is mitochondrial. Various
antioxidant systems exist for removing ROS in cells, with catalase
(CAT), glutathione peroxidase 1 (GPX-1), glutathione peroxidase 4
(GPX-4), superoxide dismutase-1 (SOD-1), and superoxide
dismutasis-2 (SOD-2) being the key components of antioxidant
systems in cells. Cells in oxidative condition are usually
considered as generating excessive ROS, and thus leading to cell or
organ damage (15,16). Once the generation and accumulation
of ROS is out of control, it may finally lead to oxidative stress,
even apoptosis (17,18). Numerous studies have been performed
with the aim of improving the antitumor effect of chemotherapeutic
agents, and the results showed that ROS are important factors
affecting the outcome for patients with tumors such as MM (19–21).
Specifically, strategies with the aim of improving efficacy by
modulating ROS have been proven to be feasible in the treatment of
tumors (22). As mentioned above,
PGC-1α participates in the regulation of ROS, and it has been
suggested that PGC-1α induces several key ROS detoxifying enzymes
when non-malignant cells experience oxidative stress (4,23).
However, whether PGC-1α is involved in the regulation of ROS in MM,
which is a potential target for improving the anticancer effect of
chemotherapeutic agents remains to be determined.
In the present study, we cultured RPMI-8226, U266
and ARH77 MM cells in vitro, and treated these cells with
bortezomib or dexamethasone. The expression of PGC-1α and the key
factors involved in the regulation of ROS were examined, to study
whether PGC-1α affected metabolism of ROS and thus influence the
efficacy of chemotherapeutic agents in MM and its related
underlying mechanism.
Materials and methods
Cell culture
RPMI-8226, U266 and ARH77 MM cell lines were
purchased from the American Type Culture Collection (Manassas, VA,
USA). Human RPMI-8226, U266 and ARH77 cells were grown in RPMI-1640
medium (Hyclone, Thermo Fisher Scientific, Waltham, MA, USA)
containing 10% fetal bovine serum and 100 U/ml
penicillin/streptomycin. All the cells were incubated at 37°C under
5% CO2.
siRNA
The small-interference RNAs (siRNAs) for PGC-1α were
designed and produced by GenePharma (Shanghai, China). RPMI-8226
and ARH-77 cells were transfected with Lipofectamine 2000™ reagent
(Invitrogen, Carlsabad, CA, USA) according to the manufacturer’s
instructions. Cells were collected 24 h post-transfection. The
sequence information for siRNA included: GAPDH siRNA, sense control
DNA and antisense control DNA (provided with the kit); siPGC-1α,
5′-GCCA AACCAACAACUUUAUUU-3′ (sense), and 5′-AUAAAGUUG
UUGGUUUGGCUU-3′ (antisense).
MTT assay
Myeloma cells were seeded in 96-well plates at a
density of 3.5–5×10⁴ cells per well. Following treatment
with different doses of agents for 24 h, 10 μl MTT
[3-(4,5-dimethylthiazol-2-yl)-2,5-diphenyltetrazolium bromide]
solution was added to each well. The plates were incubated for 4 h
in the dark and detergent reagent was added until the purple
formazan reached full dissolution. The assay was measured by
Microplate Reader (Bio-Rad, La Jolla, CA, USA) and absorbance at
490 nm was detected. The inhibition rate was defined as: Inhibition
rate = (OD control − OD drug − OD background)/(OD control − OD
background) × 100%.
cDNA synthesis and quantitative PCR
analysis
Total RNA was extracted from myeloma cells using
TRIzol reagent (Invitrogen). cDNA was then synthesized using cDNA
Reverse Transcription kit (Toyobo, Osaka, Japan). Quantitative
RT-PCR was performed using the SYBR-Green PCR system on a Life ABI
7500 detection system, and results of genes of interest were
normalized to β-actin. Primer sequences of genes including
β-actin, PGC-1α, catalase (CAT), glutathione
peroxidase 1 (GPX-1), glutathione peroxidase 4
(GPX-4), superoxide dismutase-1 (SOD-1), and
superoxide dismutase-2 (SOD-2) were: β-actin:
5′-TTCCAGCCTTCCTTCCTGG-3′ (forward), and 5′-TTGCGCTCAGGAGCAAT-3′
(reverse); PGC-1α: 5′-TGGTGCCACCACCATCAAAGA-3′ (forward),
and 5′-TCA CCAAACAGCCGCAGACTG-3′ (reverse); CAT: 5′-CCAGT
CGGTGTATGCCTTCT-3′ (forward), and 5′-GGACGCCA CATTCTCGATAAG-3′
(reverse); GPX-1: 5′-CCAGTCGGT GTATGCCTTCT-3′ (forward), and
5′-GGACGCCACATT CTC GATAAG-3′ (reverse); GPX-4:
5′-GCTGTGGAAGTG GAT GAA-3′ (forward), and 5′-GATGAGGAACTGTGG
AGAG-3′ (reverse); SOD-1: 5′-ACTCATCTGTTATCCTG CTAG-3′
(forward), and 5′-GCCTCATAATAAGTGCCA TAC-3′ (reverse);
SOD-2: 5′-TCACCGAGGAGAAGTACC-3′ (forward) and
5′-TTGATATGACCACCACCATT-3′ (reverse).
Reactive oxygen species
Procedures for the detection of ROS followed the
manufacturer’s instructions. Briefly, myeloma cells treated with
different chemotherapeutic agents were incubated with 10 μM DCFH-DA
for 30 min at 37°C. Cells were rotated gently every 5 min during
incubation and then washed and resuspended in PBS. The mean
fluorescence intensity of DCF was detected by FACSCalibur flow
cytometer and analyzed with Cell Quest software (both from BD
Biosciences, Franklin Lakes, NJ, USA).
Western blotting
Western blot analysis was performed according to the
method of reference (24). Briefly,
the whole cell lysate as well as SDS-PAGE, electrophoretic transfer
and immunoblotting were prepared as earlier described. Protein
samples were analyzed by western blotting with chemiluminescence
detection (ECL; Amersham Pharmacia Biotech, Inc., Piscataway, NJ,
USA). Antibodies in this study were purchased from Cell Signaling.
Total protein concentration was measured according to the
supplier’s instructions (Thermo Fisher Scientific, Inc./Pierce,
Rockford, IL, USA).
Statistical analysis
Each experiment was repeated at least three times
independently. Data were presented as the mean ± SD values.
Differences between groups were analyzed by t-test and were
considered to indicate a statistically significant difference when
P<0.05.
Results
Expression of PGC-1α in RPMI-8226 and
U266 cells is upregulated following treatment with chemotherapy
agent
Following treatment of RPMI-8226, U266, and ARH77
cells with 10 ng/ml bortezomib or 50 μM dexamethasone for 24 h, we
tested the expression of PGC-1α, SOD-1, SOD-2, GPX-1, GPX-4 and CAT
by using RT-qPCR, to observe the changes in the levels of
antioxidant factors following treatment with dexamethasone or
bortezomib, and to determine which factors presented the same
changing pattern as PGC-1α. As shown in Fig. 1, RPMI-8226 cells treated with
bortezomib exhibited an elevated expression of PGC-1α (2.18±0.13
vs. 1.00±0.10, p=0.0002), when compared to cells without bortezomib
treatment. The level of SOD-2 was also elevated after bortezomib
treatment (1.78±0.10 vs. 1.00±0.10, p=0.0007). By contrast, after
treating RPMI-8226 cells with dexamethasone, the expression of
PGC-1α was significantly decreased as compared to that of the
control (0.23±0.01 vs. 1.00±0.10, p=0.00018). Levels of other
factors, such as SOD-1, SOD-2, and GPX-1, were also differentially
decreased. U266 cells exhibited an upregulated expression of PGC-1α
after bortezomib (1.91±0.01 vs. 1.07±0.52, p=0.048) or
dexamethasone (2.03±0.15 vs. 1.07±0.52, p=0.037) treatment. The
expression levels of GPX-1, SOD-1 and CAT were also differentially
increased in U266 cells treated with bortezomib. However,
significant changes were not evident in the levels of PGC-1α,
SOD-1, GPX-1, GPX-4 and CAT in ARH77 cells after treatment with
dexamethasone or bortezomib. As levels of PGC-1α and other
antioxidant factors are highly regulated by cellular stress and
therefore allow metabolic adaptation (25). Taken ogether, these results
indicated that myeloma cells may protect themselves from suffering
chemotherapy-induced cellular stress by enhancing the expression of
one or more of the antioxidative factors.
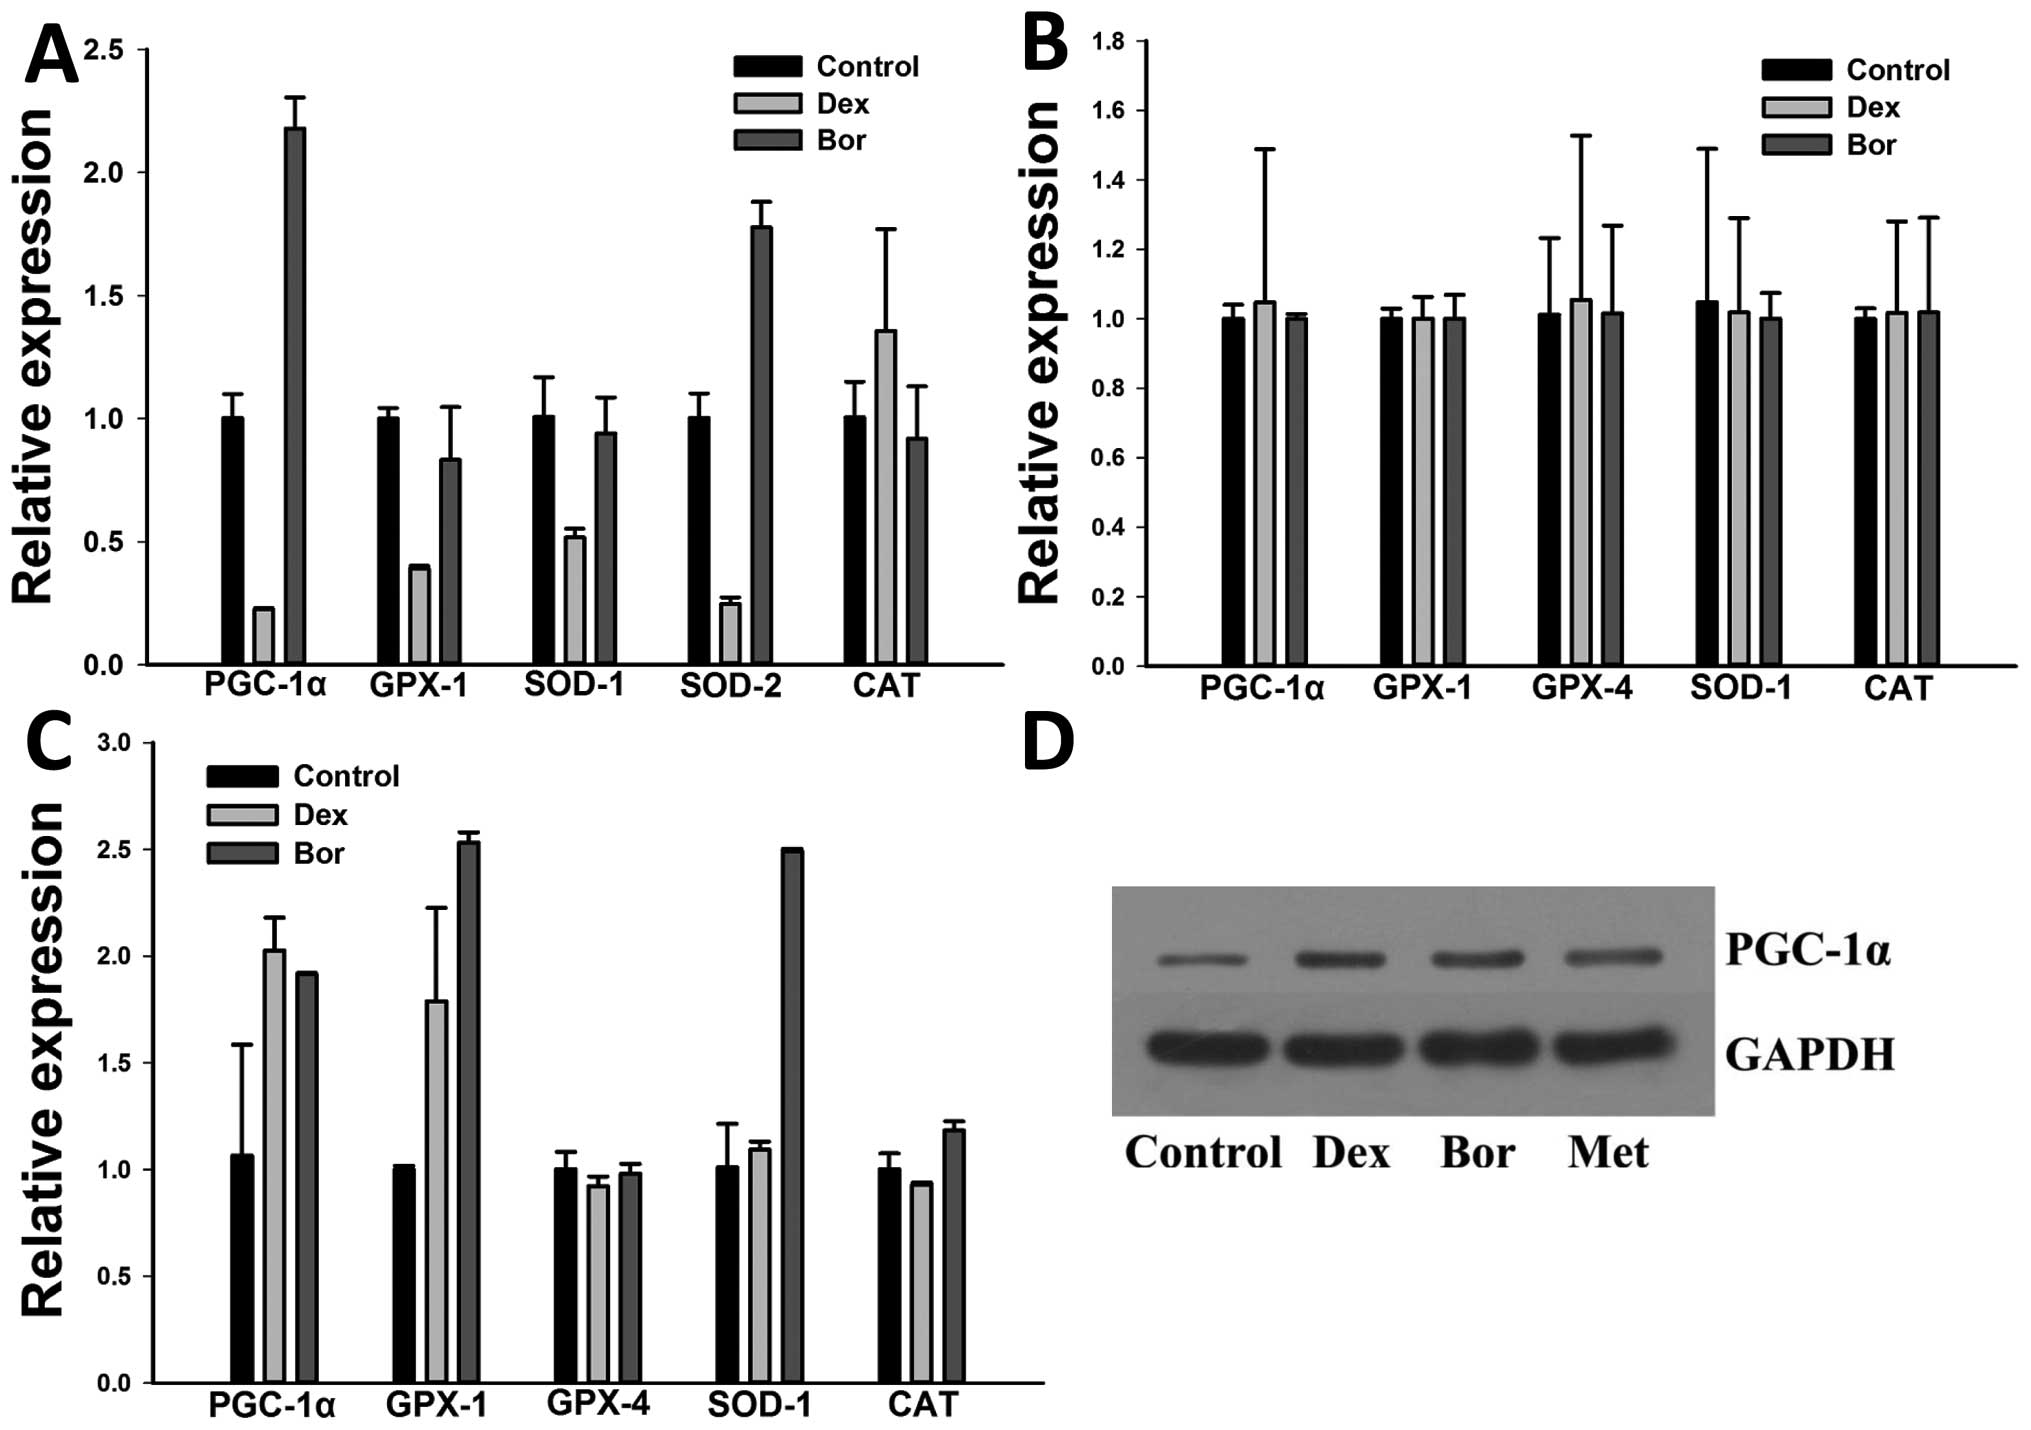 | Figure 1Expression of PGC-1α, SOD-1, SOD-2,
GPX-1, GPX-4 and CAT in RPMI-8226, ARH77 and U266 cells after
treatment. Relative expression of PGC-1α, SOD-1, SOD-2, GPX-1,
GPX-2 and CAT mRNA in (A) RPMI-8226, (B) ARH77 and (C) U266cells
after bortezomib or dexamethasone treatment. Cells were cultured
in vitro and treated with 10 ng/ml bortezomib or 50 μM
dexamethasone for 24 h. The expression levels of PGC-1α and SOD-2
in RPMI-8226 cells were significantly elevated after bortezomib
treatment when compared to the control, and the levels of PGC-1α,
GPX-1 and SOD-1 were increased after bortezomib or dexamethasone
treatment. (D) Relative expression of PGC-1α protein in RPMI-8226
cells after treatment of dexamethasone or bortezomib or metformin.
PGC-1α, peroxisome proliferator activated receptor-γ
coactivator-1α; GPX, glutathione peroxidase; SOD, superoxide
dismutase; CAT, catalase; Dex, dexamethasone; Bor, bortezomib; Met,
metformin. |
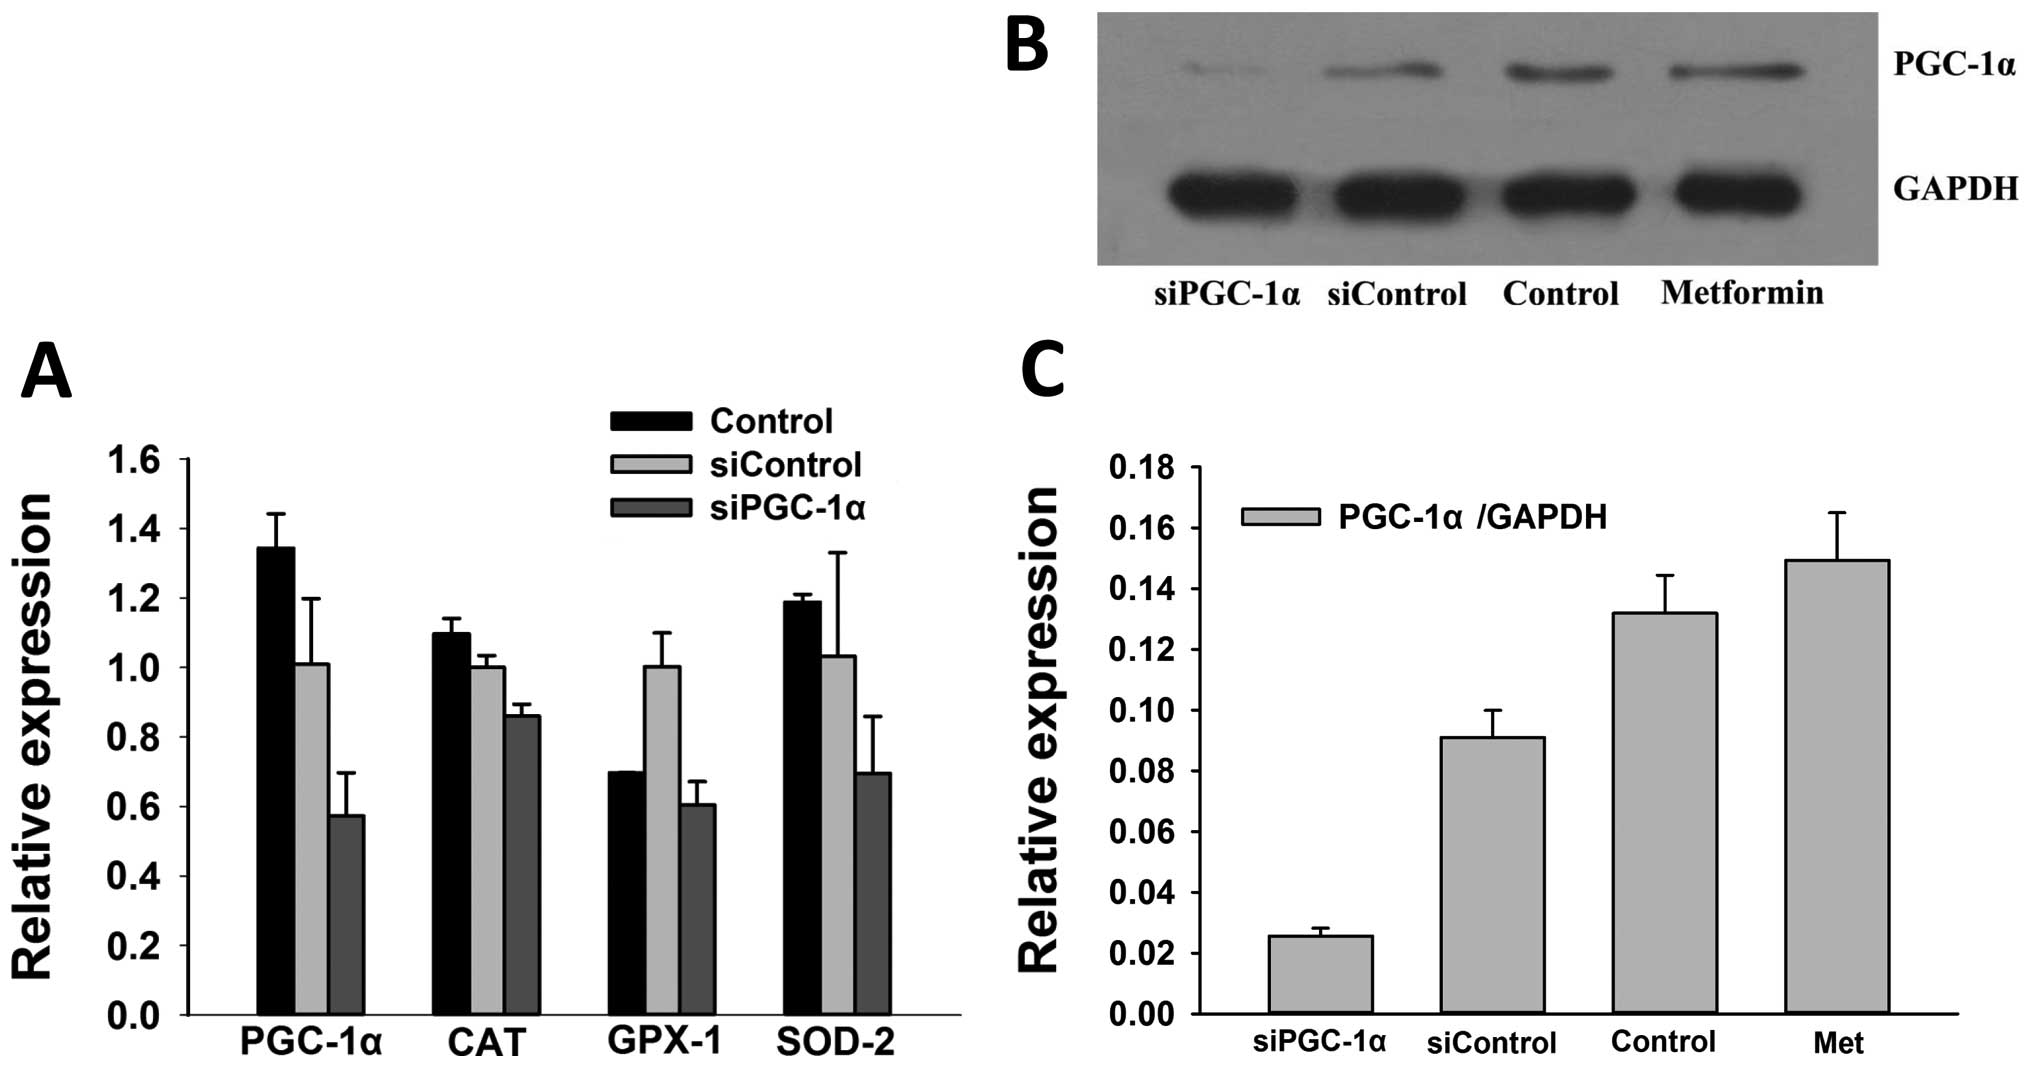
PGC-1α participates in the regulation of
SOD-2 and CAT in MM cells
SOD-2 is an effective regulator of cellular ROS, and
studies have reported that PGC-1α is an important regulator of
SOD-2 (26,27). However, whether the increased
expression of SOD-2 after chemotherapy is mediated by PGC-1α
remains to be determined. Thus, we explored the impact of PGC-1α on
the expression of SOD-2 as well as other key components of
antioxidant systems such as GPX-1 and CAT in MM RPMI-8226 cells
after chemotherapy. As shown in Fig.
2, in cells treated with siPGC-1α, the level of PGC-1α was
significantly decreased (0.57±0.12 vs. 1.01±0.19, p=0.027), and
subsequently resulted in reduced expression of SOD-2 (0.69±0.16 vs.
1.03±0.29, p=0.15), and GPX-1 (0.60±0.07 vs. 1.00±0.097, p=0.0044)
when compared to the siControl. These results suggested that PGC-1α
may maintain the same effect on the regulation of antioxidant
systems in MM.
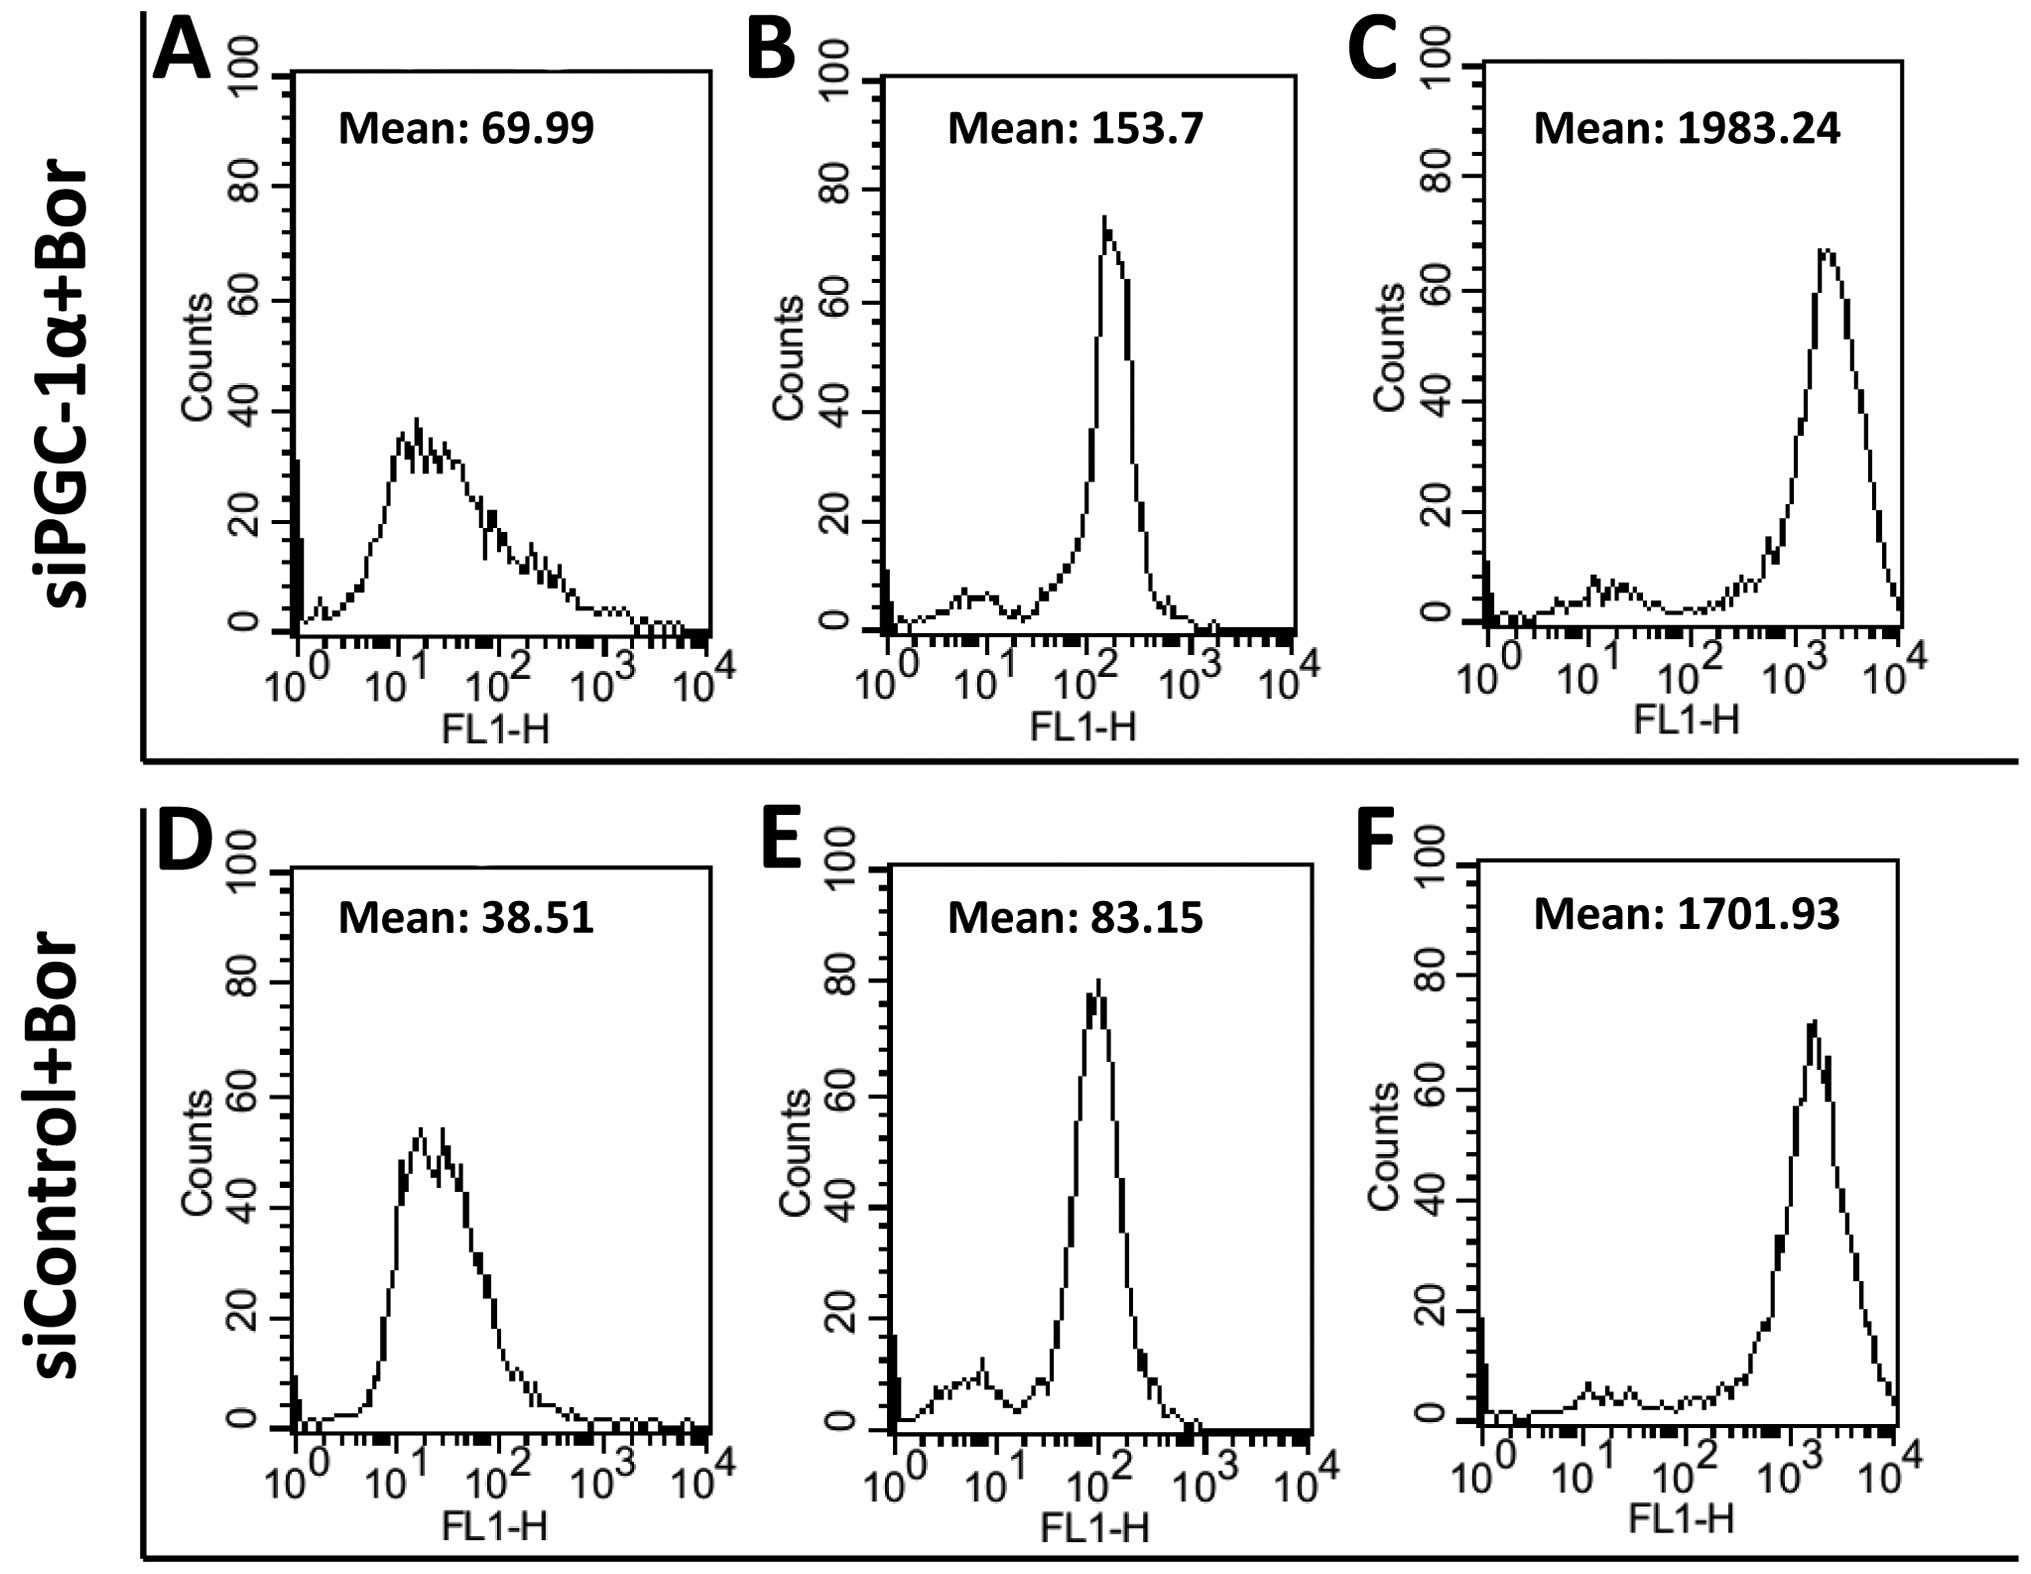
Suppression of PGC-1α by siRNA increases
the levels of ROS and enhances toxicity of bortezomib in vitro
To elucidate the role of PGC-1α in the regulation of
ROS, we suppressed the expression of PGC-1α in RPMI-8226 and ARH77
cells with siRNA-targeting PGC-1α. Then, we tested the cellular ROS
level by FACSCalibur flow cytometer. As shown in Fig. 3, the levels of ROS in siPGC-1α cells
were ~1.60-fold higher than those in the siControl cells
(1.60±0.38), suggesting that inhibition of the upregulated
expression of PGC-1α following treatment with chemotherapy may
result in MM cells suffering more ROS.
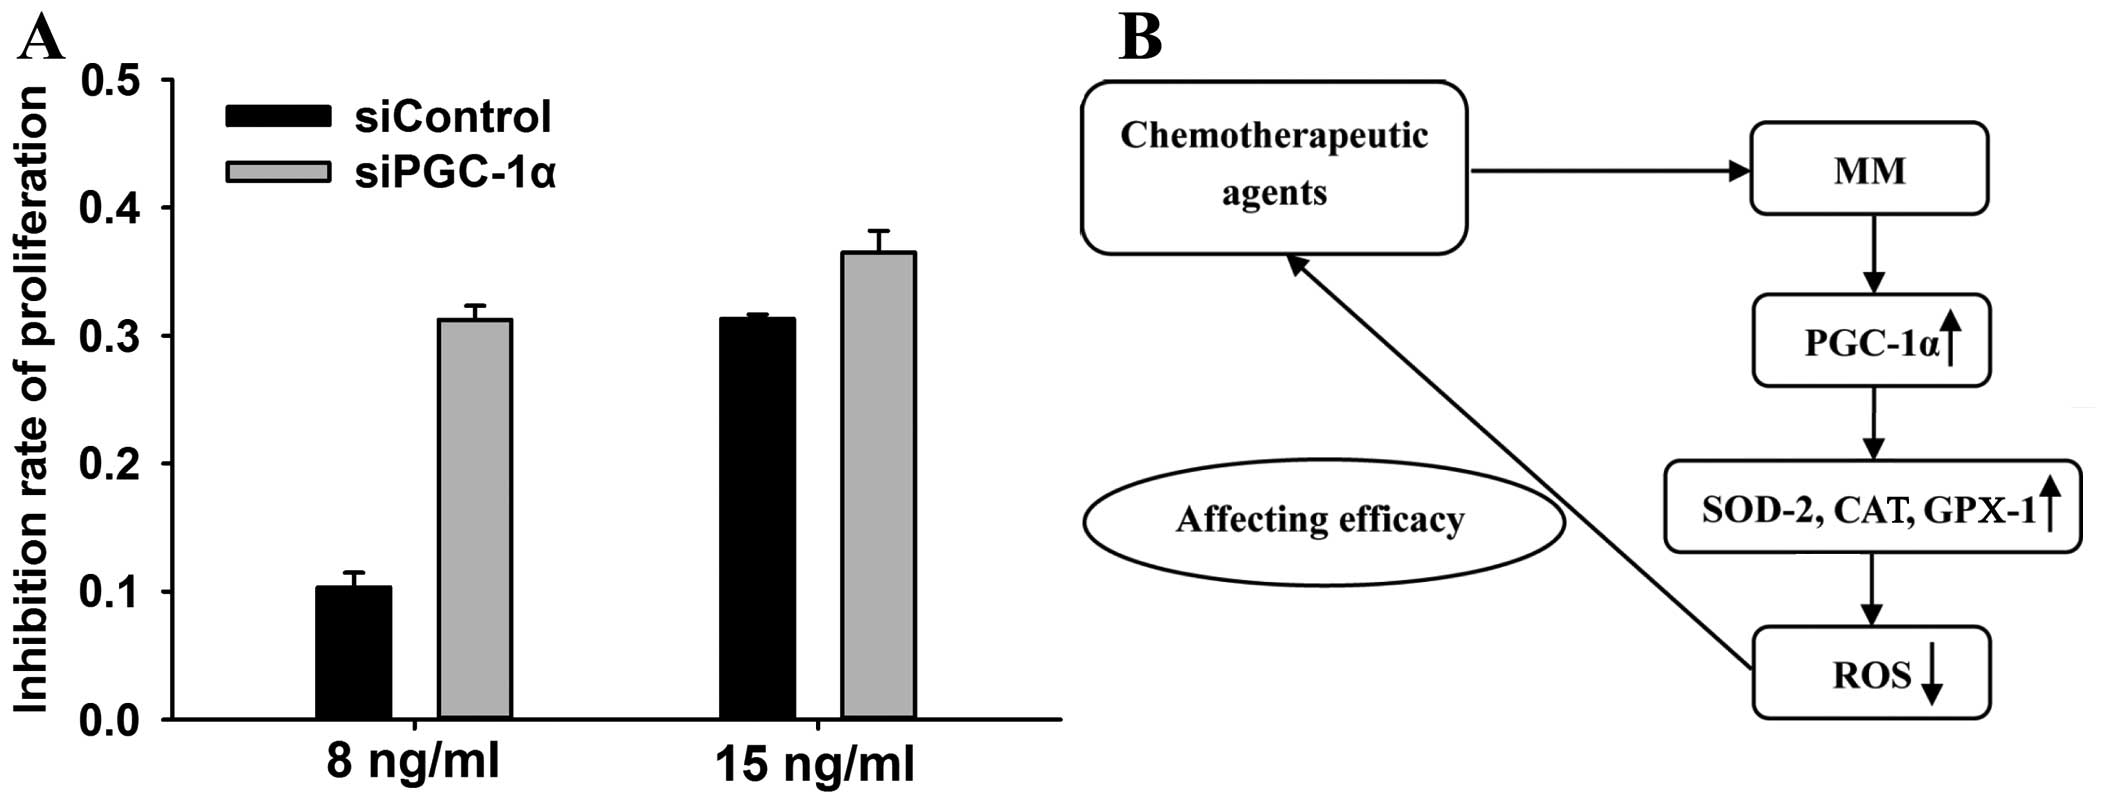
A number studies have reported that the anticancer
effect of bortezomib involves ROS (28–30).
We tested whether elevated ROS levels enhanced the pro-apoptotic
effect of bortezomib. The MTT results showed that suppression of
PGC-1α resulted in an enhanced inhibitory effect of bortezomib on
proliferation or survival (Fig.
4).
Discussion
The influence of PGC-1α on the antitumor effect of
bortezomib in malignant proliferating cells, as well as how PGC-1α
affects outcomes of MM during treatment, remains poorly understood.
In the present study, we show that the expression of PGC-1α in MM
cells was increased following bortezomib treatment, accompanied by
upregulated levels of SOD-2 and CAT. Inhibition of PGC-1α resulted
in the downregulated expression of SOD-2 and CAT, following
increased ROS and enhanced efficacy of bortezomib. The results
suggest that upregulated PGC-1α levels may be responsible for the
impaired effect of bortezomib in the treatment of MM.
PGC-1α is a transcriptional coactivator recently
recognized as an important regulator of lipid metabolism,
mitochondrial biogenesis, and glucose metabolism (3,31). As
PGC-1α has an increasingly important role in regulating the
metabolism of non-malignant cells, investigators have focused their
attention on the role of PGC-1α in cancer (11,32–34).
Studies have determined that PGC-1α has both pro- and anticancer
functions and suggest a dynamic role of PGC-1α in cancer (33). In our study, the cells treated with
bortezomib showed a higher level of PGC-1α, a higher expression of
SOD-2 and CAT was identified in these cells during chemotherapy
than in those without treatment, supporting the hypothesis that
PGC-1α promote myeloma cell survival in conditions of chemotherapy.
Furthermore, we suppressed the expression of PGC-1α in myeloma
cells by siRNA and these cells showed decreased expression levels
of SOD-2 and CAT, accompanied by increased ROS and enhanced
toxicity of the chemotherapy agents. This finding suggests that
PGC-1α has a pro-survival role in MM cells. We also found that
genes encoding other antioxidant factors (SOD-1, GPX-4 and TRXP-1
for example) increased (data not shown) independently of PGC-1α.
This result suggests there are pathways regulating antioxidant
factors being activated in myeloma cells during chemotherapeutic
stimulation.
Mitochondria are a major source of ROS in cells, and
excessive generation of ROS in mitochondria is important in the
development of several diseases, particularly cancer, and ageing
(18,35,36).
PGC-1α prompts mitochondrial biogenesis and enhances functions of
mitochondria in muscle cells (3,31), and
it seems controversial that mitochondrial biogenesis induced by
PGC-1α may produce more ROS and lead to more effective efficacy of
chemotherapy, while PGC-1α suppresses ROS accumulation and results
in the impaired effect of chemotherapy. This may be explained by
the Warburg effect. The Warburg effect refers to an enhanced
anaerobic glycolysis even in normal oxygen level conditions
(37). Studies have proved that the
Warburg effect is operative in MM cells (37,38),
and this may avoid the excessive production of ROS. Previous
studies have shown that increased mitochondrial biogenesis utilizes
less oxygen and produces less ROS (39,40).
Thus, from these aspects, the upregulation of PGC-1α did not
provide obstacles for the survival of MM cells.
Several studies have reported that the antitumor
effect of bortezomib can be influenced by ROS (19–21,28–30,41).
Pei et al used bortezomib/HDAC inhibitor regimen to treat
myeloma cells, tested the changes of ROS and apoptotic factors in
these cells, and found that the regimen markedly induced ROS
generation and apoptosis in human MM cells (19). The study by Feng et al
suggested that a bortezomib and PXD101 regimen induced cell death
in MM cells via ROS-mediated DNA damage (21). Pérez-Galán et al showed that
bortezomib induced mitochondrial depolarization and ROS generation
in mantle-cell lymphoma (41). The
above mentioned studies demonstrated that the pro-apoptotic effect
of bortezomib can be enhanced by increasing ROS in tumor cells. In
the present study, this was achieved by suppression of PGC-1α,
which led to decreased levels of SOD-2 and CAT, and elevated levels
of ROS.
In conclusion, our results suggest that MM cells
experiencing chemotherapy may induce the expression of PGC-1α and a
set of genes of antioxidant factors (SOD-2, CAT) in a
PGC-1α-dependent manner to reduce ROS accumulation. Inhibition of
PGC-1α is sufficient to improve the efficacy of bortezomib by
increasing ROS.
Acknowledgements
This study was supported by the HuBei Provincial
Natural Science Fund Subject (2013CFB096).
References
|
1
|
Rajkumar SV: Multiple myeloma: 2013 update
on diagnosis, risk-stratification, and management. Am J Hematol.
88:226–235. 2013. View Article : Google Scholar : PubMed/NCBI
|
|
2
|
Allegra A, Penna G, Alonci A, et al:
Monoclonal antibodies: potential new therapeutic treatment against
multiple myeloma. Eur J Haematol. 90:441–468. 2013. View Article : Google Scholar : PubMed/NCBI
|
|
3
|
Wu Z, Puigserver P, Andersson U, et al:
Mechanisms controlling mitochondrial biogenesis and respiration
through the thermogenic coactivator PGC-1. Cell. 98:115–124. 1999.
View Article : Google Scholar : PubMed/NCBI
|
|
4
|
St-Pierre J, Drori S, Uldry M, et al:
Suppression of reactive oxygen species and neurodegeneration by the
PGC-1 transcriptional coactivators. Cell. 127:397–408. 2006.
View Article : Google Scholar : PubMed/NCBI
|
|
5
|
Austin S and St-Pierre J: PGC1α and
mitochondrial metabolism - emerging concepts and relevance in
ageing and neurodegenerative disorders. J Cell Sci. 125:4963–4971.
2012. View Article : Google Scholar
|
|
6
|
Liang H and Ward WF: PGC-1alpha: a key
regulator of energy metabolism. Adv Physiol Educ. 30:145–151. 2006.
View Article : Google Scholar : PubMed/NCBI
|
|
7
|
Wrann CD, White JP, Salogiannnis J, et al:
Exercise induces hippocampal BDNF through a PGC-1α/FNDC5 pathway.
Cell Metab. 18:649–659. 2013. View Article : Google Scholar : PubMed/NCBI
|
|
8
|
Puigserver P and Spiegelman BM: Peroxisome
proliferator-activated receptor-gamma coactivator 1 alpha (PGC-1
alpha): transcriptional coactivator and metabolic regulator. Endocr
Rev. 24:78–90. 2003. View Article : Google Scholar : PubMed/NCBI
|
|
9
|
Kim MS, Sweeney TR, Shigenaga JK, et al:
Tumor necrosis factor and interleukin 1 decrease RXRalpha,
PPARalpha, PPARgamma, LXRalpha, and the coactivators SRC-1,
PGC-1alpha, and PGC-1beta in liver cells. Metabolism. 56:267–279.
2007. View Article : Google Scholar : PubMed/NCBI
|
|
10
|
Zhang Y, Ba Y, Liu C, et al: PGC-1alpha
induces apoptosis in human epithelial ovarian cancer cells through
a PPARgamma-dependent pathway. Cell Res. 17:363–373. 2007.
View Article : Google Scholar : PubMed/NCBI
|
|
11
|
Salem AF, Whitaker-Menezes D, Howell A,
Sotgia F and Lisanti MP: Mitochondrial biogenesis in epithelial
cancer cells promotes breast cancer tumor growth and confers
autophagy resistance. Cell Cycle. 11:4174–4180. 2012. View Article : Google Scholar : PubMed/NCBI
|
|
12
|
Do MT, Kim HG, Choi JH and Jeong HG:
Metformin induces microRNA-34a to downregulate the
Sirt1/Pgc-1α/Nrf2 pathway, leading to increased susceptibility of
wild-type p53 cancer cells to oxidative stress and therapeutic
agents. Free Radic Biol Med. 74:21–34. 2014. View Article : Google Scholar : PubMed/NCBI
|
|
13
|
McGuirk S, Gravel SP, Deblois G, et al:
PGC-1α supports glutamine metabolism in breast cancer. Cancer
Metab. 1:222013. View Article : Google Scholar
|
|
14
|
Cao D, Zhou H, Zhao J, et al: PGC-1α
integrates glucose metabolism and angiogenesis in multiple myeloma
cells by regulating VEGF and GLUT-4. Oncol Rep. 31:1205–1210.
2014.PubMed/NCBI
|
|
15
|
Nishikawa T, Edelstein D, Du XL, et al:
Normalizing mitochondrial superoxide production blocks three
pathways of hyperglycaemic damage. Nature. 404:787–790. 2000.
View Article : Google Scholar : PubMed/NCBI
|
|
16
|
Valle I, Alvarez-Barrientos A, Arza E, et
al: PGC-1alpha regulates the mitochondrial antioxidant defense
system in vascular endothelial cells. Cardiovasc Res. 66:562–573.
2005. View Article : Google Scholar : PubMed/NCBI
|
|
17
|
Edeas M: Strategies to target mitochondria
and oxidative stress by antioxidants: key points and perspectives.
Pharm Res. 28:2771–2779. 2011. View Article : Google Scholar : PubMed/NCBI
|
|
18
|
Vurusaner B, Poli G and Basaga H: Tumor
suppressor genes and ROS: complex networks of interactions. Free
Radic Biol Med. 52:7–18. 2012. View Article : Google Scholar
|
|
19
|
Pei XY, Dai Y and Grant S: Synergistic
induction of oxidative injury and apoptosis in human multiple
myeloma cells by the proteasome inhibitor bortezomib and histone
deacetylase inhibitors. Clin Cancer Res. 10:3839–3852. 2004.
View Article : Google Scholar : PubMed/NCBI
|
|
20
|
Pei XY, Dai Y and Grant S: The proteasome
inhibitor bortezomib promotes mitochondrial injury and apoptosis
induced by the small molecule Bcl-2 inhibitor HA14-1 in multiple
myeloma cells. Leukemia. 17:2036–2045. 2003. View Article : Google Scholar : PubMed/NCBI
|
|
21
|
Feng R, Oton A, Mapara MY, et al: The
histone deacetylase inhibitor, PXD101, potentiates
bortezomib-induced anti-multiple myeloma effect by induction of
oxidative stress and DNA damage. Br J Haematol. 139:385–397. 2007.
View Article : Google Scholar : PubMed/NCBI
|
|
22
|
Wang J and Yi J: Cancer cell killing via
ROS: to increase or decrease, that is the question. Cancer Biol
Ther. 7:1875–1884. 2008. View Article : Google Scholar : PubMed/NCBI
|
|
23
|
Kong X, Wang R, Xue Y, et al: Sirtuin 3, a
new target of PGC-1alpha, plays an important role in the
suppression of ROS and mitochondrial biogenesis. PloS One.
5:e117072010. View Article : Google Scholar : PubMed/NCBI
|
|
24
|
Pearce EL, Walsh MC, Cejas PJ, et al:
Enhancing CD8 T-cell memory by modulating fatty acid metabolism.
Nature. 460:103–107. 2009. View Article : Google Scholar : PubMed/NCBI
|
|
25
|
Wenz T: Regulation of mitochondrial
biogenesis and PGC-1α under cellular stress. Mitochondrion.
13:134–142. 2013. View Article : Google Scholar : PubMed/NCBI
|
|
26
|
Leick L, Lyngby SS, Wojtaszewski JF and
Pilegaard H: PGC-1alpha is required for training-induced prevention
of age-associated decline in mitochondrial enzymes in mouse
skeletal muscle. Exp Gerontol. 45:336–342. 2010. View Article : Google Scholar : PubMed/NCBI
|
|
27
|
Qu A, Jiang C, Xu M, et al: PGC-1alpha
attenuates neointimal formation via inhibition of vascular smooth
muscle cell migration in the injured rat carotid artery. Am J
Physiol Cell Physiol. 297:C645–C653. 2009. View Article : Google Scholar : PubMed/NCBI
|
|
28
|
Hong YS, Hong SW, Kim SM, et al:
Bortezomib induces G2-M arrest in human colon cancer cells through
ROS-inducible phosphorylation of ATM-CHK1. Int J Oncol. 41:76–82.
2012.PubMed/NCBI
|
|
29
|
Song IS, Jeong YJ, Jeong SH, et al:
Combination treatment with 2-methoxyestradiol overcomes bortezomib
resistance of multiple myeloma cells. Exp Mol Med. 45:e502013.
View Article : Google Scholar : PubMed/NCBI
|
|
30
|
Nakata W, Hayakawa Y, Nakagawa H, et al:
Anti-tumor activity of the proteasome inhibitor bortezomib in
gastric cancer. Int J Oncol. 39:1529–1536. 2011.PubMed/NCBI
|
|
31
|
Finck BN and Kelly DP: PGC-1 coactivators:
inducible regulators of energy metabolism in health and disease. J
Clin Invest. 116:615–622. 2006. View
Article : Google Scholar : PubMed/NCBI
|
|
32
|
Tennakoon JB, Shi Y, Han JJ, et al:
Androgens regulate prostate cancer cell growth via an
AMPK-PGC-1alpha-mediated metabolic switch. Oncogene. Nov
4–2013.(Epub ahead of print). View Article : Google Scholar
|
|
33
|
Girnun GD: The diverse role of the PPARγ
coactivator 1 family of transcriptional coactivators in cancer.
Semin Cell Dev Biol. 23:381–388. 2012. View Article : Google Scholar : PubMed/NCBI
|
|
34
|
Huang H and Manton KG: The role of
oxidative damage in mitochondria during aging: a review. Front
Biosci. 9:1100–1117. 2004. View
Article : Google Scholar : PubMed/NCBI
|
|
35
|
Scarpulla RC, Vega RB and Kelly DP:
Transcriptional integration of mitochondrial biogenesis. Trends
Endocrinol Metab. 23:459–466. 2012. View Article : Google Scholar : PubMed/NCBI
|
|
36
|
Radak Z, Zhao Z, Koltai E, Ohno H and
Atalay M: Oxygen consumption and usage during physical exercise:
the balance between oxidative stress and ROS-dependent adaptive
signaling. Antioxid Redox Signal. 18:1208–1246. 2013. View Article : Google Scholar :
|
|
37
|
Sanchez WY, McGee SL, Connor T, et al:
Dichloroacetate inhibits aerobic glycolysis in multiple myeloma
cells and increases sensitivity to bortezomib. Br J Cancer.
108:1624–1633. 2013. View Article : Google Scholar : PubMed/NCBI
|
|
38
|
Fujiwara S, Kawano Y, Yuki H, et al: PDK1
inhibition is a novel therapeutic target in multiple myeloma. Br J
Cancer. 108:170–178. 2013.PubMed/NCBI
|
|
39
|
Civitarese AE, Carling S, Heilbronn LK, et
al: Calorie restriction increases muscle mitochondrial biogenesis
in healthy humans. PLoS Med. 4:e762007. View Article : Google Scholar : PubMed/NCBI
|
|
40
|
Lopez-Lluch G, Hunt N, Jones B, et al:
Calorie restriction induces mitochondrial biogenesis and
bioenergetic efficiency. Proc Natl Acad Sci USA. 103:1768–1773.
2006. View Article : Google Scholar : PubMed/NCBI
|
|
41
|
Pérez-Galán P, Roue G, Villamor N,
Montserrat E, Campo E and Colomer D: The proteasome inhibitor
bortezomib induces apoptosis in mantle-cell lymphoma through
generation of ROS and Noxa activation independent of p53 status.
Blood. 107:257–264. 2006. View Article : Google Scholar
|