Introduction
Nonalcoholic fatty liver disease (NAFLD) is a
spectrum of liver conditions with histopathological features
similar to alcoholic liver disease that arise in patients with no
apparent history of alcohol intake. NAFLD is classified into two
main types: nonalcoholic fatty liver (NAFL), characterized simply
by deposition of fat in the liver, and nonalcoholic steatohepatitis
(NASH), characterized by hepatic inflammation with hepatocyte
injury (ballooning), with or without fibrosis, as well as hepatic
steatosis (1). NAFL and NASH are
considered to be hepatic manifestations of metabolic syndrome,
because the presence of obesity and obesity-induced insulin
resistance is fundamentally associated with the pathogenesis and
progression of the two diseases. Consequently, NAFL and NASH are
often accompanied by complications such as diabetes, hypertension,
and dyslipidemia (2). However, the
molecular mechanisms underlying the progression of NAFL and NASH in
association with metabolic syndrome have not yet been fully
elucidated.
NASH can lead from progressive hepatic disease to
liver cirrhosis (LC), with subsequent development of hepatocellular
carcinoma (HCC) (3). The incidence
rate of NASH-derived HCC without complication by LC was found to
range from 0 to 3% over a 20-year period, whereas the rate of
NASH-derived HCC with LC was higher, ranging from 2.4% over a
7-year period to 12.8% over a 3-year period (4). Although the incidence of HCC is lower
in patients with NASH than in patients with hepatitis C virus (HCV)
infection, the number of patients with NASH-associated HCC is
expected to increase along with the growing incidence of metabolic
syndrome (4,5).
According to the two-hit theory, a widely known
hypothesis aimed at explaining the pathogenesis and progression of
NAFLD/NASH, onset of hepatic fat deposition is the ‘first hit’,
while the ‘second hit’ can be due to any of several factors,
including hepatocellular injury and genetic predisposition, and
leads to the onset of NASH (6).
Although a large part of the disease process remains unexplained by
the two-hit theory, it is now widely believed that many of the risk
factors are intricately associated with each other. Dietary and/or
genetic factors, along with inflammatory mediators of intestinal
origin or those derived from fat tissue, may contribute in parallel
to the development of NASH. Tilg et al have characterized
this process by introducing the concept of ‘multiple parallel hits’
(7).
Since factors that contribute to the pathogenesis of
NASH leading to LC and HCC remain unclear, we investigated the
pathological processes of NASH-associated hepatocarcinogenesis
using animal models. No fibrosis formation or hepatocarcinogenesis
have been reported in studies with conventional models using
leptin-deficient ob/ob mice, or in high-fat or high-fructose diet
models (8), even though
hyperglycemia, insulin resistance, and obesity were observed under
these conditions. In models that use mice fed a choline-deficient
L-amino acid (CDAA)-defined diet, no abnormal glucose tolerance or
obesity has been clearly observed, despite the development of
steatosis and subsequent hepatic fibrosis, the latter of which is
ultimately associated with LC and hepatocarcinogenesis (9). Thus, no studies have accurately
recapitulated the pathogenesis of human NASH in conventional animal
models. In a model using STAM mice fed a high-fat diet after the
onset of pancreatic dysfunction induced by streptozotocin
administration, findings of a recent study showed the development
of steatosis, hepatic fibrosis, and HCC over shorter periods
(10). The STAM mouse model has
drawn attention because the animals predictably and consistently
develop pathologies similar to human NASH, although
hyperinsulinemia is not observed in this mice model. However, the
molecular mechanisms of hepatocarcinogenesis in this model have not
been fully investigated. In this study, we investigated whether a
high-fat diet affects hepatocarcinogenesis in a NASH model induced
by hyperglycemia, and explored the genetic associations with the
pathogenic mechanisms of hepatocarcinogenesis.
Materials and methods
Animals
To generate STAM mice, two-day-old male C57BL/6N
(B6N) mice received subcutaneous injection of 200 μg streptozotocin
to reduce pancreatic function. Male STAM mice were purchased from
Stelic Institute & Co. (Tokyo, Japan). Starting at four weeks
of age, STAM mice were fed a high-fat diet (HFD) (STAM-F) or
conventional diet (STAM-C). Four-week-old male B6N mice were
purchased from Charles River Laboratories Japan, Inc., (Yokohama,
Japan). Similarly, starting at four weeks of age, B6N mice were fed
a high-fat diet (B6N-F) or conventional diet (B6N-C). In the
high-fat diet, 60% of the calories (HFD-60) were derived from fat
(Oriental Yeast Co., Ltd., Tokyo, Japan), while the conventional
diet (CE-2) contained 4.6% fat (CLEA Japan, Inc., Tokyo, Japan).
The mice were kept in standard wire cages and allowed free access
to food and water. The animals were then weighed, and blood
pressure (Model MK-1030, Blood Pressure Monitor For Rats &
Mice, Muromachi Kikai Co., Ltd., Tokyo, Japan) and serum fasting
blood glucose (FBG) were measured weekly. The animals were
sacrificed at 10, 14, or 18 weeks. Subsequently, the mice were
fasted for 12 h prior to sacrifice, and serum and liver samples
were collected and stored at −80°C prior to use.
Male C57BLKS/J
lar-+Leprdb/+Leprdb (db/db) mice were
purchased from Japan SLC, Inc. (Hamamatsu, Japan). These mice were
established as a type 2 diabetes mouse model. Five-week-old db/db
mice were fed an HFD and sacrificed at 25 weeks (db/db-F group). In
addition, four-week-old B6N mice were fed a CDAA diet (Dyets,
Bethlehem, PA, USA) and sacrificed at 16 weeks (CDAA group).
The animal experiments were approved by the
Institutional Animal Care and Use Committee guideline of Kagoshima
University Graduate School of Medical and Dental Sciences.
Biochemical examination
Aspartate aminotransferase (AST) and alanine
aminotransferase (ALT) levels in mice were measured using Spotchem™
EZ SP-4430 (Arkray, Inc., Kyoto, Japan). Fasting blood glucose
(FBG) levels were measured using Cyclic GB sensor (Eidia Co., Ltd.,
Tokyo, Japan). Serum insulin levels were measured using an
enzyme-linked immunosorbent assay (ELISA, Morinaga Institute of
Biological Science, Inc., Yokohama, Japan) according to the
manufacturer’s instructions.
Histological examination
Liver tissues were isolated and fixed in 10%
neutralized formalin buffer solution. The samples were then
embedded in paraffin and sliced at a thickness of 4–5 μm. Liver
pathology was evaluated by staining with hematoxylin/eosin.
Accumulation of fat in hepatocytes was evaluated by
oil red O staining. Liver tissue section were covered with O.C.T
gel and stored at −80°C. Frozen sections of liver tissue (<6 μm)
were fixed in 10% neutralized formalin buffer solution for 30 min
and then rinsed with 60% isopropanol. After washing with distilled
water, the nuclei were stained with Mayer’s hematoxylin for 1 min,
and then rinsed again with distilled water. Quick Grain Standard
(Inotech Co., Ltd, Hiroshima, Japan) was used to measure the area
positive for oil red O staining.
Liver fibrosis was evaluated by Sirius red staining.
Sections (4 μm) were fixed in saturated picric acid and 1% Sirius
red for 90 min at room temperature. Positively stained areas were
measured using Quick Grain Standard.
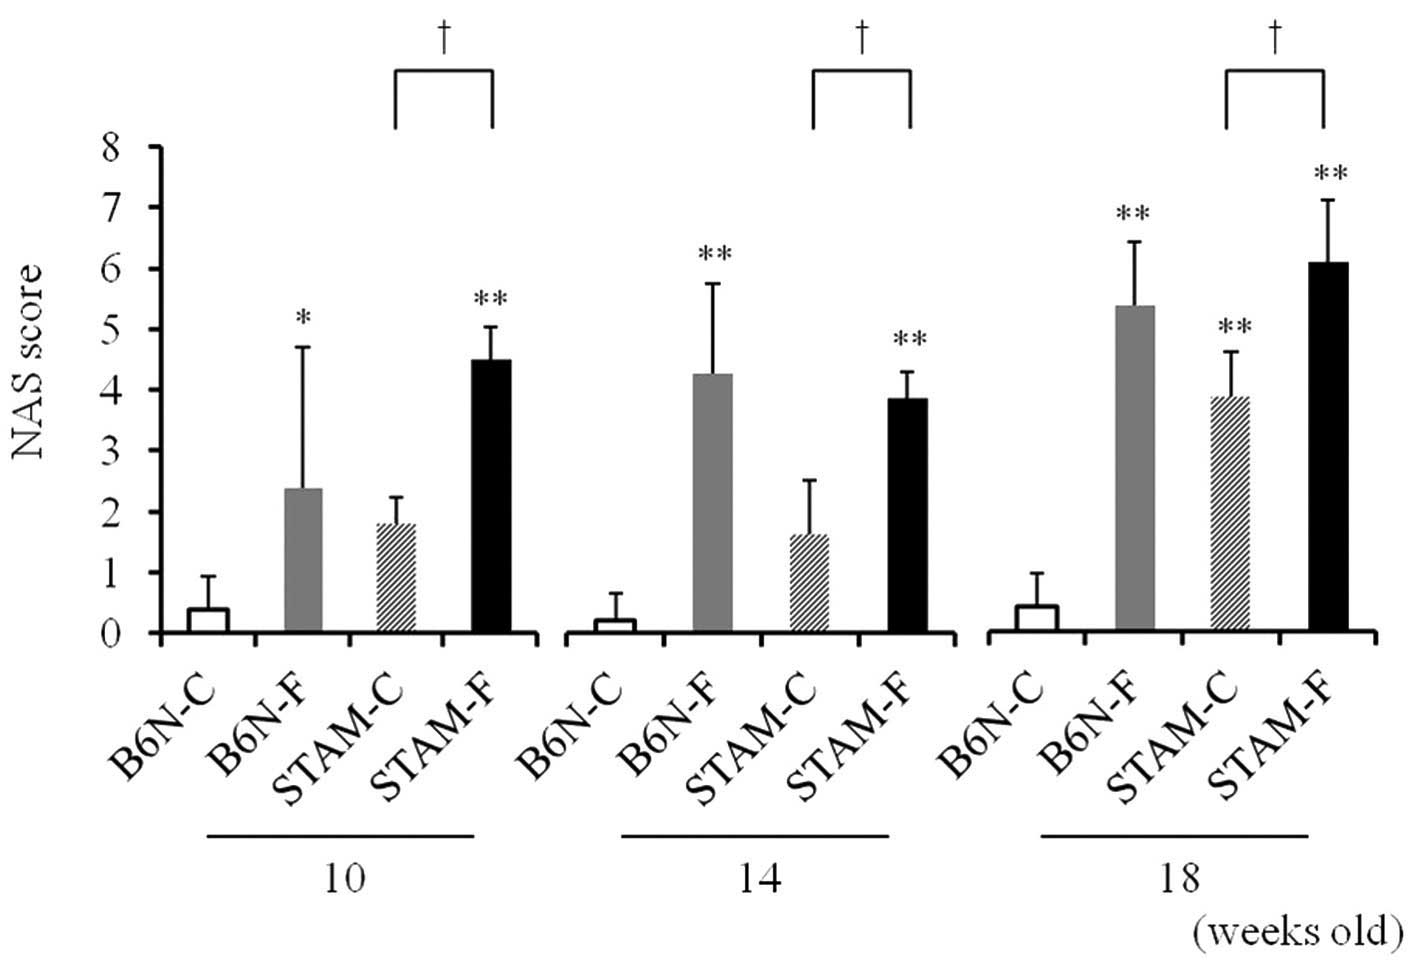
Activity of NAFL/NASH was assessed using the NAFLD
Activity Score (NAS), as described by Kleiner et al
(11), a composite parameter based
on separate scores for steatosis (0–3), lobular inflammation (0–3),
and hepatocellular ballooning (0–2). The NAS is the sum of these
scores: values ≥5 are correlated with a diagnosis of NASH in humans
(11).
Immunohistochemistry
Hepatic tumors were assessed by immunostaining for
placental glutathione S-transferase (GST-P) and heat shock protein
(HSP)-70. A rabbit polyclonal antibody against GST-P (Medical &
Biological laboratories Co., Ltd, Nagoya, Japan) was used at a
dilution of 1:2,000, and a rabbit polyclonal antibody against
HSP-70 (Cell Signaling Technology, Inc.) was used at a dilution of
1:25.
Gene expression profile
Liver tissues of 14-week-old B6N-C, B6N-F and STAM-F
mice were homogenized in TRIzol solution (Life Technologies,
Carlsbad, CA, USA), and RNA was then isolated according to the
manufacturer’s instructions. En bloc total RNA from five mice was
subjected to expression profiling on an Affymetrix GeneChip Mouse
genome 430 2.0 array according to a standard protocol (Affimetrix,
Santa Clara, CA, USA). The resultant expression profiles were
normalized using the GeneSpring GX 11 software (Agilent
Technologies, Santa Clara, CA, USA).
Quantitative RT-PCR
Template cDNA was synthesized from 0.5 μg of total
RNA using a PrimeScript RT reagent kit (Takara Bio Inc., Otsu,
Japan). Following microarray analysis, we identified genes that
were expressed more highly in STAM-F than in B6N-F and B6N-C. The
expression levels were subsequently detected in liver tissue by
quantitative RT-PCR using SYBR Premix Ex Taq™ II (Takara Bio Inc.)
on a StepOnePlus™ real-time PCR system. The level of each mRNA was
normalized to that of β-actin (Actb) mRNA in the same
sample. The following mRNAs were examined in this manner: serine
palmitoyltransferase long chain base subunit 3 (Sptlc3),
matrix metallopeptidase 13 (Mmp13), glutamate receptor
interacting protein 1 (Grip1), chemokine (C-X-C motif)
ligand 14 (Cxcl14), α-fetoprotein (Afp), glypican 3
(Gpc3), and β-actin (Actb). Primer sequences are
provided in Table I.
 | Table IOligonucleotide sequence of primers
for quantitative RT-PCR. |
Table I
Oligonucleotide sequence of primers
for quantitative RT-PCR.
| Genes | Forward primer
(5′-3′) | Reverse primer
(5′-3′) |
|---|
| Sptlc3 |
TTTGGACTGGACCCTGAAGATATTG |
TGACTGCATCCGTAAATAATCCACA |
| Mmp13 |
TCCCTGGAATTGGCAACAAAG |
GGAATTTGTTGGCATGACTCTCAC |
| Grip1 |
TGAAGCCCTACGACAGGCTCTTA |
GTCCAGCTTGTTGCCAGATTCA |
| Cxcl14 |
CAAAGTACCCACACTGCGAGGA |
CCAGGCATTGTACCACTTGATGA |
| Afp |
AGTGCTGCAAAGCCCAGGA |
TGGAGATGTTTAAACGCCCAAAG |
| Gpc3 |
ACTGCGGTGATGATGAAGATGAA |
GCATCGTCCACATCCAGATCATA |
| Actb |
CATCCGTAAAGACCTCTATGCCAAC |
ATGGAGCCACCGATCCACA |
Statistical analysis
Results are presented as means ± standard
deviations. Statistical evaluation was performed with IBM SPSS
15.0J (IBM Corporation, Armonk, NY, USA) for Windows. Data were
analyzed for statistical differences using the Mann-Whitney U test
or Tukey’s HSD test. P<0.05 was considered statistically
significant.
Results
Physical findings in B6N and STAM
mice
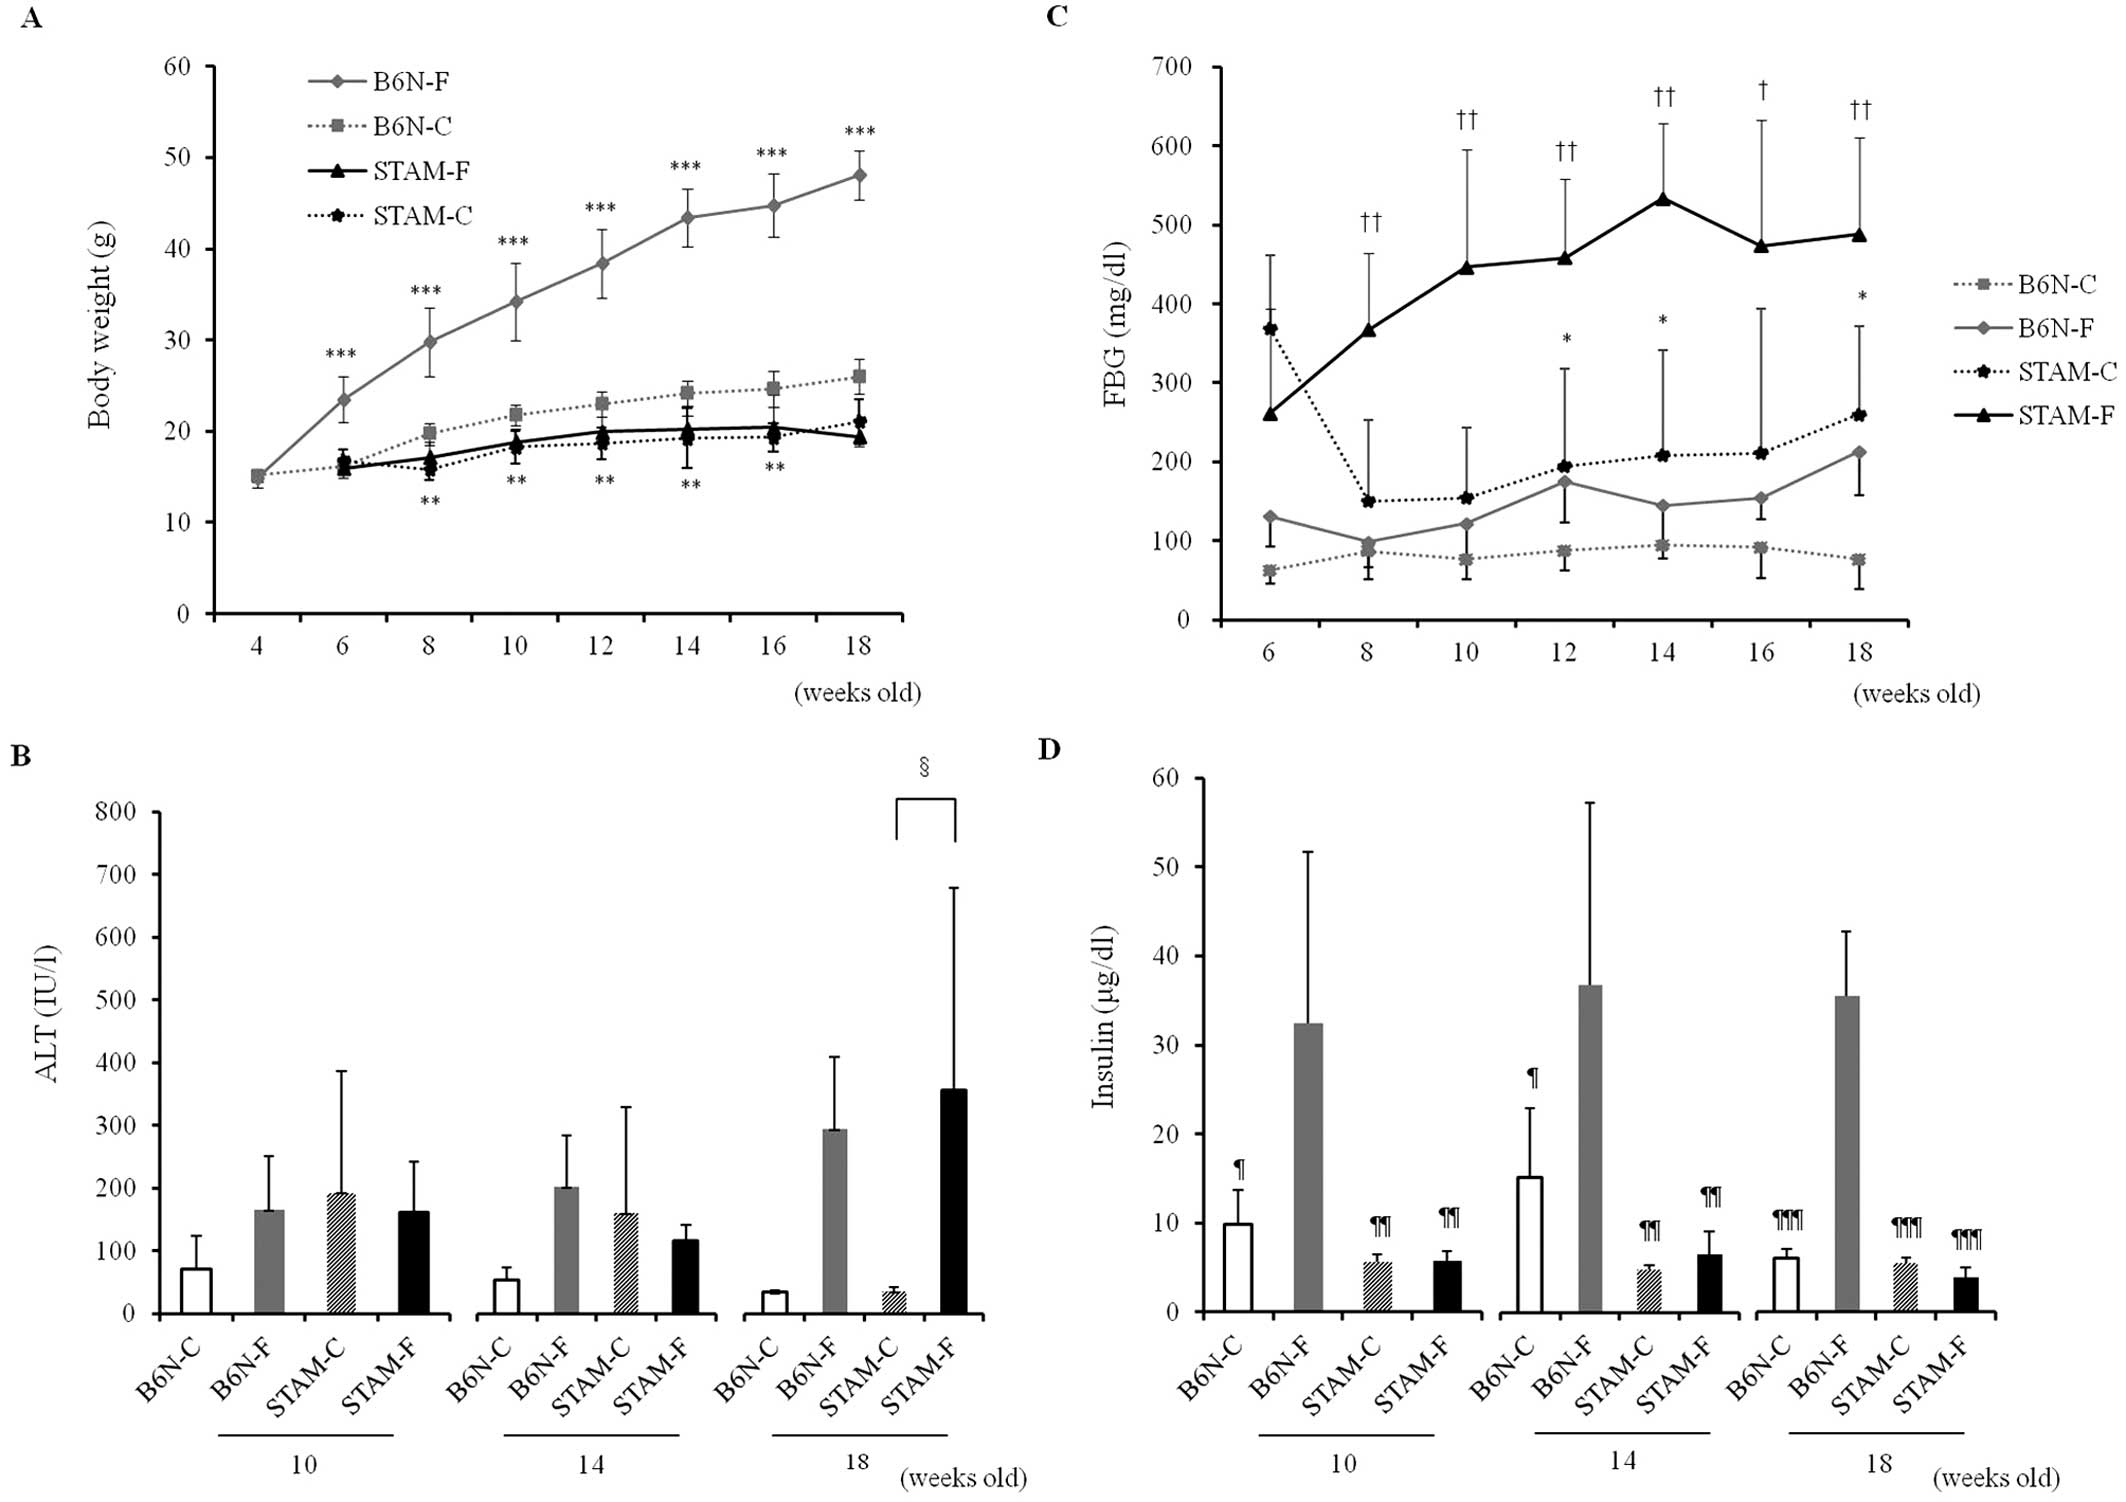
Body weight gradually increased in B6N-F mice, but
no increase was observed in either of the STAM groups between 4 and
18 weeks of age (Fig. 1A). The
dietary calorie intake of STAM-F was 1.3-fold higher that of STAM-C
mice, although there was no significant difference in weight
between the two groups. Blood pressure did not differ significantly
during the observed periods: specifically, systolic blood pressure
was ~100 mmHg in all groups each week.
Biochemical examination in STAM and B6N
mice
Serum ALT levels decreased from 10 weeks of age (6
weeks of diet) to 18 weeks (14 weeks of diet) in B6N-C and STAM-C
mice, but increased in B6N-F and STAM-F mice (Fig. 1B). In addition, ALT levels in the
B6N-F groups were higher than those in the B6N-C groups at 10, 14
and 18 weeks, and ALT levels in STAM-F were significantly higher
than those in STAM-C at 18 weeks (Fig.
1B).
The two STAM groups, in which pancreatic function
was degraded, had high FBG relative to the B6N groups, and FBG was
significantly higher in the STAM-F (>400 mg/dl) than in the
STAM-C, B6N-F and B6N-C groups (Fig.
1C). By contrast, serum insulin levels were lower in the two
STAM groups, and were significantly higher in B6N-F than in the
other three groups (Fig. 1D).
Hepatic steatosis in STAM and B6N
mice
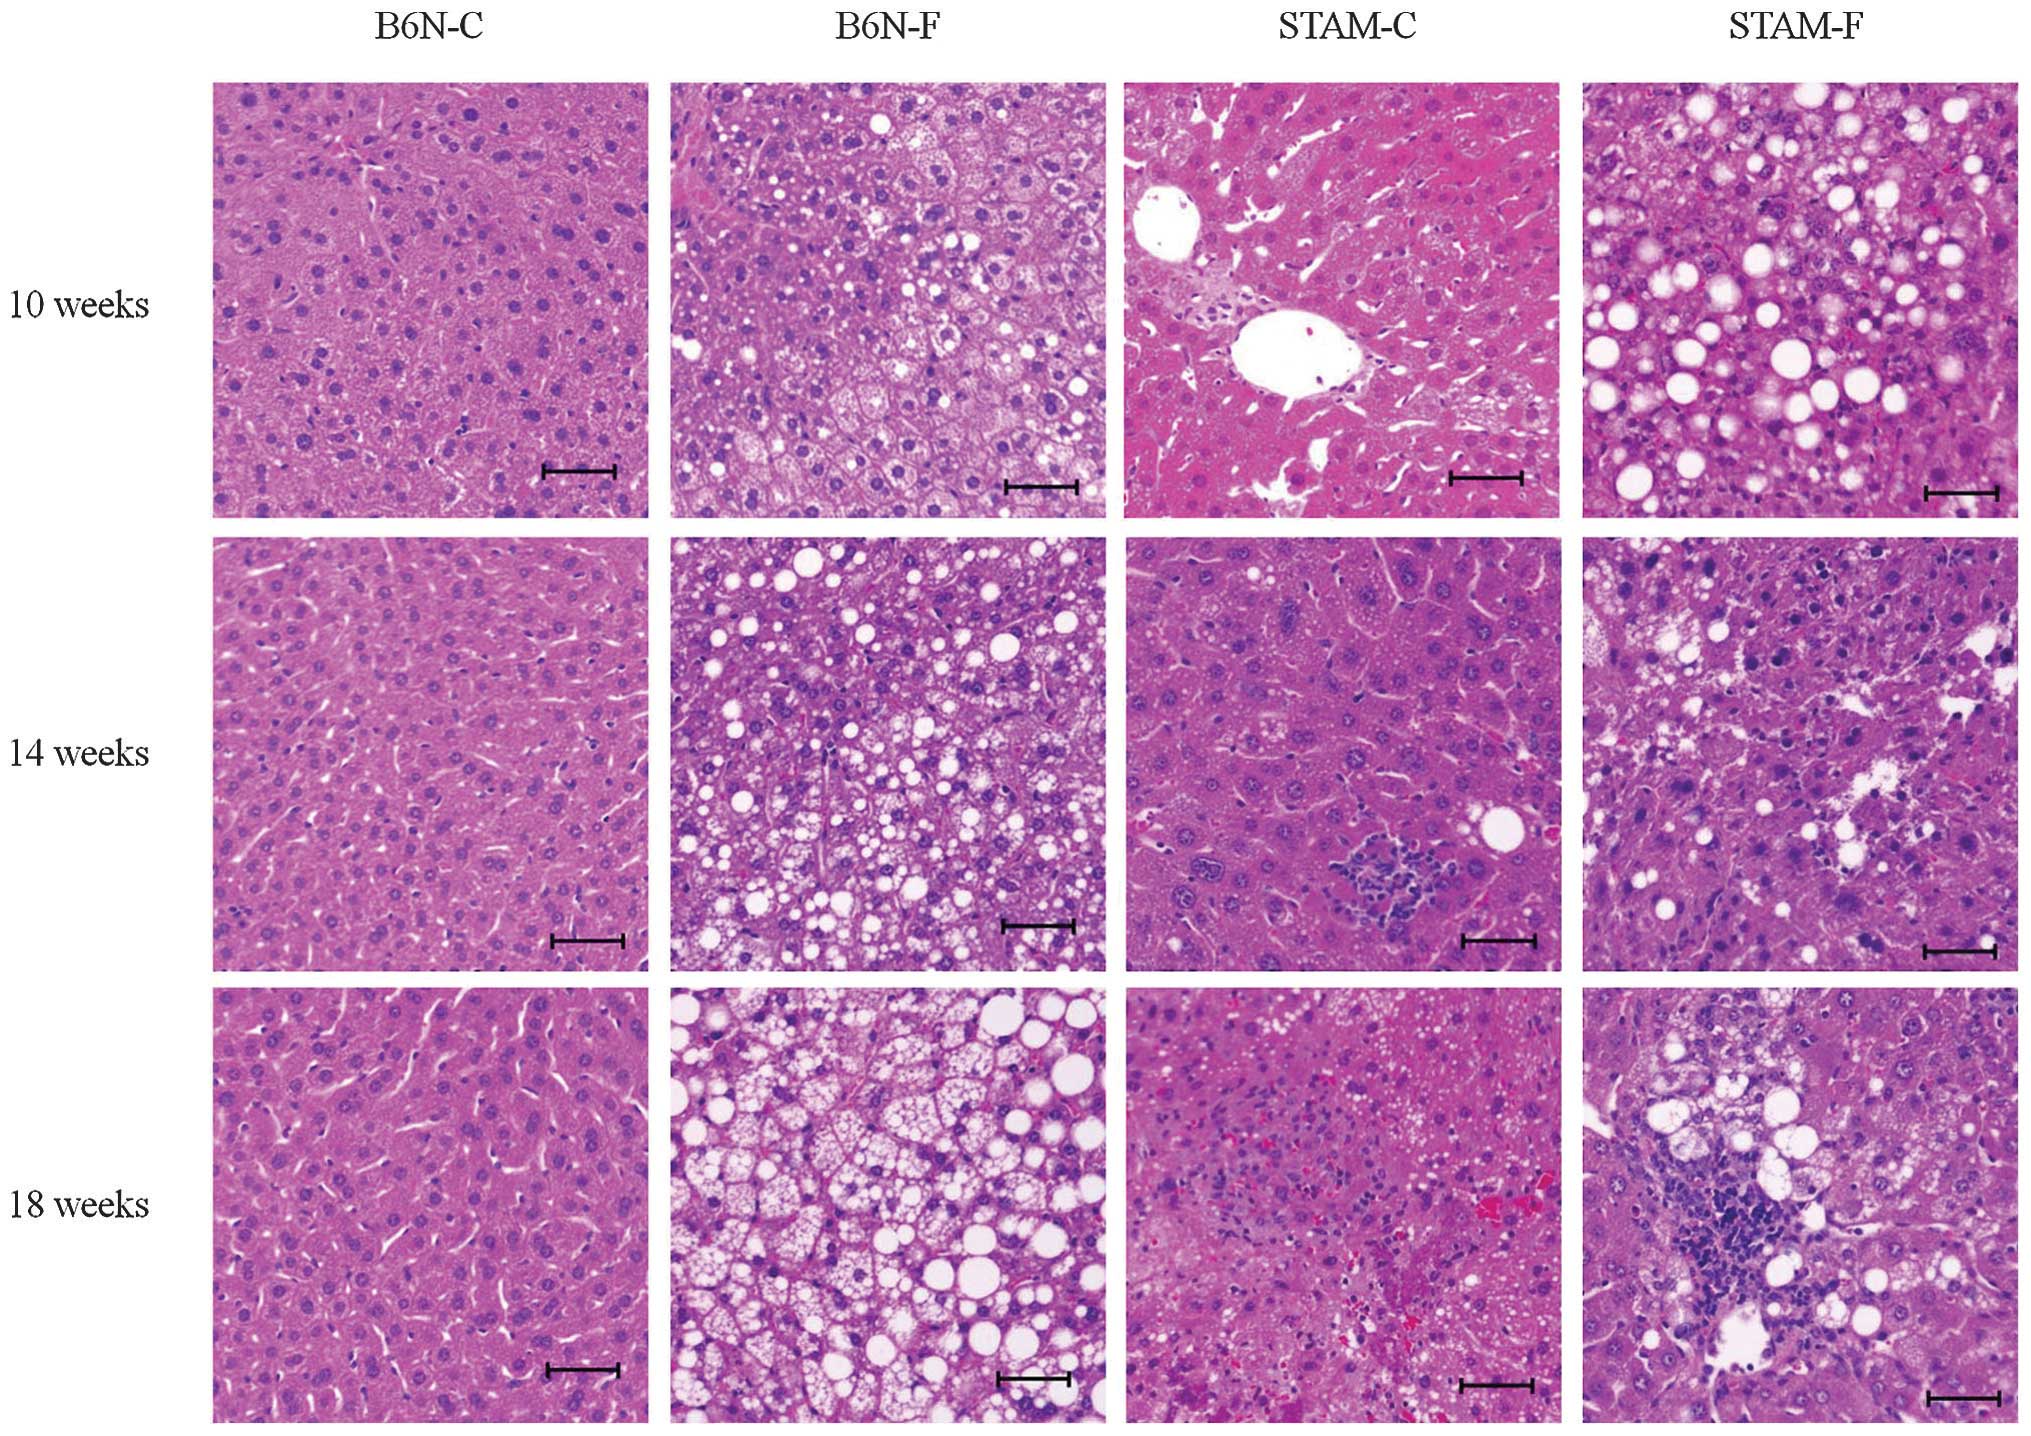
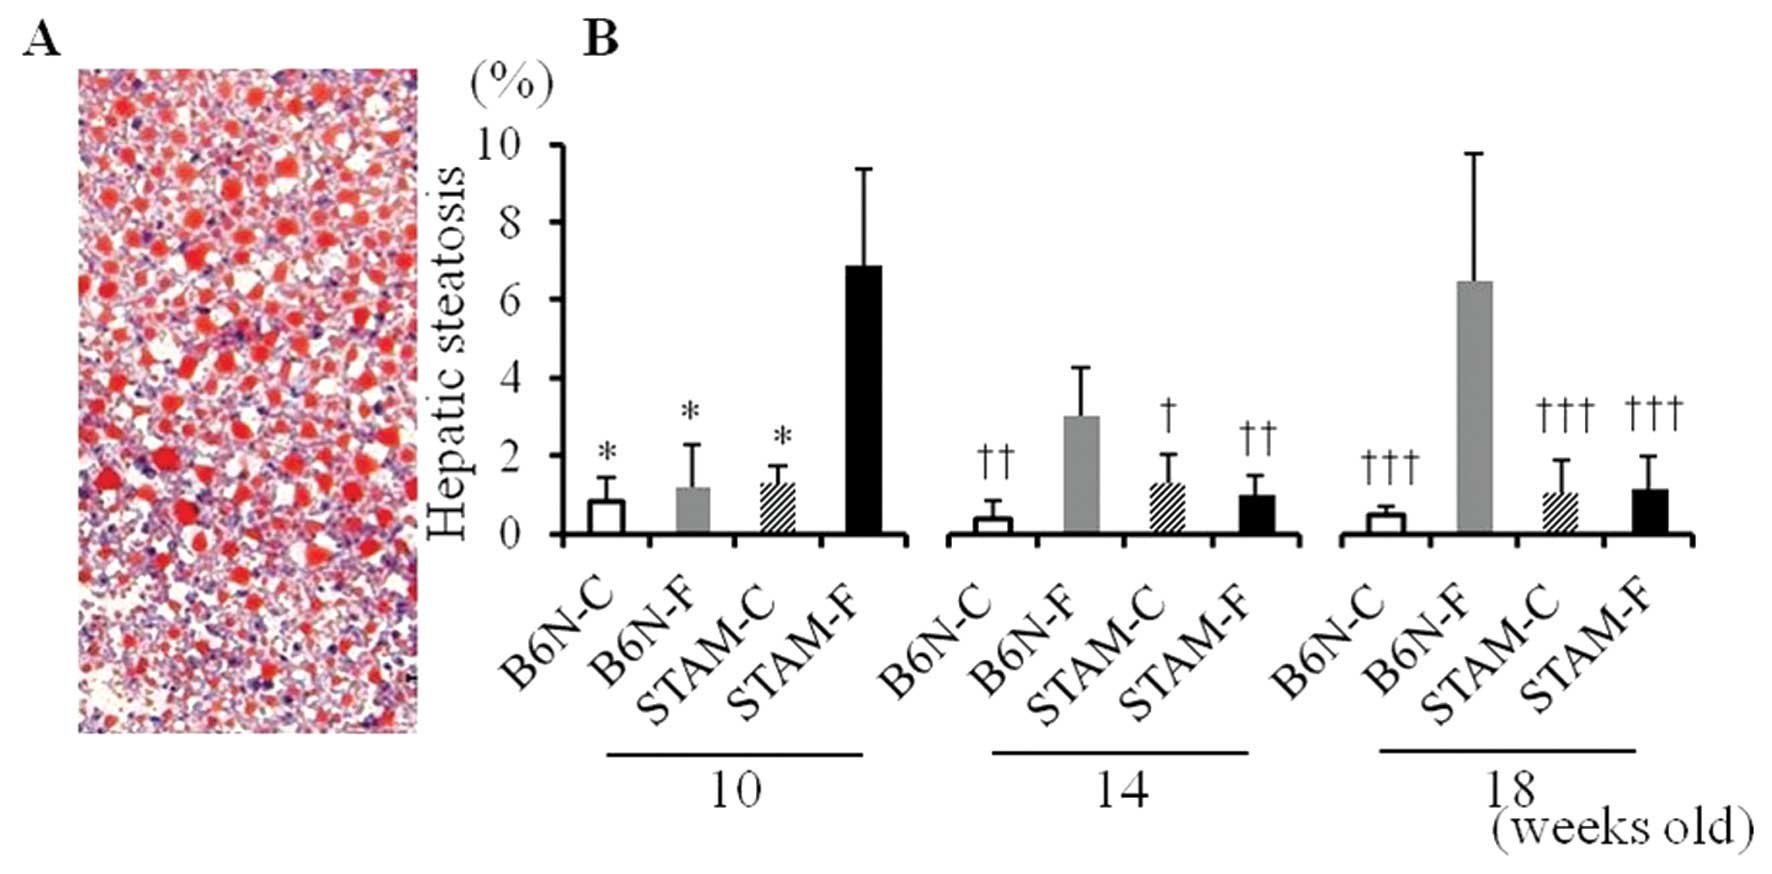
There was no apparent hepatic steatosis in B6N-C
mice at 10, 14, or 18 weeks (Fig.
2), but hepatic steatosis in the B6N-F group gradually
increased over time, as observed at 10, 14 and 18 weeks (Fig. 2 and 3B). By contrast, STAM-F mice at 10 weeks
had apparent hepatic steatosis (Fig.
2 and 3A), and the area of
hepatic steatosis in the STAM-F group was lower at 14 and 18 weeks
than at 10 weeks (Fig. 3B). There
was no apparent hepatic steatosis in STAM-C mice during the
experimental period.
Hepatic fibrosis in STAM and B6N
mice
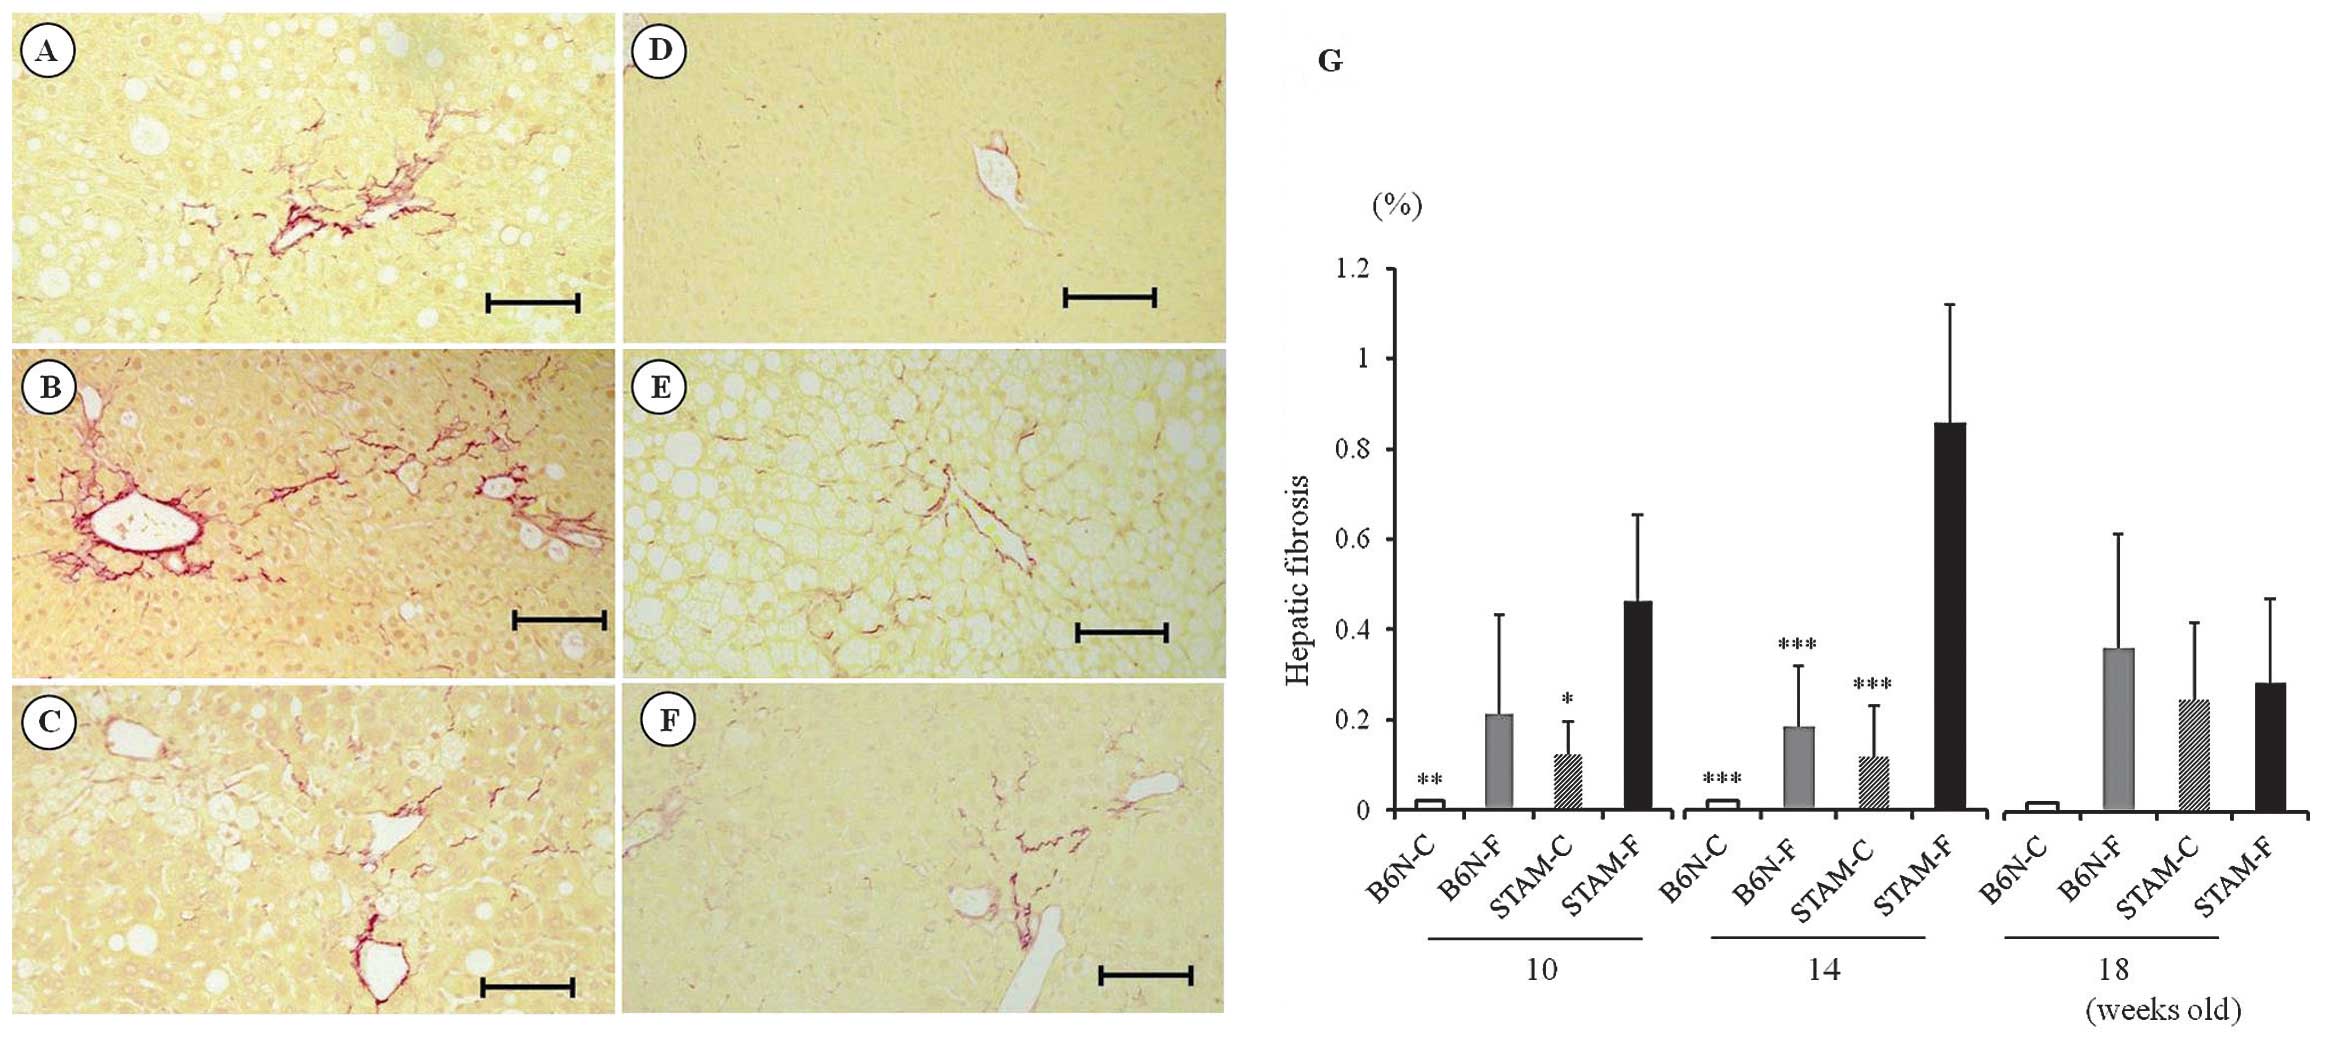
Hepatic fibrosis, assessed by image analysis of
Sirius red staining, was more severe in STAM-F mice at 10 (Fig. 4A) and 14 (Fig. 4B) weeks than in the B6N-C (Fig. 4D), B6N-F (Fig. 4E), and STAM-C mice (Fig. 4F) during the same period (Fig. 4G). By contrast, the area of hepatic
fibrosis in STAM-F mice at 18 weeks (Fig. 4C) decreased relative to 10 or 14
weeks, and the degree of fibrosis was similar to those in the B6N-F
and STAM-C groups (Fig. 4G).
NAFLD activity score (NAS) in STAM and
B6N mice
The NAS, a composite parameter calculated from
separate scores for steatosis, inflammation, and ballooning, was
higher in B6N-F and the two STAM groups than in B6N-C. Between the
STAM groups, the score was higher in STAM-F than in STAM-C groups
(Fig. 5).
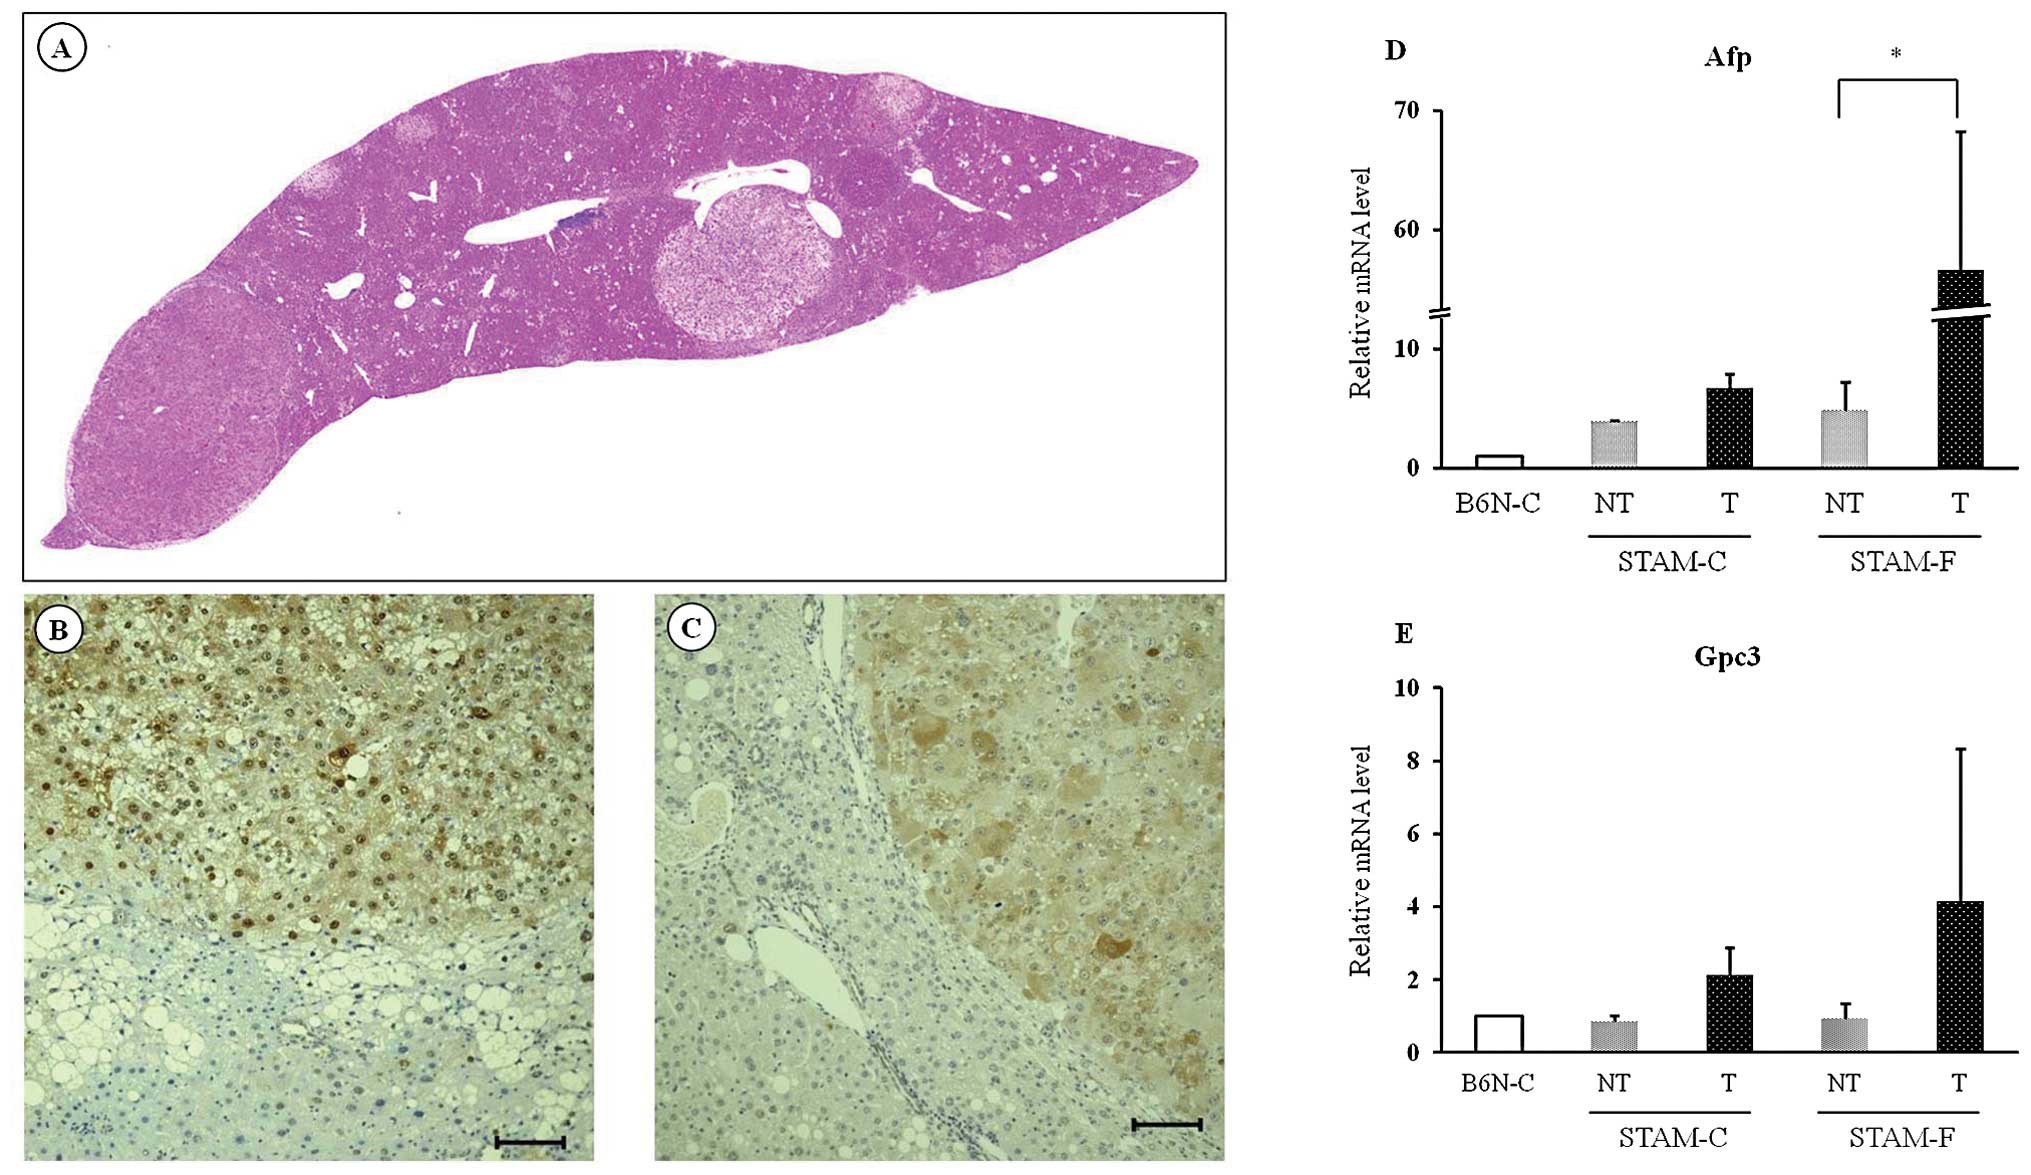
Hepatic tumor formation and evaluation of
tumor in STAM mice
Hepatic tumors were observed in two STAM-C mice at
14 weeks of age. However, the tumors in each mouse were singular,
and no hepatic tumors were observed in the STAM-C group at 10 and
18 weeks of age, or in either B6N group at any time during the
experiment. By contrast, a single hepatic tumor was observed in all
five STAM-F mice at 14 weeks, and multiple tumors were observed in
all five STAM-F mice at 18 weeks (Fig.
6A).
Immunohistochemical analysis showed that hepatic
tumors in STAM-F mice at 18 weeks were positive for GST-P (Fig. 6B) and HSP-70 (Fig. 6C). In addition, quantitative RT-PCR
analysis of mRNA from liver tissue in STAM-F mice at 14 weeks
revealed that expression of Afp mRNA was significantly
higher, and that of Gpc3 mRNA tended to be higher, in the
tumor area than in the non-tumor area (Fig. 6D and E). On this basis, we concluded
that the hepatic tumors in STAM-F mice had features of
hepatocellular carcinomas. By contrast, Afp and Gpc3
mRNA expression in hepatic tumors of STAM-C mice at 14 weeks was
similar to that in non-tumor areas (Fig. 6D and E).
cDNA microarray analysis and quantitative
RT-PCR
Gene-expression profiles of whole livers from B6N-C,
B6N-F, and STAM-F mice at 14 weeks, using en bloc total RNA from
five mice, were evaluated using Affymetrix GeneChips. Of 2,774
genes whose expression levels were ≥2-fold higher in STAM-F than
B6N-F, mice 144 genes were increased ≥5-fold, and 8 genes were
increased ≥30-fold. These top eight genes were selected for further
examination (Table II). In
addition, of 144 genes that were increased ≥5-fold in the STAM-F
compared to the B6N-F group, four genes were increased ≥5-fold in
the B6N-F compared to the B6N-C group at 14 weeks, and the four
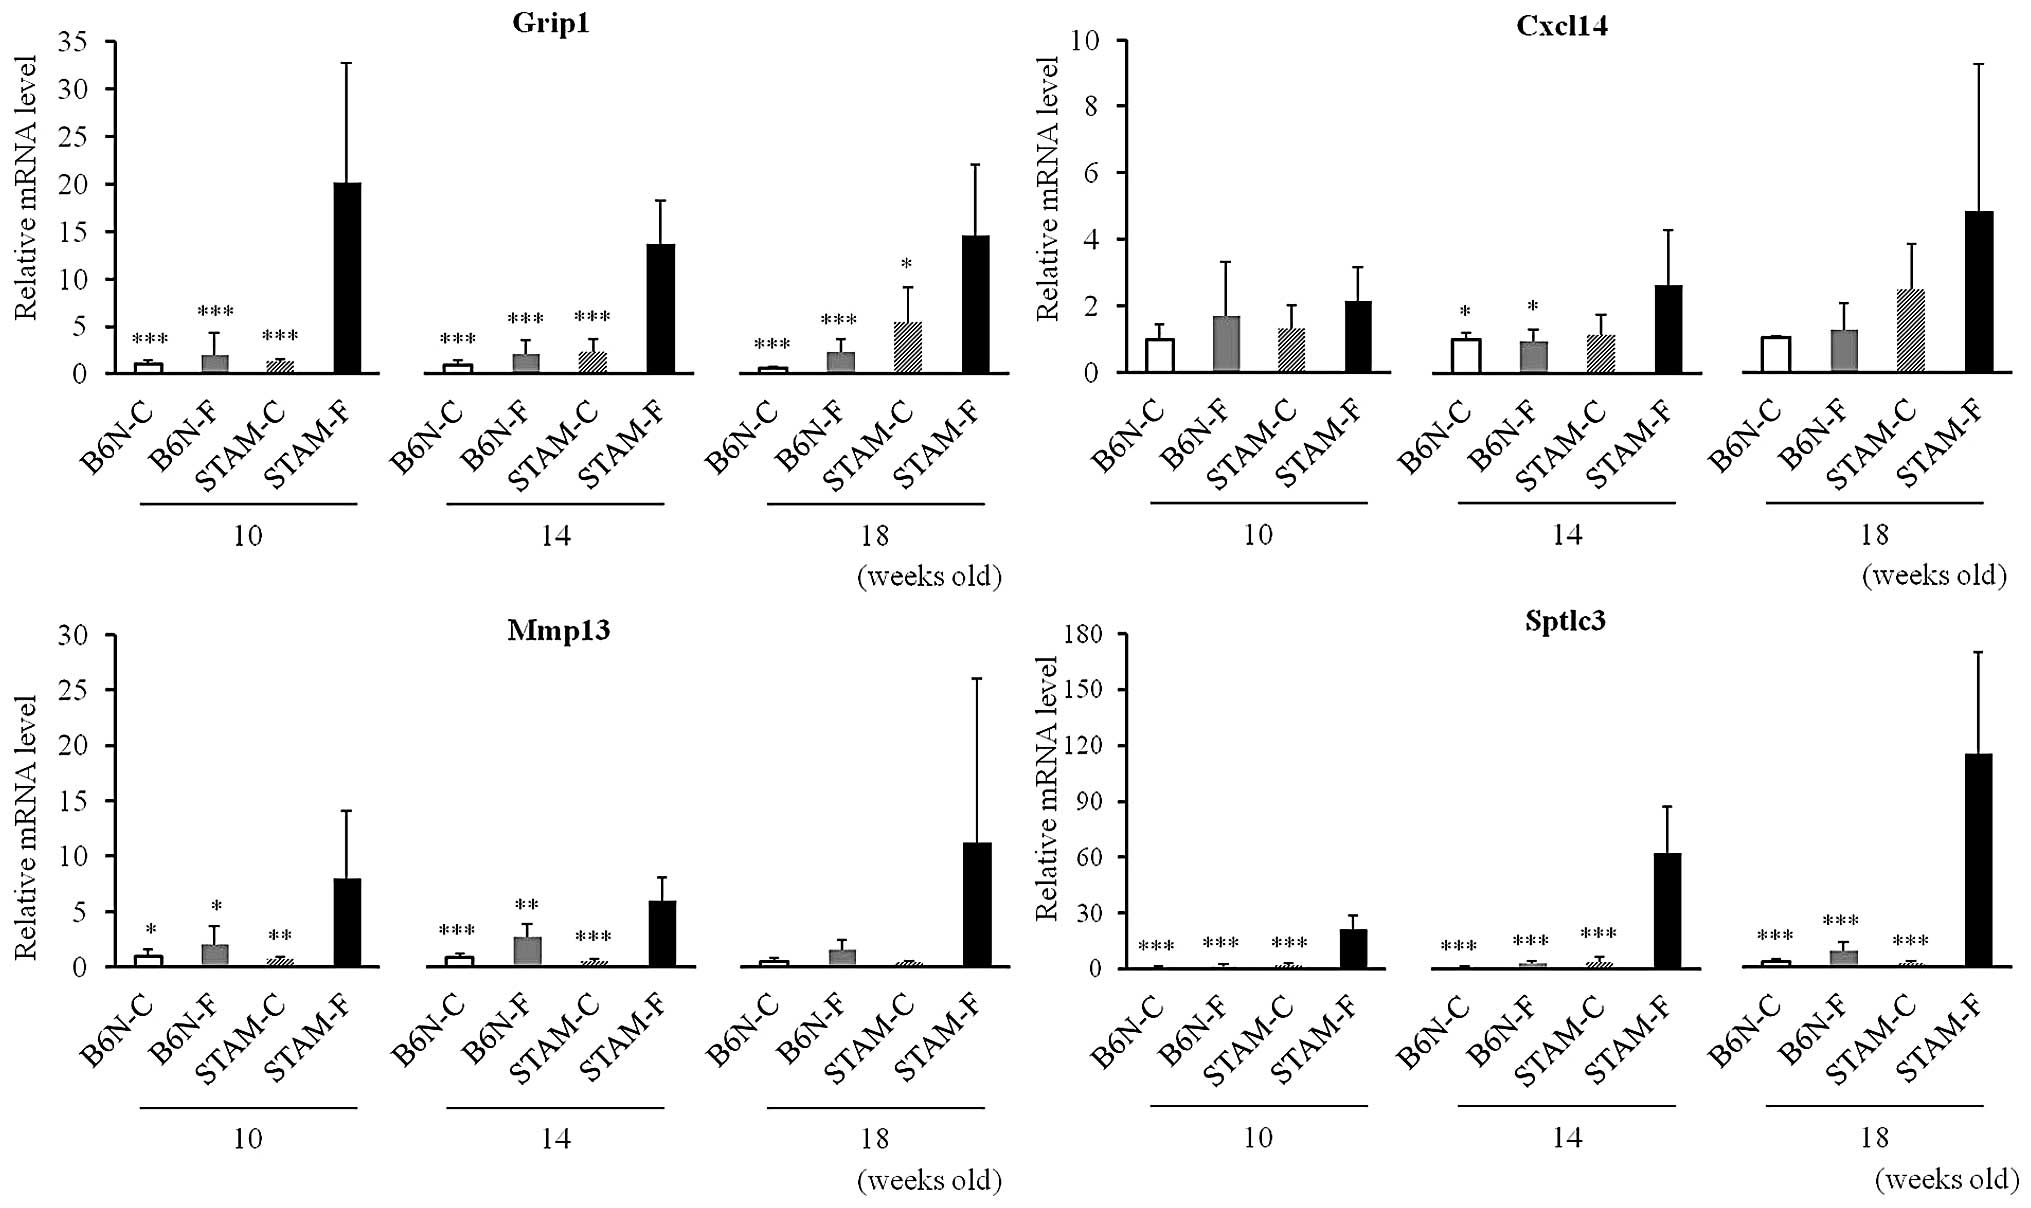
genes were selected for further examination (Table II). Of the 12 genes, expression
levels of 11 were assessed by quantitative RT-PCR using
commercially available primers. We confirmed that expression levels
of the Sptlc3, Mmp13, Grip1 and Cxcl14
genes were higher in the STAM-F as compared to the STAM-C and B6N-F
groups at all times tested (Fig.
7). The difference in Sptlc3 mRNA expression was the
most pronounced, and increased over time from 10 to 18 weeks
(Fig. 7). By contrast, differences
in the hepatic mRNA expression levels of Cxcl14 and
Mmp13 at 18 weeks were not statistically significant among
the four groups, although these genes were expressed at higher
levels in the STAM-F group than in the other groups.
| Table IIResults of microarray analysis. |
Table II
Results of microarray analysis.
| Gene ID | Gene symbol | STAM-F/B6N-F
ratio | B6N-F/B6N-C
ratio |
|---|
| 12945 | Dmbt1 | 198 | 0.01 |
| 74053 | Grip1 | 132 | 0.04 |
| 17263 | Meg3 | 121 | 0.02 |
| 59012 | Moxd1 | 114 | 0.84 |
| 11717 | Ampd3 | 49 | 0.04 |
| 102657 | Cd276 | 43 | 0.05 |
| 20963 | Syk | 35 | 0.72 |
| 57266 | Cxcl14 | 33 | 1.90 |
| 17386 | Mmp13 | 18 | 7.0 |
| 17381 | Mmp12 | 7.2 | 16 |
| 192885 |
F630007L15Rik | 6.6 | 5.7 |
| 228677 | Sptlc3 | 5.9 | 5.7 |
Comparison of gene expression between
STAM, db/db and CDAA mouse models
In db/db mice fed HFD for 20 weeks (at 25 weeks old,
db/db-F group), we observed steatosis and fibrosis (Fig. 8A and B) but no hepatic tumors.
Similarly, hepatic steatosis and fibrosis, but no hepatic tumors,
were observed in B6N mice fed a CDAA diet for 12 weeks (at 16 weeks
old, CDAA group; Fig. 8C and D).
The NAS of db/db-F and CDAA mice was as high as that of STAM-F mice
(Fig. 8E), and hepatic fibrosis was
significantly more severe in the CDAA mice than in STAM-F mice at
14 weeks (Fig. 8F). Among these
mice and the B6N-F and STAM-F groups, the hepatic expression of
Grip1 and Sptlc3 mRNAs was highest in the STAM-F
group at 14 weeks (Fig. 8G). By
contrast, the hepatic levels of Cxcl14 and Mmp13 mRNA
were higher in the db/db-F and CDAA groups, respectively, as
compared to the other groups (Fig.
8G).
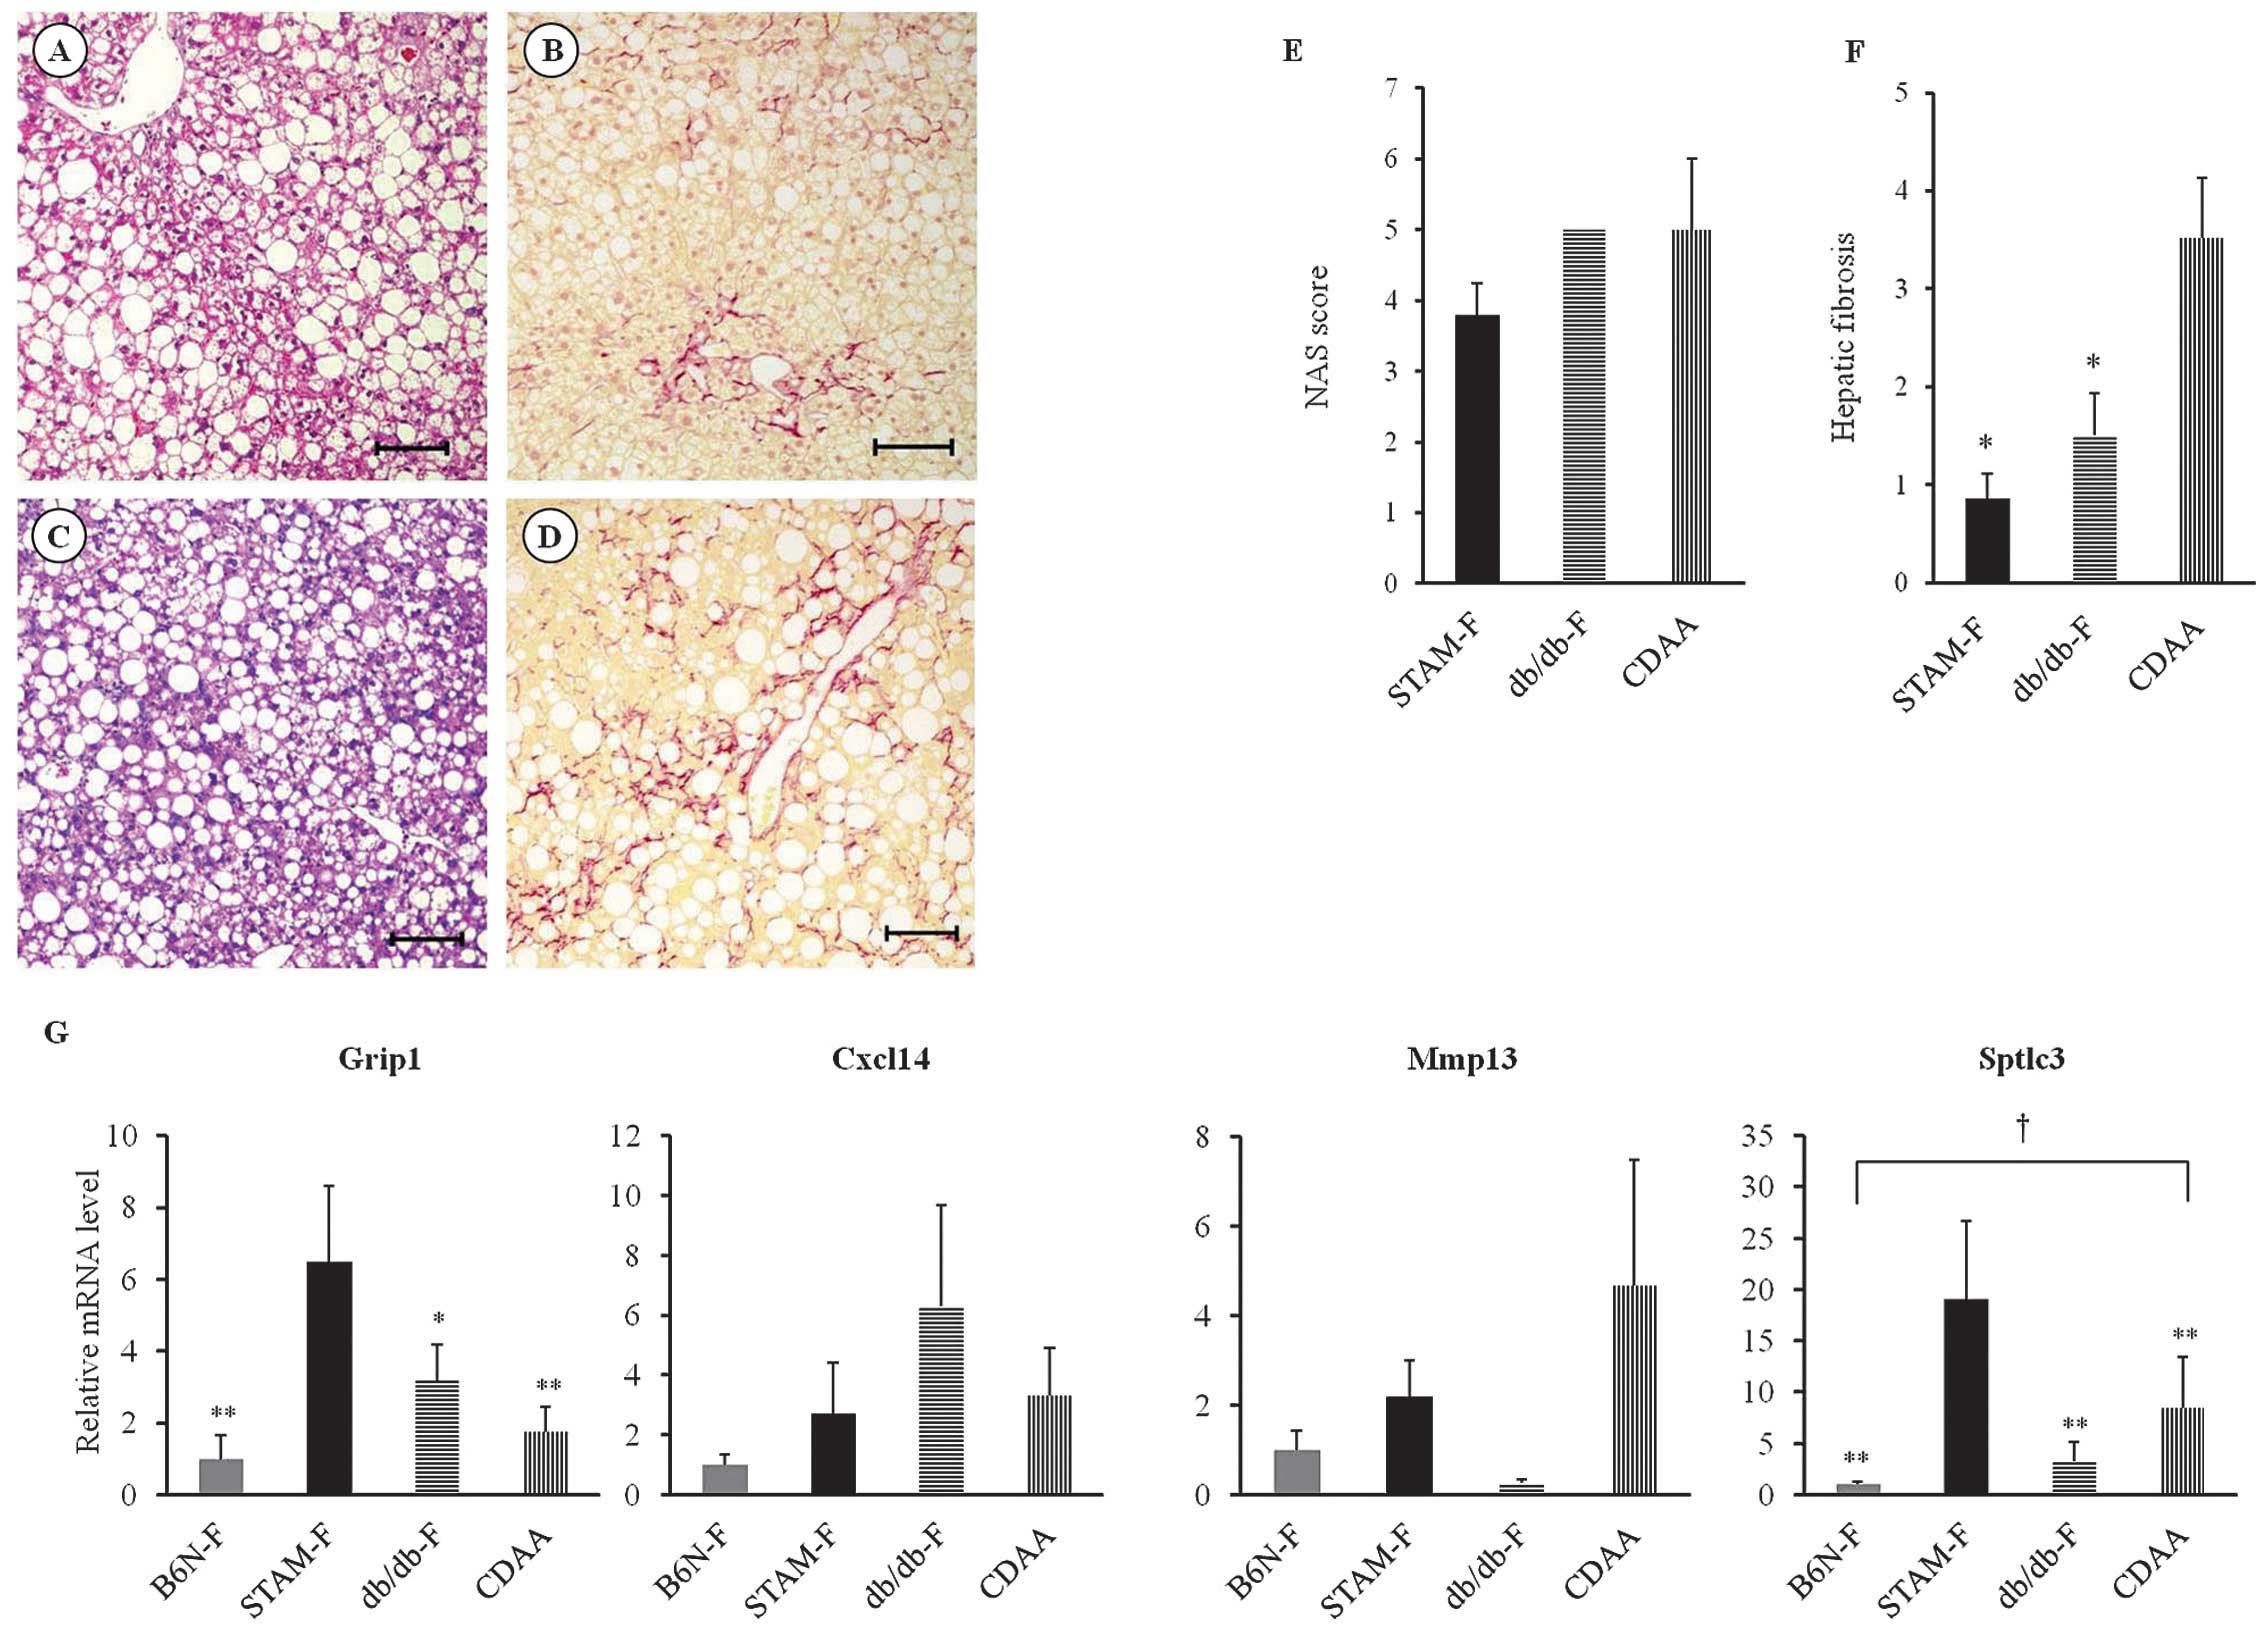 | Figure 8Liver histological findings and mRNA
expression levels of liver tissue in the steatohepatitis mouse
model. (A) Hepatic steatosis and (B) hepatic fibrosis are observed
at 25 weeks in db/db mice fed a high-fat diet (db/db-F group), as
determined by hematoxylin and eosin and Sirius red staining,
respectively. (C) Hepatic steatosis and (D) hepatic fibrosis are
shown in B6N mice fed a CDAA diet (CDAA group) at 16 weeks,
assessed by hematoxylin and eosin and Sirius red staining,
respectively. Original magnifications in A–D, ×100; scale bar, 100
μm. (E) Assessment of NAS of STAM-F mice at 14 weeks, db/db-F mice
at 25 weeks, and CDAA mice at 16 weeks (n=5 in each group). NAS,
nonalcoholic fatty liver disease activity score. (F) Area positive
for Sirius red staining in STAM-F mice at 14 weeks, db/db-F mice at
25 weeks, and CDAA mice at 16 weeks (n=5 in each group).
*p<0.001 vs. CDAA. (G) Hepatic mRNA expression levels
of Grip1 and Sptlc3 were highest in the STAM-F
compared to the other three groups. By contrast, hepatic mRNA
expression of Cxcl14 in the db/db-F group or Mmp13 in
the CDAA group was relatively higher compared to the other three
groups. Liver tissues were obtained from 14-week-old B6N-F or
STAM-F, or CDAA mice at 16 weeks, or db/db-F mice at 25 weeks (n=5
in each group). Data are shown as means ± standard deviation.
Statistical analyses were performed using Tukey’s HSD
test. *p<0.01, **p<0.001 vs. STAM-F;
†p<0.05, B6N-F vs. CDAA. CDAA, choline-deficient
L-amino acid-defined diet. |
Discussion
This study showed that the STAM-F group, which
exhibited notable hyperglycemia due to impaired insulin secretion
over a short time period, exhibited more hepatic fibrosis at 10 and
14 weeks and more frequent hepatocarcinogenesis at 18 weeks than
the B6N-C, B6N-F and STAM-C groups. In addition, mRNA expression
levels of several genes including Sptlc3 in the liver of
STAM-F mice were significantly elevated compared to the STAM-C,
B6N-C and B6N-F groups. Sptlc3 expression gradually
increased over the study observation period. Furthermore, we
observed a higher expression of Sptlc3 mRNA in STAM-F mice
compared to NASH mouse models, such as db/db-F and CDAA diet mice,
although hepatic fibrosis was more severe in the CDAA diet mice
than in the STAM-F mice. These results indicate that a HFD in
conjunction with hyperglycemia may aggravate pathophysiological
findings in the liver, including hepatocarcinogenesis in NASH.
Furthermore, hepatic expression of Sptlc3 mRNA may be
closely associated with NASH-associated hepatocarcinogenesis.
Type 2 diabetes is a risk factor for HCC: the risk
of HCC is 2.5-fold higher in diabetic patients than in healthy
controls (12). Sixty-four percent
of HCC patients suffering from NASH experience complications with
diabetes (13). Several factors,
such as hyperinsulinemia induced by insulin resistance, play major
roles in hepatocarcinogenesis in NASH (14). By contrast, hyperglycemia itself can
contribute to the incidence of carcinogenesis by promoting
endothelial cell dysfunction or the induction of DNA damage by
oxidative stress (15). In this
study, multiple HCCs were observed in the STAM-F group, which had
higher hyperglycemia than the STAM-C and B6N-F groups. Thus, our
results show that significant hyperglycemia contributes to
hepatocarcinogenesis, regardless of hypoinsulinemia.
HCCs express Afp and Gpc3 mRNA
(16,17), and immunostain positively for GST-P
and HSP-70 of HCC (18,19). These observations support the
hypothesis that the liver tumors observed in STAM-F mice were HCCs.
By contrast, no significantly higher expression of Afp and
Gpc3 mRNA was observed in hepatic tumors that were detected
in two STAM-C mice at 14 weeks. In addition, the non-tumor area of
the liver in these mice showed a low expression of Sptlc3.
Therefore, Sptlc3 expression may contribute to the
development of HCC with a higher expression of tumor markers such
as AFP, but probably does not contribute to hepatic tumors that do
not highly express these tumor markers.
In this study, HCC formation in STAM-F mice at 14
and 18 weeks was accompanied by a decrease in hepatic steatosis,
which was similar to the features of burned-out NASH. However,
STAM-F mice did not develop LC within the period when HCC was
observed. Although LC is a risk factor for HCC development, HCC in
patients with metabolic syndrome often develops without advanced
hepatic fibrosis (20). Thus,
development of HCC in STAM-F mice with mild fibrosis may be similar
to that in human NASH, although the mechanism of the decrease in
hepatic steatosis in STAM-F has not been elucidated.
In the STAM group, we observed fasting hyperglycemia
after the impairment of pancreatic function. In addition, blood
glucose levels gradually decreased in STAM mice fed a conventional
diet (STAM-C), but gradually increased in STAM mice fed a high-fat
diet (STAM-F). The palmitic acid from the high-fat diet may
inactivate AMP-activated protein kinase, increase production of
reactive oxygen species (ROS) in mitochondria, and decrease
autophagic signaling via Unc-51-like kinase 1 (ULK1). These factors
promote the production of IL-1β, impair glucose tolerance and
insulin sensitivity (21), and may
lead to hepatocarcinogenesis. Oxidative stress such as ROS
production should be further investigated in STAM mice.
Serine palmitoyltransferase (SPT) produces
3-ketodihy-drosphingosine (KDS) by condensation reactions with
serine and palmitoyl CoA using pyridoxal 5′-phosphate (PLP) as a
coenzyme (22,23). This response is the first step in
the biosynthetic pathway of sphingolipids. Although the mammalian
SPT was previously described as a heterodimer composed of two
subunits, SPTLC1 and SPTLC2 (24),
a recent study has shown that SPT is composed of three distinct
subunits (SPTLC1, SPTLC2 and SPTLC3) that form a complex with a
molecular mass of 480 kDa (25).
SPTLC2 and SPTLC3 share 68% sequence identity and include the
PLP-binding region, whereas SPTLC1 does not contain that region
(24). Therefore, SPTLC2 and SPTLC3
are likely to have similar functions. However, SPTLC2 and SPTLC3
are encoded by two distinct genes, and Triton X-100 inhibits the
SPTLC3-based SPT reaction but activates the SPTLC2-mediated
reaction (24). Our results
indicated that HCC development was associated with mRNA expression
of Sptlc3, but not Sptlc1 or Sptlc2 (data not
shown). Differences in the functions of these genes may be
associated with hepatocarcinogenesis.
The levels of sphingolipids such as ceramide are
correlated with the expression level of Sptlc3 (26). Blockade of SPT1, an enzyme involved
in the rate-determining step of ceramide synthesis, improves
insulin resistance in mice (27).
The expression of pro-ceramide genes such as Sptlc1 and
Sptlc2 is increased in the early stage of fatty liver
disease in mice, and serum ceramide levels of NASH patients
decrease in accordance with their weight reduction (27–29).
Inhibition of ceramide de novo synthesis with the SPT
inhibitor myriocin ameliorates glucose homeostasis in
streptozotocin-induced type 1 diabetes in rat (30). Thus, ceramide may be associated with
fatty liver in a manner that involves insulin resistance. In
addition, myriocin suppressed melanoma cell proliferation by
cell-cycle arrest at the G2/M phase by inhibiting de novo
sphingolipid synthesis and increased p53 and
p21waf1/cip1 expression (31,32).
In this study, overexpression of Sptlc3 was already detected
at 10 weeks in STAM-F, prior to liver tumor formation. Furthermore,
expression of Sptlc3 increased in accordance with
progression to HCC. Therefore, sphingolipids controlled by
Sptlc3 might be associated with hepatocarcinogenesis via
mechanisms involving insulin resistance, cell proliferation, and
p53/p21waf1/cip1 expression.
Our study had several limitations. First, the STAM
mice that were used in this study developed NASH in the context of
hyperglycemia and impaired insulin secretion. The pathological
condition in this model is different from that of human NASH, in
which hyperinsulinemia is associated with obesity and insulin
resistance. However, previous studies have reported NAFLD cases
being on the increase due to type 1 diabetes, and described the
influence of insulin resistance on the development of NAFLD in such
patients (33–35). Although several mouse models of NASH
exist, the development of HCC has not been observed in these
models. Therefore, STAM-F are considered to be useful as a highly
reproducible NASH model. A second limitation is that STAM-F mice
develop hepatic steatosis and hepatic fibrosis, followed by HCC,
but the area of hepatic fibrosis (as determined by image analyzer
in STAM-F at 18 weeks) was reduced relative to the area at 10 or 14
weeks. Although this reduction is inconsistent with findings in
human NASH, it is necessary to assess hepatic fibrosis in the
tumor-free area in many mice. Third, it is uncertain whether
several genes that our study found to be increased in STAM-F are
specific to this mouse model or are actually increased in human
NASH associated with insulin resistance and hyperinsulinemia.
Fourth, our study did not conclusively demonstrate an actual role
of Sptlc3 in the development of NASH and NASH-associated
tumor formation. Direct evidence that Sptlc3 is involved in
the progression to NASH would require experimental evidence that
the suppression of Sptlc3 ameliorates NASH or the
overexpression of Sptlc3 exacerbates NASH. Finally, there
was no apparent hepatic steatosis in STAM-C or B6N-C mice. The
livers of STAM-C and STAM-F mice may show inflammation caused by
streptozotocin hepatotoxicity, which could affect the NAS score.
Thus, we should consider that there are limitations to the NAS
score used for evaluation in our model.
In summary, we found that a high-fat diet, marked
hyperglycemia, and hepatic steatosis were correlated with multiple
HCC, and concluded that these factors contributed to the
progression of NASH. In addition, overexpression of Sptlc3
in the liver was associated with NASH-associated
hepatocarcinogenesis. This study provides useful information
regarding potential molecular targets for the prevention and
treatment of NASH-associated hepatocarcinogenesis, although the
pathology of STAM is somewhat different from that of human NASH, in
particular with regard to insulin resistance.
Acknowledgements
We would like to thank Ms. Yuko Morinaga as well as
Ms. Etsuko Horiguchi for their technical assistance.
References
|
1
|
Ludwig J, Viggiano TR, McGill DB and Oh
BJ: Nonalcoholic steatohepatitis: Mayo Clinic experiences with a
hitherto unnamed disease. Mayo Clin Proc. 55:434–438.
1980.PubMed/NCBI
|
|
2
|
Andy SY and Keeffe EB: Nonalcoholic fatty
liver disease. Rev Gastrointest Disord. 2:11–19. 2002.
|
|
3
|
Angulo P and Lindor KD: Non-alcoholic
fatty liver disease Quadrennial review. J Gastroenterol Hepatol.
17:S186–S190. 2002. View Article : Google Scholar
|
|
4
|
White DL, Kanwal F and El-Serag HB:
Association between nonalcoholic fatty liver disease and risk for
hepatocellular cancer, based on systematic review. Clin
Gastroenterol Hepatol. 10:1342–1359. 2012. View Article : Google Scholar : PubMed/NCBI
|
|
5
|
Ikai I, Arii S, Okazaki M, Okita K, Omata
M, Kojiro M, Takayasu K, Nakanuma Y, Makuuchi M, Matsuyama Y,
Monden M and Kudo M: Report of the 17th Nationwide follow-up survey
of primary liver cancer in Japan. Hepatol Res. 37:676–691. 2007.
View Article : Google Scholar : PubMed/NCBI
|
|
6
|
Day CP and James OF: Steatohepatitis: a
tale of two ‘hits’? Gastroenterology. 114:842–845. 1998. View Article : Google Scholar : PubMed/NCBI
|
|
7
|
Tilg H and Moschen AR: Evolution of
inflammation in nonal-coholic fatty liver disease: the multiple
parallel hits hypothesis. Hepatology. 52:1836–1846. 2010.
View Article : Google Scholar : PubMed/NCBI
|
|
8
|
Anstee QM and Goldin RD: Mouse models in
non-alcoholic fatty liver disease and steatohepatitis research. Int
J Exp Pathol. 87:1–16. 2006. View Article : Google Scholar : PubMed/NCBI
|
|
9
|
Denda A, Kitayama W, Kishida H, Murata N,
Tsutsumi M, Tsujiuchi T, Nakae D and Konishi Y: Development of
hepatocellular adenomas and carcinomas associated with fibrosis in
C57BL/6J male mice given a choline-deficient, L-amino acid-defined
diet. Jpn J Cancer Res. 93:125–132. 2002. View Article : Google Scholar : PubMed/NCBI
|
|
10
|
Fujii M, Shibazaki Y, Wakamatsu K, Honda
Y, Kawauchi Y, Suzuki K, Arumugam S, Watanabe K, Ichida T, Asakura
H and Yoneyama H: A murine model for non-alcoholic steatohepatitis
showing evidence of association between diabetes and hepatocellular
carcinoma. Med Mol Morphol. 46:141–152. 2013. View Article : Google Scholar : PubMed/NCBI
|
|
11
|
Kleiner DE, Brunt EM, Van Natta M, Behling
C, Contos MJ, Cummings OW, Ferrell LD, Liu YC, Torbenson MS,
Unalp-Arida A, Yeh M, Mccullough AJ and Sanyal AJ; Nonalcoholic
Steatohepatitis Clinical Research N. Design and validation of a
histological scoring system for nonalcoholic fatty liver disease.
Hepatology. 41:1313–1321. 2005. View Article : Google Scholar : PubMed/NCBI
|
|
12
|
Renehan A, Smith U and Kirkman MS: Linking
diabetes and cancer: a consensus on complexity. Lancet.
375:2201–2202. 2010. View Article : Google Scholar : PubMed/NCBI
|
|
13
|
Rosmorduc O and Fartoux L: HCC and NASH:
how strong is the clinical demonstration? Clin Res Hepatol
Gastroenterol. 36:202–208. 2012. View Article : Google Scholar : PubMed/NCBI
|
|
14
|
Shimizu M, Tanaka T and Moriwaki H:
Obesity and hepatocellular carcinoma: targeting obesity-related
inflammation for chemo-prevention of liver carcinogenesis. Semin
Immunopathol. 35:191–202. 2013. View Article : Google Scholar
|
|
15
|
Morss AS and Edelman ER: Glucose modulates
basement membrane fibroblast growth factor-2 via alterations in
endothelial cell permeability. J Biol Chem. 282:14635–14644. 2007.
View Article : Google Scholar : PubMed/NCBI
|
|
16
|
Niwa Y, Matsumura M, Shiratori Y, Imamura
M, Kato N, Shiina S, Okudaira T, Ikeda Y, Inoue T and Omata M:
Quantitation of alpha-fetoprotein and albumin messenger RNA in
human hepatocellular carcinoma. Hepatology. 23:1384–1392.
1996.PubMed/NCBI
|
|
17
|
Yao M, Yao DF, Bian YZ, Wu W, Yan XD, Yu
DD, Qiu LW, Yang JL, Zhang HJ, Sai WL and Chen J: Values of
circulating GPC-3 mRNA and alpha-fetoprotein in detecting patients
with hepatocellular carcinoma. Hepatobiliary Pancreat Dis Int.
12:171–179. 2013. View Article : Google Scholar : PubMed/NCBI
|
|
18
|
Satoh K, Takahashi G, Miura T, Hayakari M
and Hatayama I: Enzymatic detection of precursor cell populations
of preneoplastic foci positive for gamma-glutamyltranspeptidase in
rat liver. Int J Cancer. 115:711–716. 2005. View Article : Google Scholar : PubMed/NCBI
|
|
19
|
Shin E, Ryu HS, Kim SH, Jung H, Jang JJ
and Lee K: The clinicopathological significance of heat shock
protein 70 and glutamine synthetase expression in hepatocellular
carcinoma. J Hepatobiliary Pancreat Sci. 18:544–550. 2011.
View Article : Google Scholar : PubMed/NCBI
|
|
20
|
Paradis V, Zalinski S, Chelbi E, Guedj N,
Degos F, Vilgrain V, Bedossa P and Belghiti J: Hepatocellular
carcinomas in patients with metabolic syndrome often develop
without significant liver fibrosis: a pathological analysis.
Hepatology. 49:851–859. 2009. View Article : Google Scholar
|
|
21
|
Wen H, Gris D, Lei Y, Jha S, Zhang L,
Huang MT, Brickey WJ and Ting JP: Fatty acid-induced NLRP3-ASC
inflammasome activation interferes with insulin signaling. Nat
Immunol. 12:408–415. 2011. View Article : Google Scholar : PubMed/NCBI
|
|
22
|
Hanada K: Serine palmitoyltransferase, a
key enzyme of sphingolipid metabolism. Biochim Biophys Acta.
1632:16–30. 2003. View Article : Google Scholar : PubMed/NCBI
|
|
23
|
Menaldino DS, Bushnev A, Sun A, Liotta DC,
Symolon H, Desai K, Dillehay DL, Peng Q, Wang E, Allegood J,
Trotman-Pruett S, Sullards MC and Merrill AH Jr: Sphingoid bases
and de novo ceramide synthesis: enzymes involved, pharmacology and
mechanisms of action. Pharmacol Res. 47:373–381. 2003. View Article : Google Scholar : PubMed/NCBI
|
|
24
|
Hornemann T, Richard S, Rütti MF, Wei Y
and Von Eckardstein A: Cloning and initial characterization of a
new subunit for mammalian serine-palmitoyltransferase. J Biol Chem.
281:37275–37281. 2006. View Article : Google Scholar : PubMed/NCBI
|
|
25
|
Hornemann T, Wei Y and Von Eckardstein A:
Is the mammalian serine palmitoyltransferase a high-molecular-mass
complex? Biochem J. 405:157–164. 2007.PubMed/NCBI
|
|
26
|
Cinar R, Godlewski G, Liu J, Tam J,
Jourdan T, Mukhopadhya B, Harvey-White J and Kunos G: Hepatic
cannabinoid-1 receptors mediate diet-induced insulin resistance by
increasing de novo synthesis of long-chain ceramides. Hepatology.
59:143–153. 2014. View Article : Google Scholar
|
|
27
|
Ussher JR, Koves TR, Cadete VJ, Zhang L,
Jaswal JS, Swyrd SJ, Lopaschuk DG, Proctor SD, Keung W, Muoio DM
and Lopaschuk GD: Inhibition of de novo ceramide synthesis reverses
diet-induced insulin resistance and enhances whole-body oxygen
consumption. Diabetes. 59:2453–2464. 2010. View Article : Google Scholar : PubMed/NCBI
|
|
28
|
Lyn-Cook LE Jr, Lawton M, Tong M,
Silbermann E, Longato L, Jiao P, Mark P, Wands JR, Xu H and de La
Monte SM: Hepatic ceramide may mediate brain insulin resistance and
neurodegeneration in type 2 diabetes and non-alcoholic
steatohepatitis. J Alzheimers Dis. 16:715–729. 2009.PubMed/NCBI
|
|
29
|
Promrat K, Longato L, Wands JR and De La
Monte SM: Weight loss amelioration of non-alcoholic steatohepatitis
linked to shifts in hepatic ceramide expression and serum ceramide
levels. Hepatol Res. 41:754–762. 2011. View Article : Google Scholar : PubMed/NCBI
|
|
30
|
Kurek K, Wiesiolek-Kurek P, Piotrowska DM,
Lukaszuk B, Chabowski A and Zendzianendzian-Piotrowska M:
Inhibition of ceramide de novo synthesis with myriocin affects
lipid metabolism in the liver of rats with streptozotocin-induced
type 1 diabetes. Biomed Res Int. 2014:9808152014. View Article : Google Scholar : PubMed/NCBI
|
|
31
|
Lee YS, Choi KM, Choi MH, Ji SY, Lee S,
Sin DM, Oh KW, Lee YM, Hong JT, Yun YP and Yoo HS: Serine
palmitoyltransferase inhibitor myriocin induces growth inhibition
of B16F10 melanoma cells through G(2)/M phase arrest. Cell Prolif.
44:320–329. 2011. View Article : Google Scholar : PubMed/NCBI
|
|
32
|
Lee YS, Choi KM, Lee S, Sin DM, Lim Y, Lee
YM, Hong JT, Yun YP and Yoo HS: Myriocin, a serine
palmitoyltransferase inhibitor, suppresses tumor growth in a murine
melanoma model by inhibiting de novo sphingolipid synthesis. Cancer
Biol Ther. 13:92–100. 2012. View Article : Google Scholar
|
|
33
|
Greenbaum CJ: Insulin resistance in type 1
diabetes. Diab Metab Res Rev. 18:192–200. 2002. View Article : Google Scholar
|
|
34
|
Bulum T, Kolaric B, Duvnjak L and Duvnjak
M: Nonalcoholic fatty liver disease markers are associated with
insulin resistance in type 1 diabetes. Dig Dis Sci. 56:3655–3663.
2011. View Article : Google Scholar : PubMed/NCBI
|
|
35
|
Regnell SE and Lernmark A: Hepatic
steatosis in type 1 diabetes. Rev Diab Stud. 8:454–467. 2011.
View Article : Google Scholar
|