Introduction
Breast cancer, the most common type of cancer among
women, was also the primary and secondary cause of cancer-related
deaths among women living in less developed (14.3% of all
cancer-related deaths) and more developed regions (15.4% after lung
cancer) in 2012, respectively (1).
Familial or somatic mutations of BRCA1, BRCA2 and TP53 (alias p53)
are well-known high risk factors for breast cancer formation while
others (PALB2, BRIP1, ATM, CHEK2, PTEN and CDH1) have been
estimated to have moderate or weak effects (2).
Contrary to mutations that modify the DNA sequence
itself, epigenetic alterations affect gene expression via DNA
methylation, histone modifications and chromatin remodeling. DNA
methylation, the frequently studied epigenetic modification in the
context of embryogenesis, X chromosome inactivation and imprinting
(3–5), is also important for the protection of
genome integrity and hence cancer. Global hypomethylation of the
genome, commonly observed in multiple cancers, increases genome
instability and activates protooncogenes while hypermethylation of
promoter CpG islands silences the expression of tumor suppressor
genes (6–8). Promoter DNA methylation, identified at
the promoter region of many genes, contributes to breast
tumorigenesis; however, DNA methylation of the rDNA region has been
overlooked in DNA methylation studies related to breast cancer.
Ribosome synthesis is closely related to the cell
metabolism involved in cell growth and proliferation, and is
tightly correlated with ribosomal RNA (rRNA) synthesis (9). The human genome contains ~300–400
copies of rRNA genes but only a fraction of these genes are
actively transcribed depending on the cell type, external signals
and the cell stage, while the rest of the genes remain inactive
(10). rRNA genes are organized in
tandem repeated arrays within nucleolar organizing regions (NORs)
located on the short arms of five human acrocentric chromosomes:
chromosome 13, 14, 15, 21 and 22 (11). rRNA genes (except 5S, which is
transcribed by RNA polymerase III) are transcribed from the 45S
rDNA promoter by RNA polymerase I (Pol I). Since ~60% of the total
RNA of a cell consists of Pol I products (12), rRNA genes are regulated tightly at
different levels that include pre-initiation complex (PIC)
formation, initiation, promoter escape, elongation, termination,
re-initiation, RNA processing and post-transcriptional
modifications (13).
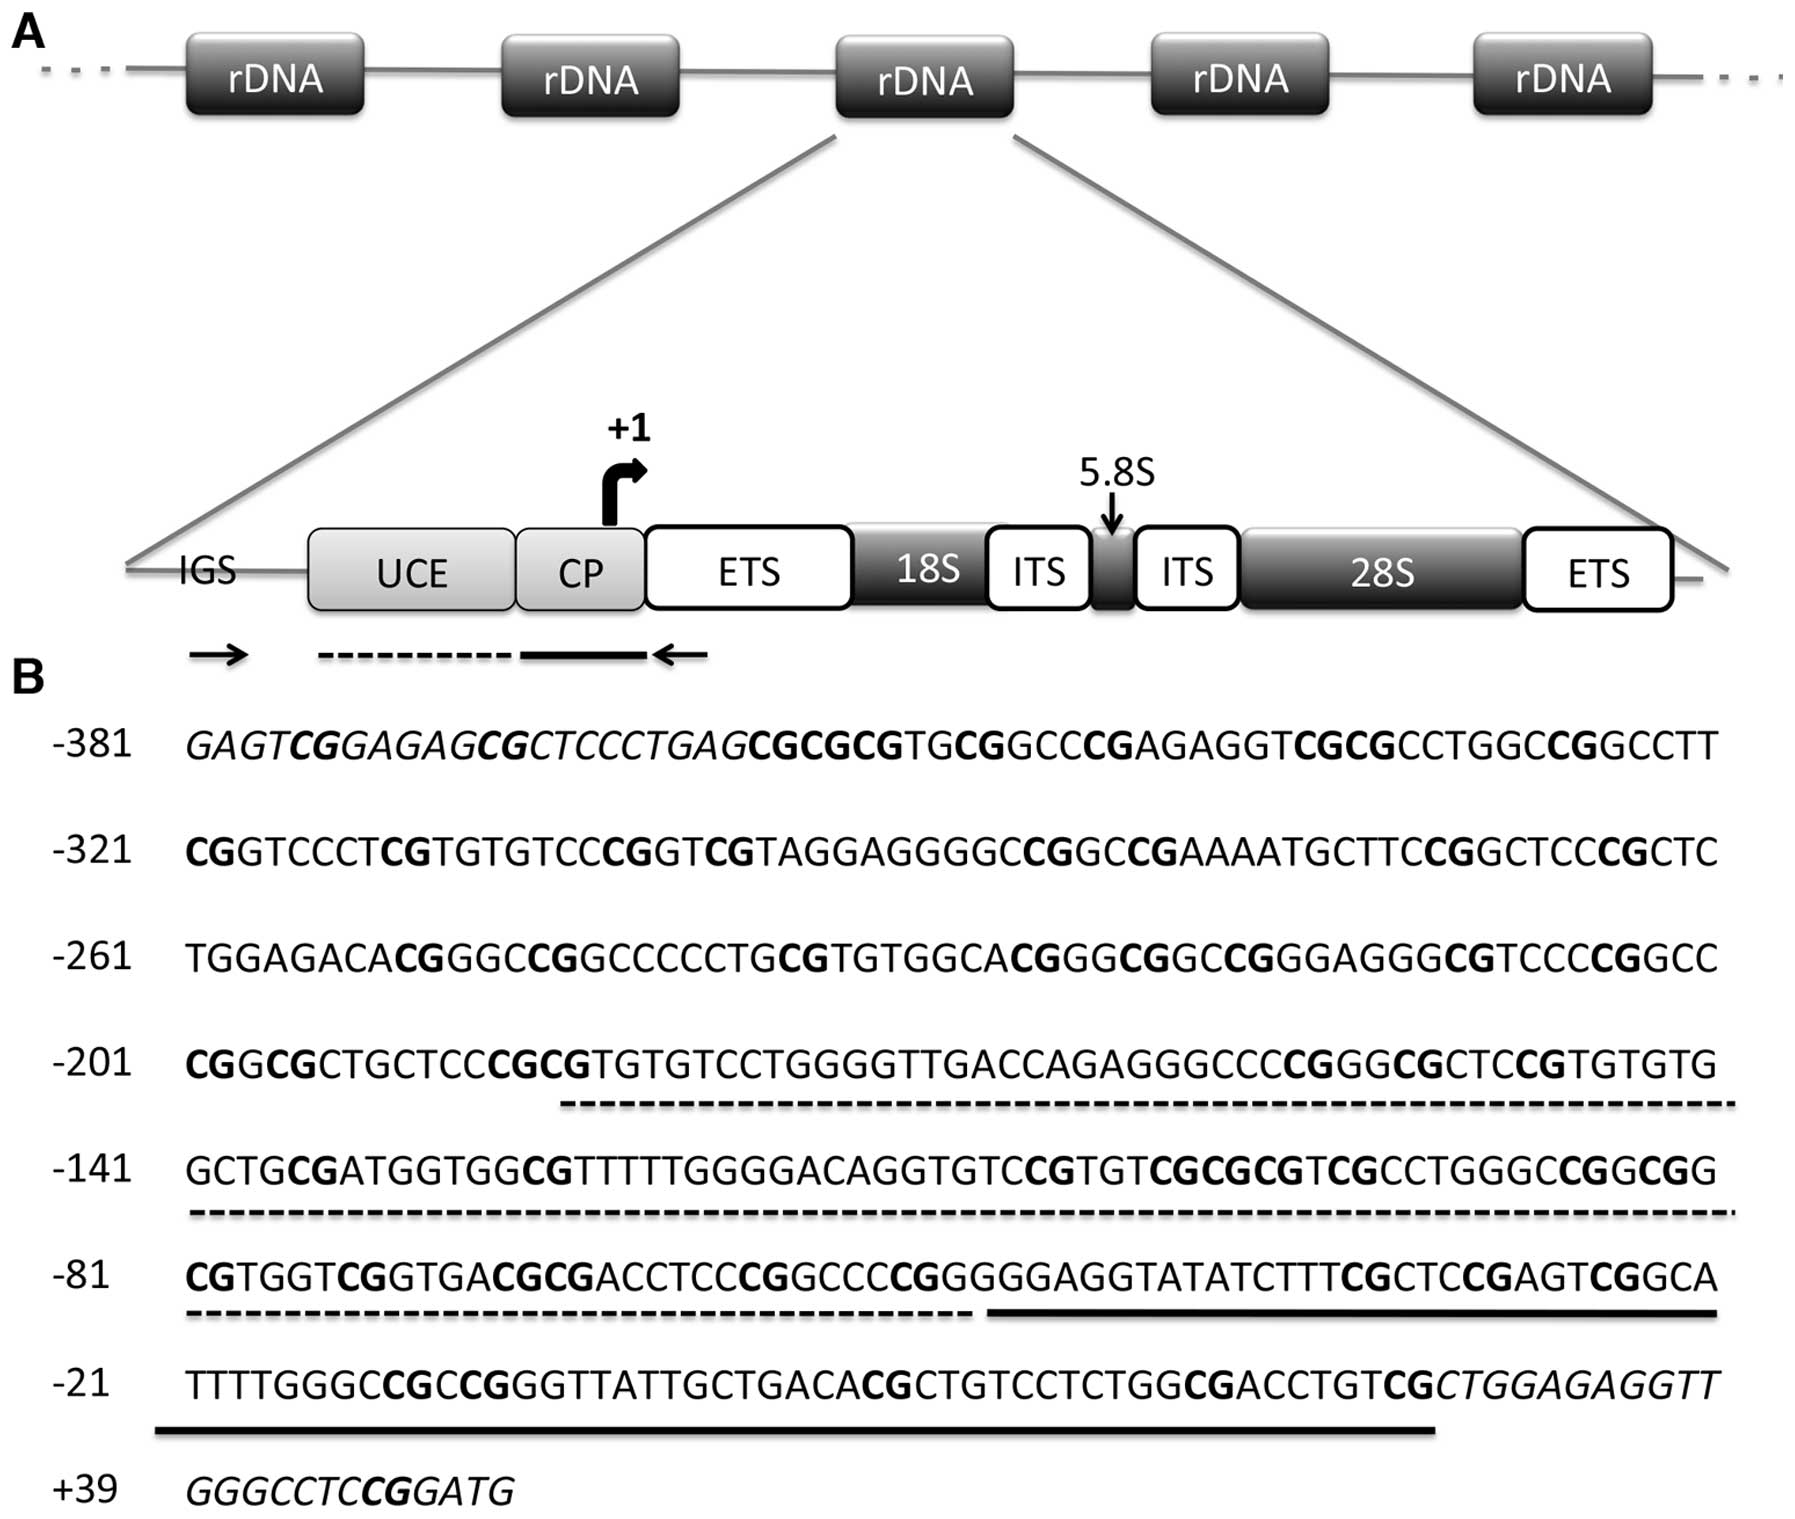
The entire promoter region of rRNA genes is
contained in an intergenic spacer region (IGS) between rDNA units.
The promoter region of rDNA repeating unit consists of two
important elements: the core promoter and upstream control element
(UCE). The core promoter is located between −50 to +20 bp and is
essential for basal transcription, whereas the UCE is located
150–200 bp upstream of the transcription start site and is required
for efficient pre-initiation complex formation (14) (Fig.
1A). Cooperative binding of the HMG1 box containing upstream
binding factor (UBF) and the selectivity factor (SL1 or TIF-IB) to
the promoter region is required for Pol I recruitment (15,16).
rRNA genes are transcribed as long precursors known as 45S pre-RNA
which are then rapidly spliced into the 18S, 28S and 5.8S rRNA
transcripts (17). Processed and
modified rRNA transcripts are assembled into respective ribosomal
subunits in the nucleolus (18,19).
The association between the nucleolus and cancer has
long been known. Abnormal morphology of the nucleolus in cancer
cells has drawn the attention of tumor pathologists since the 19th
century. However, only recently has the molecular biology of rRNA
synthesis and ribosome biogenesis in cancer cells begun to be
explored.
CpG island methylation at the promoters of tumor
suppressor genes is known to be an important factor in the
formation and progression of many types of cancer (20). The promoter and transcribed regions
of rRNA genes are rich in CG dinucleotide yet they are longer than
regular 1 to 2 kb CpG islands (21). A limited number of studies analyzing
the DNA methylation status of the rDNA promoter region in cancer
have focused on the relationship between rDNA promoter methylation
and the expression levels of rRNA genes.
Methylation at the 45S rDNA promoter region
decreased the expression of rRNA genes in hepatocellular carcinoma
(22) and in CD34+ cells
of patients with myelodysplastic syndromes (23). On the other hand, other studies have
shown no relationship or a positive correlation between promoter
methylation and rRNA transcription (24,25).
Although rRNA genes and particularly 18S RNA are
frequently used in qRT-PCR as housekeeping genes, recent studies
have shown that 18S is differentially expressed in breast tumor and
normal samples (26–28). Furthermore, changes in the relative
amount of spliced rRNA products from 45S have not been tested in
the context of breast cancer.
CpG methylation of rDNA has been identified as a
prognostic factor in ovarian, endometrial and breast cancer
(29–31). A recent study also revealed that the
45S rDNA promoter as well as the 5′ regions of 18S and 28S rDNA are
hypermethylated in breast cancer tissues compared to paired normal
tissues. Notably, methylation levels of these regions exhibited a
correlation with nuclear grade and nuclear size values (32). However, none of the previous breast
cancer studies examined the ratio of rRNA transcript levels and
rDNA promoter methylation levels in tumors and normal tissues
comparatively.
In the present study, we analyzed the methylation
levels of the 45S rDNA promoter in breast cancer cell lines as well
as in primary breast tumor tissues and matched normal samples. We
also determined the expression levels of rRNA transcripts in the
same samples in order to understand the role of rDNA promoter
methylation on rRNA gene expression in breast cancer. We showed for
the first time that the relative expression ratio of 18S and 5.8S
rRNA was differentially modulated in tumors in comparison to
adjacent normal tissues. In addition, relative rRNA expression in
normal tissues was significantly and negatively correlated with the
methylation status but this was not observed in the breast tumors.
Furthermore, the high correlation between expression of rRNA
transcripts in normal breast tissue was lost in tumors. Our
findings suggest a significant dysregulation of relative rRNA
expression in conjunction with promoter methylation.
Materials and methods
Cell culture, 5-aza-2′-deoxycytidine
(5-AZA) and trichostatin A (TSA) treatments
MCF7, MDA-MB-453, MDA-MB-468, BT20, MDA-MB-231 and
CAMA-1 breast cancer cell lines were grown in 10% fetal bovine
serum (FBS) (HyClone, Thermo Scientific, USA) and 1%
penicillin/streptomycin (P/S) supplemented with low glucose
Dulbecco’s modified Eagle’s medium (DMEM) (both from HyClone).
ZR-75-1 cell line was grown in 10% FBS, 1% P/S and 2 mM glucose
(Sigma-Aldrich, USA) supplemented with RPMI-1640 medium (HyClone).
BT-474 cell line was propagated in 10% FBS, 1% P/S and 10
μg/ml insulin (Sigma-Aldrich) supplemented with low glucose
DMEM. MDA-MB-157 and MDA-MB-361 cell lines were grown in 10% FBS, 1
mM sodium pyruvate (Gibco, Invitrogen, USA) and 1% P/S supplemented
with low glucose DMEM. HCC-1937 cell line was propagated in 10%
FBS, 1% P/S and 1 mM sodium pyruvate supplemented with RPMI-1640
medium. MCF10A was grown in 10% FBS, 1% P/S, 10 μg/ml
insulin, 20 ng/ml EGF and 0.5 mg/ml hydrocortisone (both from
Sigma-Aldrich) supplemented with DMEM/Ham’s F-12 (1:1) medium
(Biochrome, Merck Millipore, Germany). SKBR-3 cell line was grown
in 10% FBS and 1% P/S supplemented with McCoy’s 5A medium
(HyClone). CAL-51 cell line was propagated in 20% FBS and 1% P/S
supplemented with high glucose medium. All cells were grown in 5%
CO2 and 95% air at 37°C in a cell culture incubator. All
cell lines except MCF-10A and CAL-51 cells were purchased from the
American Type Culture Collection (ATCC; Rockville, MD, USA).
MCF-10A and CAL-51 were kindly provided by Assistant Professor Dr
A. Elif Erson (Middle East Technical University). Short tandem
repeat profiling was used to verify the authenticity of all cell
lines.
A total of 10 breast cancer cell lines (MCF7,
MDA-MB-231, MDA-MB-453, MDA-MB-468, BT-474, ZR-75-1, BT-20,
MDA-MD-361, SKBR-3 and CAL-51) and one non-tumorigenic breast cell
line (MCF-10A) were treated with 5-AZA or TSA. Cells seeded at a
density of 750,000/100 mm were treated with either 5 μM
5-AZA (Sigma-Aldrich) or dimethyl sulfoxide (DMSO) (same amount
used to solubilize 5-AZA). Drugs were changed every day along with
the medium, and cells were collected on day 5. 400 nM TSA or DMSO
(same amount used to solubilize TSA) was administered to the cells
24 h after cell plating, and the cells were collected after 48
h.
A total of 10 cell lines (MCF7, MDA-MB-231, MDA-MB-
453, MDA-MB-468, BT-474, ZR-75-1, BT-20, SKBR-3, CAL-51 and
MCF-10A) were treated with both 5-AZA and TSA (combination
treatment). 5-AZA (5 μM) was added at the day of seeding and
400 nM TSA was added 72 h later in combination treatment
(5-AZA+TSA); the cells were collected on day 5.
Patients and tissue samples
Primary breast tumors and matched normal tissues
were obtained from 19 patients at Ankara Numune Research and
Teaching Hospital (Table I).
Clinical tissue samples were used with the approval of the Research
Ethics Committee of Ankara Numune Research and Teaching Hospital,
and consent was obtained from the patients according to the
Helsinki Declaration.
 | Table IClinicopathological characteristics
of the patients. |
Table I
Clinicopathological characteristics
of the patients.
| Patient no. | Age (years) | ER | PR | Diagnosis | Path lymph
node | Grade | Clinical grade | DM | -DM month |
|---|
| 113 | 63 | + | − | IDC | + | 1 | Grade 3B | + | 20 |
| 115 | 57 | | | Papillary
carcinoma | − | 3 | Grade 2A | − | |
| 96 | 39 | − | + | IDC | − | 2 | Grade 2A | − | |
| 116 | 74 | − | − | IDC | + | 2 | Grade 2A | − | |
| 137 | 42 | − | + | Medullary | − | 3 | Grade 2B | − | |
| 146 | 49 | + | + | ILC | + | | Grade 2B | − | |
| 148 | 70 | + | − | IDC | + | 2 | Grade 3A | + | 15 |
| 154 | 32 | − | − | IDC | + | 3 | Grade 3B | − | |
| 159 | 30 | − | + | Metaplastic | − | 2 | Grade 2A | − | |
| 161 | 41 | − | − | IDC | − | 2 | Grade 2B | + | 47 |
| 164 | 74 | + | + | IDC | − | 2 | Grade 2B | − | |
| 166 | 55 | − | + | IDC | + | 2 | Grade 2A | − | |
| 168 | 44 | − | + | IDC | + | 2 | Grade 2B | − | |
| 170 | 60 | − | − | IDC | + | 2 | Grade 3B | − | |
| 176 | 49 | + | + | IDC | + | 2 | Grade 2A | − | |
| 177 | 47 | − | + | IDC | + | 2 | Grade 3A | + | 48 |
| 181 | 44 | − | − | IDC | + | 2 | Grade 1 | − | |
| 133a | | | | | | | | | |
| 173a | | | | | | | | | |
Tissues acquired from patients during surgery were
immediately frozen with liquid nitrogen and stored at −80°C until
RNA or DNA extraction was performed. Pathological examinations were
carried out with hematoxylin and eosin staining. Only the tumor
samples identified by pathological examination consisting of
>80–90% tumor cells were included in the present study.
DNA extraction and bisulfite
treatment
Genomic DNA was extracted from the breast cancer
cell lines as well as the clinical breast cancer and matched normal
tissue samples using the NucleoSpin Tissue DNA extraction kit
(Macherey-Nagel, Germany) following the manufacturer’s
instructions.
Sodium bisulfite treatment of DNA, which converts
unmethylated cytosine residues to uracil leaving methylated
cytosine residues unaffected, was performed with 1 μg
genomic DNA using the EpiTect Bisulfite kit (Qiagen, Germany).
Elution was performed using 20 μl of elution buffer.
Bisulfite-specific PCR, gel extraction
and bisulfite genomic sequencing
Bisulfite-converted DNA (1 μl) was amplified
with Taq DNA polymerase (Fermentas, Thermo Scientific, USA)
using bisulfite DNA-specific primers (22) targeting the 45S rDNA promoter (45S
bisulfite sequencing forward and reverse primer sequences are
listed in Table II). PCR products
were extracted from the gel using the QIAquick Gel Extraction kit
(Qiagen). Purified products were cloned into the pGEM-T Easy Vector
using the pGEM-T Easy Vector system (Promega, USA). The
transformation protocol was performed according to the pGEM-T Easy
Vector system manual using competent E. coli DH5α. Bacteria
were plated on LB-agar containing ampicillin (AppliChem, Germany),
IPTG and X-Gal (both from Fermentas) and positive clones (five
colonies from cell lines and 10 colonies from tissue samples) were
randomly selected.
| Table IIPrimers used in the present
study. |
Table II
Primers used in the present
study.
| Primer | | Sequence | Product size
(bp) | Efficiency
value |
|---|
45S bisulfite
sequencing primers
45S bisulfite sequencing primers | Forward
Reverse |
5′-GAGTCGGAGAGCGCTCCCTGAG-3′
5′-CTGGAGAGGTTGGGCCTCCG-3′ | 434 | – |
18S rRNA
18S rRNA | Forward
Reverse |
5′-AAACGGCTACCACATCCAAG-3′
5′-CCTCCAATGGATCCTCGTTA-3′ | 154 | 1.95 |
28S rRNA
28SS rRNA | Forward
Reverse |
5′-CAGGGGAATCCGACTGTTTA-3′
5′-ATGACGAGGCATTTGGCTAC-3′ | 151 | 1.85 |
5.8S rRNA
5.8S rRNA | Forward
Reverse |
5′-CTCTTAGCGGTGGATCACTC-3′
5′-GACGCTCAGACAGGCGTAG-3′ | 155 | 2.00 |
45S ETS
45S ETS | Forward
Reverse |
5′-CGATCTGAGAGGCGTGCCTT-3′
5′-GGCAGCGCTACCATAACGGA-3′ | 87 | 1.93 |
TBP
TBP | Forward
Reverse |
5′-TGCACAGGAGCCAAGAGTGAAAT-3′
5′-CACATCACAGCTCCCCACCA-3′ | 134 | 2.20 |
Small-scale isolation of plasmid DNA (mini-prep) was
performed with the NucleoSpin Plasmid Isolation kit
(Macherey-Nagel) according to the manufacturer’s instructions.
Plasmids containing the cloned inserts were confirmed with PCR
using T7 and SP6 universal primers. The insert-containing plasmids
were sequenced with SP6 primers using the dideoxy chain-termination
method (Iontek, Turkey).
Methylation analysis
Raw bisulfite sequencing data were analyzed using
the Quantification tool for Methylation Analysis) (QUMA), a
web-based quantification tool for methylation analysis (http://quma.cdb.riken.jp) (33). Bisulfite conversion rates of raw
sequencing data were determined by analyzing unconverted cytosine
residues in non-CG sites. Clones with a bisulfite conversion rate
of <95% were excluded. Clones from each sample were trimmed,
aligned and displayed as lollipop graphs using QUMA.
RNA isolation and cDNA synthesis
The frozen tumor (4–5 slices for each sample) and
normal (20–25 slices for each sample) tissue samples were cut into
60-μm sections and used for RNA isolation. Tissue samples
were lysed in 1 ml TRI reagent RT (Molecular Research Center, USA)
with a homogenizer and passed through a 21-gauge needle several
times. After a 5-min incubation at room temperature, 50 μl
of 4-bromoanisole (Molecular Research Center) was added/ml of TRI
reagent. Tubes were vortexed for 15 sec and incubated at room
temperature for 2–3 min. After incubation, the mixture was
centrifuged at 12,000 x g for 15 min at 4°C and then the aqueous
phase was collected into a clean tube. Isopropanol (0.5 ml) was
added to the aqueous phase/1 ml of TRI reagent used. The mixture
was incubated at room temperature for 10 min and then centrifuged
at 12,000 x g for 15 min at 4°C to recover the RNA. The supernatant
was removed, and the pellet was washed with 75% ethanol twice and
centrifuged at 7,500 x g for 5 min at 4°C. The pellet was air-dried
and dissolved in diethylpyrocarbonate (DEPC)-treated
H2O. In order to avoid DNA contamination of the total
RNA acquired from the tissue samples, DNase I treatment was
performed with the Message Clean kit (GenHunter, USA) according to
the manufacturer’s instructions. Total RNA (500 ng) was used in
random primed cDNA synthesis with the RevertAid First Strand cDNA
Synthesis kit (Fermentas).
RNA isolation from the cell lines was performed
using the NucleoSpin RNA II RNA isolation kit (Macharey-Nagel)
following the manufacturer’s protocol. Total RNA (1 μg) was
used in random primed cDNA synthesis with the RevertAid First
Strand cDNA Synthesis kit.
Real-time PCR
Real-time PCR was performed with primers targeting
45S ETS, 18S, 28S and 5.8 rRNA transcripts. All primer sequences
are listed in Table II. Randomly
primed cDNAs from both cell lines and frozen tissue samples were
diluted in a 1/5 ratio. Diluted cDNA (1 μl) was used in
every reaction containing 10 μl of DyNAmo SYBR-Green qPCR
kit (Thermo Scientific) and 10 pmol of forward and reverse primers
in a final volume of 20 μl. Thermal cycling conditions were
as follows: initial denaturation for 5 min at 95°C, 40 cycles of 30
sec at 95°C, 30 sec at 60°C and 30 sec at 72°C followed by melting
curve. All reactions were set as duplicates. The Stratagene Mx3005P
Real-Time PCR System (Agilent, USA) was used for real-time PCR
experiments.
The relative expression levels of rRNAs were
evaluated using log2 (2ΔCt) calculation. TBP was used as
the reference gene both for cell lines and clinical tissue samples
to assess the amount of cDNA. The geometric mean of the rRNA
expression values (GM-rRNAs) (18S, 28S, 5.8S and 45S ETS) was also
used as a reference gene in tissue samples in order to understand
the relative changes of rRNAs with respect to each other.
Statistical analysis
Raw bisulfite sequencing data were aligned, trimmed
and quality checked using QUMA. Lollipop graphs and pie charts of
the methylation status were also generated using QUMA (33). The Wilcoxon matched pairs signed
rank test was used to assess both sample-wise and CpG-wise
significant methylation differences between breast tumor and
matched normal samples. Significant expression differences were
determined using the paired t-test. Correlations between 45S rDNA
promoter methylation and rRNA expression levels, as well as rRNA
transcripts with each other were analyzed using Spearman
correlation.
The association of rDNA promoter methylation and
rRNA expression with clinical variables was evaluated with Spearman
correlation. p<0.05 was accepted as statistically significant
for all statistical analyses. All statistical analyses of
methylation and expression data were performed using IBM SPSS
software version 21.0 or GraphPad Prism 6.0.
Results
45S rDNA promoter is highly methylated in
breast cancer cell lines
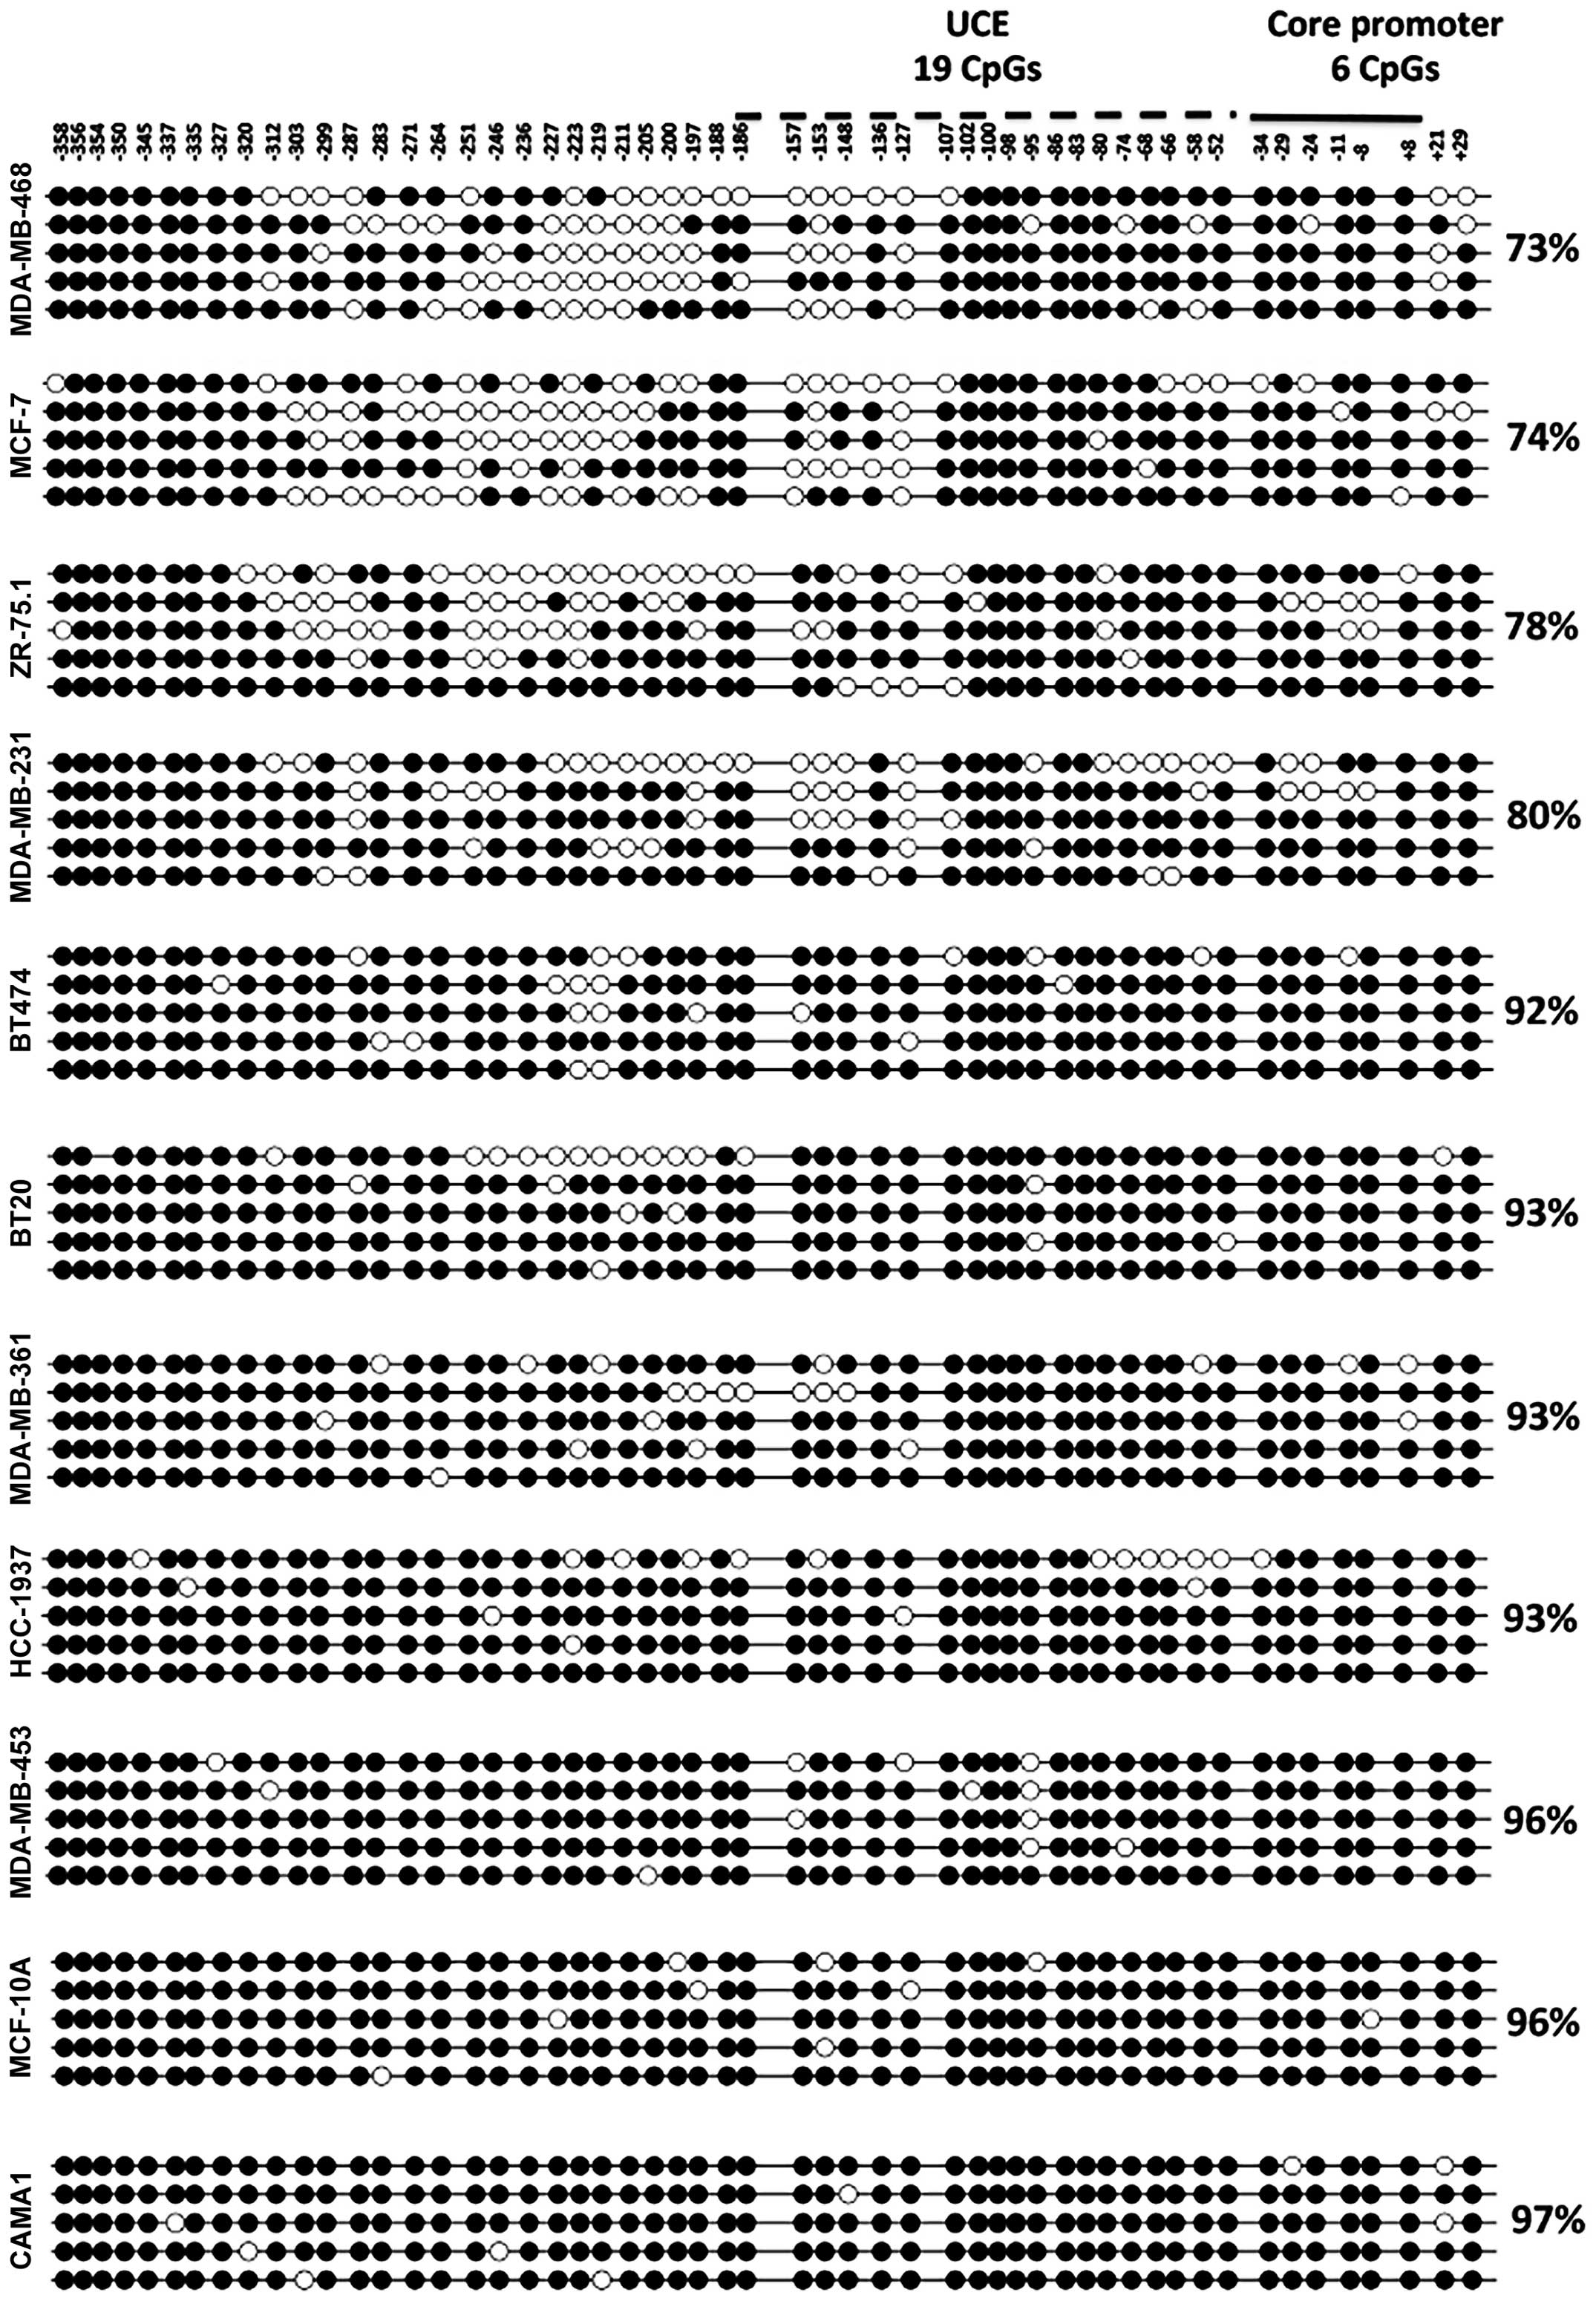
To identify the methylation levels of the 45S rDNA
promoter region in breast cancer in vitro, we performed
bisulfite genomic sequencing for the 45S rDNA promoter region in 10
breast cancer cell lines and a non-tumorigenic breast cell line
(MCF-10A). Bisulfite sequencing primers were obtained from a
previous study (22), which
amplified a 434-bp region spanning two important elements: UCE and
the core promoter (34) (Fig. 1B). Isolated DNAs from the cell lines
were treated with sodium bisulfite reagent, allowing for
integration of epigenetic information (DNA methylation) into
genetic information. Five randomly selected clones from each cell
line were sequenced, aligned and analyzed using QUMA (33). All cell lines, including a
non-tumorigenic breast cell line, MCF-10A, exhibited very high
levels of methylation (varying between 74 and 96%) in their 45S
rDNA promoter regions (Fig. 2).
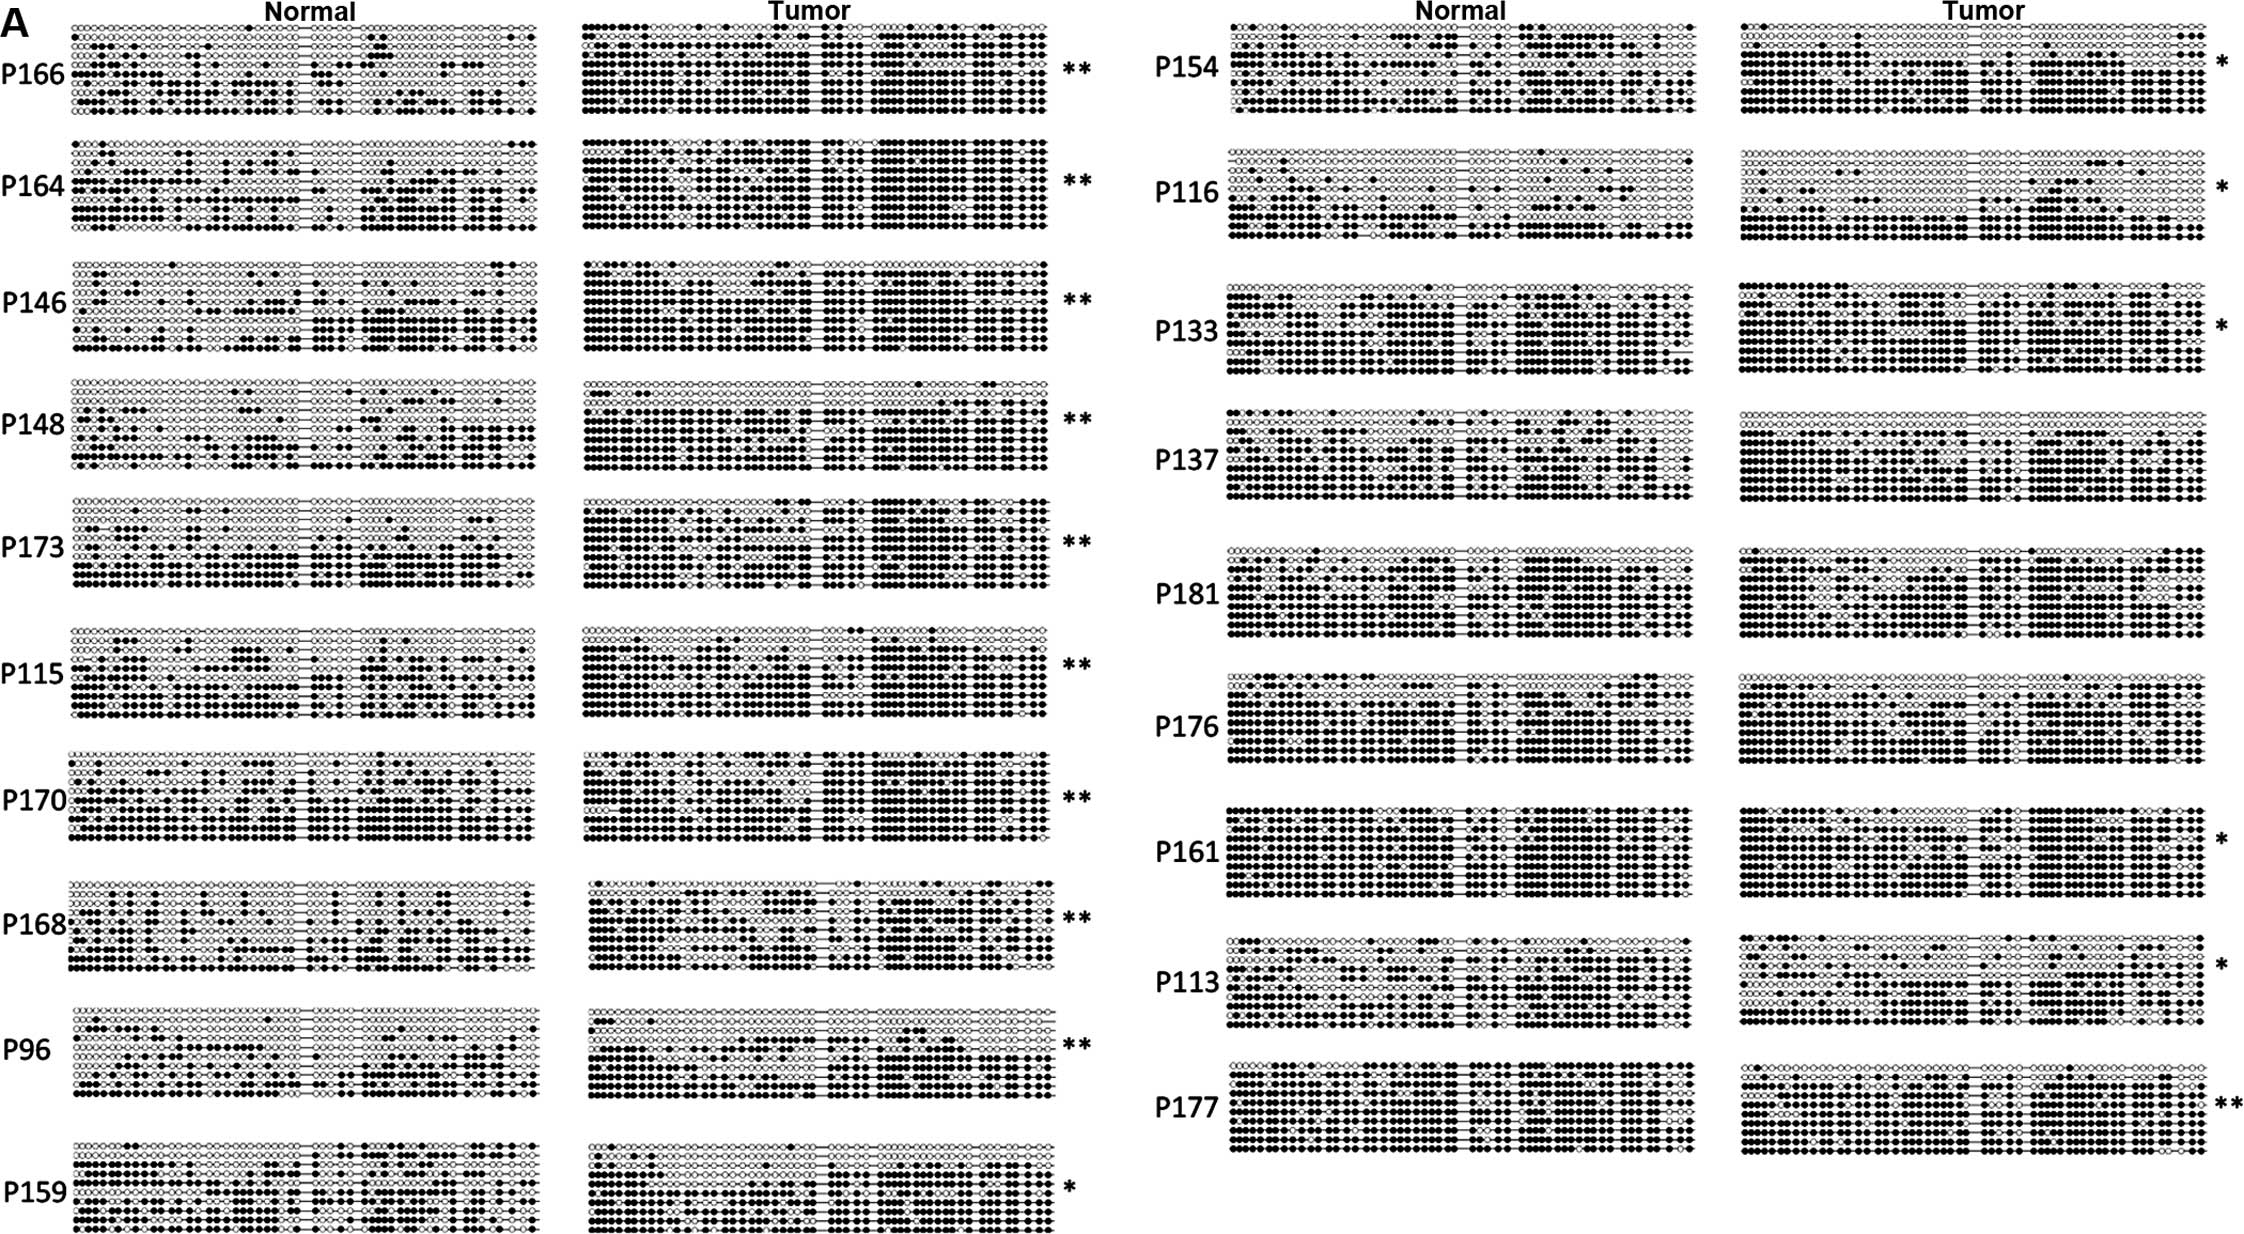
Breast tumors are heavily methylated
compared to their normal matched tissues in the 45S rDNA promoter
region
We analyzed 19 breast tumor and matched normal
frozen tissues (Table I) using the
same bisulfite genomic sequencing method to test whether
methylation levels of the 45S rDNA promoter region in patient
samples were similar to those of the cell lines. Ten randomly
selected clones were sequenced, aligned and analyzed from each of
the breast tumor and normal pairs using QUMA (33). We used the Wilcoxon signed rank test
for testing the paired differences instead of the Mann-Whitney U
test offered by the QUMA tool. Our results revealed that 13 out of
19 (68%) breast cancer tissue samples had higher methylation levels
of the 45S rDNA. On the other hand, three samples showed
significantly higher methylation levels in normal samples compared
to their tumor pairs, whereas there was no significant difference
between promoter methylation levels in breast tumor and matched
normal tissues in the remaining three samples (Fig. 3A). Normal samples were not fully
unmethylated and instead showed a mosaic methylation pattern, a
relatively common observation for human rDNA promoters (22). Methylation patterns of tumor and
normal pairs showed a significant correlation with each other. To
test whether this correlation was due to patient-specific
methylation of rDNA promoters, we performed a correlation analysis
between randomly selected tumor and normal samples; and these
showed similar degrees of correlation (data not shown). In
addition, the analysis of individual CpGs in tumor and normal pairs
revealed significant methylation levels in different CpGs
identified with the Wilcoxon matched pairs signed rank test
(Fig. 3B).
No significant correlation was identified between
rDNA promoter methylation levels and patient clinical
variables.
Expression levels of rRNA transcripts in
breast cancer
TBP, GAPDH and ACTB have been used as reference
genes to determine rRNA expression levels in several studies
(23,24,35)
but these RNA polymerase II (Pol II) transcribed genes are variably
expressed in numerous types of cancer (36,37).
However, several studies advise against using rRNA levels to
determine mRNA levels (26,27). Accordingly, using mRNA levels to
normalize rRNA levels may have a similar drawback. Herein, we
propose that GM-rRNA, the geometric mean of expression from an rRNA
pool (18S, 28S, 5.8S and 45S ETS) synthesized by Pol I, can be used
to analyze relative changes in rRNAs with respect to each other
between tumor and normal samples, as well as in cell lines. We
performed our analyses using both TBP and GM-rRNA normalization to
test the effect of normalization on expression changes in rRNA
transcripts.
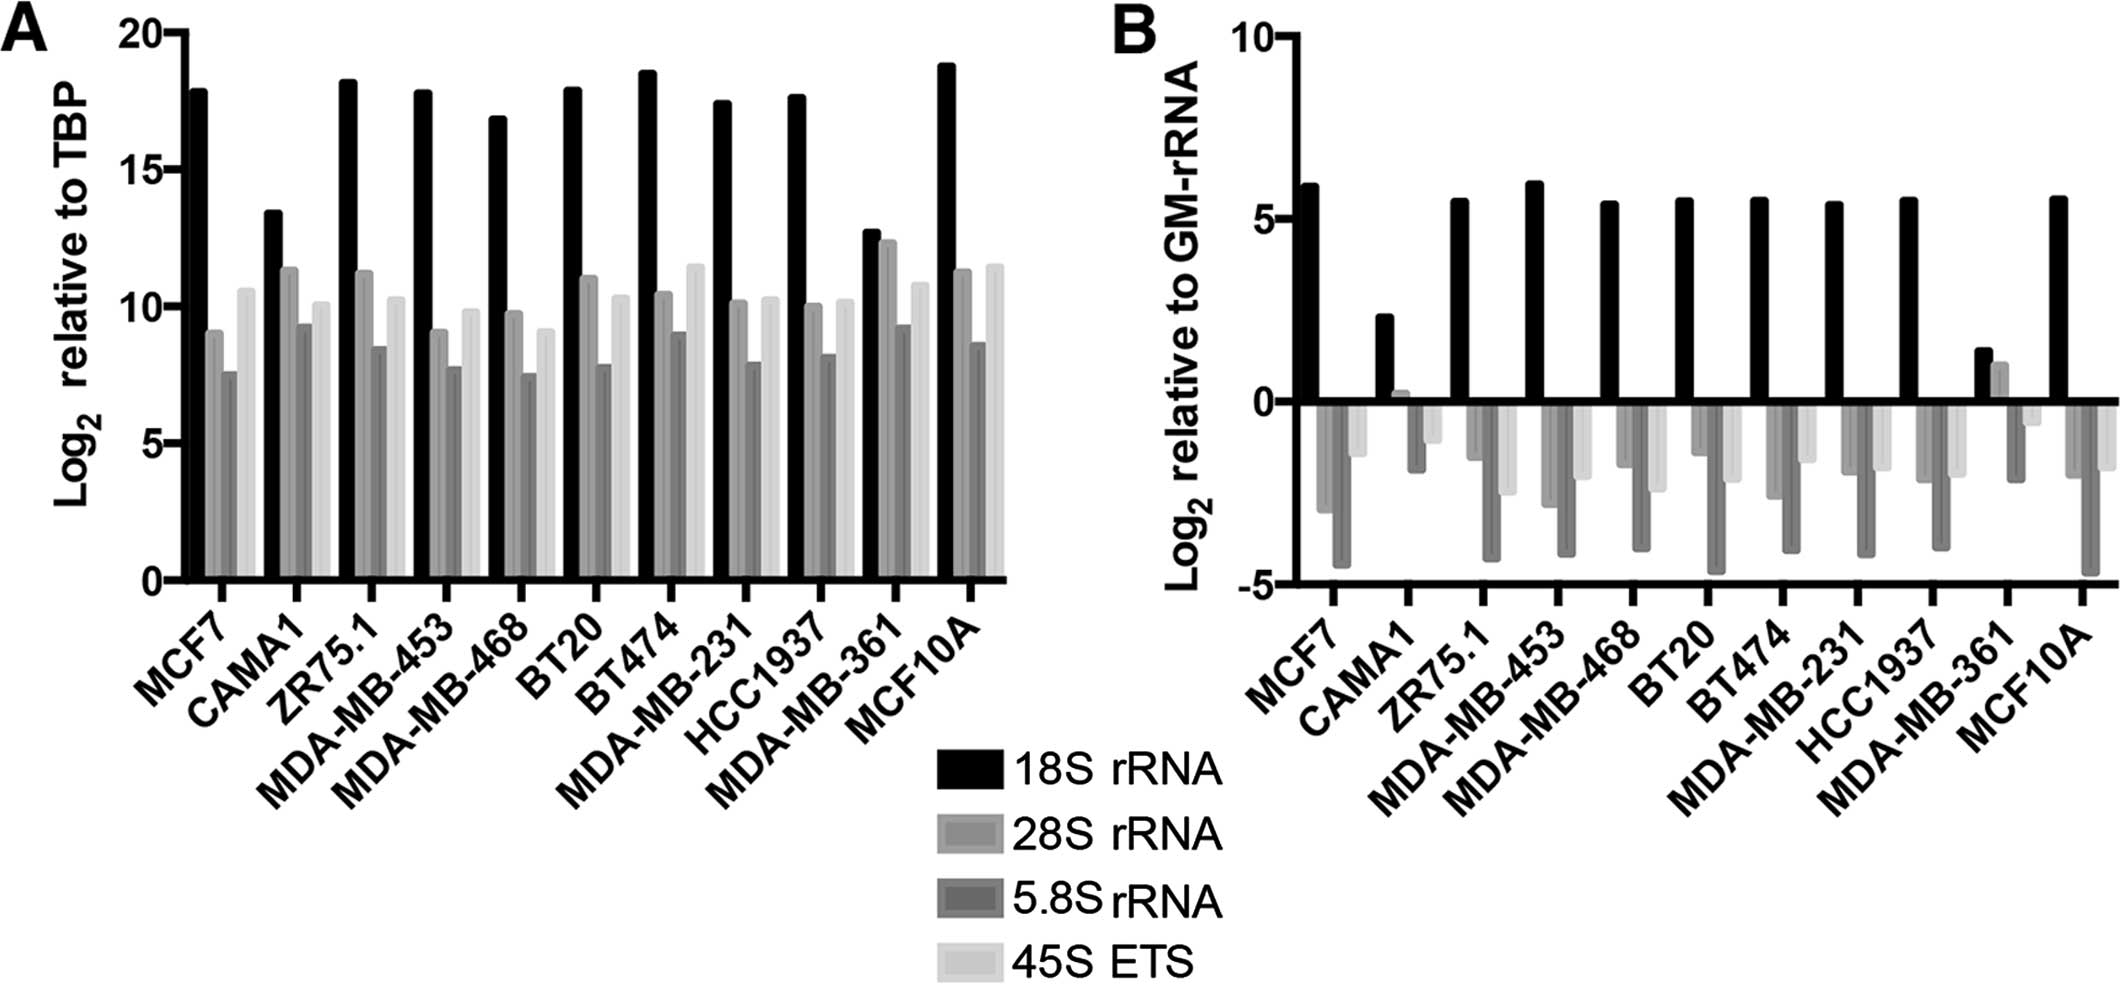
Expression of rRNA transcripts is highly
variable in breast cancer cell lines
It is known that promoter DNA methylation has a
repressive effect, particularly on Pol II transcribed genes in
cancer (20,38) and increased methylation levels are
implicated in decreased levels of rRNA transcription (22,23).
Thus, we hypothesized that rRNA transcription levels may also be
downregulated in these breast cancer cell lines with a
hypermethylated 45S rDNA promoter. Total RNA was isolated and
tested in cell lines with qRT-PCR using primers targeting Pol I
products 18S, 28S, 5.8S and 45S external transcribed spacer (ETS)
region.
All of the rRNA transcripts were expressed at
varying levels among the cell lines when normalization was
performed with the TBP gene (Fig.
4A). Similar results were obtained when we used GM-rRNA to
determine changes in the ratio of the rRNA transcripts (Fig. 4B).
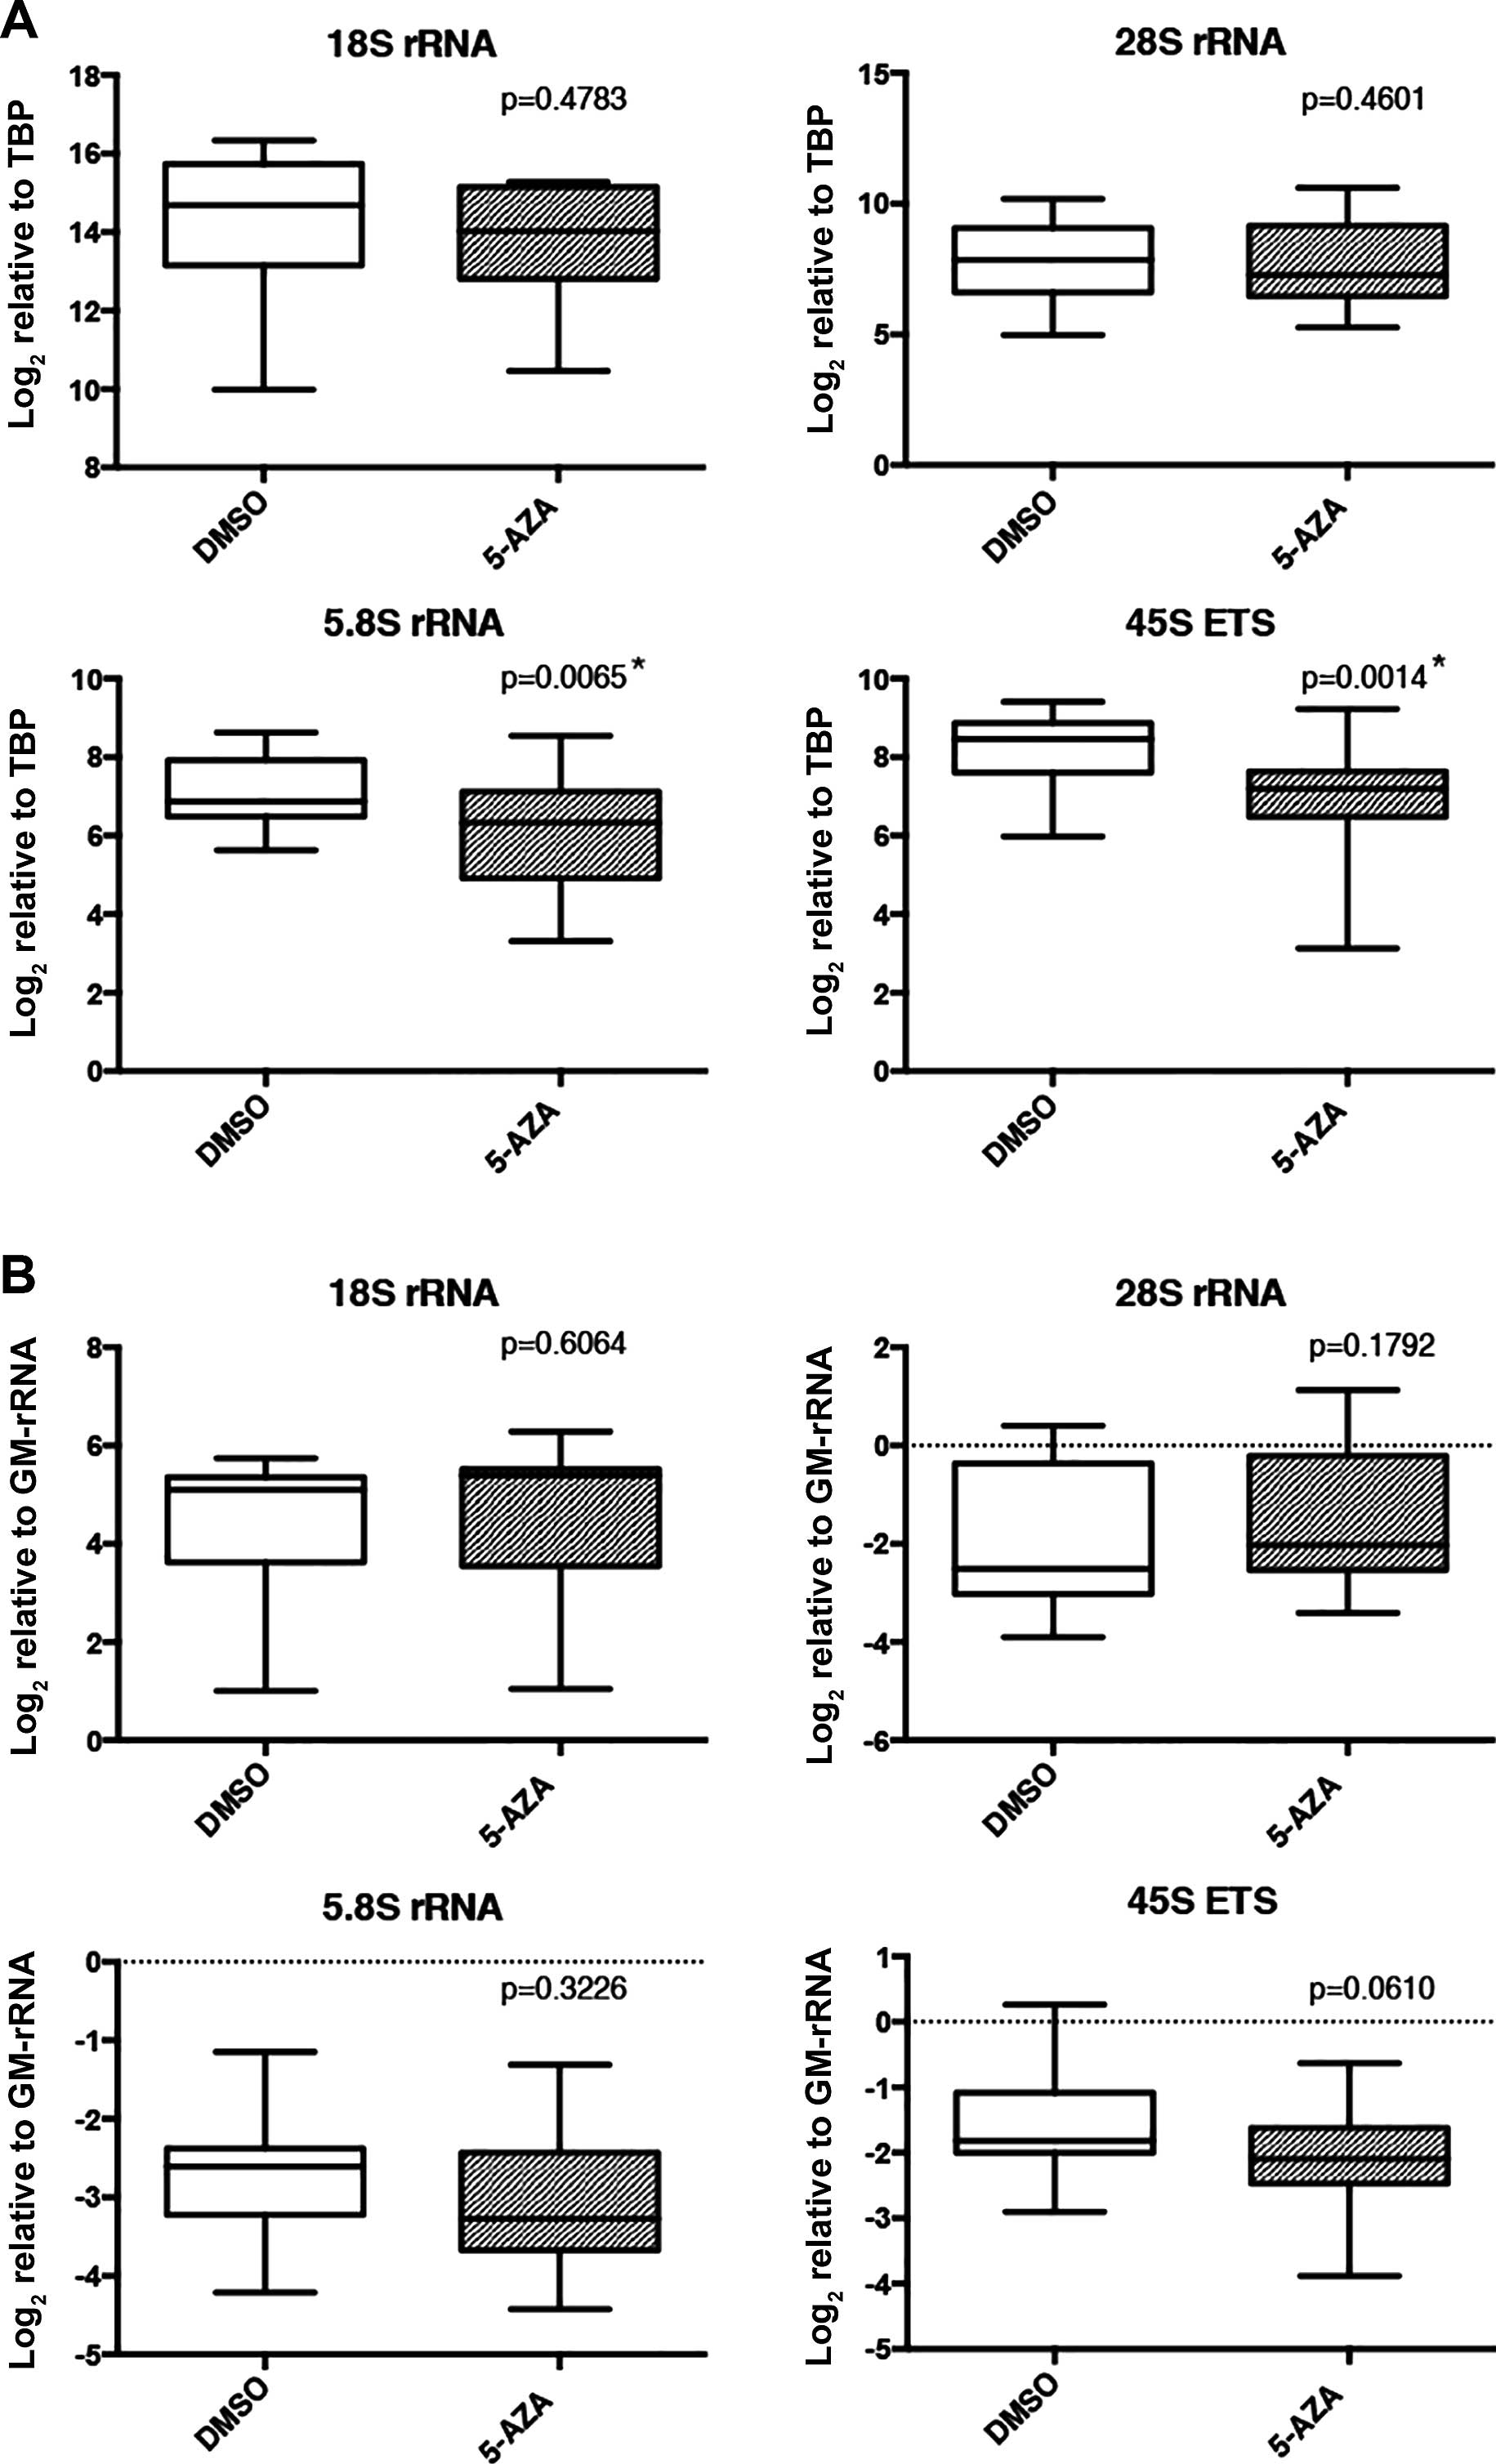
Epigenetic drugs 5-AZA and 5-AZA+TSA
modulate expression of rRNA transcripts
To further establish the relationship between 45S
rDNA promoter methylation and rRNA expression, we used the
hypomethylating agent, 5-AZA, which prevents DNA methylation by
inhibiting DNA methyltransferases (39) and leads to increased RNA
transcription. TBP normalized expression levels of 5.8S and 45S ETS
transcripts were significantly decreased upon 5-AZA treatment
(Fig. 5A). However, proportion of
rRNA transcripts did not exhibit significant differences between
5-AZA- and DMSO-treated samples (normalization with GM-rRNA)
(Fig. 5B).
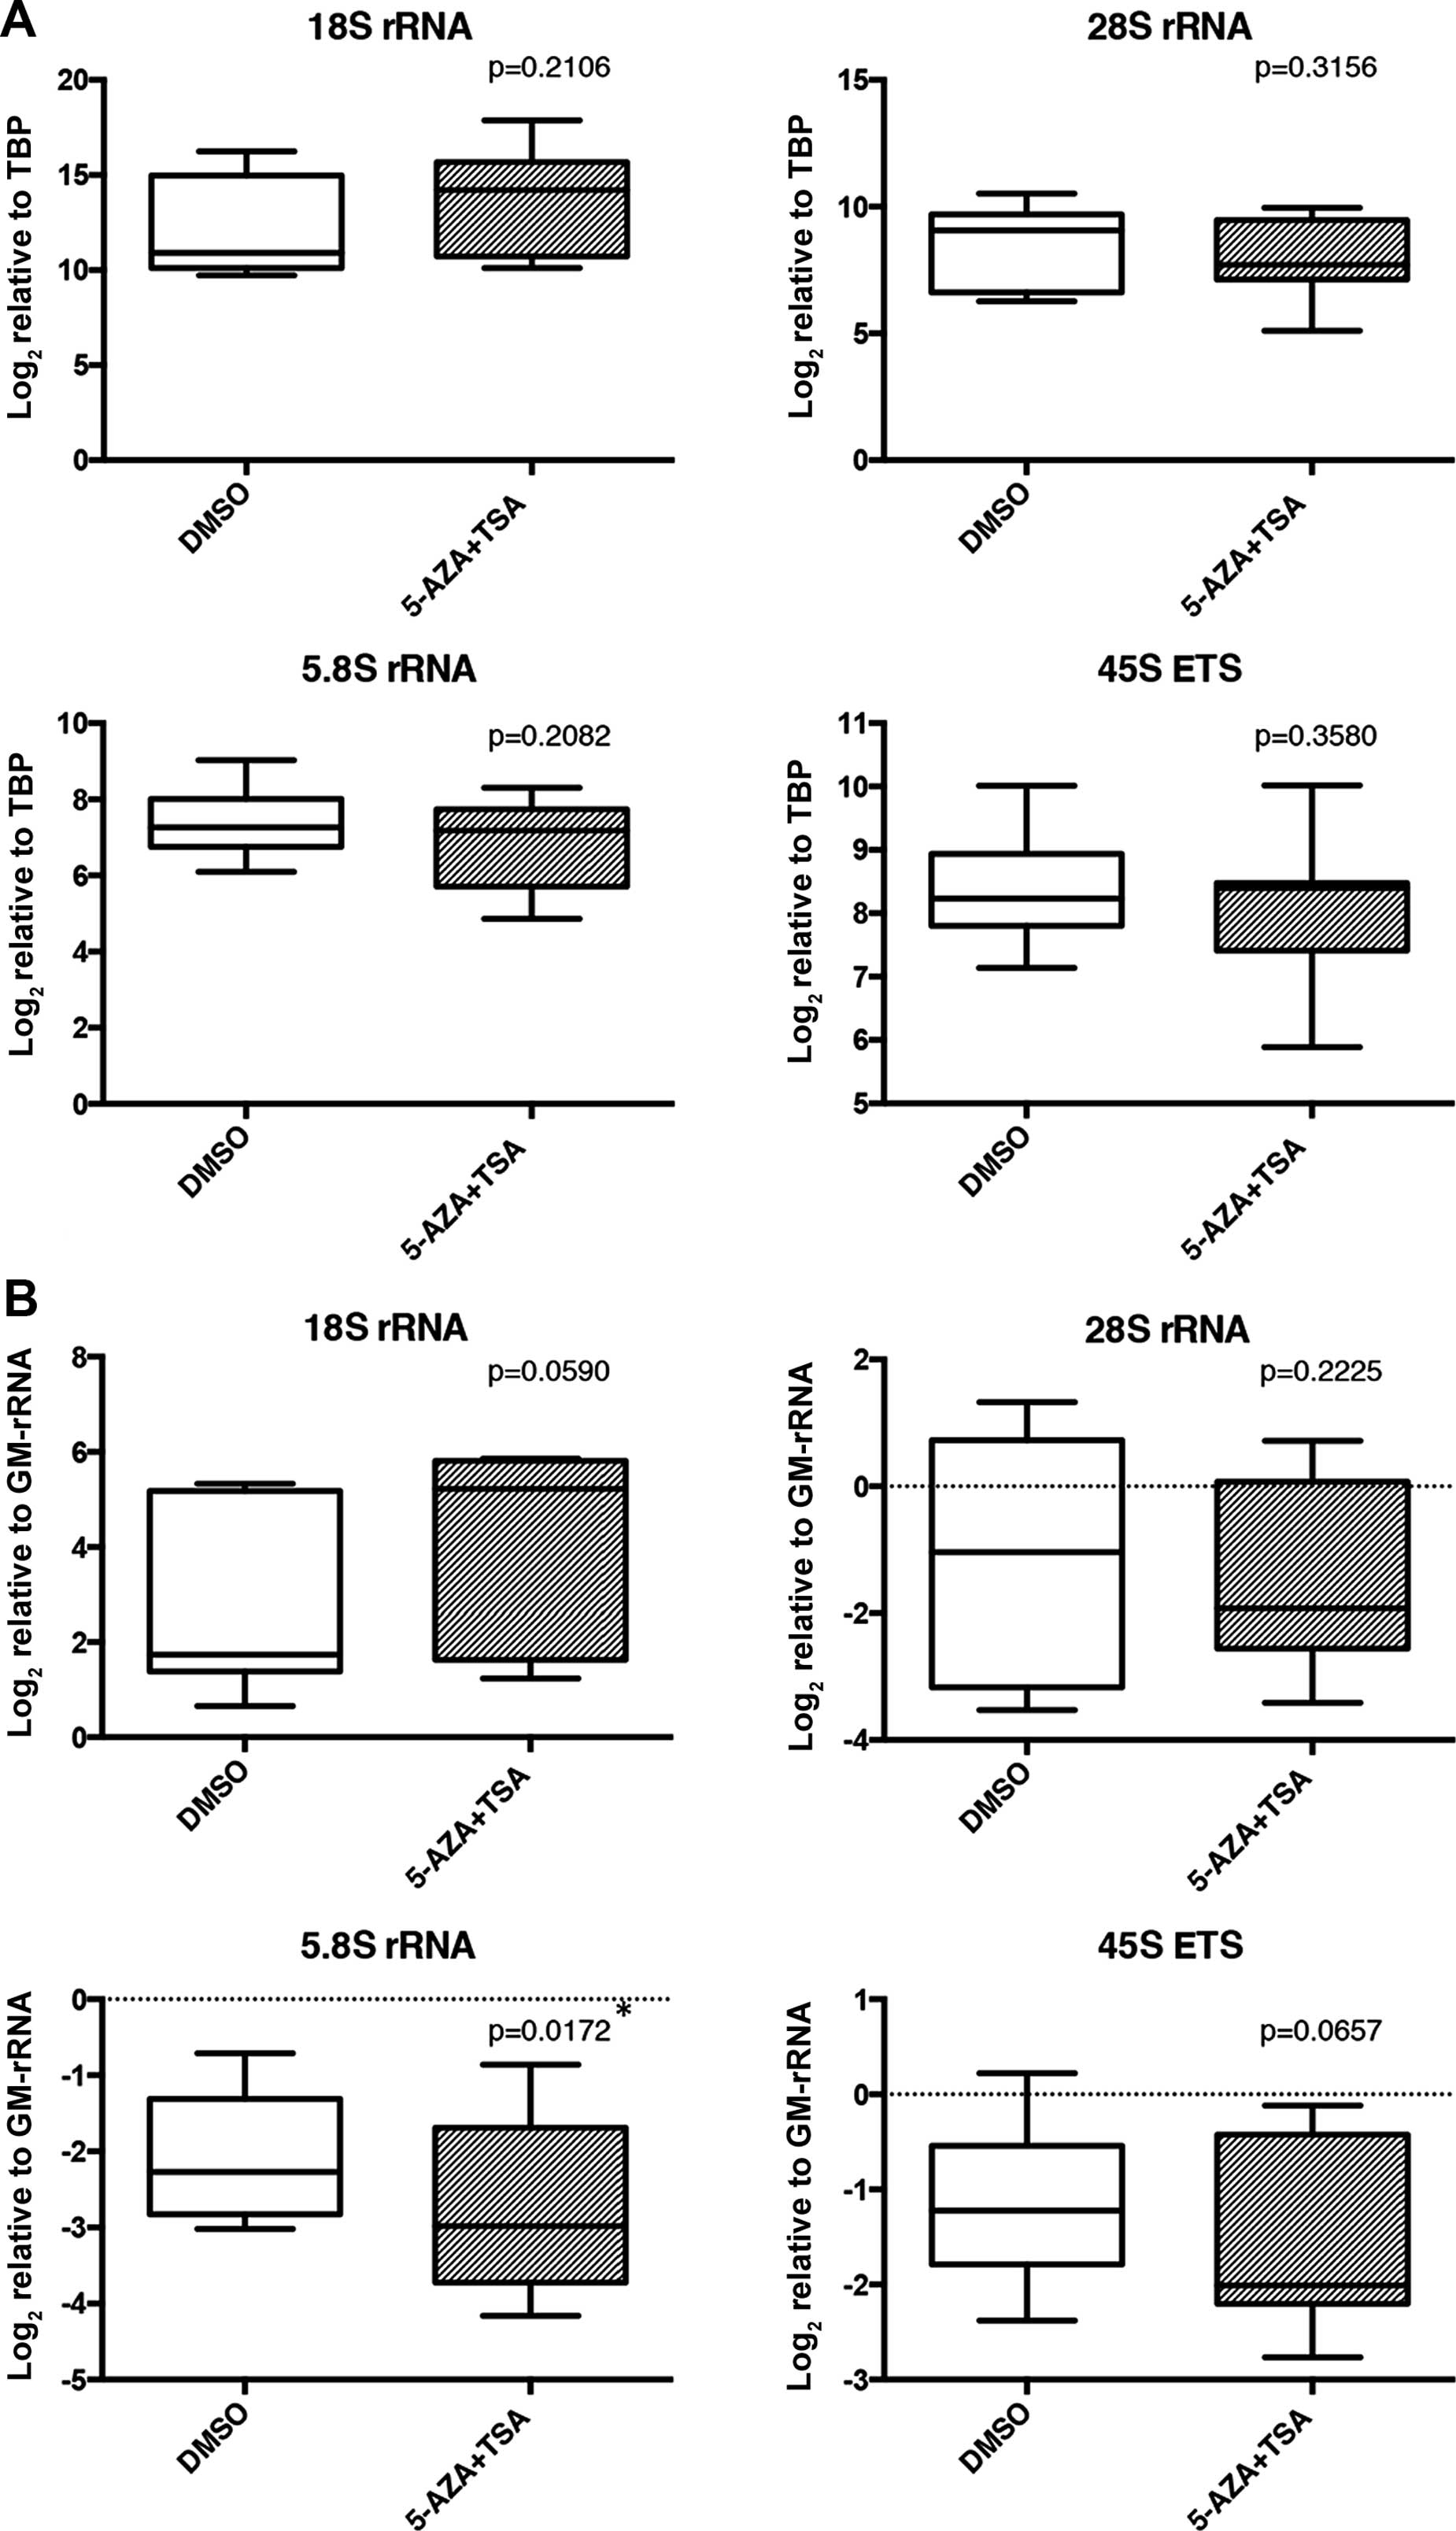
TSA is a non-specific histone deacetylase (HDAC)
inhibitor. TSA treatment of cells affects the acetylation status of
H3 and H4 and thus TSA indirectly upregulates gene expression by
dispersion of the chromatin structure (39). Therefore, TSA was used to determine
whether other mechanisms (such as histone acetylation) are involved
in the rRNA synthesis besides DNA methylation. TSA treatment alone
did not significantly alter the expression levels or the relative
proportions of the rRNA transcripts when normalized with TBP or
GM-rRNA, respectively (data not shown). Treatment with 5-AZA and
TSA together (5-AZA+TSA) did not significantly affect the TBP
normalized expression levels of the rRNA transcripts (Fig. 6A). However, the 5.8S proportion of
rRNAs was significantly decreased in the 5-AZA+TSA-treated samples
compared to the DMSO-treated samples (Fig. 6B).
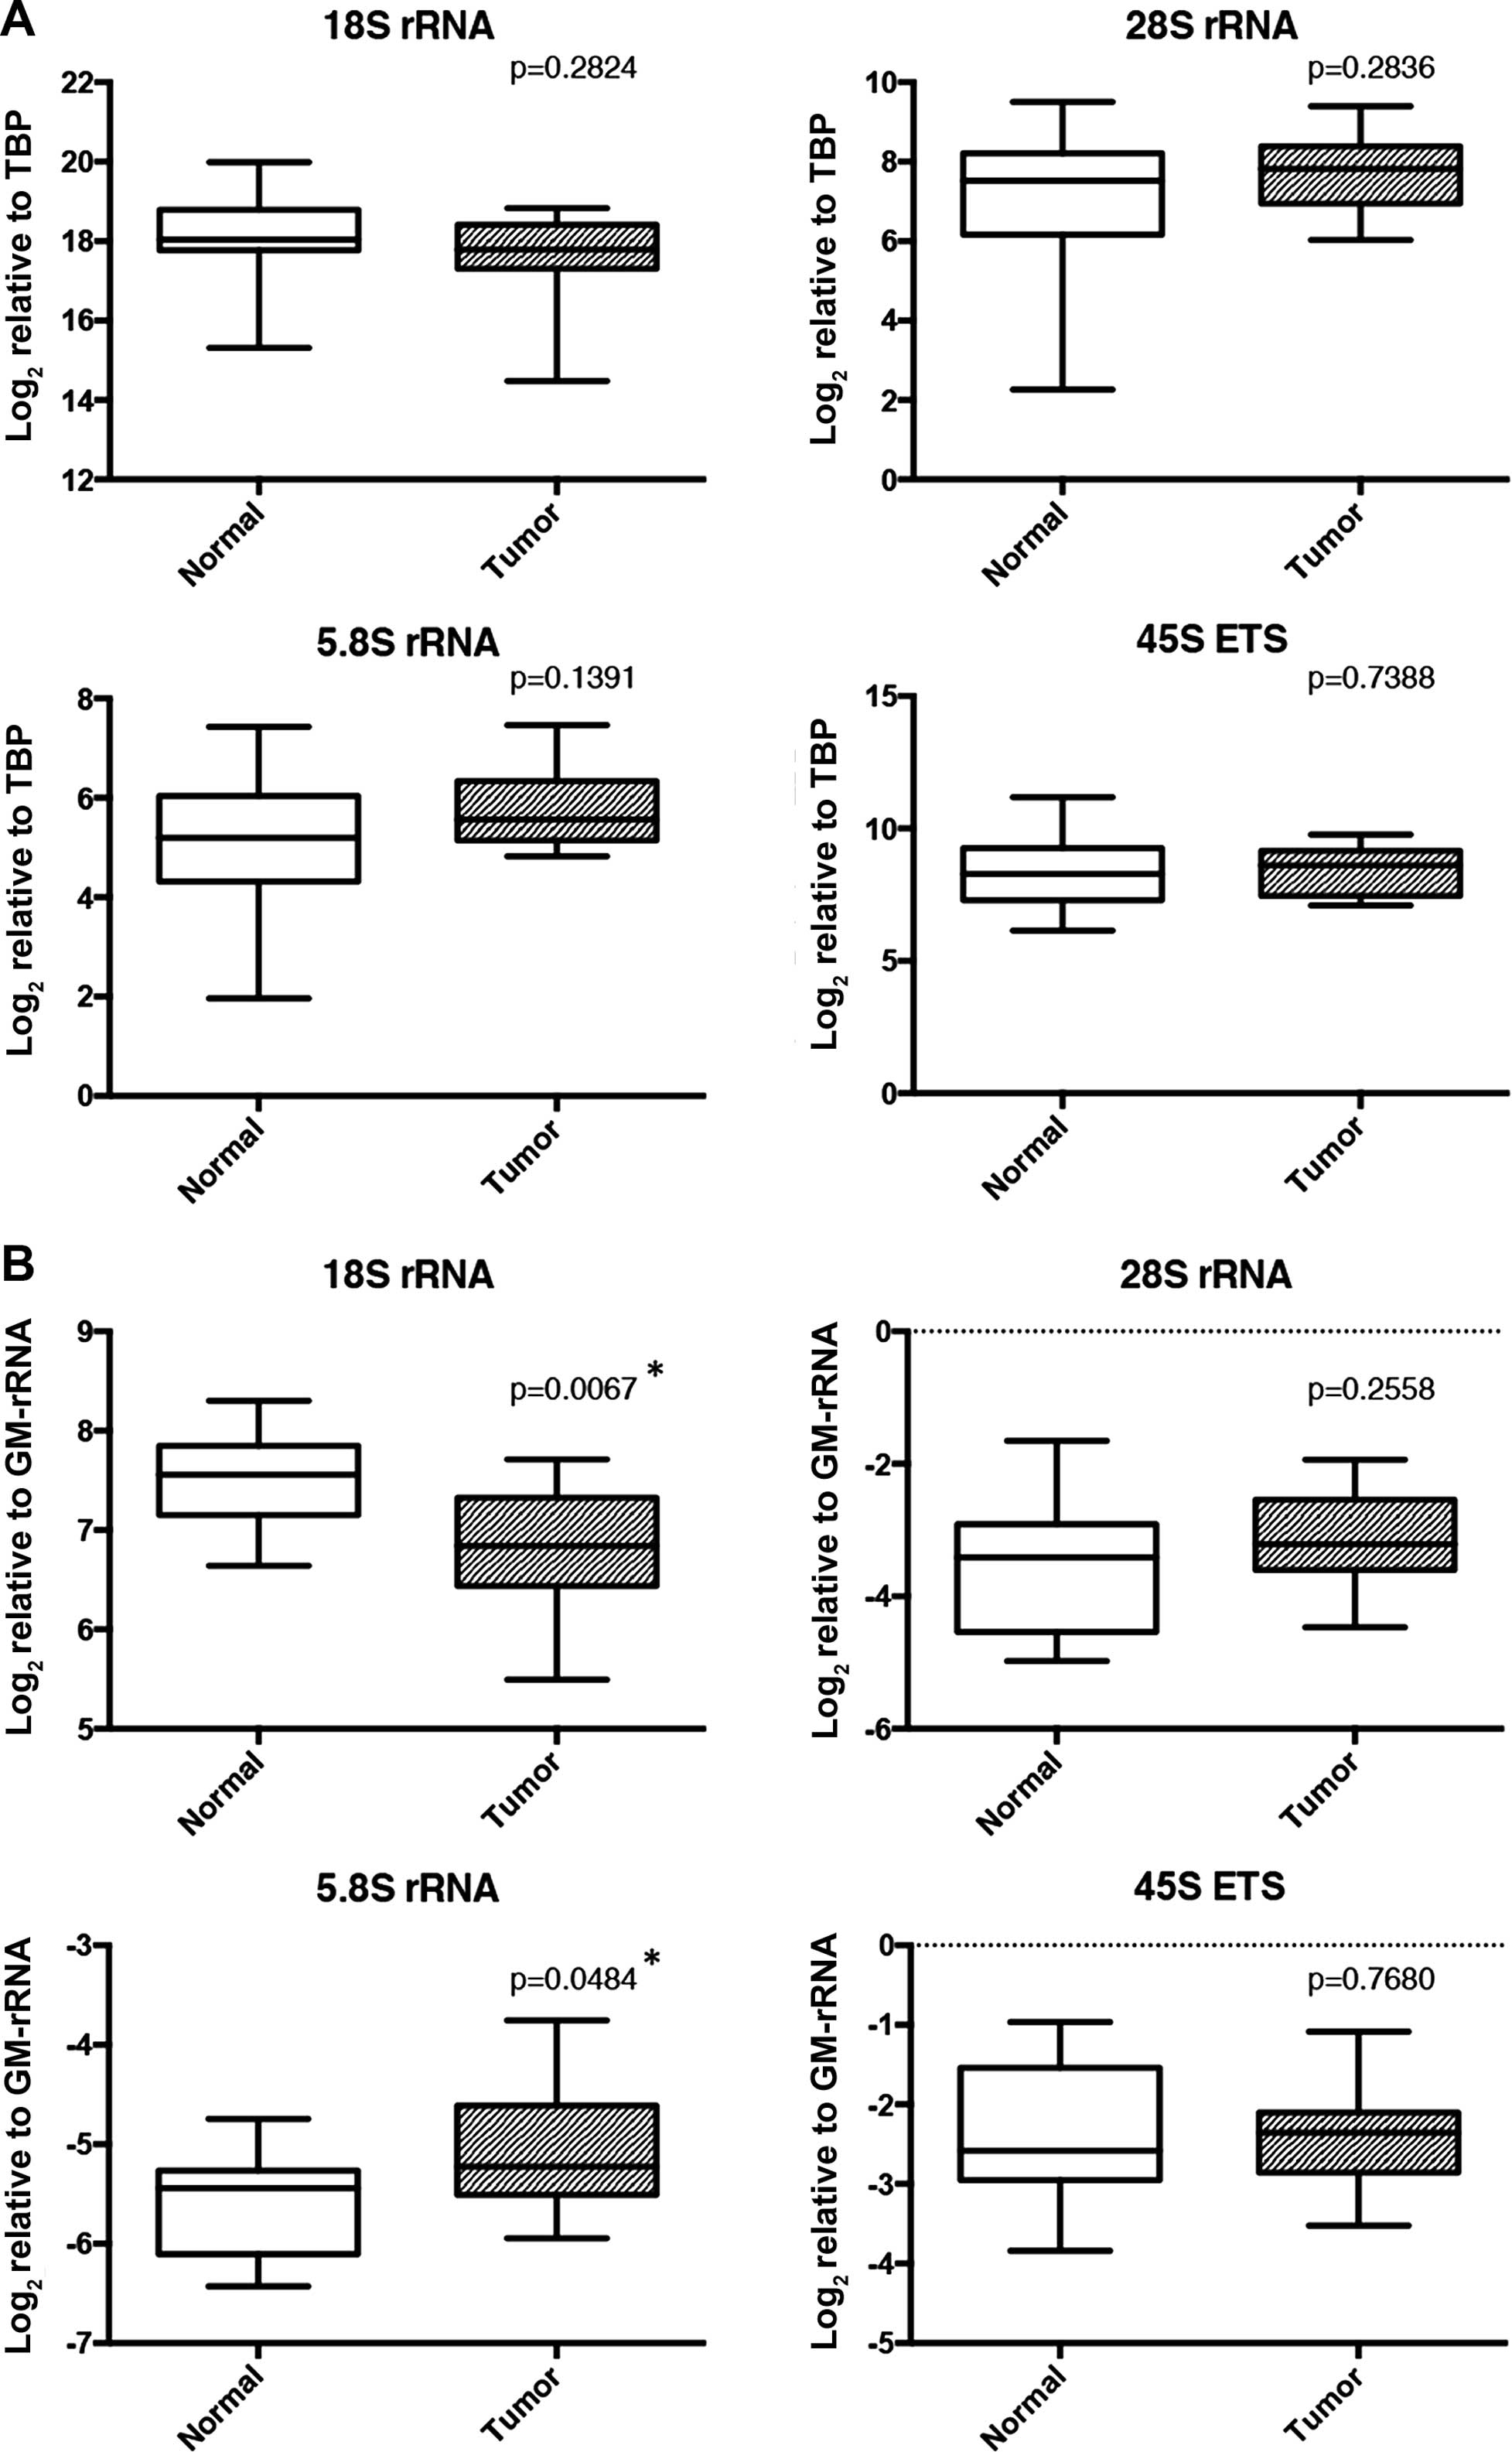
Relative expression levels of 18S and
5.8S transcripts are altered in breast tumors
Next, we tested whether increased levels of
methylation of the 45S rDNA promoter in tumor samples led to
repressed expression levels of rRNA transcripts. RNA isolation was
performed from the same tissue samples used in the methylation
analysis (only 14 of 19 paired tissue samples had enough tissue for
RNA isolation). Expression levels, when analyzed using TBP as a
reference gene, did not differ between the tumors and corresponding
adjacent normal tissues for any of the rRNA transcripts (Fig. 7A). However, when normalized with
GM-rRNA, the proportion of 18S was significantly decreased in the
tumor samples whereas that of 5.8S rRNA was significantly increased
(Fig. 7B).
rRNA transcripts are expressed
independent from 45S rDNA promoter methylation levels in breast
cancer cell lines
There was no significant correlation of rDNA
methylation levels with rRNA expression levels or rRNA ratios in
the breast cancer cell lines or in the MCF10A cells
(non-tumorigenic cell line). rRNA expression levels, as well as
relative rRNA proportions in cell lines were found to be
independent of their promoter methylation levels (data not shown).
These results indicate that rRNA transcripts were expressed even in
the presence of heavy methylation at the 45S rDNA promoter.
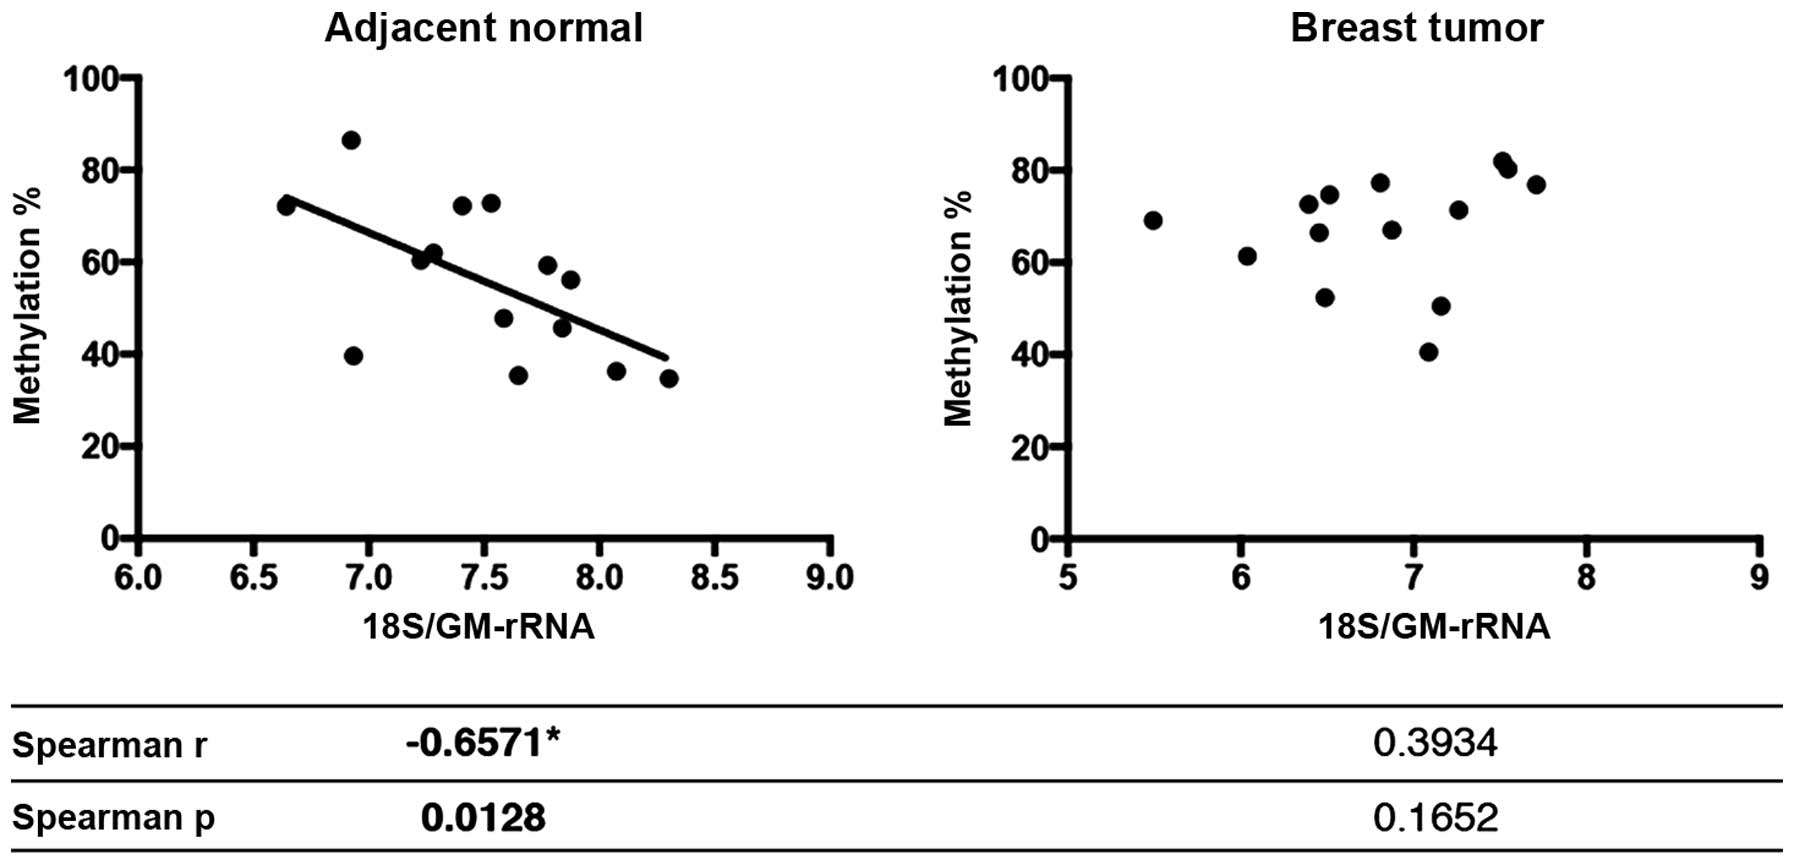
Correlation between 45S rDNA promoter
methylation and 18S rRNA expression is disrupted in breast
tumors
Next, Spearman’s correlation analysis was performed
to test whether the 45S rDNA promoter methylation levels in the
breast tumor and matched normal samples were correlated with either
rRNA expression levels or rRNA proportions in the rRNA pool. When
rRNA expression levels were normalized with TBP expression, no
correlation between expression and methylation was observed (data
not shown). The increase in methylation of the rDNA promoter levels
in the normal samples was inversely correlated with the 18S
rRNA/GM-rRNA expression ratio (Spearman r=−0.6571 and p=0.0128),
yet promoter hypermethylation did not exhibit any correlation with
18S rRNA/GM-rRNA ratios in the tumor samples (Fig. 8).
Furthermore, Ct values of rRNAs transcribed from the
45S rDNA promoter were highly correlated with each other in the
normal samples, yet this correlation was lost in the tumor samples
(Table III).
| Table IIICorrelation analysis between rRNA
transcripts in tumor and normal samples. |
Table III
Correlation analysis between rRNA
transcripts in tumor and normal samples.
| Sample | Transcript | 28S rRNA | 5.8S rRNA | 45S ETS |
|---|
| Normal | 18S rRNA | 0.837
(p<0.01)a | 0.824
(p<0.01)a | 0.818
(p<0.01)a |
| 28S rRNA | | 0.833
(p<0.01)a | 0.674
(p=0.012)a |
| 5.8S rRNA | | | 0.57
(p=0.033)a |
| Tumor | 18S rRNA | 0.042
(p=0.887) | −0.051
(p=0864) | 0.288
(p=0.318) |
| 28S rRNA | | 0.521
(p=0.056) | 0.349
(p=0.221) |
| 5.8S rRNA | | | 0.543
(p=0.045)a |
rRNA expression levels were correlated
with the grade of breast cancer
Expression of the 45S ETS region (TBP normalization)
in tumor samples (n=11) was positively correlated with the grade of
breast cancer (Spearman r=0.650, p=0.03). Additionally, the
28S/GM-rRNA ratio of tumor samples was also positively correlated
(Spearman r=0.725, p=0.012) while the 18S/GM-rRNA ratio was
negatively correlated with the grade (Spearman r=−0.714,
p=0.014).
Discussion
A high expression of rRNA transcripts characterizes
cancer cells but only a few studies have analyzed the expression of
18S rRNA in breast cancer tissues and matched normal samples.
Previous studies have mostly focused on testing whether rRNA genes
are suitable as reference genes (26,27).
One of these studies found that 18S rRNA was expressed at lower
levels in breast tumors compared to matched normal tissues in
contrast to the general acceptance of higher rRNA expression in
tumors (26). None of the studies,
however, investigated whether the expression difference between
breast cancer and normal pairs was due to rDNA promoter methylation
or whether the ratios of spliced products of the 45S precursor were
differentially expressed between tumor and normal pairs in breast
cancer.
DNA methylation is a well-known phenomenon that
inactivates transcription by interfering with Pol II binding to the
promoter (40); since Pol I and Pol
II share common features and transcription factors (41–43),
DNA methylation in the 45S rDNA promoter may have a similar effect
on expression of rRNA genes.
We used both breast cancer cell lines and clinical
breast cancer tissues to investigate the methylation levels of rDNA
promoters and expression differences of rRNA transcripts, as well
as their relationship with each other in breast cancer. We found
that breast cancer cell lines were hypermethylated (74–96%
methylation) at the 45S rDNA promoter region (Fig. 2). High methylation levels of rDNA
promoters are frequently identified in many transformed cell lines
such as Jurkat, CEM, HeLa, KB (44), NIH 3T3 (45) and HEK293 (46). A genome-wide analysis of aberrant
methylation changes with aging in mammals identified the rDNA gene
locus in which methylation levels increased age-dependently in both
spermatozoa and rat liver cells (47). If the rDNA locus is sensitive to
accumulating random methylation over time, the high methylation
levels found in breast cancer cell lines may be explained with
long-continued culturing, a common characteristic of cancer cell
lines.
We could not identify two populations of alleles
(one population with a hypermethylated promoter, the other
population with a hypomethylated promoter; Fig. 2) in breast cancer cell lines as
proposed earlier by other studies (22–25).
Considering the repetitive nature of rRNA genes, this result may be
due to the low number of clones (5 clones) analyzed for each cell
line. Breast cancer cell lines with hypermethylated 45S rDNA
promoters did not repress or alter the ratio of rRNA transcripts
(Fig. 4). rRNA expression levels
and proportions of rRNA transcripts were found to be independent of
the rDNA promoter methylation levels; this result may indicate that
the methylation of the 45S rDNA promoter may not be solely
responsible for rRNA expression or proportion changes in breast
cancer cell lines. Completely methylated (Xenopus leavis
sperm DNA) and unmethylated rDNA constructs were found to be
transcribed with equal efficiency when transfected to Xenopus
leavis oocytes (48). This is
consistent with our results in which expression of rRNA transcripts
was found to be relatively independent of their rDNA promoter
methylation levels.
Upon 5-AZA treatment of breast cancer cell lines,
expression of some forms of mature rRNA transcripts (significant
for 5.8S RNA and 45S ETS) unexpectedly decreased compared to the
DMSO-treated group when normalized with TBP (Fig. 5A), while rRNA proportions were not
significantly altered within the rRNA pool (Fig. 5B). A recent study demonstrated that
the loss of CpG methylation of the rDNA promoter (either with 5-AZA
treatment or DNMT knockout) regions caused cryptic transcription of
RNA polymerase II from 45S rDNA promoters. Cryptic transcription
from rDNA promoters by RNA polymerase II significantly correlates
with reduced modification and processing of rRNA transcripts
(25). Loss of CpG methylation at
rDNA promoter regions in 5-AZA-treated breast cancer cell lines may
be affected by this cryptic RNA polymerase II transcription, which
explains the downregulation of 5.8S and 45S ETS rRNA transcripts in
the 5-AZA-treated cell lines. This mechanism, which acts as a
negative feedback loop, may be a strategy developed by cells to
achieve a balanced expression of rRNA transcripts and prevent
energy loss in cells in the absence of CpG methylation.
Gene expression is usually regulated by a
combination of DNA methylation, histone modifications and the
activities of chromatin remodeling complexes (49). TSA treatment alone and 5-AZA+TSA
treatment did not result in a significant increase in rRNA levels
(Fig. 6A), yet the 5.8S rRNA ratio
was decreased in the 5-AZA+TSA treated group (Fig. 6B). rRNA transcription may
predominantly be regulated by other transcriptional or
post-transcriptional mechanisms rather than epigenetic regulatory
processes (at least DNA methylation and histone acetylation) in
breast cancer cell lines.
The discrepancy between rRNA expression levels (TBP
normalization) and rRNA ratios (GM-rRNAs) in the 5-AZA- and
5-AZA+TSA-treated groups, compared to their controls, may result
from expression changes of TBP upon drug treatment. The change may
also be due to some indirect effect of the drugs through other
genes as both drugs affect several other genes along with the rDNA
genes.
Further analysis of rDNA promoter methylation with
the Wilcoxon matched-pairs signed rank test in tissues showed that
most of the breast tumors (13/19) had significantly higher
methylation levels than their normal counterparts (Fig. 3A). Our findings indicated
similarities of methylation patterns within tumors and between
tumor and adjacent normal tissues, indicating tissue- and/or
locus-specificity of methylation. Methylation analysis of the same
region in different tissues and types of cancer may reveal whether
the methylation pattern of this region is tissue-specific,
cancer-specific or neither, since different tissues display
different methylation patterns at different loci (50).
Previous studies have identified rDNA methylation as
a prognostic factor in some cancer types (31,51)
including breast cancer (30).
However, the correlation analysis of methylation levels with
clinicopathological characteristics (as described in Table I) of the patients used in the
present study did not show any significance (data not shown).
Similarly, a breast carcinoma study on 45 paired breast tumor and
normal samples could not identify any significant associations
between methylation of rDNA promoters, 5′ regions of 18S and 28S
rDNA and ER, PR, grade and other clinicopathological features,
except nuclear size and grade (32). The use of larger sample sizes may
help clarify the clinical importance of rDNA methylation in breast
cancer. rRNA transcript expression (45S/TBP and 28S/GM-rRNA) in
tumors on the other hand showed a positive correlation with the
grade of the tumor. Nuclear pleomorphism is one of the criteria
used in the grading of breast cancer, which includes classification
of tumors by the size and the shape of the nucleoli (52). An increase in the expression or the
ratio of rRNA transcripts may be responsible for the abnormal
appearance of nucleoli in higher grade breast cancer samples.
Expression analyses of rRNA transcripts with TBP and
GM-rRNA normalizations revealed different sides of the same coin.
While the former enables measurement of expression with respect to
a stable mRNA pool, use of the latter reflects changes in the
relative ratios of rRNA transcript levels. Our data accordingly
revealed that 5.8S and 45S rRNA transcripts were downregulated in
the 5-AZA-treated cell lines with TBP normalization (Fig. 5A). However, 5-AZA treatment did not
affect rRNA ratios in the cell lines (Fig. 5B). Unlike the cell line results,
expression analysis of rRNA genes in the breast tumor and matched
normal tissues showed no significant difference when normalized
with TBP (Fig. 7A) while 18S and
5.8S rRNAs were proportionally altered in the breast tumor tissue
samples (Fig. 7B). As stated
earlier, the disparity between TBP and GM-rRNA normalizations could
be due to the fact that they analyze separate aspects of rRNA
expression.
A recent study with results supporting our findings
demonstrated that two rRNA forms (5.8S and 45S precursors) were
overexpressed (TBP normalization) in clinical prostate cancer
tissues compared to matched-benign tissues. However, methylation
levels of the 45S rDNA promoter in the same prostate tumor and
normal pairs were not significantly different (24). Another study showed that loss of CpG
methylation at the rDNA promoter surprisingly decrease rRNA
transcript levels by disrupting rRNA synthesis and processing via
activating cryptic transcription of rRNA genes by Pol II (25).
Different studies have used various reference genes,
TBP and ACTB being among the most common, to determine rRNA
expression levels in cancer (23,24,35).
We used TBP (a RNA polymerase II transcribed gene) to normalize
rRNA gene expression and found no significant differences between
the breast tumor and matched normal samples. ACTB also failed to
identify such differences in our cohort (data not shown). We
propose that the geometric mean (GM) of rRNAs synthesized by RNA
polymerase I (18S, 5.8S, 28S and 45S ETS) to normalize rRNA
expression can be used to detect relative changes in rRNAs with
each other. GM-rRNA may be less prone to changes than Pol II gene
transcripts since it is calculated from the rRNA transcripts
synthesized by Pol I. When GM-rRNA was used for normalization, 5.8S
and 18S rRNA expression levels were significantly upregulated and
downregulated, respectively, in the tumor samples compared to the
normal pairs (Fig. 7B). Our data
indicate that the proportion of 18S and 5.8S rRNA in the total rRNA
pool changed in the opposite direction while total rRNA levels may
be relatively constant. We found that methylation levels of normal
samples (which exhibit mixed methylation patterns) showed a
negative correlation with the 18S rRNA/GM-rRNA expression level but
this correlation was disrupted in the tumor samples (Fig. 8). As far as we are aware, this is
the first study to show that the methylation status may be
reflected in the expression of one or more rRNA transcripts but not
all.
Some forms of polycistronic mRNAs and miRNAs that
are expressed from the same promoter have been shown to be
post-transcriptionally regulated and exist at different levels in
plants (53,54). The SNRPN-SNURF gene, possessing a
biscistronic structure and sharing a common promoter, for example,
is differentially expressed, as identified by both northern blot
and microarray analysis in mammalian cells (55,56).
As reported in other studies, genes that are expressed from the
same promoter can be differentially expressed by other mechanisms
apart from the effect of basal transcription machinery.
The maturation of ribosomes is a complex process
assisted by multiple factors (~200) that need to be orchestrated in
harmony (57,58). Alteration in the methylation levels
of rDNA promoters may have an effect on rRNA stabilization, which
could leads to this non-proportional change in rRNA transcripts.
Moderate levels of rDNA promoter methylation (as observed in normal
samples) may still be regulating 18S rRNA levels but this
correlation is disrupted in tumor samples, possibly due to the high
methylation levels found in the 45S rDNA promoter. Another
possibility is that methylation levels can indirectly affect
splicing, post-transcriptional modifications and stabilization of
rRNA transcripts (25). The fact
that normal samples showed a higher correlation between rRNA
transcript expression while this correlation was disrupted in tumor
samples supported this possibility (Table III), indicating that the
methylated promoter of 45S rDNA in tumors may have an effect on the
processing of rRNAs.
Since rRNA processing and modification are largely
dependent on snoRNAs, any change in snoRNA levels globally may be
reflected in the rRNA ratios. U50 is a box C/D snoRNA that is
required for 2′-O-methylation of two specific positions in the 28S
rRNA and was shown to be altered by somatic rearrangements,
mutations and deletions in prostate cancer (59), breast carcinoma (60), B-cell lymphoma (61) and colon cancer (62). Another snoRNA, GAS5, was also found
to be downregulated in breast cancer (63). Increased methylation levels of rDNA
promoters and their effect on rRNA modification and processing need
to be better analyzed in future studies.
In conclusion, we found that rRNA transcripts were
expressed independently of the hypermethylated 45S rDNA promoter
region in breast cancer cell lines. However, the 18S rRNA/GM-rRNA
ratios were significantly correlated with methylation levels in the
normal samples but not in the tumor samples. Promoter methylation
of rDNA promoters appears to have a different role than regulating
the expression of rRNA transcripts in breast cancer. It may be used
as a mechanism to stabilize and protect these essential genes under
any circumstances. rDNA repeats have been proposed to be
responsible for genomic stability (64) and hypomethylation of rDNA promoter
has been implicated in decreased genomic stability (65,66).
Increased methylation of the rDNA promoter in tumor cells may be an
indicator of the tumor cell effort to restore impaired genomic
stability. Future research is needed to evaluate the cause of
relative expression changes observed among rRNA transcripts in
tumors and their relationship with rDNA promoter methylation.
Acknowledgments
The present study was supported by the Scientific
and Technical Research Council of Turkey (TUBITAK) (grant no.
TBAG-107T181). We thank Dr Daniel Press for the English editing of
the manuscript.
Abbreviations:
|
rRNA
|
ribosomal RNA
|
|
rDNA
|
ribosomal DNA
|
|
GM-rRNA
|
geometric mean of rRNA expression
values
|
|
5-AZA
|
5-aza-2′-deoxycytidine
|
|
TSA
|
trichostatin A
|
References
|
1
|
Ferlay J, Soerjomataram I, Ervik M,
Dikshit R, Eser S, Mathers C, Rebelo M, Parkin DM, Forman D and
Bray F: GLOBOCAN 2012 v1.0, Cancer Incidence and Mortality
Worldwide. (IARC CancerBase No. 11). http://globocan.iarc.fr.
2013
|
|
2
|
Lalloo F and Evans DG: Familial breast
cancer. Clin Genet. 82:105–114. 2012. View Article : Google Scholar : PubMed/NCBI
|
|
3
|
Jaenisch R and Bird A: Epigenetic
regulation of gene expression: How the genome integrates intrinsic
and environmental signals. Nat Genet. 33(Suppl): S245–S254. 2003.
View Article : Google Scholar
|
|
4
|
Salozhin SV, Prokhorchuk EB and Georgiev
GP: Methylation of DNA - one of the major epigenetic markers.
Biochemistry. 70:525–532. 2005.
|
|
5
|
Nafee TM, Farrell WE, Carroll WD, Fryer AA
and Ismail KM: Epigenetic control of fetal gene expression. BJOG.
115:158–168. 2008. View Article : Google Scholar
|
|
6
|
Esteller M: Aberrant DNA methylation as a
cancer-inducing mechanism. Annu Rev Pharmacol Toxicol. 45:629–656.
2005. View Article : Google Scholar : PubMed/NCBI
|
|
7
|
Karpinets TV and Foy BD: Tumorigenesis:
The adaptation of mammalian cells to sustained stress environment
by epigenetic alterations and succeeding matched mutations.
Carcinogenesis. 26:1323–1334. 2005. View Article : Google Scholar : PubMed/NCBI
|
|
8
|
Baylin SB and Ohm JE: Epigenetic gene
silencing in cancer - a mechanism for early oncogenic pathway
addiction? Nat Rev Cancer. 6:107–116. 2006. View Article : Google Scholar : PubMed/NCBI
|
|
9
|
Dez C and Tollervey D: Ribosome synthesis
meets the cell cycle. Curr Opin Microbiol. 7:631–637. 2004.
View Article : Google Scholar : PubMed/NCBI
|
|
10
|
McKnight SL and Miller OL Jr:
Ultrastructural patterns of RNA synthesis during early
embryogenesis of Drosophila melanogaster. Cell. 8:305–319. 1976.
View Article : Google Scholar : PubMed/NCBI
|
|
11
|
Schmickel RD: Quantitation of human
ribosomal DNA: Hybridization of human DNA with ribosomal RNA for
quantitation and fractionation. Pediatr Res. 7:5–12. 1973.
View Article : Google Scholar : PubMed/NCBI
|
|
12
|
Warner JR: The economics of ribosome
biosynthesis in yeast. Trends Biochem Sci. 24:437–440. 1999.
View Article : Google Scholar : PubMed/NCBI
|
|
13
|
Russell J and Zomerdijk JC:
RNA-polymerase-I-directed rDNA transcription, life and works.
Trends Biochem Sci. 30:87–96. 2005. View Article : Google Scholar : PubMed/NCBI
|
|
14
|
Paule MR and White RJ: Survey and summary:
Transcription by RNA polymerases I and III. Nucleic Acids Res.
28:1283–1298. 2000. View Article : Google Scholar : PubMed/NCBI
|
|
15
|
Learned RM, Learned TK, Haltiner MM and
Tjian RT: Human rRNA transcription is modulated by the coordinate
binding of two factors to an upstream control element. Cell.
45:847–857. 1986. View Article : Google Scholar : PubMed/NCBI
|
|
16
|
Clos J, Buttgereit D and Grummt I: A
purified transcription factor (TIF-IB) binds to essential sequences
of the mouse rDNA promoter. Proc Natl Acad Sci USA. 83:604–608.
1986. View Article : Google Scholar : PubMed/NCBI
|
|
17
|
Eichler DC and Craig N: Processing of
eukaryotic ribosomal RNA. Prog Nucleic Acid Res Mol Biol.
49:197–239. 1994. View Article : Google Scholar : PubMed/NCBI
|
|
18
|
Trapman J, Retèl J and Planta RJ:
Ribosomal precursor particles from yeast. Exp Cell Res. 90:95–104.
1975. View Article : Google Scholar : PubMed/NCBI
|
|
19
|
Venema J and Tollervey D: Ribosome
synthesis in Saccharomyces cerevisiae. Annu Rev Genet. 33:261–311.
1999. View Article : Google Scholar
|
|
20
|
Esteller M: Epigenetic gene silencing in
cancer: The DNA hypermethylome. Hum Mol Genet. 16:R50–R59. 2007.
View Article : Google Scholar : PubMed/NCBI
|
|
21
|
Worton RG, Sutherland J, Sylvester JE,
Willard HF, Bodrug S, Dubé I, Duff C, Kean V, Ray PN and Schmickel
RD: Human ribosomal RNA genes: Orientation of the tandem array and
conservation of the 5′ end. Science. 239:64–68. 1988. View Article : Google Scholar : PubMed/NCBI
|
|
22
|
Ghoshal K, Majumder S, Datta J, Motiwala
T, Bai S, Sharma SM, Frankel W and Jacob ST: Role of human
ribosomal RNA (rRNA) promoter methylation and of methyl-CpG-binding
protein MBD2 in the suppression of rRNA gene expression. J Biol
Chem. 279:6783–6793. 2004. View Article : Google Scholar
|
|
23
|
Raval A, Sridhar KJ, Patel S, Turnbull BB,
Greenberg PL and Mitchell BS: Reduced rRNA expression and increased
rDNA promoter methylation in CD34+ cells of patients
with myelodys-plastic syndromes. Blood. 120:4812–4818. 2012.
View Article : Google Scholar : PubMed/NCBI
|
|
24
|
Uemura M, Zheng Q, Koh CM, Nelson WG,
Yegnasubramanian S and De Marzo AM: Overexpression of ribosomal RNA
in prostate cancer is common but not linked to rDNA promoter
hypomethylation. Oncogene. 31:1254–1263. 2012. View Article : Google Scholar :
|
|
25
|
Gagnon-Kugler T, Langlois F, Stefanovsky
V, Lessard F and Moss T: Loss of human ribosomal gene CpG
methylation enhances cryptic RNA polymerase II transcription and
disrupts ribosomal RNA processing. Mol Cell. 35:414–425. 2009.
View Article : Google Scholar : PubMed/NCBI
|
|
26
|
Gur-Dedeoglu B, Konu O, Bozkurt B, Ergul
G, Seckin S and Yulug IG: Identification of endogenous reference
genes for qRT-PCR analysis in normal matched breast tumor tissues.
Oncol Res. 17:353–365. 2009. View Article : Google Scholar : PubMed/NCBI
|
|
27
|
Tricarico C, Pinzani P, Bianchi S,
Paglierani M, Distante V, Pazzagli M, Bustin SA and Orlando C:
Quantitative real-time reverse transcription polymerase chain
reaction: Normalization to rRNA or single housekeeping genes is
inappropriate for human tissue biopsies. Anal Biochem. 309:293–300.
2002. View Article : Google Scholar : PubMed/NCBI
|
|
28
|
de Kok JB, Roelofs RW, Giesendorf BA,
Pennings JL, Waas ET, Feuth T, Swinkels DW and Span PN:
Normalization of gene expression measurements in tumor tissues:
Comparison of 13 endogenous control genes. Lab Invest. 85:154–159.
2005. View Article : Google Scholar
|
|
29
|
Chan MW, Wei SH, Wen P, Wang Z, Matei DE,
Liu JC, Liyanarachchi S, Brown R, Nephew KP, Yan PS, et al:
Hypermethylation of 18S and 28S ribosomal DNAs predicts
progression-free survival in patients with ovarian cancer. Clin
Cancer Res. 11:7376–7383. 2005. View Article : Google Scholar : PubMed/NCBI
|
|
30
|
Yan PS, Rodriguez FJ, Laux DE, Perry MR,
Standiford SB and Huang TH: Hypermethylation of ribosomal DNA in
human breast carcinoma. Br J Cancer. 82:514–517. 2000. View Article : Google Scholar : PubMed/NCBI
|
|
31
|
Powell MA, Mutch DG, Rader JS, Herzog TJ,
Huang TH and Goodfellow PJ: Ribosomal DNA methylation in patients
with endometrial carcinoma: An independent prognostic marker.
Cancer. 94:2941–2952. 2002. View Article : Google Scholar : PubMed/NCBI
|
|
32
|
Bacalini MG, Pacilli A, Giuliani C, Penzo
M, Treré D, Pirazzini C, Salvioli S, Franceschi C, Montanaro L and
Garagnani P: The nucleolar size is associated to the methylation
status of ribosomal DNA in breast carcinomas. BMC Cancer.
14:3612014. View Article : Google Scholar : PubMed/NCBI
|
|
33
|
Kumaki Y, Oda M and Okano M: QUMA:
Quantification tool for methylation analysis. Nucleic Acids Res.
36:W170–W175. 2008. View Article : Google Scholar : PubMed/NCBI
|
|
34
|
Haltiner MM, Smale ST and Tjian R: Two
distinct promoter elements in the human rRNA gene identified by
linker scanning mutagenesis. Mol Cell Biol. 6:227–235.
1986.PubMed/NCBI
|
|
35
|
Brown SE and Szyf M: Dynamic epigenetic
states of ribosomal RNA promoters during the cell cycle. Cell
Cycle. 7:382–390. 2008. View Article : Google Scholar : PubMed/NCBI
|
|
36
|
Guo C, Liu S, Wang J, Sun MZ and Greenaway
FT: ACTB in cancer. Clin Chim Acta. 417:39–44. 2013. View Article : Google Scholar
|
|
37
|
Guo C, Liu S and Sun MZ: Novel insight
into the role of GAPDH playing in tumor. Clin Transl Oncol.
15:167–172. 2013. View Article : Google Scholar
|
|
38
|
Esteller M, Corn PG, Baylin SB and Herman
JG: A gene hyper-methylation profile of human cancer. Cancer Res.
61:3225–3229. 2001.PubMed/NCBI
|
|
39
|
Ballestar E and Esteller M: Epigenetic
gene regulation in cancer. Adv Genet. 61:247–267. 2008. View Article : Google Scholar : PubMed/NCBI
|
|
40
|
Eden S and Cedar H: Role of DNA
methylation in the regulation of transcription. Curr Opin Genet
Dev. 4:255–259. 1994. View Article : Google Scholar : PubMed/NCBI
|
|
41
|
Sentenac A: Eukaryotic RNA polymerases.
CRC Crit Rev Biochem. 18:31–90. 1985. View Article : Google Scholar : PubMed/NCBI
|
|
42
|
Sharp PA: TATA-binding protein is a
classless factor. Cell. 68:819–821. 1992. View Article : Google Scholar : PubMed/NCBI
|
|
43
|
Comai L, Tanese N and Tjian R: The
TATA-binding protein and associated factors are integral components
of the RNA polymerase I transcription factor, SL1. Cell.
68:965–976. 1992. View Article : Google Scholar : PubMed/NCBI
|
|
44
|
Kochanek S, Hosokawa K, Schiedner G, Renz
D and Doerfler W: DNA methylation in the promoter of ribosomal RNA
genes in human cells as determined by genomic sequencing. FEBS
Lett. 388:192–194. 1996. View Article : Google Scholar : PubMed/NCBI
|
|
45
|
Németh A, Guibert S, Tiwari VK, Ohlsson R
and Längst G: Epigenetic regulation of TTF-I-mediated
promoter-terminator interactions of rRNA genes. EMBO J.
27:1255–1265. 2008. View Article : Google Scholar : PubMed/NCBI
|
|
46
|
Brown SE and Szyf M: Epigenetic
programming of the rRNA promoter by MBD3. Mol Cell Biol.
27:4938–4952. 2007. View Article : Google Scholar : PubMed/NCBI
|
|
47
|
Oakes CC, Smiraglia DJ, Plass C, Trasler
JM and Robaire B: Aging results in hypermethylation of ribosomal
DNA in sperm and liver of male rats. Proc Natl Acad Sci USA.
100:1775–1780. 2003. View Article : Google Scholar : PubMed/NCBI
|
|
48
|
Macleod D and Bird A: Transcription in
oocytes of highly methylated rDNA from Xenopus laevis sperm.
Nature. 306:200–203. 1983. View Article : Google Scholar : PubMed/NCBI
|
|
49
|
Richards EJ and Elgin SC: Epigenetic codes
for heterochro-matin formation and silencing: Rounding up the usual
suspects. Cell. 108:489–500. 2002. View Article : Google Scholar : PubMed/NCBI
|
|
50
|
Muangsub T, Samsuwan J, Tongyoo P,
Kitkumthorn N and Mutirangura A: Analysis of methylation microarray
for tissue specific detection. Gene. 553:31–41. 2014. View Article : Google Scholar : PubMed/NCBI
|
|
51
|
Chan MW, Wei SH, Wen P, Wang Z, Matei DE,
Liu JC, Liyanarachchi S, Brown R, Nephew KP, Yan PS, et al:
Hypermethylation of 18S and 28S ribosomal DNAs predicts
progression-free survival in patients with ovarian cancer. Clin
Cancer Res. 11:7376–7383. 2005. View Article : Google Scholar : PubMed/NCBI
|
|
52
|
Egner JR: AJCC Cancer Staging Manual. JAMA
J Am Med Assoc. 304:17262010. View Article : Google Scholar
|
|
53
|
Jia F and Rock CD: MIR846 and MIR842
comprise a cistronic MIRNA pair that is regulated by abscisic acid
by alternative splicing in roots of Arabidopsis. Plant Mol Biol.
81:447–460. 2013. View Article : Google Scholar : PubMed/NCBI
|
|
54
|
Malik Ghulam M, Courtois F, Lerbs-Mache S
and Merendino L: Complex processing patterns of mRNAs of the large
ATP synthase operon in Arabidopsis chloroplasts. PLoS One.
8:e782652013. View Article : Google Scholar : PubMed/NCBI
|
|
55
|
Li SS, Yu SL and Singh S: Epigenetic
states and expression of imprinted genes in human embryonic stem
cells. World J Stem Cells. 2:97–102. 2010. View Article : Google Scholar
|
|
56
|
Gray TA, Saitoh S and Nicholls RD: An
imprinted, mammalian bicistronic transcript encodes two independent
proteins. Proc Natl Acad Sci USA. 96:5616–5621. 1999. View Article : Google Scholar : PubMed/NCBI
|
|
57
|
Kiss T, Fayet E, Jády BE, Richard P and
Weber M: Biogenesis and intranuclear trafficking of human box C/D
and H/ACA RNPs. Cold Spring Harb Symp Quant Biol. 71:407–417. 2006.
View Article : Google Scholar
|
|
58
|
Terns M and Terns R: Noncoding RNAs of the
H/ACA family. Cold Spring Harb Symp Quant Biol. 71:395–405. 2006.
View Article : Google Scholar
|
|
59
|
Dong XY, Rodriguez C, Guo P, Sun X, Talbot
JT, Zhou W, Petros J, Li Q, Vessella RL, Kibel AS, et al: SnoRNA
U50 is a candidate tumor-suppressor gene at 6q14.3 with a mutation
associated with clinically significant prostate cancer. Hum Mol
Genet. 17:1031–1042. 2008. View Article : Google Scholar : PubMed/NCBI
|
|
60
|
Dong XY, Guo P, Boyd J, Sun X, Li Q, Zhou
W and Dong JT: Implication of snoRNA U50 in human breast cancer. J
Genet Genomics. 36:447–454. 2009. View Article : Google Scholar : PubMed/NCBI
|
|
61
|
Tanaka R, Satoh H, Moriyama M, Satoh K,
Morishita Y, Yoshida S, Watanabe T, Nakamura Y and Mori S: Intronic
U50 small-nucleolar-RNA (snoRNA) host gene of no protein-coding
potential is mapped at the chromosome breakpoint t(3;6) (q27;q15)
of human B-cell lymphoma. Genes Cells. 5:277–287. 2000. View Article : Google Scholar : PubMed/NCBI
|
|
62
|
Pacilli A, Ceccarelli C, Treré D and
Montanaro L: SnoRNA U50 levels are regulated by cell proliferation
and rRNA transcription. Int J Mol Sci. 14:14923–14935. 2013.
View Article : Google Scholar : PubMed/NCBI
|
|
63
|
Mourtada-Maarabouni M, Pickard MR, Hedge
VL, Farzaneh F and Williams GT: GAS5, a non-protein-coding RNA,
controls apoptosis and is downregulated in breast cancer. Oncogene.
28:195–208. 2009. View Article : Google Scholar
|
|
64
|
Kobayashi T: Ribosomal RNA gene repeats,
their stability and cellular senescence. Proc Jpn Acad Ser B Phys
Biol Sci. 90:119–129. 2014. View Article : Google Scholar : PubMed/NCBI
|
|
65
|
Peng JC and Karpen GH: H3K9 methylation
and RNA interference regulate nucleolar organization and repeated
DNA stability. Nat Cell Biol. 9:25–35. 2007. View Article : Google Scholar
|
|
66
|
Kobayashi T: A new role of the rDNA and
nucleolus in the nucleus - rDNA instability maintains genome
integrity. Bioessays. 30:267–272. 2008. View Article : Google Scholar : PubMed/NCBI
|