Introduction
Small bowel adenocarcinoma (SBA) is a rare
malignancy, accounting for <5% of all gastrointestinal cancers,
and is associated with a poor prognosis (1). Standard chemotherapeutic regimens for
SBA have not been established due to the lack of prospective
randomized studies. Fluoropyrimidines, including 5-fluorouracil
(5-FU) and capecitabine, have been the most commonly studied
cytotoxic chemotherapeutic agents for advanced SBA.
Fluoropyrimidines in combination with oxaliplatin, irinotecan, or
doxorubicin/mitomycin have shown clinical benefits in small phase
II studies (2–5). In addition, several retrospective
studies have revealed that pretreatment performance status
(6–8), primary tumor site (7), and serum carcinoembryonic antigen
(CEA) level (6,7) might have a prognostic role in patients
receiving fluoropyrimidine-based chemotherapy. However, molecular
markers reflective of tumor biology and predictive of
chemotherapeutic sensitivity/resistance in patients with advanced
SBA are lacking. Such molecular markers predicting treatment
response will help physicians to select treatment strategies for
this rare disease.
The antitumor effect of fluoropyrimidines has been
associated with competitive inhibition of thymidylate synthase (TS)
(9,10). Preclinical studies have shown that
increased TS expression is associated with resistance to 5-FU in
cancer cell lines (11,12). Subsequent clinical studies have
demonstrated that TS expression may play an important role in
determining tumor sensitivity to fluoropyrimidines (13–15).
Therefore, the TS tissue level may modulate the efficacy of
fluoropyrimidine therapy against tumor cells. Polymorphisms within
the 5′-untranslated region (UTR) of the TS gene have been
shown to be important in controlling TS expression. Polymorphisms
in the 5′-UTR regulate TS transcription and have been
suggested to be potential predictors of response to 5-FU
chemotherapy (16–18). Two main polymorphisms in the 5′-UTR
that modulate TS transcription have been described: the
tandem repeat (TR) polymorphism and G>C single-nucleotide
polymorphism (SNP). The TR polymorphism comprises double (2R) or
triple (3R) repeats of a 28-base pair (bp) sequence in the 5′-UTR
(16,17). This polymorphism is associated with
TS gene transcription efficiency, which is lower with the
double repeat than with the triple repeat (16). The G>C SNP in the second repeat
of the 3R alleles is associated with decreased transcriptional
activity of the 3R alleles (18).
Consequently, the transcriptional efficiency of 3R alleles with the
G>C substitution (3RC) is similar to that of 2R alleles.
Recently, several studies have demonstrated that TS SNP
status might be associated with clinical outcomes in colorectal
cancer (CRC) patients receiving 5-FU-based chemotherapy or
preoperative chemoradiotherapy (19–22).
However, the prognostic and predictive relevance of TS gene
polymorphisms in SBA have not yet been investigated. Thus, in the
present study, we aimed to evaluate the prognostic implications of
polymorphisms in the 5′-UTR of the TS gene on treatment
outcomes in patients with locally advanced/metastatic SBA receiving
fluoropyrimidine-based chemotherapy.
Materials and methods
Study design and patient population
We performed a multicenter, retrospective cohort
study of patients with pathologically confirmed locally advanced
(unresectable or incompletely resected) or metastatic SBA who
received ≥1 cycle of first-line fluoropyrimidine-based chemotherapy
at 10 medical centers in Korea between Jan 2003 and Dec 2012.
Patients with localized or completely resected disease and those
who received front-line treatment with
non-fluoropyrimidine-containing chemotherapy were excluded.
Patients with cancer of the ampullar of Vater or periampullary
cancer were also excluded. Prior history of chemotherapy for
metastatic disease was not allowed, but previous use of
fluoropyrimidines was permitted if fluoropyrimidines were used as
adjuvant therapy and the interval between completion of adjuvant
therapy and recurrence of disease was more than 6 months. Data were
collected using study-specific case record forms from participating
institutions. Collected data included patient demographics, tumor
characteristics, first-line chemotherapy regimens and dose
intensities, response to first-line therapy, progression-free
survival (PFS) and overall survival (OS). The study protocol was
reviewed and approved by the institutional review board at each
participating institution, and the study was conducted in
accordance with the recommendations of the Declaration of Helsinki
for biomedical research involving human subjects.
Treatment and outcome measurement
First-line chemotherapy consisted of the following 4
regimens: the cisplatin and fluoropyrimidines (FP) regimen,
cisplatin (75 mg/m2) day 1 plus infusional 5-FU (1,000
mg/m2) for 4 consecutive days or oral capecitabine
(1,000 mg/m2 twice a day) for 14 consecutive days every
3 weeks; the FOLFOX regimen, 2-h infusion of oxaliplatin (85 or 100
mg/m2) on day 1 plus folinic acid (200 mg/m2)
and bolus 5-FU (400 mg/m2) followed by a 46-h infusion
of 5-FU (2,400 mg/m2) every 2 weeks; the FOLFIRI
regimen, 90-min infusion of irinotecan (180 mg/m2) on
day 1 plus folinic acid (200 mg/m2) and bolus 5-FU (400
mg/m2) followed by a 46-h infusion of 5-FU (2,400
mg/m2) every 2 weeks; fluoropyrimidine alone, protracted
venous infusion of 5-FU using a portable pump at a dose of 300
mg/m2/day or oral capecitabine 1,250 mg/m2
twice daily on day 1 through 14 every 3 weeks. The treatment
regimen was selected at the discretion of the treating physician.
First-line chemotherapy was discontinued in patients who progressed
during treatment or experienced unacceptable toxicities. Management
of adverse events and subsequent dose reduction of chemotherapeutic
agents was performed at the discretion of the physician based on
hematologic or non-hematologic adverse events. Tumor responses were
assessed in patients with measurable lesions using
contrast-enhanced computed tomography (CT) every three or four
cycles or earlier when signs of progression were evident. Objective
tumor response was evaluated using the Response Evaluation Criteria
in Solid Tumors (RECIST) criteria (23). PFS and OS were calculated from the
day of diagnosis until progression, death or last follow-up as
appropriate.
Immunohistochemistry (IHC) for TS
TS expression was analyzed in 3-µm-thick
sections from pretreatment formalin-fixed paraffin-embedded (FFPE)
tissues. Sections were deparaffinized and subjected to heat-induced
antigen retrieval by microwaving in Tris-EDTA buffer (EnVision FLEX
High pH; Dako, Glostrup, Denmark) for 15 min. Tissue sections were
incubated with 3% hydrogen peroxide for 10 min to inhibit
endogenous peroxidase activity. After washing in Tris-buffered
saline, tissue sections were incubated with monoclonal anti-TS
(TS-106; Dako) for 90 min at room temperature. TS
immunohistochemical staining was detected using the Dako REAL
EnVision Detection System. After washing, the sections were
incubated with the Envision kit for 30 min at room temperature and
3,3′-diaminobenzidine was applied as the chromogen. After washing,
the tissue sections were counterstained with Mayer’s hematoxylin.
To ensure consistent staining, a positive control (an
adenocarcinoma sample with well-characterized staining) and
negative control (no primary antibody) were included in each
staining run. Adjacent lymphocytes within each section were
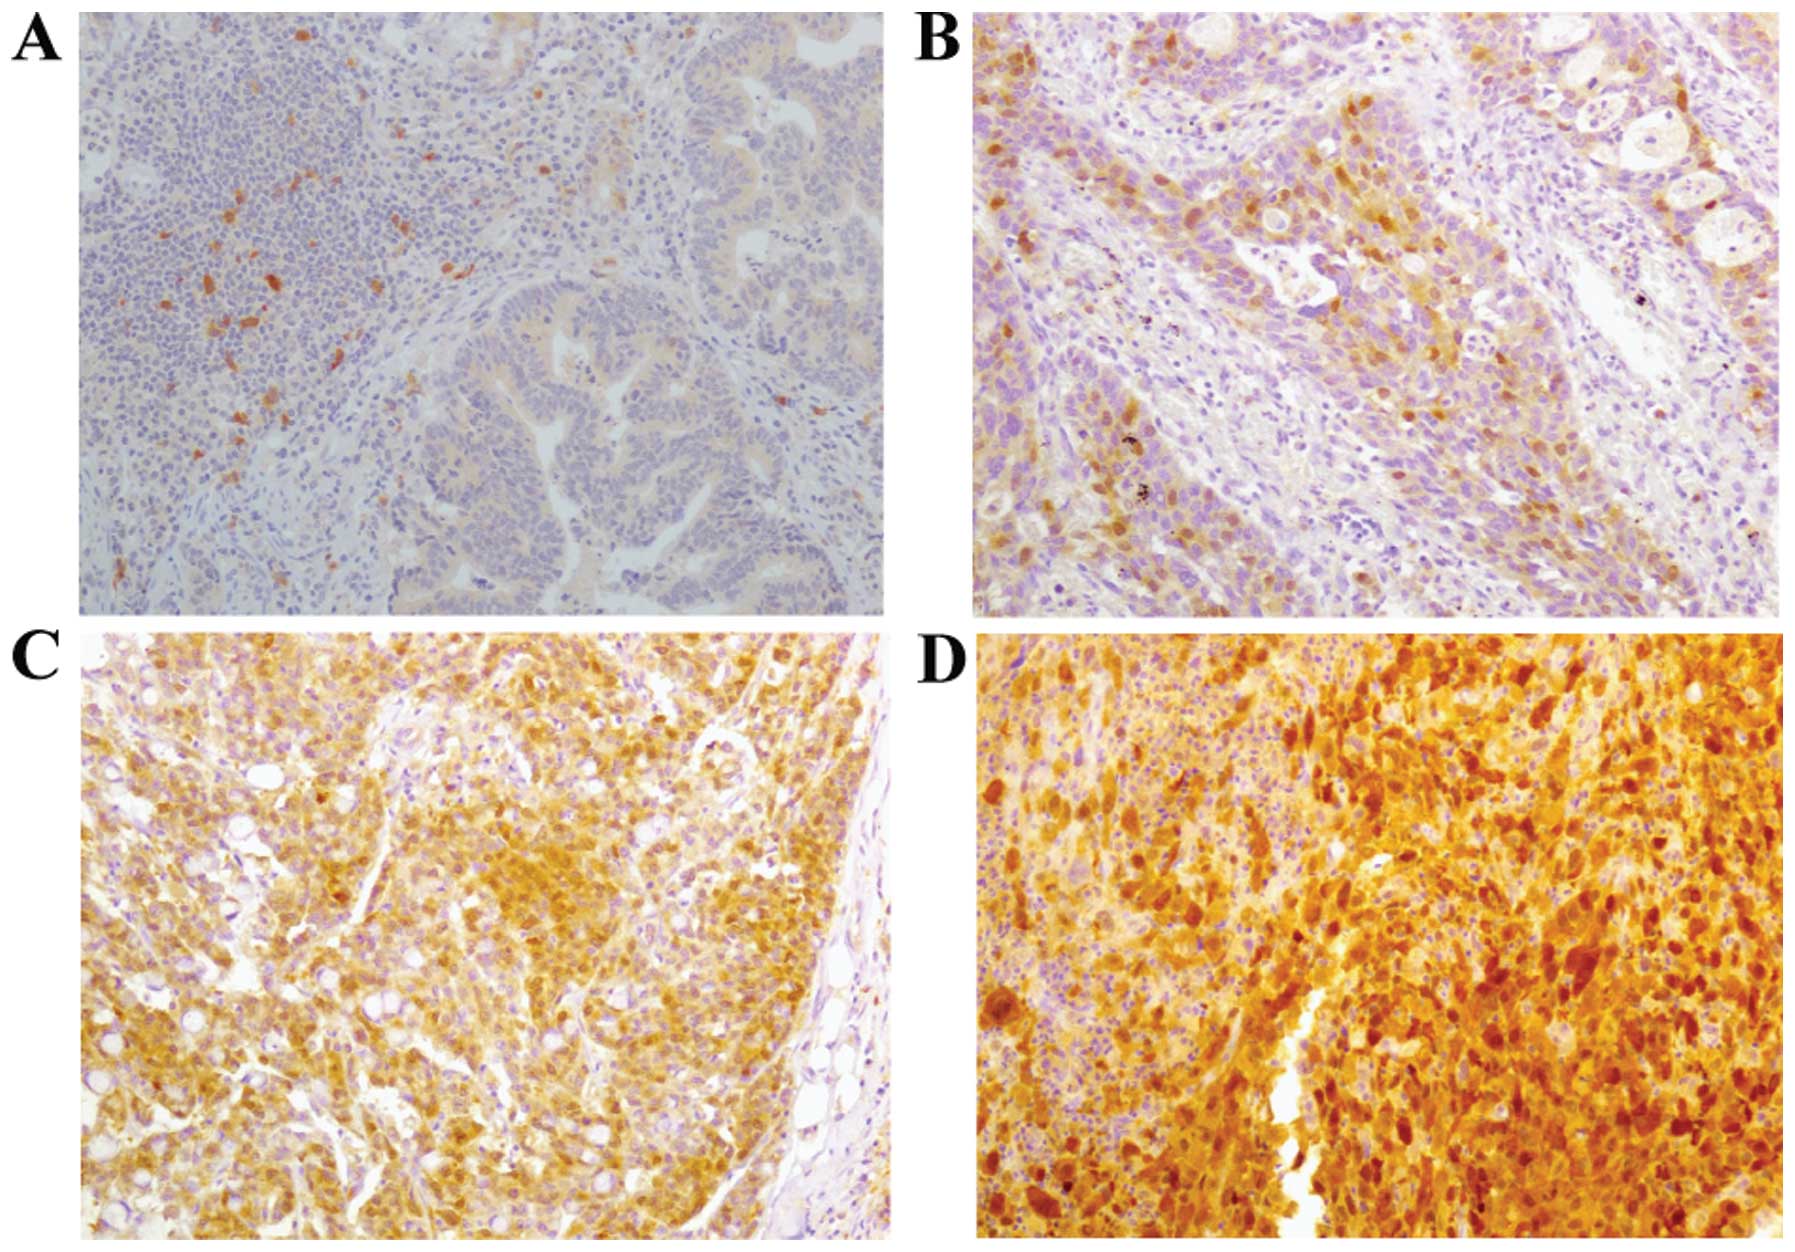
identified as internal references. Immunohistochemical staining was
evaluated by a single pathologist blinded to the clinical
parameters. The intensity of TS cytoplasmic staining was graded on
a 4-point scale (0, 1+, 2+ and 3+), and a grade of ≥2+ was
considered as positive (Fig.
1).
TS TR polymorphism and G>C SNP
analysis DNA extraction
Genomic DNA was prepared from FFPE tissue samples
using the QIAamp DNA FFPE Tissue kit (Qiagen, Hilden, Germany)
according to the manufacturer’s protocol. Briefly, the specimen was
cut to 20-µm tissue sections using a microcutter, and three
subsequent sections were transferred to microcentrifuge tubes.
Then, PBS was added to each 20-µm tissue section and heated
for 10 min at 75°C. After centrifuging at 13,000 rpm, the
supernatant was carefully discarded and fresh PBS was added. Tissue
samples were then incubated with lysis buffer and proteinase K for
30 min at 56°C. Subsequently, the mixture was applied to the spin
column and centrifuged into a collection tube according to the
manufacturer’s protocol. The purified DNA was used for subsequent
analyses.
TS genotyping
TS TR polymorphism and G>C SNP were
identified by capillary electrophoresis and direct sequencing of
genomic DNA, respectively. For the TS TR assay, DNA was
amplified by polymerase chain reaction (PCR) using the HotStarTaq
Master Mix kit (Qiagen) with the primer pair
5′-FAM-GTGGCTCCTGCGTTTCCCCC-3′ (forward) and
5′-GAGCCGGCCACAGGCATG-3′ (reverse). Reactions were set up in a
final volume of 25 µl with 50 ng of DNA and primers and
performed in the 2720 Thermal Cycler (Applied Biosystems, Foster
City, CA, USA). The PCR conditions were as follows: initial
denaturation at 94°C for 15 min, followed by 35 cycles of
denaturation at 95°C for 30 sec, primer annealing at 60°C for 30
sec, and extension at 72°C for 1 min and final extension at 72°C
for 5 min. The PCR product (1 µl) was added to a mixture of
diformamide and GeneScan -500 LIZ Size Standard (Applied
Biosystems), denatured at 95°C for 2 min, and analyzed using the
ABI 3130xl Genetic Analyzer (Applied Biosystems). A peak at 210
base (2R/2R), 238 base (3R/3R), or both of these peaks (2R/3R) were
obtained depending on the TS TR status.
Next, to reveal the TS SNP status in the
samples containing 3R in the TS TR assay, direct sequencing
was performed. PCR for genomic DNA amplification was performed as
described for the TS TR assay using the following primer
pair: 5′-GT GGCTCCTGCGTTTCCCCC-3′ (forward) and 5′-GCTCCG
AGCCGGCCACAGGCATGGCGCGG-3′ (reverse). Purified PCR products were
obtained using an Exonuclease I and Shrimp Alkaline Phosphatase
mixture (Fermentas, Vilnius, Lithuania) and subsequently sequenced
using the ABI PRISM BigDye Terminator version 3.1 kit (Applied
Biosystems). Forward and reverse sequences were analyzed separately
under the same conditions with the same primers used in the PCR
reaction. Cycle sequencing was performed for 25 cycles of 96°C for
30 sec, 50°C for 15 sec, and 60°C for 4 min. Sequencing analysis
was performed using the ABI 3130XL Genetic Analyzer (Applied
Biosystems).
Based on the TS TR and SNP status, TS
genotypes were classified as high TS expression genotypes (2R/3RG,
3RC/3RG and 3RG/3RG) or low TS expression genotypes (2R/2R, 2R/3RC
and 3RC/3RC).
Statistical analysis
PFS and OS were calculated using the Kaplan-Meier
method and compared using the log-rank test. Clinical variables,
such as age, gender, disease status, Eastern Cooperative Oncology
Group (ECOG) performance status, location of the primary tumor,
histologic grade, pretreatment CEA and systemic chemotherapy were
included for analysis. Descriptive statistics were summarized as
frequencies and percentages for categorical variables and as median
and range for continuous variables. Comparison of clinical
variables according to TS genotypes and comparisons between
TS immunohistochemical staining intensity and TS
polymorphisms (TR, SNP) and tumor response were made using
χ2 test or Fisher’s exact test. Multivariate analysis
was carried out using the Cox proportional hazards models.
Variables with P<0.05 in the univariate analysis were included
in the multivariate model using a forward conditional method, and
hazard ratio (HR) and 95% confidence interval (CI) were calculated.
A two-tailed P-value of <0.05 was considered statistically
significant. All data analyses were carried out using SPSS software
(SPSS, Inc., Chicago, IL, USA).
Results
Patient cohort
We identified 64 patients at 10 Korean institutions
who were diagnosed with locally advanced/metastatic SBA and treated
with first-line fluoropyrimidine-based regimens between 2003 and
2012. Of the 64 patients, four patients were not included because
they were initially treated with fluoropyrimidines as a
radiosensitizer during concurrent chemoradiotherapy. Two patients
were excluded, because they did not complete their first cycle of
capecitabine monotherapy owing to non-hematologic toxicity. Thus,
58 patients were included in this analysis.
Patient characteristics
The demographic and clinical characteristics of the
patients are listed in Table I. Of
the 58 patients, 39 (67%) were male and 19 (33%) were female, with
a median age of 61 years (range, 32–83 years). The most common
primary tumor location was the duodenum (50/58, 86%). Metastatic
disease was present in 43 patients (74%), and the ECOG performance
status was 0 or 1 in 42 patients (72%). The median CEA level was
2.2 ng/ml (range, 0.5–100.0 ng/ml). Twelve patients (21%) had a
history of prior fluoropyrimidine adjuvant therapy. Thirty-one
patients (53%) received the FP regimen, 11 patients (19%) received
the FOLFOX regimen, 10 patients (17%) received fluoropyrimidine
alone, and 6 patients (10%) received the FOLFIRI regimen as
first-line chemotherapy.
 | Table IPatient and tumor characteristics
according to TS SNP status. |
Table I
Patient and tumor characteristics
according to TS SNP status.
| Total (n=58) | N=30a
|
|---|
| Low TS expression
genotypes (n=8) | High TS expression
genotypes (n=22) | P-value |
|---|
| Gender |
| Male | 39 (67) | 5 (62.5) | 12 (54.5) | 1.0 |
| Female | 19 (33) | 3 (37.5) | 10 (45.5) | |
| Age, years |
| Median | 61 | 62 | 63.5 | 0.906 |
| Range | 32–83 | 55–72 | 32–76 | |
| F/U duration
(months) |
| Median | 48.8 | 38.2 | 48.5 | 0.888 |
| Range | 3.3–121.9 | 16.8–113.3 | 3.3–121.9 | |
| ECOG performance
status |
| 0–1 | 42 (72) | 7 (87.5) | 16 (72.7) | 0.638 |
| 2–3 | 16 (28) | 1 (12.5) | 6 (27.3) | |
| Disease status |
| Metastatic | 43 (74) | 7 (87.5) | 16 (72.7) | 0.638 |
| Locally
advanced | 15 (26) | 1 (12.5) | 6 (27.3) | |
| Tumor location |
| Duodenum | 50 (86) | 8 (100) | 18 (81.8) | 0.550 |
| Jejunum/ileum | 8 (14) | 0 (0) | 4 (18.2) | |
| Pathologic
differentiation |
| Well | 9 (16) | 3 (37.5) | 4 (18.2) | 0.352 |
| Moderate | 23 (40) | 2 (25.0) | 7 (31.8) | |
| Poor | 16 (28) | 1 (12.5) | 9 (40.9) | |
| Unknown | 10 (17) | 1 (12.5) | 2 (9.1) | |
| Pretreatment CEA
level (ng/ml) |
| Median | 2.2 | 1.8 | 2.5 | 0.489 |
| Range | 0.5–100.0 | 1.2–14.8 | 0.5–100.0 | |
| Prior
fluoropyrimidine use |
| No | 46 (79) | 7 (87.5) | 17 (77.3) | 1.0 |
| Yes | 12 (21) | 1 (12.5) | 5 (22.7) | |
| First-line
chemotherapy |
| Cisplatin +
fluoropyrimidine | 31 (53) | 6 (75.0) | 14 (63.6) | 0.837 |
| Oxaliplatin +
fluoropyrimidine | 11 (19) | 1 (12.5) | 5 (22.7) | |
| Irinotecan +
fluoropyrimidine | 6 (10) | 0 (0) | 1 (4.5) | |
| Fluoropyrimidine
alone | 10 (17) | 1 (12.5) | 2 (9.1) | |
| No. of chemotherapy
cycles |
| Median | 4 | 9 | 3.5 | 0.003 |
| Range | 1–50 | 3–50 | 1–10 | |
Association between immunohistochemical
expression of TS and TS genotype
TS IHC and genotyping were successfully performed in
30 cases (52%); the remaining 28 cases lacked sufficient tissue
samples for analysis. TS immunohistochemical staining exhibited a
predominantly diffuse pattern throughout the nucleus and cytoplasm
of the tumor cells. TS immunohistochemical staining intensity was
follows: 0 in 8 cases (27%), 1+ in 8 cases (27%), 2+ in 11 cases
(37%), and 3+ in 3 (8%). Among these cases, 14 (47%) were
considered positive for TS expression (≥2+). The TS TR
status was 2R/2R in 3 patients (10%), 2R/3R in 10 patients (33%),
and 3R/3R in 17 patients (57%). The SNP status was 2R/3RC in 2
patients (7%), 2R/3RG in 8 patients (27%), 3RC/3RC in 3 patients
(10%), 3RC/3RG in 6 patients (20%), and 3RG/3RG in 8 patients
(27%). Based on the TS SNP status in the TR sequence, 22
patients (73%) had high TS expression genotypes (2R/3RG, 3RC/3RG,
3RG/3RG) and the remaining 8 patients had low TS expression
genotypes (2R/2R, 2R/3RC, 3RC/3RC; Table II).
| Table IITS protein expression according to
TS TR and SNP status. |
Table II
TS protein expression according to
TS TR and SNP status.
| TS protein
expressiona | TS TR status
| P-value |
|---|
| 2R/2R, 2R/3R | 3R/3R | Total |
|---|
| Negative | 9 (69) | 7 (41) | 16 (9) | 0.127 |
| Positive | 4 (31) | 10 (59) | 14 (10) | |
| TS protein
expressiona | TS SNP
status
| P-value |
|---|
Low-expression
genotypes
| High-expression
genotypes
|
|---|
| 2R/2R | 2R/3RC | 3RC/3RC | Total | 2R/3RG | 3RC/3RG | 3RG/3RG | Total |
|---|
| Negative | 2 (67) | 2 (100) | 3 (100) | 7 (88) | 5 (63) | 2 (33) | 2 (25) | 9 (41) | 0.039 |
| Positive | 1 (33) | 0 (0) | 0 (0) | 1 (13) | 3 (38) | 4 (67) | 6 (75) | 13 (59) | |
The prevalence of positive TS immunohistochemical
expression was not significantly different between patients with
the 3R/3R genotype and those with the 2R/2R and 2R/3R genotypes
[59% (10/17) vs. 31% (4/13); P=0.127; Table II]. In contrast, the prevalence of
positive TS immunohistochemical expression was significantly higher
in patients with high TS expression genotypes than in those with
low TS expression genotypes (59 vs. 13%; P=0.039; Table II).
Correlations of TS protein expression and
genotype with treatment response, PFS and OS
Tumor response was evaluable in 29 (97%) of the 30
patients in whom TS immunohistochemical expression and genotype
data were available. One patient did not have any evaluable lesions
at baseline. Among the evaluable patients, 10 patients (1 complete
response and 9 partial response) responded to treatments, resulting
in an overall response rate (ORR) of 35%. The ORR was not
significantly different according to TS protein expression and TR
polymorphism status (Table III).
However, the ORR was significantly higher in patients with low TS
expression genotypes than in those with high TS expression
genotypes (71 vs. 23%; P=0.030; Table
III).
| Table IIITreatment response according to TS
protein expression and TS TR and SNP status. |
Table III
Treatment response according to TS
protein expression and TS TR and SNP status.
| Treatment
response | Total | TS protein
expression
| TS TR status
| TS SNP
status
|
|---|
| Negative | Positive | P-value | 2R/2R, 2R/3R | 3R/3R | P-value | Low-expression
genotypes | High-expression
genotypes | P-value |
|---|
| CR/PR | 10 (35) | 7 (47) | 3 (21) | 0.245 | 5 (42) | 5 (29) | 0.694 | 5 (71) | 5 (23) | 0.030 |
| SD/PD | 19 (66) | 8 (53) | 11 (79) | | 7 (58) | 12 (71) | | 2 (79) | 17 (77) | |
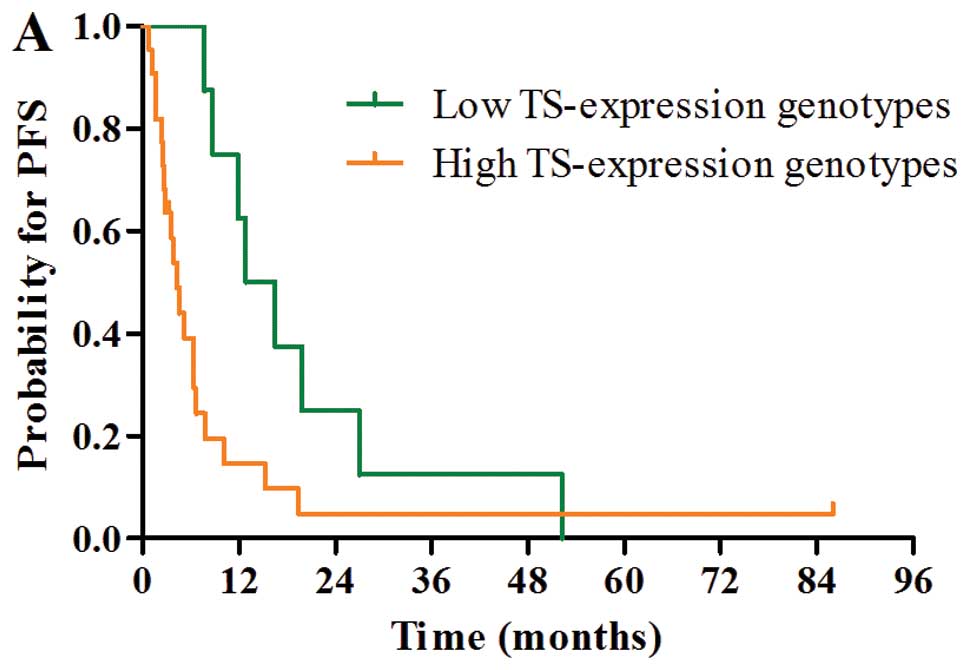
With a median follow-up duration of 48.8 months
(range, 3.3–121.9 months), median PFS and OS were 6.0 months (95%
CI, 4.5–7.5) and 11.3 months (95% CI, 8.1–14.5), respectively.
Median PFS and OS were 12.8 months (95% CI, 6.4–19.2) and 28.8
months (95% CI, 19.2–38.4) in patients with low TS expression
genotypes and 4.3 months (95% CI, 2.9–5.7) and 8.9 months (95% CI,
5.5–12.3) in patients with high TS expression genotypes,
respectively. Patients with low TS expression genotypes had
significantly better PFS and OS than those with high TS expression
genotypes (PFS, P=0.027; OS, P=0.025; Fig. 2A and D).
Although there was a trend towards a better PFS
(median, 8.7 vs. 2.8 months; P=0.060) and OS (median, 24.0 vs. 8.9
months; P=0.090) in favor of the negative TS protein expression
group, PFS and OS were not significantly different according to TS
protein expression (Fig. 2B and E)
and TS TR polymorphism status (Fig. 2C
and F).
The results of the univariate and multivariate
analyses for PFS and OS are shown in Tables IV and V. In univariate analysis, ECOG performance
status (P<0.001) and TS SNP status (P=0.025) were
significantly associated with OS (Table IV). In the multivariate analysis,
poor ECOG performance status (HR, 2.85; 95% CI, 1.02–7.93) and high
TS expression genotypes (HR, 3.49; 95% CI, 1.13–10.78) were
independent prognostic factors for worse OS (Table V).
| Table IVUnivariate analysis for PFS and
OS. |
Table IV
Univariate analysis for PFS and
OS.
| Variables | No. of
patients | Median PFS (ms, 95%
CI) | P-value | Median OS (ms, 95%
CI) | P-value |
|---|
| Age at diagnosis
(years) |
| ≤60 | 27 | 6.4 (4.1–8.7) | 0.910 | 14.8
(11.1–18.5) | 0.995 |
| >60 | 31 | 5.2 (3.0–7.4) | | 10.2
(7.7–12.7) | |
| Gender |
| Male | 39 | 6.0 (4.2–7.8) | 0.977 | 12.2
(8.4–16.0) | 0.630 |
| Female | 19 | 6.4 (2.6–10.2) | | 14.0
(6.1–21.9) | |
| ECOG performance
status |
| 0–1 | 42 | 7.3 (5.8–8.8) | <0.001 | 14.8
(11.6–18.0) | <0.001 |
| 2–3 | 16 | 2.7 (2.1–3.3) | | 5.0 (3.4–6.6) | |
| Disease status |
| Locally
advanced | 15 | 8.7 (0.1–17.3) | 0.064 | 19.2
(5.5–32.9) | 0.265 |
| Metastatic | 43 | 5.5 (3.4–7.6) | | 10.6
(9.0–12.2) | |
| Tumor location |
| Duodenum | 50 | 6.3 (4.8–7.8) | 0.277 | 11.3
(7.2–15.4) | 0.863 |
| Jejunum/ileum | 8 | 3.8 (3.3–4.3) | | 12.2
(8.9–15.5) | |
| Pathologic
differentiation |
| Well | 9 | 11.9
(4.7–19.1) | 0.104 | 24.0
(0.2–47.8) | 0.284 |
| Moderate | 23 | 3.9 (2.0–5.8) | | 11.1
(6.7–15.5) | |
| Poor | 16 | 4.3 (1.7–6.9) | | 10.6
(8.4–12.7) | |
| Pretreatment CEA
level (ng/ml) |
| ≤2.2 | 23 | 3.8 (3.4–4.2) | 0.364 | 11.1
(5.8–16.4) | 0.860 |
| >2.2 | 22 | 6.3 (4.8–7.8) | | 8.9 (4.1–13.7) | |
| Chemotherapy |
| Cisplatin +
fluoropyrimidine | 31 | 6.7 (5.3–8.1) | 0.128 | 14.0
(9.3–18.7) | 0.083 |
| Oxaliplatin +
fluoropyrimidine | 11 | 3.9 (2.2–5.6) | | 11.3
(2.6–20.0) | |
| Irinotecan +
fluoropyrimidine | 6 | 3.7 (2.0–5.4) | | 4.7 (0–9.6) | |
| Fluoropyrimidine
alone | 10 | 5.5 (0–25.1) | | 30.5 (0–75.6) | |
| Prior
fluoropyrimidine use |
| No | 46 | 5.8 (3.9–7.7) | 0.642 | 10.6
(6.5–14.7) | 0.952 |
| Yes | 12 | 6.3 (1.5–11.1) | | 13.6
(9.5–17.7) | |
| TS protein
expression |
| Negative | 16 | 8.7 (4.0–13.4) | 0.060 | 24.0
(9.6–38.4) | 0.090 |
| Positive | 14 | 2.8 (0.9–4.7) | | 8.9 (5.7–12.1) | |
| TS TR
status |
| 2R/2R, 2R/3R | 13 | 10.1
(2.0–18.2) | 0.336 | 16.9
(10.3–23.5) | 0.397 |
| 3R/3R | 17 | 5.2 (3.5–6.9) | | 10.2
(5.5–14.9) | |
| TS SNP
status |
| Low expression
genotypes | 8 | 12.8
(6.4–19.2) | 0.027 | 28.8
(19.2–38.4) | 0.025 |
| High expression
genotypes | 22 | 4.3 (2.9–5.7) | | 8.9 (5.5–12.3) | |
| Table VMultivariate analysis for PFS and
OS. |
Table V
Multivariate analysis for PFS and
OS.
| Variables | HR | 95% CI | P-value |
|---|
| PFS |
| ECOG performance
status |
| 0–1 | 1 | | |
| 2–3 | 2.70 | 1.08–6.75 | 0.034 |
| TS SNP
status |
| Low expression
genotypes | 1 | | |
| High expression
genotypes | 2.47 | 1.05–5.79 | 0.038 |
| OS |
| ECOG performance
status |
| 0–1 | 1 | | |
| 2–3 | 2.85 | 1.02–7.93 | 0.046 |
| TS SNP
status |
| Low expression
genotypes | 1 | | |
| High expression
genotypes | 3.49 | 1.13–10.78 | 0.030 |
Discussion
Thymidylate synthase (TS) is a target of
fluoropyrimidines, and TS expression has been demonstrated to be a
determinant of fluoropyrimidine sensitivity in vitro
(11,12). Subsequent clinical studies have also
suggested that the TS level is associated with fluoropyrimidine
sensitivity (13–15). Fluoropyrimidines have been essential
backbone drugs for the treatment of gastrointestinal malignancies,
including SBA (24). Since SBA is a
rare malignancy, it may be meaningful to identify biologic
prognostic factors for current therapy. However, to date, data
regarding the prognostic role of TS in patients with SBA receiving
fluoropyrimidine-based chemotherapy are lacking. Therefore, we
investigated the impact of immunohistochemical expression of TS
protein and TS 5′-UTR polymorphisms on treatment outcomes of
fluoropyrimidine-based chemotherapy in patients with advanced SBA.
To the best of our knowledge, this is the first study to
investigate the role of drug sensitivity in regards to TS protein
expression and TS polymorphisms (SNP and TR) in patients
with advanced SBA.
In the present study, we demonstrated that the
TS genotype, identified by the G>C SNP status in the
TS TR sequence, may correlate with TS protein expression and
influence ORR, PFS, and OS in patients with locally
advanced/metastatic SBA treated with first-line
fluoropyrimidine-based chemotherapy. Notably, the present study
also showed that the TS TR polymorphism alone is not a
sufficient marker to predict response to fluoropyrimidine-based
chemotherapy. These findings are consistent with recent studies
demonstrating that TS activity was regulated by the G>C SNP as
well as the TR polymorphism in the 5′-UTR of the TS gene
(19–21). The number of TR in the TS
gene is associated with TS activity. The translational efficiency
of TS mRNA is generally three to four times higher with the
3R sequence than with the 2R sequence (16,17,25).
Recent clinical studies in patients with metastatic CRC have shown
that patients with the 3R/3R genotype were significantly associated
with a poorer response to 5-FU than those containing the 2R
genotype (26,27). However, some studies have found no
association between TS TR polymorphism and response to
5-FU-based chemotherapy (28,29). A
G>C SNP in the second repeat of the 3R alleles may partially
explain these discrepancies (18).
Functional analysis has demonstrated that translational efficiency
of the 3R sequence is three to four times greater without the
G>C SNP than with the G>C SNP (18,19).
As a result, the 3RC alleles may have a similar translational
efficiency to that of the 2R alleles.
Given that fluoropyrimidine-based cytotoxic
chemotherapy is currently regarded as the mainstay of treatment in
patients with advanced SBA (24),
the present study suggests that the TS genotype may serve as
a biomarker of response to fluoropyrimidine-based chemotherapy. In
this analysis, median OS among patients with low TS expression
genotypes was more than 28 months. Thus, the therapeutic approach
in these patients should take into account not only an efficacy of
chemotherapeutic agents but also toxicity and quality-of-life
implications. Therefore, trials involving such patients should
incorporate both patient-reported quality-of-life end points and
survival parameters to aid therapeutic decision making. On the
other hand, the outcomes of patients with high TS expression
genotypes were dismal; thus, the development of novel targeted
treatment strategies is urgently needed for this group of patients.
Although targeted therapies incorporating bevacizumab or cetuximab
are commonly used for the treatment of CRC, the role of targeted
therapies in advanced SBA has not yet been established. However,
studies investigating the molecular pathology of SBA suggest that
targeted therapies hold promise in the treatment of this disease.
Notably, vascular endothelial growth factor is highly expressed in
SBA, and the frequency of KRAS mutations is similar in SBA
and CRC (30–32). Furthermore, several case series have
reported the promising efficacy of cetuximab in patients with
KRAS wild-type SBA (33,34).
Therefore, the TS genotype will allow for the identification
of patients with a poor prognosis who preferentially require novel
targeted treatment other than fluoropyrimidine-based cytotoxic
chemotherapy. Prospective studies are urgently needed to validate
our results.
Even though data on the TS genotypes in
patients with SBA are lacking, previous studies in patients with
CRC have suggested the ethnic difference in the distribution of
TS genotypes (35). In the
present study, 3R/3R was the most prevalent allele with a frequency
of 57%, whereas 2R/2R and 2R/3R occurred at frequencies of 10 and
33%, respectively. Furthermore, the frequency of high TS expression
genotypes was much higher than that of low TS expression genotypes
(73 vs. 27%). This result is consistent with previous studies of
Korean CRC patients (22,36). However, the proportion of patients
with high and low TS expression genotypes was reported to be
similar in Caucasian ethnic group (18,20,35).
Because of the small sample size, we could not conclusively predict
the difference in the distribution of TS genotypes according
to ethnicity. Therefore, further studies are required to understand
whether this difference may affect the different prognosis
following fluoropyrimidine-based chemotherapy between Asian and
Caucasian ethnic groups.
The results of the present study suggest that the
TS genotype based on both TS SNP and TR status is
correlated with the immunohistochemical expression of TS protein.
However, the results should be interpreted with caution, since
previous studies investigating immunohistochemical expression of TS
as a surrogate marker for TS expression have been inconclusive.
Until recently, the predictive value of TS expression for response
to 5-FU-based chemotherapy was mainly investigated in metastatic
CRC (37,38). These studies produced conflicting
rather than conclusive results. Recent meta-analyses concluded that
advanced CRC with high TS expression levels seem to be less
sensitive to fluoropyrimidine-based chemotherapy, although evidence
of heterogeneity and possible publication bias was observed
(39,40). Differences in methodology and TS
status assessment criteria might have contributed to the
heterogeneity between studies (39). The most commonly used method to
determine TS expression is IHC. IHC is a convenient technique with
multiple advantages, thus making it a desirable approach for
biomarker study. However, significant limitations exist due to the
variability in its technical aspects, such as the antibodies used
and staining technique. Additionally, differences in the IHC
scoring methods used to dichotomize TS expression might contribute
to the conflicting results (39,40).
Therefore, TS immunohistochemical expression as a surrogate
biomarker of TS expression might need further clarification and
validation in patients with advanced SBA.
The present study has several limitations. First,
the present analysis is based on retrospective data obtained from a
small number of patients; therefore, unexpected selection bias may
be present. Second, our study focused solely on the prognostic role
of the G>C SNP and TR polymorphism of the 5′-UTR of the
TS gene in SBA patients treated with fluoropyrimidines-based
chemotherapy. However, the effects of other genetic polymorphism of
the TS gene (i.e., 6-bp deletion in the 3′-UTR) were not
investigated in this analysis. Moreover, an evaluation of the
impact of other fluoropyrimidine metabolic enzymes, such as
thymidylate phosphorylase, dihydropyrimidine dehydrogenase, and
methylenetetrahydrofolate reductase, on treatment outcomes was
beyond the scope of this study. Additional studies are necessary to
examine the impact of these enzymes on clinical outcomes in
patients with advanced SBA. Finally, prospective randomized studies
are needed to validate our results. However, the rarity of advanced
SBA makes randomized trials virtually difficult. Hence, cooperation
between study groups is crucial to conduct such studies.
Nevertheless, our study is the first to demonstrate the prognostic
relevance of the TS genotype in patients with advanced SBA
treated with first-line fluoropyrimidine-based chemotherapy.
In conclusion, the TS genotype based on
G>C SNP and TR polymorphism appears to be an independent
predictor of PFS and OS in patients with locally
advanced/metastatic SBA treated with first-line
fluoropyrimidine-based chemotherapy. Our findings represent a
promising step toward the optimization of treatment strategies in
advanced SBA. Further prospective studies with international
collaboration are required to verify the prognostic role of the
TS genotype in advanced SBA.
Acknowledgments
We would especially like to thank Dr Dong Sug Kim
for his excellent assistance in the TS IHC. The present study was
supported by funding from the Biomedical Research Institute,
Chonbuk National University Hospital and also supported by a grant
from the National R&D Program for Cancer Control, Ministry of
Health & Welfare, Republic of Korea (0620220-1).
Abbreviations:
|
CEA
|
carcinoembryonic antigen
|
|
CRC
|
colorectal cancer
|
|
CT
|
computed tomography
|
|
ECOG
|
Eastern Cooperative Oncology Group
|
|
IHC
|
immunohistochemistry
|
|
ORR
|
overall response rate
|
|
OS
|
overall survival
|
|
PCR
|
polymerase chain reaction
|
|
PFS
|
progression-free survival
|
|
RECIST
|
Response Evaluation Criteria in Solid
Tumors
|
|
SBA
|
small bowel adenocarcinoma
|
|
SNP
|
single-nucleotide polymorphism
|
|
TR
|
tandem repeat
|
|
TS
|
thymidylate synthase
|
|
UTR
|
untranslated region
|
|
5-FU
|
5-fluorouracil
|
References
|
1
|
Neugut AI, Jacobson JS, Suh S, Mukherjee R
and Arber N: The epidemiology of cancer of the small bowel. Cancer
Epidemiol Biomarkers Prev. 7:243–251. 1998.PubMed/NCBI
|
|
2
|
Xiang XJ, Liu YW, Zhang L, Qiu F, Yu F,
Zhan ZY, Feng M, Yan J, Zhao JG and Xiong JP: A phase II study of
modified FOLFOX as first-line chemotherapy in advanced small bowel
adenocarcinoma. Anticancer Drugs. 23:561–566. 2012. View Article : Google Scholar : PubMed/NCBI
|
|
3
|
Overman MJ, Varadhachary GR, Kopetz S,
Adinin R, Lin E, Morris JS, Eng C, Abbruzzese JL and Wolff RA:
Phase II study of capecitabine and oxaliplatin for advanced
adenocarcinoma of the small bowel and ampulla of Vater. J Clin
Oncol. 27:2598–2603. 2009. View Article : Google Scholar : PubMed/NCBI
|
|
4
|
McWilliams RR, Mahoney MR, Marchello BT,
Jatoi A, Krewer KD, Ames MA, Schneider DJ, Seeger GR, Mowat RB,
Alberts SR and Goetz MP: Pharmacogenetic dosing by UGT1A1 genotype
as first-line therapy for advanced small-bowel adenocarcinoma: A
North Central Cancer Treatment Group (NCCTG) trial. Clin Oncol.
30(Suppl 4): 3142012.
|
|
5
|
Gibson MK, Holcroft CA, Kvols LK and
Haller D: Phase II study of 5-fluorouracil, doxorubicin, and
mitomycin C for metastatic small bowel adenocarcinoma. Oncologist.
10:132–137. 2005. View Article : Google Scholar : PubMed/NCBI
|
|
6
|
Zaanan A, Costes L, Gauthier M, Malka D,
Locher C, Mitry E, Tougeron D, Lecomte T, Gornet JM, Sobhani I, et
al: Chemotherapy of advanced small-bowel adenocarcinoma: A
multicenter AGEO study. Ann Oncol. 21:1786–1793. 2010. View Article : Google Scholar : PubMed/NCBI
|
|
7
|
Tsushima T, Taguri M, Honma Y, Takahashi
H, Ueda S, Nishina T, Kawai H, Kato S, Suenaga M, Tamura F, et al:
Multicenter retrospective study of 132 patients with unresectable
small bowel adenocarcinoma treated with chemotherapy. Oncologist.
17:1163–1170. 2012. View Article : Google Scholar : PubMed/NCBI
|
|
8
|
Fishman PN, Pond GR, Moore MJ, Oza A,
Burkes RL, Siu LL, Feld R, Gallinger S, Greig P and Knox JJ:
Natural history and chemotherapy effectiveness for advanced
adenocarcinoma of the small bowel: A retrospective review of 113
cases. Am J Clin Oncol. 29:225–231. 2006. View Article : Google Scholar : PubMed/NCBI
|
|
9
|
Santi DV, McHenry CS and Sommer H:
Mechanism of interaction of thymidylate synthetase with
5-fluorodeoxyuridylate. Biochemistry. 13:471–481. 1974. View Article : Google Scholar : PubMed/NCBI
|
|
10
|
Danenberg PV, Heidelberger C, Mulkins MA
and Peterson AR: The incorporation of 5-fluoro-2′-deoxyuridine into
DNA of mammalian tumor cells. Biochem Biophys Res Commun.
102:654–658. 1981. View Article : Google Scholar : PubMed/NCBI
|
|
11
|
Johnston PG, Drake JC, Trepel J and
Allegra CJ: Immunological quantitation of thymidylate synthase
using the monoclonal antibody TS 106 in 5-fluorouracil-sensitive
and -resistant human cancer cell lines. Cancer Res. 52:4306–4312.
1992.PubMed/NCBI
|
|
12
|
van Triest B, Pinedo HM, van Hensbergen Y,
Smid K, Telleman F, Schoenmakers PS, van der Wilt CL, van Laar JA,
Noordhuis P, Jansen G, et al: Thymidylate synthase level as the
main predictive parameter for sensitivity to 5-fluorouracil, but
not for folate-based thymidylate synthase inhibitors, in 13
nonselected colon cancer cell lines. Clin Cancer Res. 5:643–654.
1999.PubMed/NCBI
|
|
13
|
Leichman L, Lenz HJ, Leichman CG, Groshen
S, Danenberg K, Baranda J, Spears CP, Boswell W, Silberman H,
Ortega A, et al: Quantitation of intratumoral thymidylate synthase
expression predicts for resistance to protracted infusion of
5-fluorouracil and weekly leucovorin in disseminated colorectal
cancers: Preliminary report from an ongoing trial. Eur J Cancer.
31A:1306–1310. 1995. View Article : Google Scholar : PubMed/NCBI
|
|
14
|
Leichman CG, Lenz HJ, Leichman L,
Danenberg K, Baranda J, Groshen S, Boswell W, Metzger R, Tan M and
Danenberg PV: Quantitation of intratumoral thymidylate synthase
expression predicts for disseminated colorectal cancer response and
resistance to protracted-infusion fluorouracil and weekly
leucovorin. J Clin Oncol. 15:3223–3229. 1997.PubMed/NCBI
|
|
15
|
Liersch T, Langer C, Ghadimi BM, Kulle B,
Aust DE, Baretton GB, Schwabe W, Häusler P, Becker H and Jakob C:
Lymph node status and TS gene expression are prognostic markers in
stage II/III rectal cancer after neoadjuvant fluorouracil-based
chemoradiotherapy. J Clin Oncol. 24:4062–4068. 2006. View Article : Google Scholar : PubMed/NCBI
|
|
16
|
Horie N, Aiba H, Oguro K, Hojo H and
Takeishi K: Functional analysis and DNA polymorphism of the
tandemly repeated sequences in the 5′-terminal regulatory region of
the human gene for thymidylate synthase. Cell Struct Funct.
20:191–197. 1995. View Article : Google Scholar : PubMed/NCBI
|
|
17
|
Kawakami K, Omura K, Kanehira E and
Watanabe Y: Polymorphic tandem repeats in the thymidylate synthase
gene is associated with its protein expression in human
gastrointestinal cancers. Anticancer Res. 19:3249–3252. 1999.
|
|
18
|
Mandola MV, Stoehlmacher J, Muller-Weeks
S, Cesarone G, Yu MC, Lenz HJ and Ladner RD: A novel single
nucleotide polymorphism within the 5′ tandem repeat polymorphism of
the thymidylate synthase gene abolishes USF-1 binding and alters
transcriptional activity. Cancer Res. 63:2898–2904. 2003.PubMed/NCBI
|
|
19
|
Kawakami K and Watanabe G: Identification
and functional analysis of single nucleotide polymorphism in the
tandem repeat sequence of thymidylate synthase gene. Cancer Res.
63:6004–6007. 2003.PubMed/NCBI
|
|
20
|
Marcuello E, Altés A, del Rio E, César A,
Menoyo A and Baiget M: Single nucleotide polymorphism in the 5′
tandem repeat sequences of thymidylate synthase gene predicts for
response to fluorouracil-based chemotherapy in advanced colorectal
cancer patients. Int J Cancer. 112:733–737. 2004. View Article : Google Scholar : PubMed/NCBI
|
|
21
|
Fernández-Contreras ME, Sánchez-Prudencio
S, Sánchez-Hernández JJ, García de Paredes ML, Gisbert JP,
Roda-Navarro P and Gamallo C: Thymidylate synthase expression
pattern, expression level and single nucleotide polymorphism are
predictors for disease-free survival in patients of colorectal
cancer treated with 5-fluorouracil. Int J Oncol. 28:1303–1310.
2006.PubMed/NCBI
|
|
22
|
Hur H, Kang J, Kim NK, Min BS, Lee KY,
Shin SJ, Keum KC, Choi J, Kim H, Choi SH, et al: Thymidylate
synthase gene polymorphism affects the response to preoperative
5-fluorouracil chemoradiation therapy in patients with rectal
cancer. Int J Radiat Oncol Biol Phys. 81:669–676. 2011. View Article : Google Scholar
|
|
23
|
Therasse P, Arbuck SG, Eisenhauer EA,
Wanders J, Kaplan RS, Rubinstein L, Verweij J, Van Glabbeke M, van
Oosterom AT, Christian MC, et al: New guidelines to evaluate the
response to treatment in solid tumors. European Organization for
Research and Treatment of Cancer, National Cancer Institute of the
United States, National Cancer Institute of Canada. J Natl Cancer
Inst. 92:205–216. 2000. View Article : Google Scholar : PubMed/NCBI
|
|
24
|
Raghav K and Overman MJ: Small bowel
adenocarcinomas-existing evidence and evolving paradigms. Nat Rev
Clin Oncol. 10:534–544. 2013. View Article : Google Scholar : PubMed/NCBI
|
|
25
|
Kawakami K, Salonga D, Park JM, Danenberg
KD, Uetake H, Brabender J, Omura K, Watanabe G and Danenberg PV:
Different lengths of a polymorphic repeat sequence in the
thymidylate synthase gene affect translational efficiency but not
its gene expression. Clin Cancer Res. 7:4096–4101. 2001.PubMed/NCBI
|
|
26
|
Iacopetta B, Grieu F, Joseph D and Elsaleh
H: A polymorphism in the enhancer region of the thymidylate
synthase promoter influences the survival of colorectal cancer
patients treated with 5-fluorouracil. Br J Cancer. 85:827–830.
2001. View Article : Google Scholar : PubMed/NCBI
|
|
27
|
Marsh S, McKay JA, Cassidy J and McLeod
HL: Polymorphism in the thymidylate synthase promoter enhancer
region in colorectal cancer. Int J Oncol. 19:383–386.
2001.PubMed/NCBI
|
|
28
|
Etienne MC, Chazal M, Laurent-Puig P,
Magné N, Rosty C, Formento JL, Francoual M, Formento P, Renée N,
Chamorey E, et al: Prognostic value of tumoral thymidylate synthase
and p53 in metastatic colorectal cancer patients receiving
fluorouracil-based chemotherapy: Phenotypic and genotypic analyses.
J Clin Oncol. 20:2832–2843. 2002. View Article : Google Scholar : PubMed/NCBI
|
|
29
|
Tsuji T, Hidaka S, Sawai T, Nakagoe T,
Yano H, Haseba M, Komatsu H, Shindou H, Fukuoka H, Yoshinaga M, et
al: Polymorphism in the thymidylate synthase promoter enhancer
region is not an efficacious marker for tumor sensitivity to
5-fluorouracil-based oral adjuvant chemotherapy in colorectal
cancer. Clin Cancer Res. 9:3700–3704. 2003.PubMed/NCBI
|
|
30
|
Overman MJ, Pozadzides J, Kopetz S, Wen S,
Abbruzzese JL, Wolff RA and Wang H: Immunophenotype and molecular
characterisation of adenocarcinoma of the small intestine. Br J
Cancer. 102:144–150. 2010. View Article : Google Scholar :
|
|
31
|
Aparicio T, Svrcek M, Zaanan A, Beohou E,
Laforest A, Afchain P, Mitry E, Taieb J, Di Fiore F, Gornet JM, et
al: Small bowel adenocarcinoma phenotyping, a clinicobiological
prognostic study. Br J Cancer. 109:3057–3066. 2013. View Article : Google Scholar : PubMed/NCBI
|
|
32
|
Nishiyama K, Yao T, Yonemasu H, Yamaguchi
K, Tanaka M and Tsuneyoshi M: Overexpression of p53 protein and
point mutation of K-ras genes in primary carcinoma of the small
intestine. Oncol Rep. 9:293–300. 2002.PubMed/NCBI
|
|
33
|
Santini D, Fratto ME, Spoto C, Russo A,
Galluzzo S, Zoccoli A, Vincenzi B and Tonini G: Cetuximab in small
bowel adenocarcinoma: A new friend? Br J Cancer. 103:1305author
reply 1306. 2010. View Article : Google Scholar : PubMed/NCBI
|
|
34
|
De Dosso S, Molinari F, Martin V, Frattini
M and Saletti P: Molecular characterisation and cetuximab-based
treatment in a patient with refractory small bowel adenocarcinoma.
Gut. 59:1587–1588. 2010. View Article : Google Scholar : PubMed/NCBI
|
|
35
|
Wang YC, Xue HP, Wang ZH and Fang JY: An
integrated analysis of the association between Ts gene
polymorphisms and clinical outcome in gastric and colorectal cancer
patients treated with 5-FU-based regimens. Mol Biol Rep.
40:4637–4644. 2013. View Article : Google Scholar : PubMed/NCBI
|
|
36
|
Park CM, Lee WY, Chun HK, Cho YB, Yun HR,
Heo JS, Yun SH and Kim HC: Relationship of polymorphism of the
tandem repeat sequence in the thymidylate synthase gene and the
survival of stage III colorectal cancer patients receiving adjuvant
5-flurouracil-based chemotherapy. J Surg Oncol. 101:22–27. 2010.
View Article : Google Scholar
|
|
37
|
Aschele C, Debernardis D, Casazza S,
Antonelli G, Tunesi G, Baldo C, Lionetto R, Maley F and Sobrero A:
Immunohistochemical quantitation of thymidylate synthase expression
in colorectal cancer metastases predicts for clinical outcome to
fluorouracil-based chemotherapy. J Clin Oncol. 17:1760–1770.
1999.PubMed/NCBI
|
|
38
|
Johnston PG, Benson AB III, Catalano P,
Rao MS, O’Dwyer PJ and Allegra CJ: Thymidylate synthase protein
expression in primary colorectal cancer: Lack of correlation with
outcome and response to fluorouracil in metastatic disease sites. J
Clin Oncol. 21:815–819. 2003. View Article : Google Scholar : PubMed/NCBI
|
|
39
|
Popat S, Matakidou A and Houlston RS:
Thymidylate synthase expression and prognosis in colorectal cancer:
A systematic review and meta-analysis. J Clin Oncol. 22:529–536.
2004. View Article : Google Scholar : PubMed/NCBI
|
|
40
|
Qiu LX, Tang QY, Bai JL, Qian XP, Li RT,
Liu BR and Zheng MH: Predictive value of thymidylate synthase
expression in advanced colorectal cancer patients receiving
fluoropyrimidine-based chemotherapy: Evidence from 24 studies. Int
J Cancer. 123:2384–2389. 2008. View Article : Google Scholar : PubMed/NCBI
|