Introduction
Thyroid carcinoma is the most common malignancy of
the endocrine system and is one of the human cancers with the most
rapidly increasing prevalence in many countries (1,2).
Although the majority of thyroid cancer patients have an excellent
outcome, in approximately 10% of patients with well-differentiated
thyroid cancer, the ability to respond to radioiodine therapy is
lost and poorly differentiated or undifferentiated tumors lead to
recurrent disease and death (3,4). The
most common thyroid cancer is papillary thyroid carcinoma (PTC)
which is classified as a well-differentiated carcinoma and is often
curable by the combination of surgery and radioiodine ablation
(3–6). However, intense cell progression and
aggressive spread of the tumor occur in some patients, leading to
loss of the ability to uptake iodine. Thus, in these cases of
advanced differentiated thyroid carcinoma, the use of new effective
therapeutic strategies is a dilemma (6,7).
Recent studies have shown that molecular alterations
at signaling pathways, such as RAS, RAF and mitogen-activated
protein kinase (MAPK) are involved in the thyroid neoplastic
process (8–11). Furthermore, previous studies have
shown that in thyroid cancer, tumor progression is accompanied by
increased glucose uptake as detected by
18F-fluorodeoxyglucose positron emission tomography
(18F-FDG PET) and decreased radioiodide uptake ability
(12). In general, transformed
cells have altered energy metabolism (13–17),
since in these cells glycolysis is not inhibited in the presence of
oxygen. At the beginning of the last century, Warburg reported that
cancer cells are able to convert glucose into lactate, even in the
presence of oxygen. This phenomenon was called aerobic glycolysis
or the ‘Warburg effect’ (13,14,18).
In the following years, it has been shown that in addition to
higher glycolytic flux, there is an increased expression of glucose
transporters (GLUTs), in parallel with a reduction in oxidative
metabolism (13–20). Although the Warburg hypothesis is
well established, the adaptive mechanisms that lead to decreased
oxidative metabolism in cancer cells remain obscure in many
carcinoma models.
These features indicate the need to specifically
study the metabolic profile of this thyroid tumor type. Few studies
have evaluated energy metabolism directly as related to the process
of tumorigenesis, although they represent an interesting model of
tumor spectra with differing prognoses. Recently, our group
demonstrated that thyroid iodide and glucose uptakes are influenced
by the energy ‘fuel gauge’ AMP-activated protein kinase (AMPK)
signaling pathway (7). Indeed
disruption of cellular energy metabolism is considered a hallmark
of cancer in several tumor lineages (18). To our knowledge, however, no study
has evaluated tumor cell metabolism behavior in different thyroid
cancer cell lineages. In this regard, in the present study we aimed
to analyze the metabolic profiles and the activity of key
glycolytic enzymes in two thyroid carcinoma cell lines and in one
non-tumor human thyroid cell line. Our results strongly suggest
that the differences in the glycolytic profile found in these cell
lines may explain, at least in part, their different growth rates,
which may in turn be associated with more aggressive
phenotypes.
Materials and methods
Reagents
3-(4,5-dimethylthiazol-2-yl)-2,5-diphenyltetrazolium
bromide (MTT), glucose, 2-deoxyglucose (2-DOG), nicotinamide
adenine dinucleotide phosphate (NADP+), oligomycin
(Olig), glucose-6-phosphate dehydrogenase (G6PDH) kit, ATP kit and
lactate kit were purchased from Sigma-Aldrich (St. Louis, MO, USA)
and Glucox 500 reagent from Doles Reagentes (Goiânia, Goiás,
Brazil). All other chemicals were of the highest grade available.
Polyvinylidene difluoride (PVDF) membranes were provided by Bio-Rad
(Hercules, CA USA) and Millipore (Billerica, MA, USA). Specific
antibody against GLUT1 (1:1,000) was from Abcam (Cambridge, MA,
USA), and against hexokinase I (HKI) (1:1,000) and HKII (1:1,000)
were both purchased from Cell Signaling Technology, Inc. (Danvers,
MA, USA). Cell culture medium Dulbecco's modified Eagle's medium
(DMEM) and RPMI-1640 were provided by HiMedia Laboratories
(Curitida, Brazil) and fetal bovine serum from Invitrogen Life
Technologies (Carlsbad, CA, USA).
Cell culture
Human PTC cells (BCPAP and TPC1) and NTHY-ori cell
lineages were generous gifts from Dr Corinne Dupuy, (Institut
Gustave Roussy, Paris, France). Cells were cultivated in DMEM
(BCPAP and TPC1) and RPMI (NTHY), supplemented with 10% bovine
serum medium, and maintained at 37°C in 5% CO2.
Cell viability
The MTT assay was used to test cell viability in
three different experiments. First, we measured the cell viability
after 6, 24, 48 and 72 h under a baseline condition. Then, we
tested the cytotoxicity after treatment with Olig. In this case,
the cells were grown in medium until 80% confluence was achieved.
The medium was removed and fresh medium containing 2 µg/ml Olig was
added for 2 or 24 h. Also, after the cells achieved confluence, the
medium was removed and fresh medium containing 2 mM of 2-DOG was
added to the medium for 24 h.
Total mRNA extraction and quantitative
RT-PCR
Immediately after treatment, total RNA was extracted
using the RNeasy Plus Mini kit (Qiagen Sciences Inc., Germantown,
MD, USA) following the manufacturer's instructions. Total RNA was
reverse transcribed into cDNA using a high-capacity reverse
transcriptase kit (Applied Biosystems Inc., Carlsbad, CA, USA). The
specific forward and reverse primers are presented in Table I and were designed to span introns
and avoid detection of genomic DNA contamination. Real-time
amplifications were carried out using ABI Prism 7500 equipment
(Applied Biosystems, Invitrogen Life Technologies, São Paulo,
Brazil). The amplification reactions were performed in 96-well
plates in 12 µl final volume that contained 3 µl cDNA (diluted
1:100), 7.5 µl of SYBR Master Mix (Applied Biosystems, Invitrogen
Life Technologies), and 150 nM of each forward and reverse primers.
The amplification program consisted of 55°C for 2 min, 95°C for 10
min followed by 40 cycles of 95°C for 30 sec, and 58°C for 1 min.
The RT-PCR efficiency was evaluated using serial dilutions of the
cDNA template, and melting curve data were collected to assess
RT-PCR specificity. Each cDNA sample was amplified in duplicate,
and a corresponding sample without reverse transcriptase (no-RT
sample) was included, as a negative control. The content of the
target gene transcripts was normalized to that of peptidylprolyl
isomerase A (PPIA). The relative quantities of gene expression were
determined by the comparative Ct method expressed by the formula
2−ΔΔCt (19), where Ct
refers to the threshold cycle and was determined for each plate by
7500 Real-Time PCR system sequence detection software (Applied
Biosystems, Invitrogen Life Technologies).
 | Table I.Primer sequences used for real-time
PCR assay. |
Table I.
Primer sequences used for real-time
PCR assay.
| Gene | Forward | Reverse |
|---|
| GLUT1 |
CATCAACCGCAACGAGGA |
GGTCATGGGTCACGTCAG |
| HK1 |
ACATTGTCTCCTGCATCTCTG |
GCGTTAAAACCCTTTGTCCAC |
| HK2 |
GCAAGGAGATGGAGAAAGGG |
AGCACACGGAAGTTGGTC |
| PFK1p |
CATCGACAATGATTTCTGCGG |
CCATCACCTCCAGAACGAAG |
| PFK1l |
AACGAGAAGTGCCATGACTAC |
GTCCCATAGTTCCGGTCAAAG |
| PFK1m |
TGACCAAAGATGTGACCAAGG |
GCGAACCACTCTTAGATACCG |
| PKM1 |
ACCGAGCTGTTTGAAGAA |
TCCATGAGGTCTGTGGAGTG |
| PKM2 |
ATGGCTGACACATTCCTGG |
CATCTCCTTCAACGTCTCCAC |
| LDH |
CGTGTTATTGGAAGCGGTTG |
TTCATTCCACTCCATACAGGC |
| PPIA |
CCGAGGAAAACCGTGTACTATTAG |
TGCTGTCTTTGGGACCTTG |
Glucose consumption and lactate
production
Glucose uptake was measured as previously described
(20). Cells were cultivated in
6-well plates. After confluence, the cells were washed twice, and
glucose (1 mM) was added to the PBS saline solution. Aliquots of
the incubation medium were collected each 5 min and transferred to
96-well plates. After 60 min, the glucose concentrations in the
samples were analyzed by colorimetric methods (20). The specific glucose uptake was
corrected by protein concentration that was evaluated using the BCA
protein assay kit (Pierce, Thermo Scientific Fisher, Waltham, MA,
USA). Lactate production was recorded using the same cell pool.
Cells were lysed and the lactate content was measured by procedures
according to the instructions provided by the kit (Sigma Chemical
Co.).
ATP content
Cells were cultivated in 12-well plates. After 80%
confluence, the medium was removed, and the cells were washed
twice, processed using a luciferin-luciferase bioluminescence assay
according to the instructions provide by the ADP/ATP ratio assay
kit (MAK 135; Sigma Chemical Co.). In the presence of luciferase,
ATP immediately reacts with the substrate D-luciferin to produce
light. The light intensity is a direct measure of the intracellular
ATP concentration.
Western blot analysis
GLUT1, HK1 and HK2 levels were analyzed after lysis
of the cells in a buffer [0.05 M Tris-HCl (pH 8.0), 0.15 M NaCl,
0.1% SDS, 0.5% deoxicolic acid, 5 mM MgCl2, Triton 1%, 1
mM PMSF, 1 mM NaF, 1 mM Na3VO4, 1 M leupeptin
and 1 M pepstatin]. Subsequently, the samples were centrifuged and
then the supernatant was collected. An aliquot was used to
determine the concentration of protein by the BCA protein assay
kit. Fifty micrograms of protein were then resolved on SDS-PAGE
gels, transferred to PVDF membranes, and probed with the indicated
primary antibodies. We used a β-actin antibody (1:8,000) from
Sigma-Aldrich as the loading control. The detection of proteins was
performed by chemiluminescence (ECL; Pierce, Thermo Scientific
Fisher) following densitometric analysis.
HK activity
Initially, we measured cellular viability by trypan
blue and corrected the sample to 105 cells. The cells
were suspended in lysis buffer [0.05 M Tris-HCl (pH 8.0), 0.15 M
NaCl, 0.1% SDS, 0.5% deoxicolic acid, 5 mM MgCl2, Triton
1%, 1 mM PMSF, 1 mM NaF, 1 mM Na3VO4] and HK
activity was assayed as previously described (7). Blanks with none of the coupled enzymes
were performed to control for non-specific oxidation/reduction. For
mitochondrial HK fraction assay, the homogenates were centrifuged
at 10,000 × g to separate the soluble fraction of HK (total cell
extracted) from the particulate fraction (mitochondrial fraction).
The HK activity was measured in each cell fraction.
Glucose-6-phosphate content and G6PDH
activity
To measure the glucose-6-phosphate (G6P) amount,
cells were corrected to 105 cells and suspended in lysis
buffer [0.05 M Tris-HCl (pH 8.0), 0.15 M NaCl, 0.1% SDS, 0.5%
deoxycolic acid, 5 mM MgCl2, Triton 1%, 1 mM PMSF, 1 mM
NaF, 1 mM Na3VO4]. The reaction medium
contained 50 mM Tris-HCl, pH 8.0, 0.5 mM NADP+ and 0.2
U/ml G6PDH. Reduction of NADP+ was followed by measuring
the absorbance at 340 nm in a microplate reader (Victor 4 XR;
Perkin-Elmer Inc., Waltham, MA, USA). To measure G6PDH activity,
cells were corrected to 1×10⁵ cells and suspended in
lysis buffer following the instructions of the G6PDH kit assay
(Sigma Chemical Co.) measuring the absorbance at 340 nm in a
microplate reader (Victor 4 XR; Perkin-Elmer Inc., São Paulo,
Brazil).
Pyruvate kinase activity
Samples (105 cells) were suspended in
lysis buffer [0.05 M Tris-HCl (pH 8.0), 0.15 M NaCl, 0.1% SDS, 0.5%
deoxicolic acid, 5 mM MgCl2, Triton 1%, 1 mM PMSF, 1 mM
NaF, 1 mM Na3VO4] and pyruvate kinase (PK)
assay was recorded using the PK kit (Sigma Chemical Co.) measuring
the absorbance at 340 nm in a microplate reader (Victor 4 XR;
Perkin-Elmer Inc.).
Oxygen consumption
The assay was performed with intact cells
(106 cells/ml) in culture medium and oxygen consumption
rates were measured polarographically using high-resolution
respirometry (Oroboros Oxygraph - O2K; Oroboros
Instruments, Innsbruck, Austria). Assay was started by adding cells
in the closed (2 ml) respirometer chamber, and the basal
respiration status of the different cell lines was collected.
Immediately, we added Olig (1 µg/ml), to acquire the oxygen
consumption coupled to ATP synthesis calculated by basal
O2 consumption - Olig O2 consumption.
Finally, we add a selective inhibitor form complex IV (KCN 1 mM) to
completely block mitochondrial respiration called the residual
oxygen consumption.
ROS production
The levels of intracellular ROS were measured using
a reactive oxygen species assay kit (Applygen Technologies, Inc.,
Beijing, China). Briefly, the intracellular formation of ROS in the
TPC1 and BCPAP cells was determined using
2′7′-dichlorodihydrofluorescein diacetate (DCFH-DA) molecular
probes. DCFH-DA is a membrane-permeable indicator of ROS levels and
the reaction between these probes and intracellular ROS yields the
fluorescent molecule DCF, which may be used as an indicator of
intracellular ROS levels. Cells were washed with PBS and loaded
with 10 µM DCFH-DA in serum-free DMEM without phenol red in the
dark for 30 min at 37̊C. The excess dye was flushed off and the
cells were suspended in serum-free DMEM. Fluorescence intensity was
quantified using a BD FACSVantage™ SE (BD Biosciences, Franklin
Lakes, NJ, USA).
Statistical analysis
Statistical analyses were performed using GraphPad
Software, Inc. (San Diego, CA, USA), and the tests were as follows:
Student's t-test or one-way analysis of variance (ANOVA) followed
by the Bonferroni multiple comparison test, as described in the
figure legends. The level of significance was set at p<0.05.
Results
Cell growth pattern and glycolytic
capacity among thyroid carcinoma cell lines
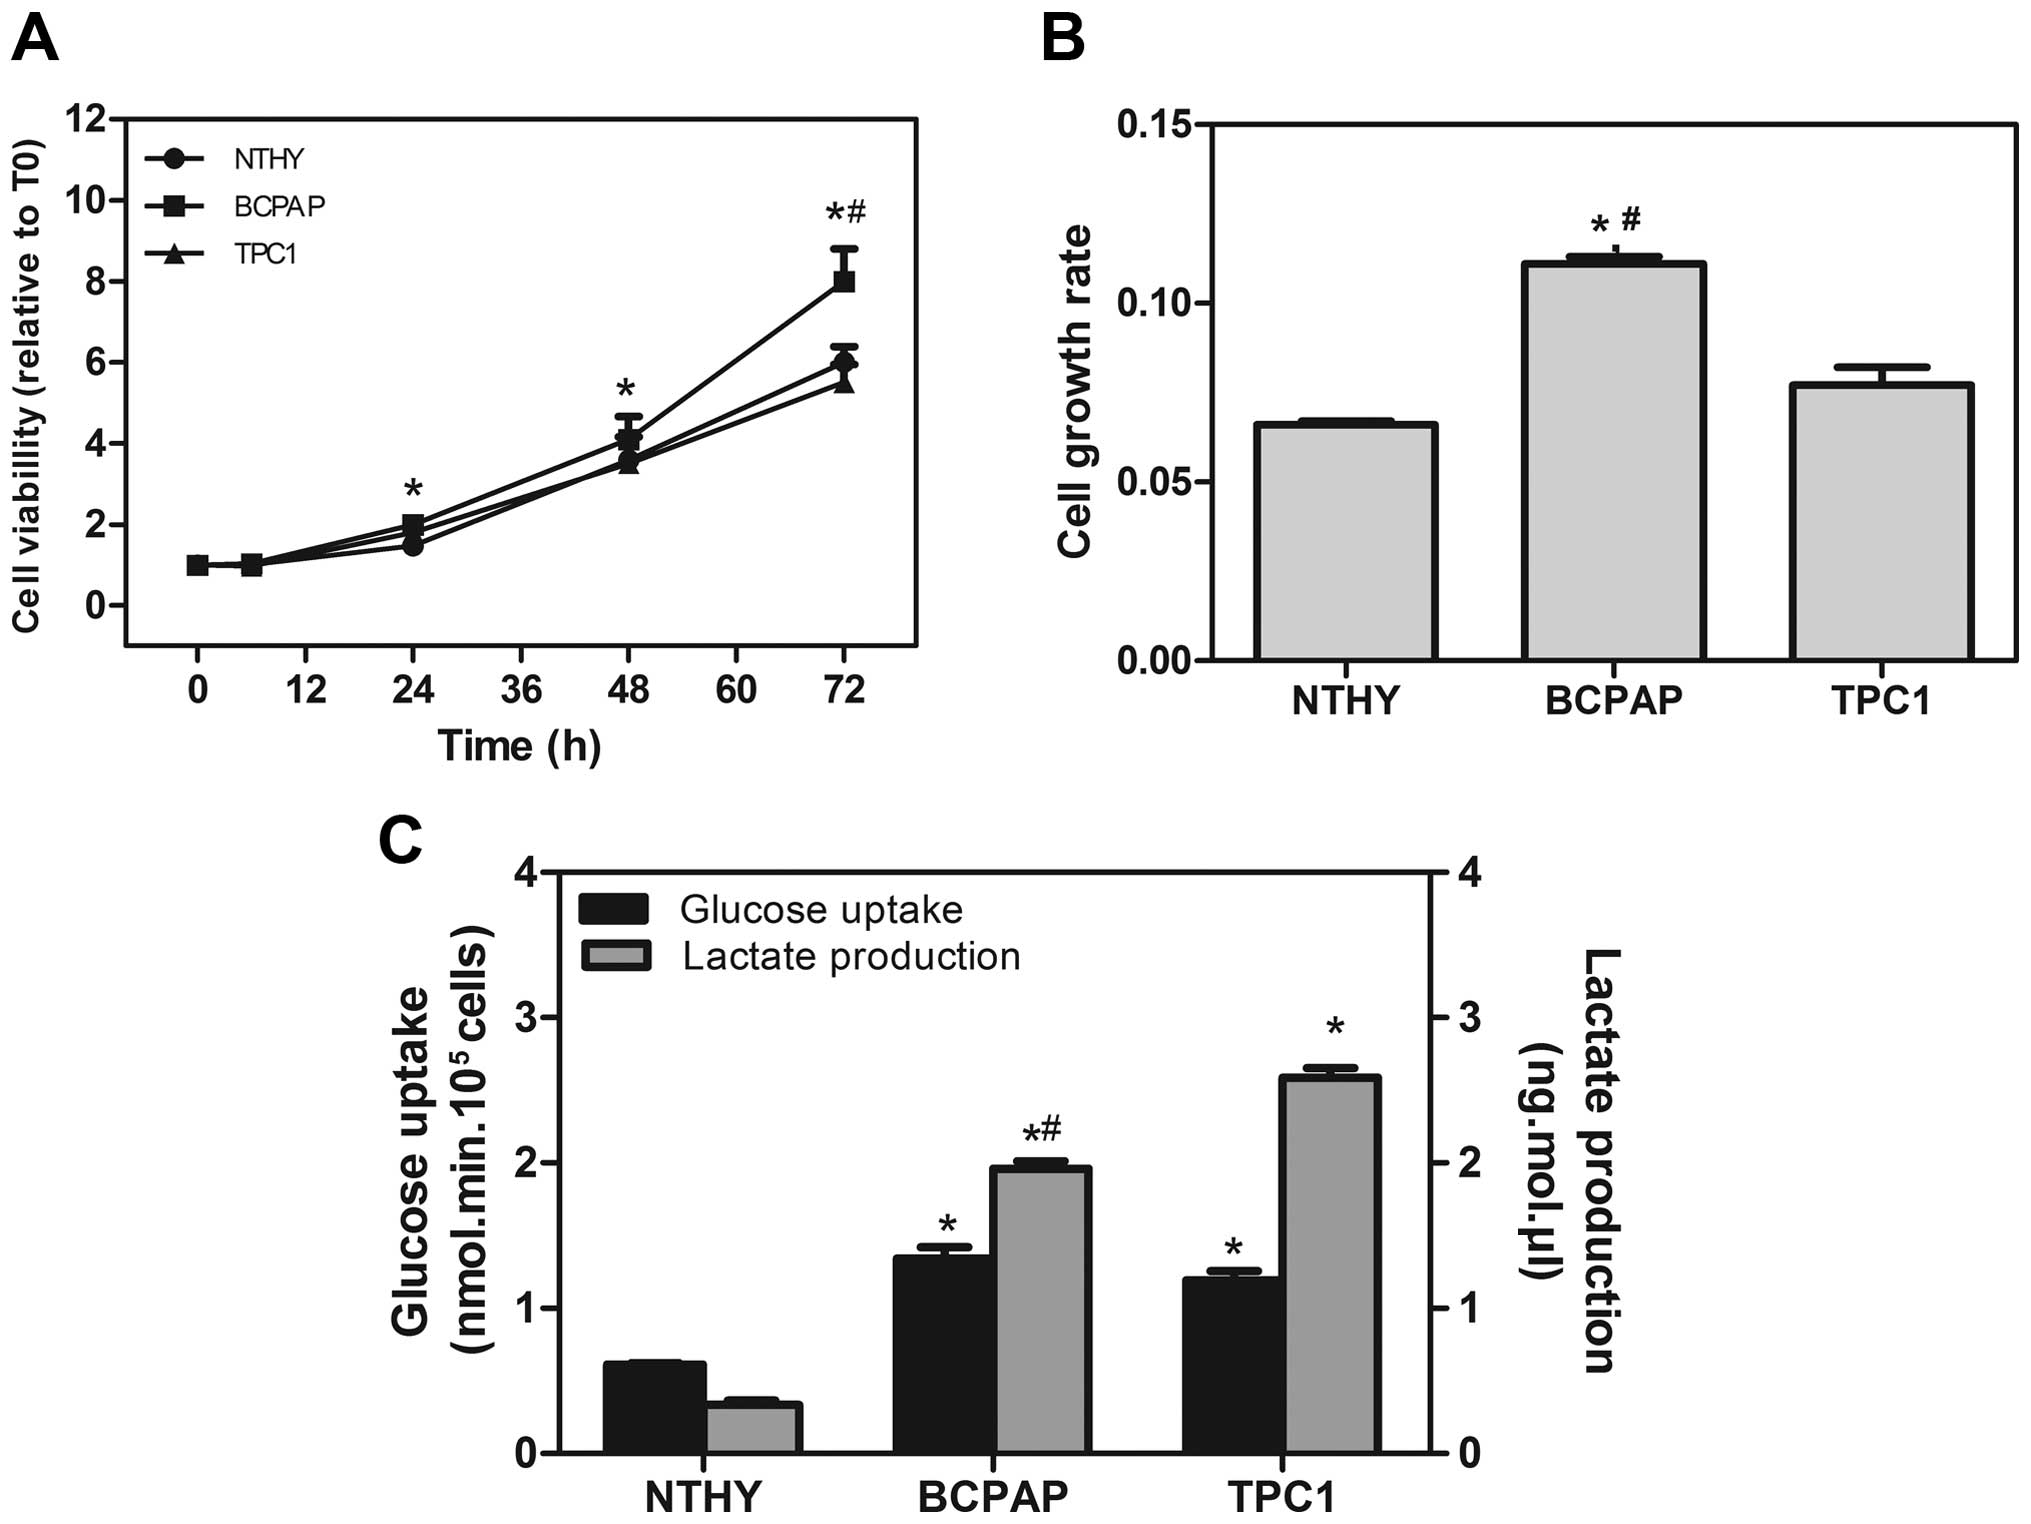
In attempt to described differences in energy
behavior between thyroid carcinoma cell lineages, we analyzed the
cell growth rate and glycolic capacity of all cells (Fig. 1). BCPAP showed a higher cell growth
rate different from TPC1 after 48 h (Fig. 1A). Both TPC1 and the non-tumor cell
line NTHY-ori exhibited the same growth rate (Fig. 1B). The glucose uptake of tumor cell
lines was 2- to 3.5-fold higher than the uptake found in non-tumor
cells. The lactate production was also much higher in the BCPAP and
TPC1 cell lines when compared to the NTHY-ori cells (Fig. 1C). These data suggest that thyroid
carcinoma cell lines show a high ability to convert glucose into
lactate (glycolytic efficiency), an important phenomenon possibly
involved in tumor survival.
Expression of different glycolytic
enzymes and protein expression pattern
To investigate the mechanisms involved in the
differences found in the metabolism of these cell lines, we
analyzed the mRNA expression and levels of proteins involved in the
glycolytic flux. As shown in Fig.
2A, we observed that Glut1 mRNA and protein levels were more
highly expressed in both carcinoma cell lines than these levels in
the NTHY-ori cells. Moreover, the protein levels of HK1 and HK2
isoforms were more highly expressed in the cancer cell lines
(Fig. 2B and C) in the same way as
gene expression of other glycolytic targets such as PKM1 and
PKM2.
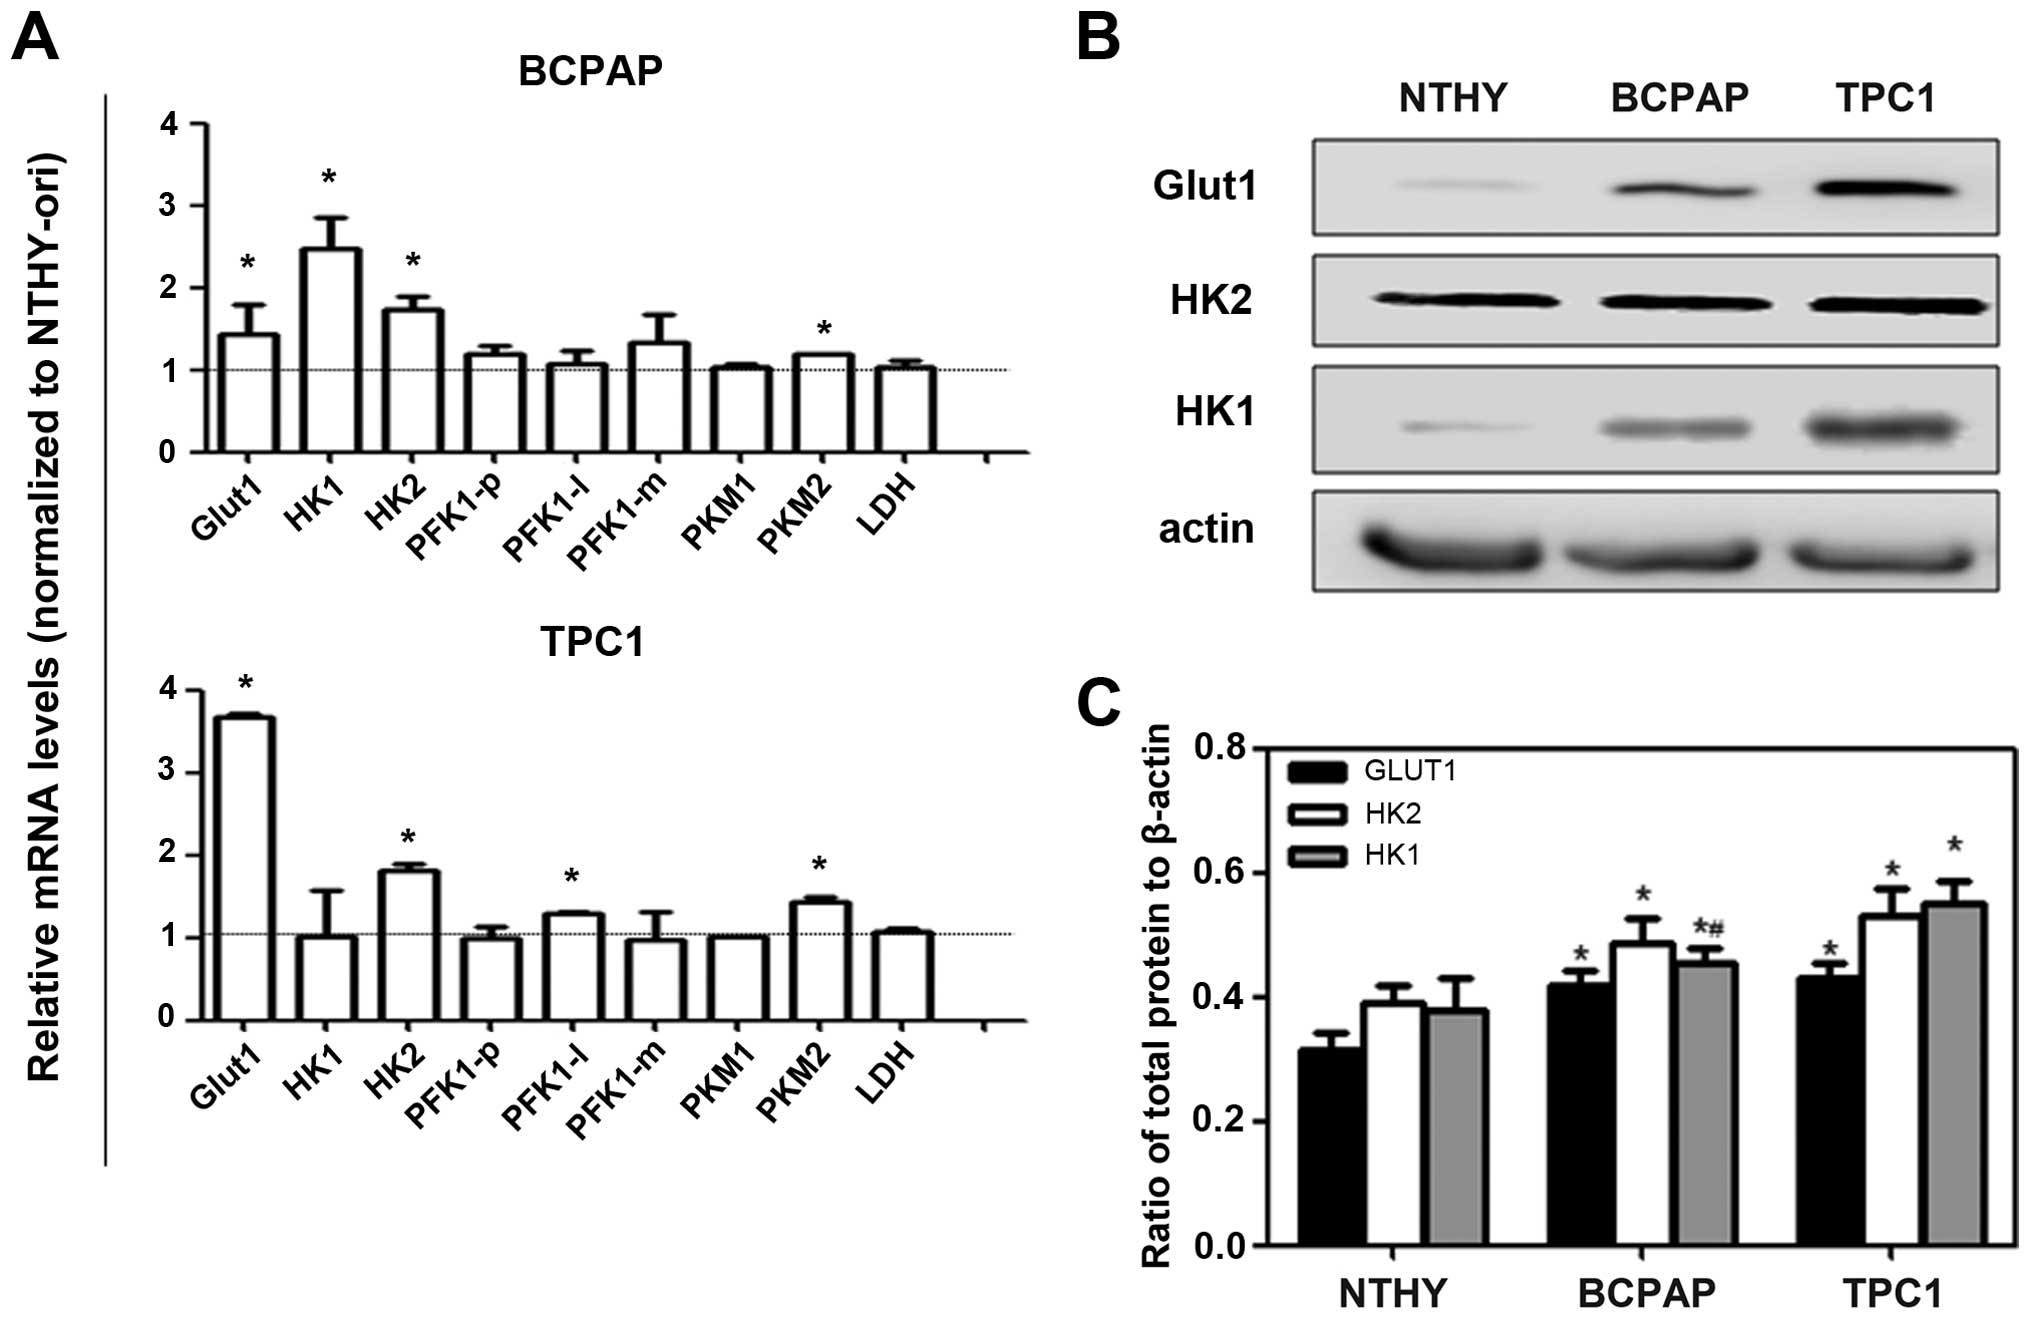 | Figure 2.Expression of enzymes involved in
energy metabolism of thyroid carcinoma cell lines. (A) Total RNA
was extracted from cells and RT-PCR was performed to quantify
expression of the indicated genes, using peptidylprolyl isomerase A
(PPIA) as endogenous control. Data are expressed as the mean ± SEM
of six independent experiments assessing the mRNA expression of:
glucose transporter 1 (Glut1), glycolytic enzymes (HK1, hexokinase
1; HK2, hexokinase 2; PFK1-p, phosphofructokinase-1 isoform
platelet; PFK1-l, phosphofructokinase-1 isoform liver; PFK1-m,
phosphofructokinase-1 isoform muscle; PKM1, pyruvate kinase isoform
M1; PKM2, pyruvate kinase isoform M2) and lactate dehydrogenase
(LDH) in human thyroid carcinoma cell lines. Results are shown
compared to NTHY-ori, a non tumoral cell line; *p<0.05. (B) Cell
lysates were collected and analyzed by immunoblotting for Glut1,
HK1 and HK2 as shown in a representative blot. (C) Data represent
means ± SEM of 4 independent experiments using β-actin as a loading
control. *p<0.05 compared to NTHY-ori and #p<0.05
compared to TPC1 cells. |
Glycolytic enzyme activity patterns in
the thyroid carcinoma cell lines
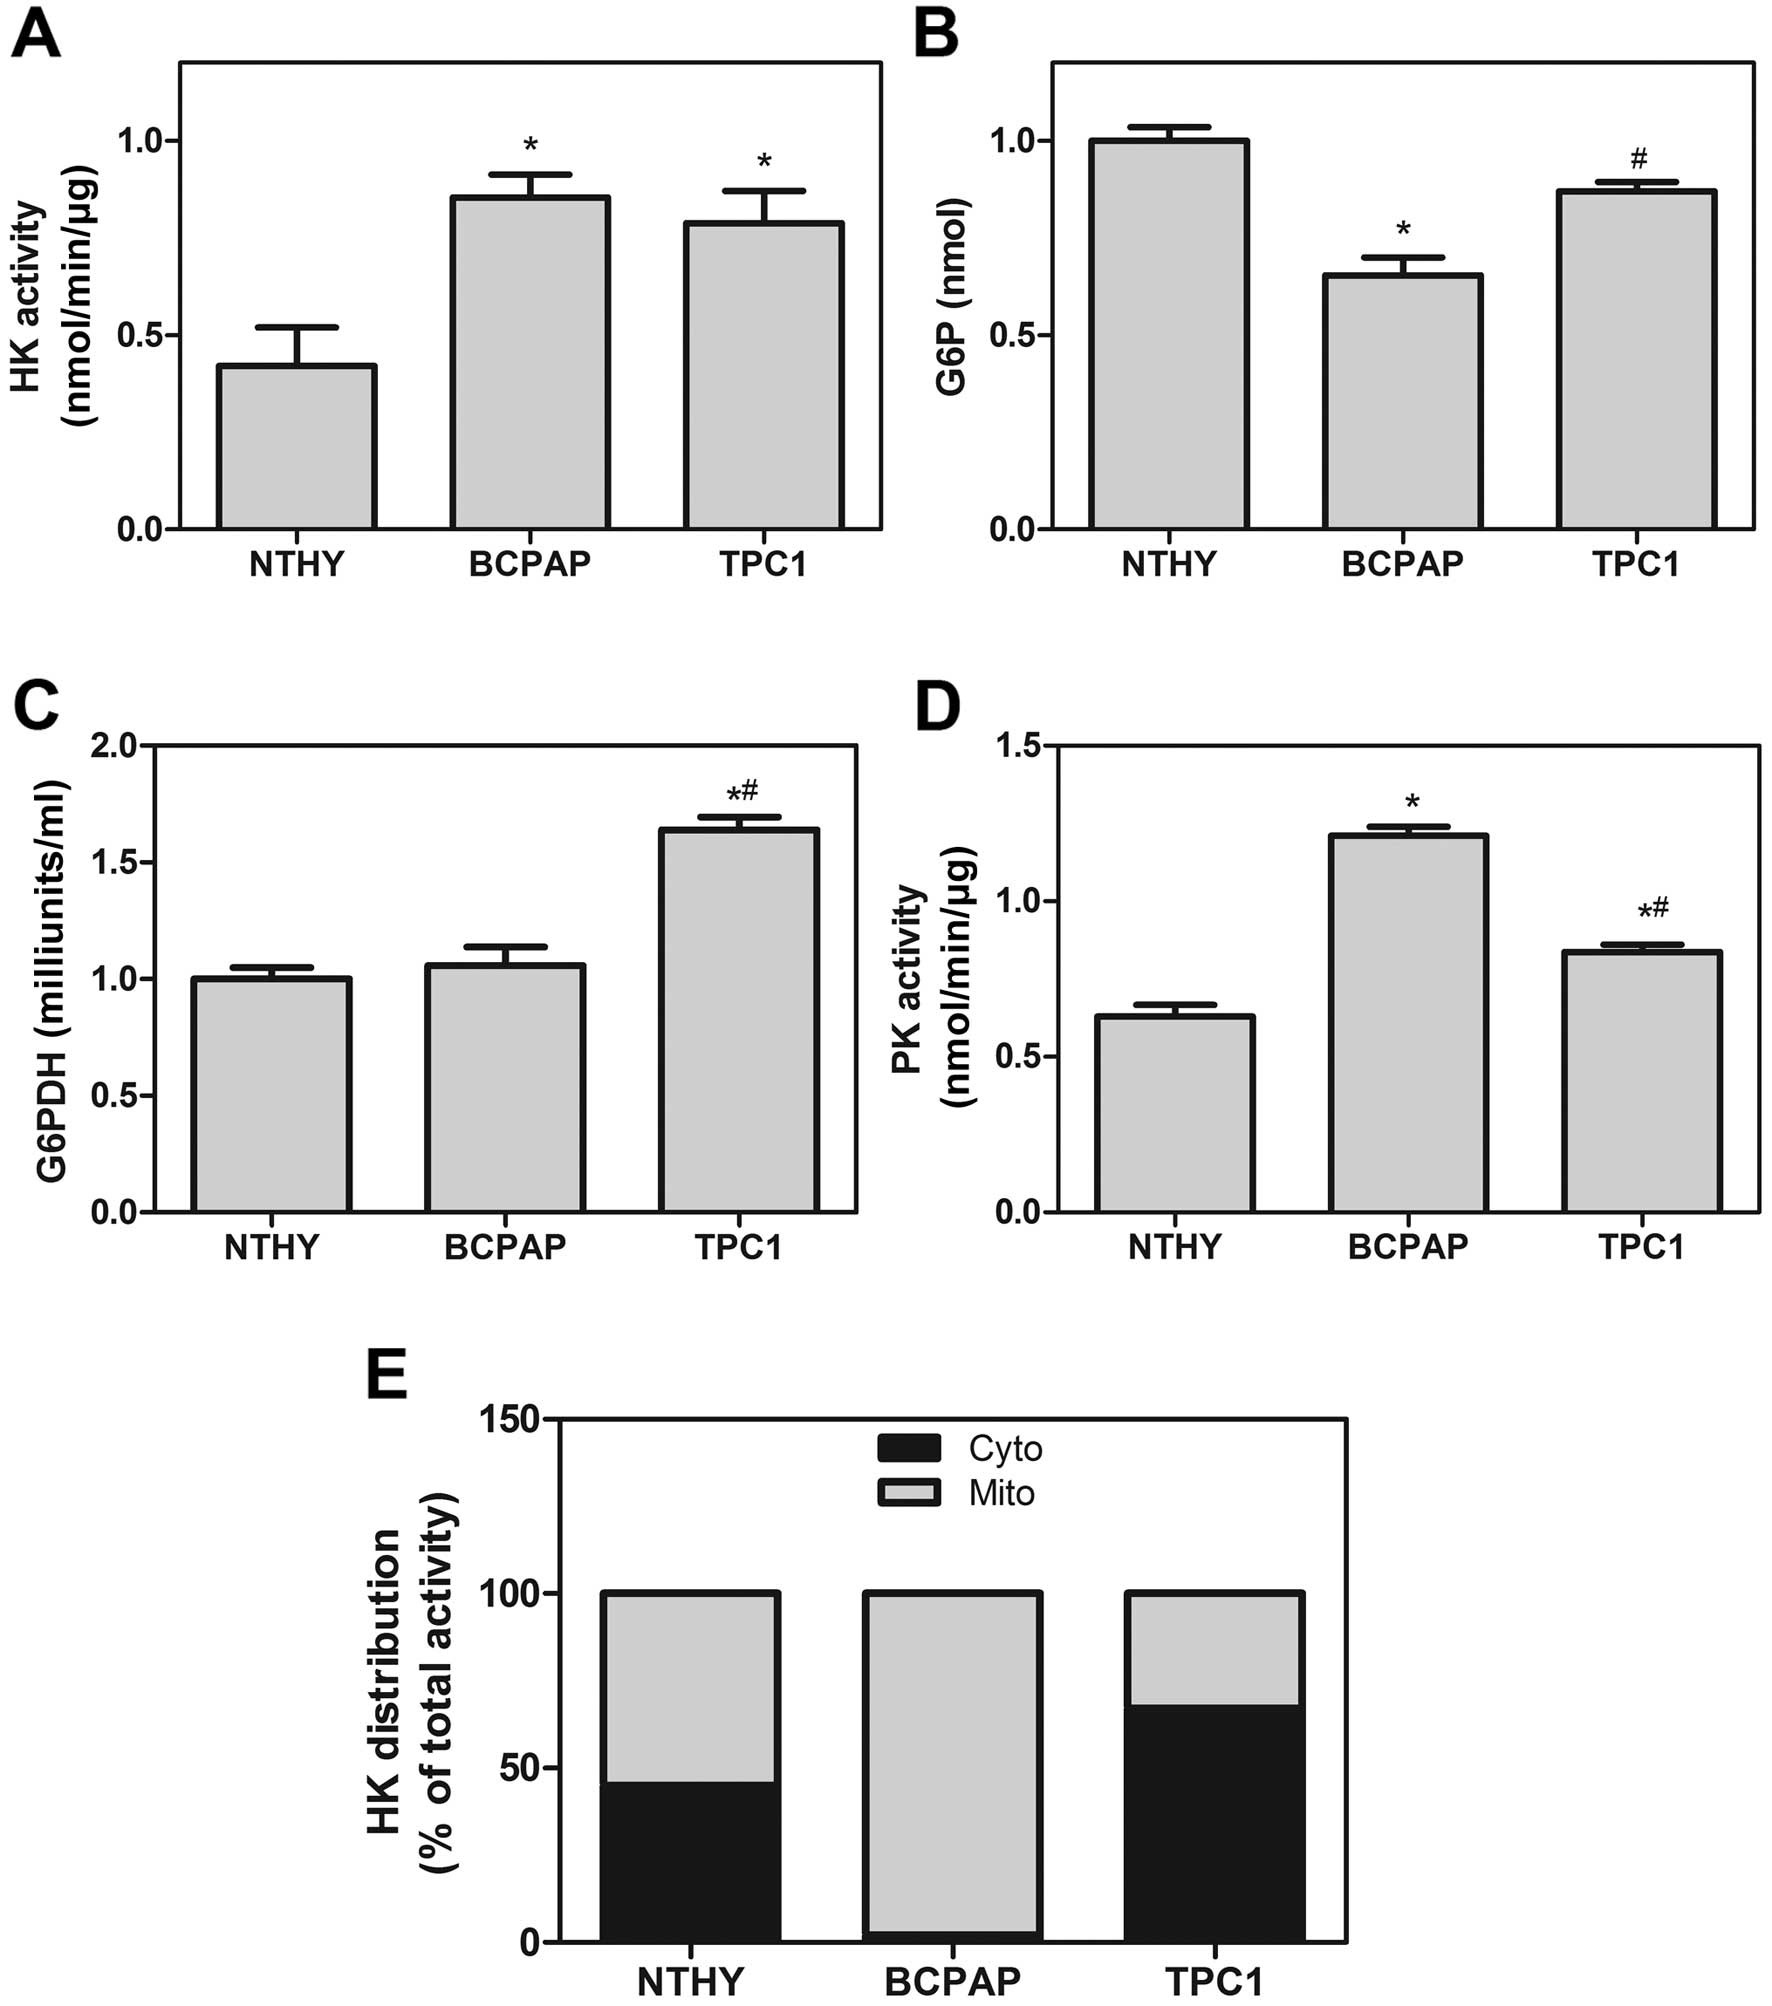
According to previous results, we analyzed the
activity of specific regulatory enzymes of glycolysis and the
pentose phosphate pathway (PPP). As shown in Fig. 3A, we observed a higher HK activity
pattern in the BCPAP and TPC1 cell lines compared to this pattern
in the NTHY-ori cells. However, the amount of G6P in the BCPAP cell
line was lower than that in the TPC1 cells, indicating a difference
in the use of this substrate (Fig.
3B). As G6P is consumed by both glycolysis and PPP, we
evaluated the G6PDH activity, the limiting step enzyme of PPP.
Although, the mRNA levels of G6PDH did not differ among all thyroid
cell lines (data not shown), we observed a higher G6PDH activity in
the TPC1 cells but not in the BCPAP cells (Fig. 3C). Adding to these, we evaluated the
PK activity and our results showed that BCPAP and TPC1 differ from
each other in PK activity (Fig.
3D).
The activity and cell localization of
HK
In Fig. 3A, the HK
activity was the same in both thyroid carcinoma cell lines.
Nevertheless, their activity was different when we analyzed the
specific cell fraction (cytosolic and mitochondrial fractions). In
an attempt to evaluate the degree of HK bound to mitochondria, we
observed that BCPAP cells had >90% of total HK activity present
in the mitochondrial fraction, while NTHY-ori and TPC1 cells had
equally distributed HK activity in both cytosolic and mitochondrial
fractions (Fig. 3E).
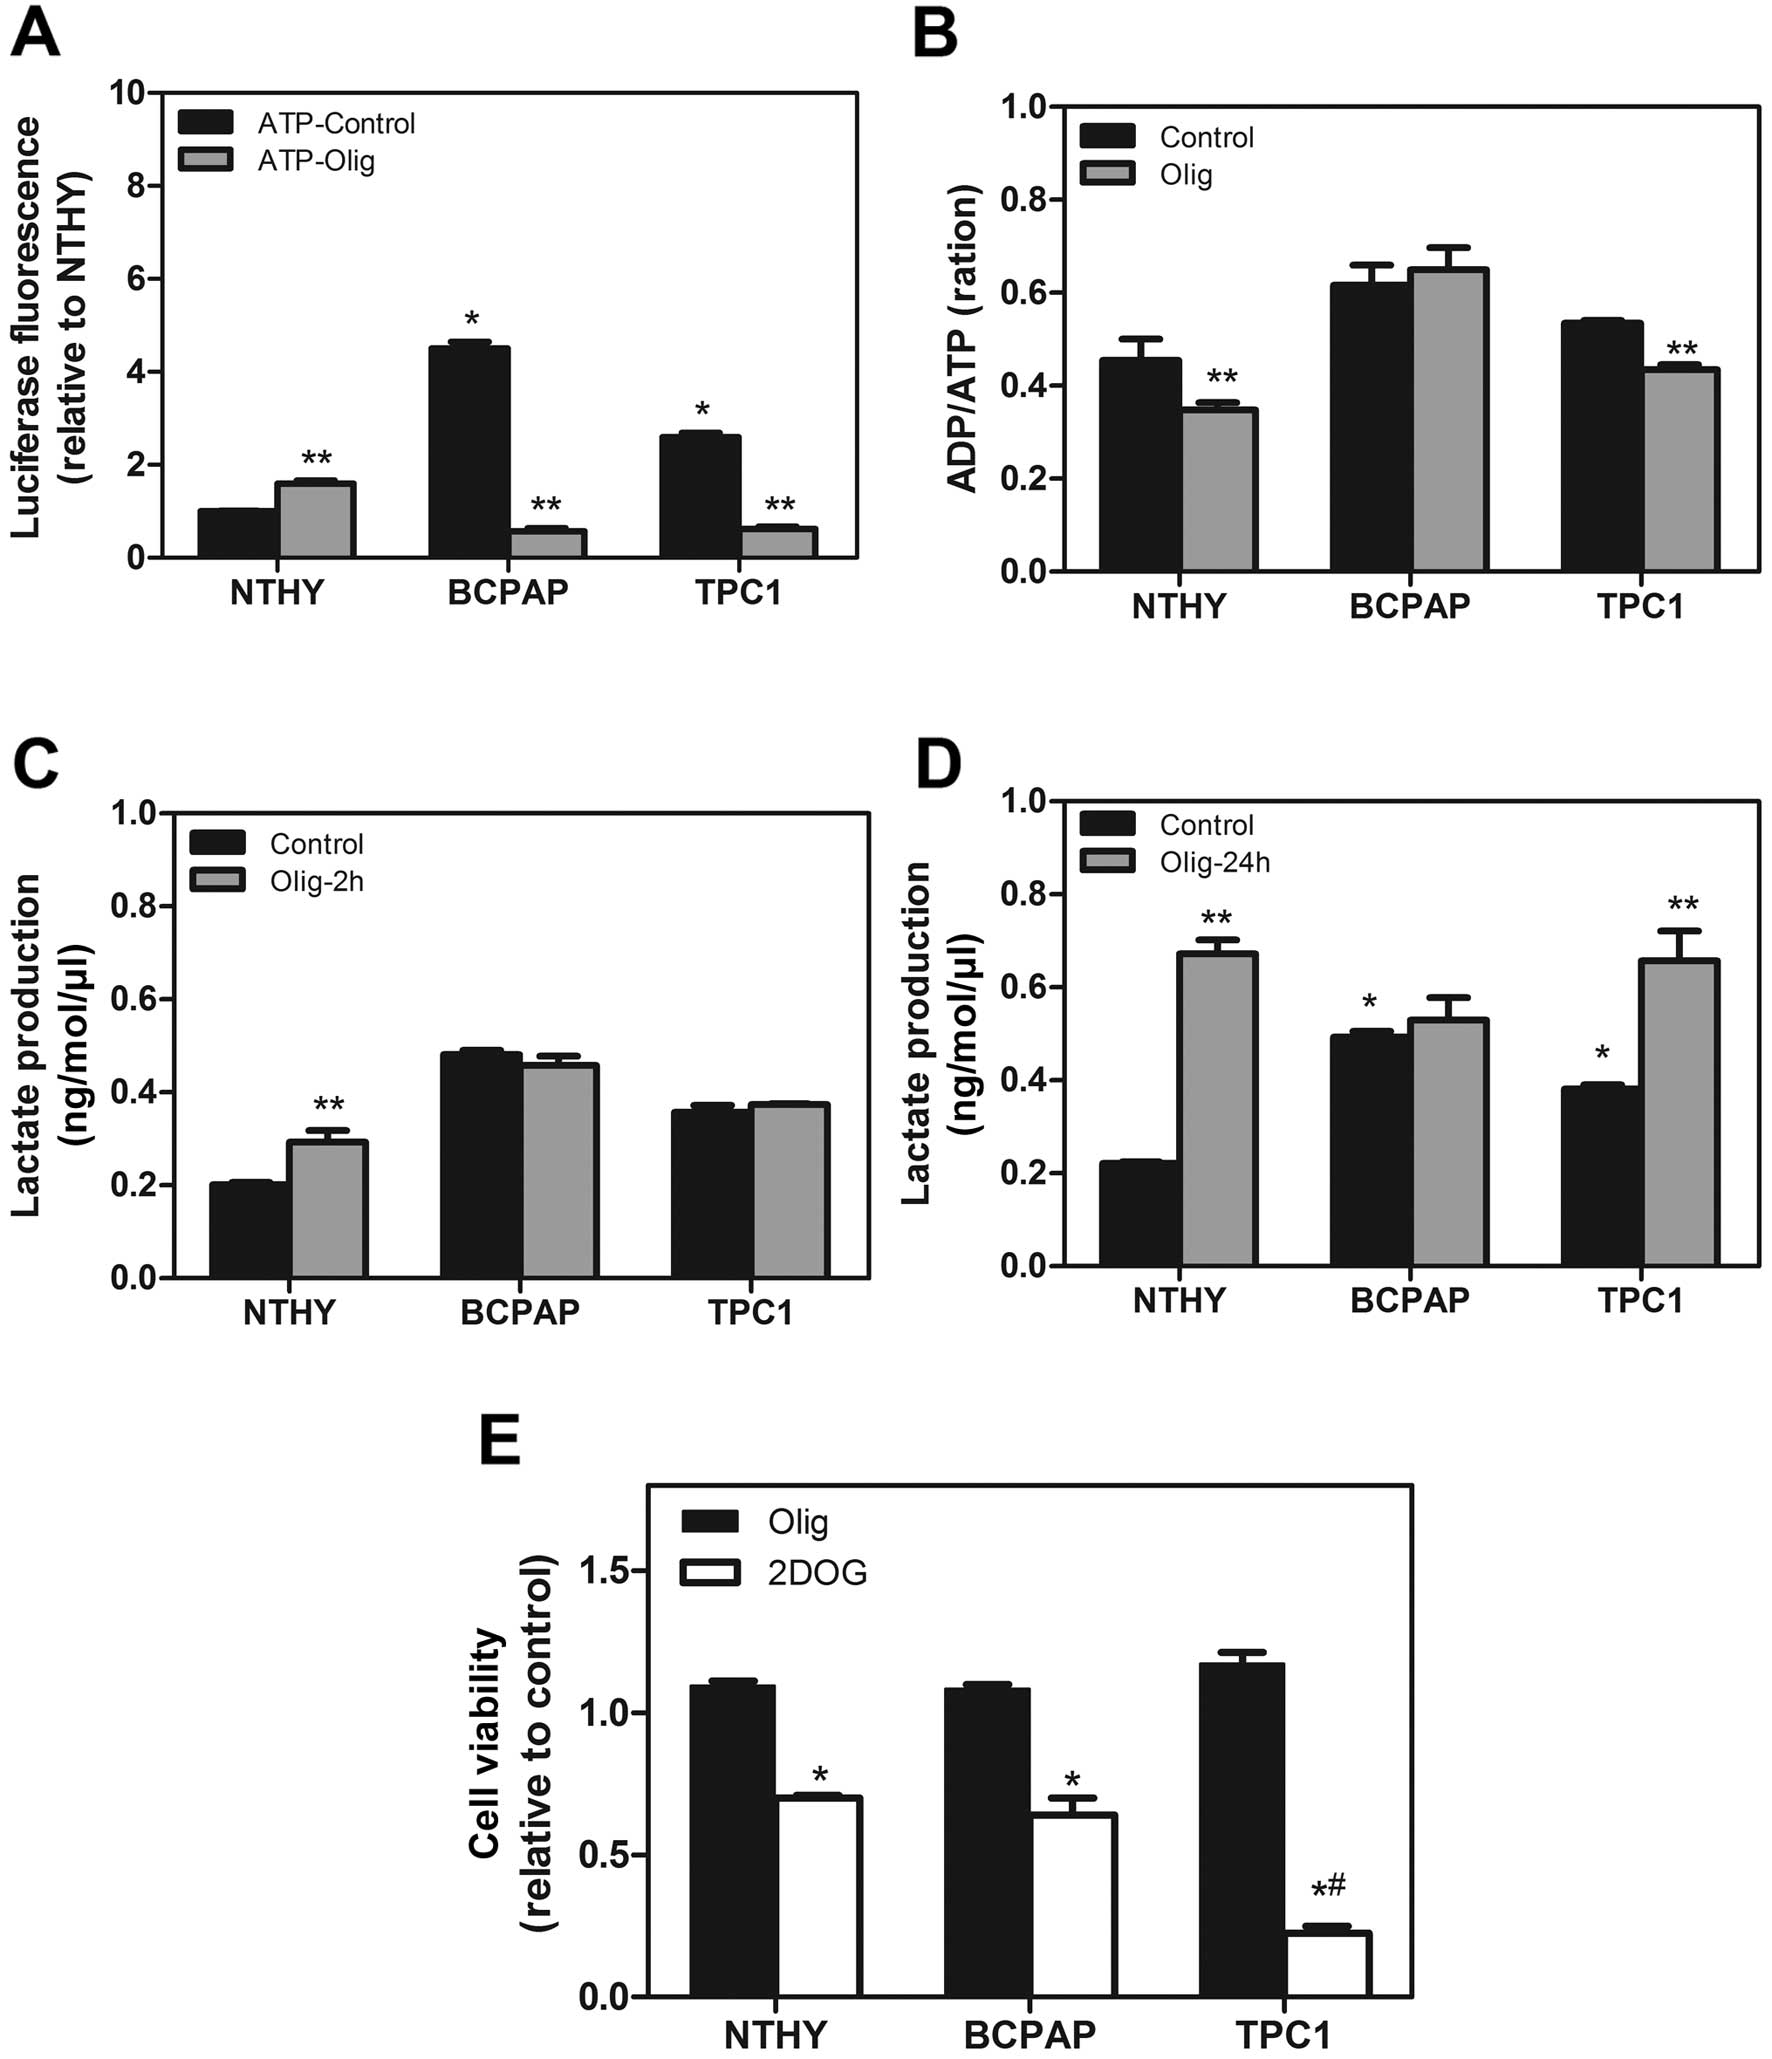
Characterization of different
metabolic pathways for ATP generation
Since our results indicated a high glycolytic
potential in these tumor cell lineages, we then evaluated the
contribution of the different metabolic pathways for ATP generation
in these cells. First, we showed that high levels of ATP and ADP
were found in the BCPAP and TPC1 cells in comparison to the NTHY
cells (Fig. 4A). Second, we
incubated all cells with Olig C, an inhibitor of ATP-synthase
complex V of mitochondria electron transport chain, for 2 h. The
ATP and ADP levels were reduced following treatment with Olig
(Fig. 4A). Moreover, only the NTHY
and TPC1 cells showed a modulation of the ADP/ATP ratio in the
presence of Olig, suggesting a dependency of mitochondrial
oxidative metabolism for ATP generation in TPC1 and non-tumoral
NTHY-ori cells (Fig. 4B). On the
other hand, Olig treatment caused no modulation in the ADP/ATP
content and lactate production in the BCPAP cell line. Yet, the
TPC1 cell line showed an increase in lactate production after 24 h
in the presence of Olig (Fig. 4C and
D). To assess the importance of mitochondrial ATP production to
cell viability, we treated the cells with Olig for 24 h or 2-DOG,
an inhibitor of glycolytic flux. No differences in cell viability
were observed after 24 h of Olig treatment (Fig. 4E) although we found an increase in
lactate production in the TPC1 cells at 24 h (Fig. 4D). However, when we inhibited the
glycolysis pathway using 2 mM of 2-DOG, we observed a decreased in
cell viability after 24 h of incubation in all cell lineages but
the effect was more severe in the BCPAP cells when compared with
this effect in the TPC1 cells (Fig.
4E).
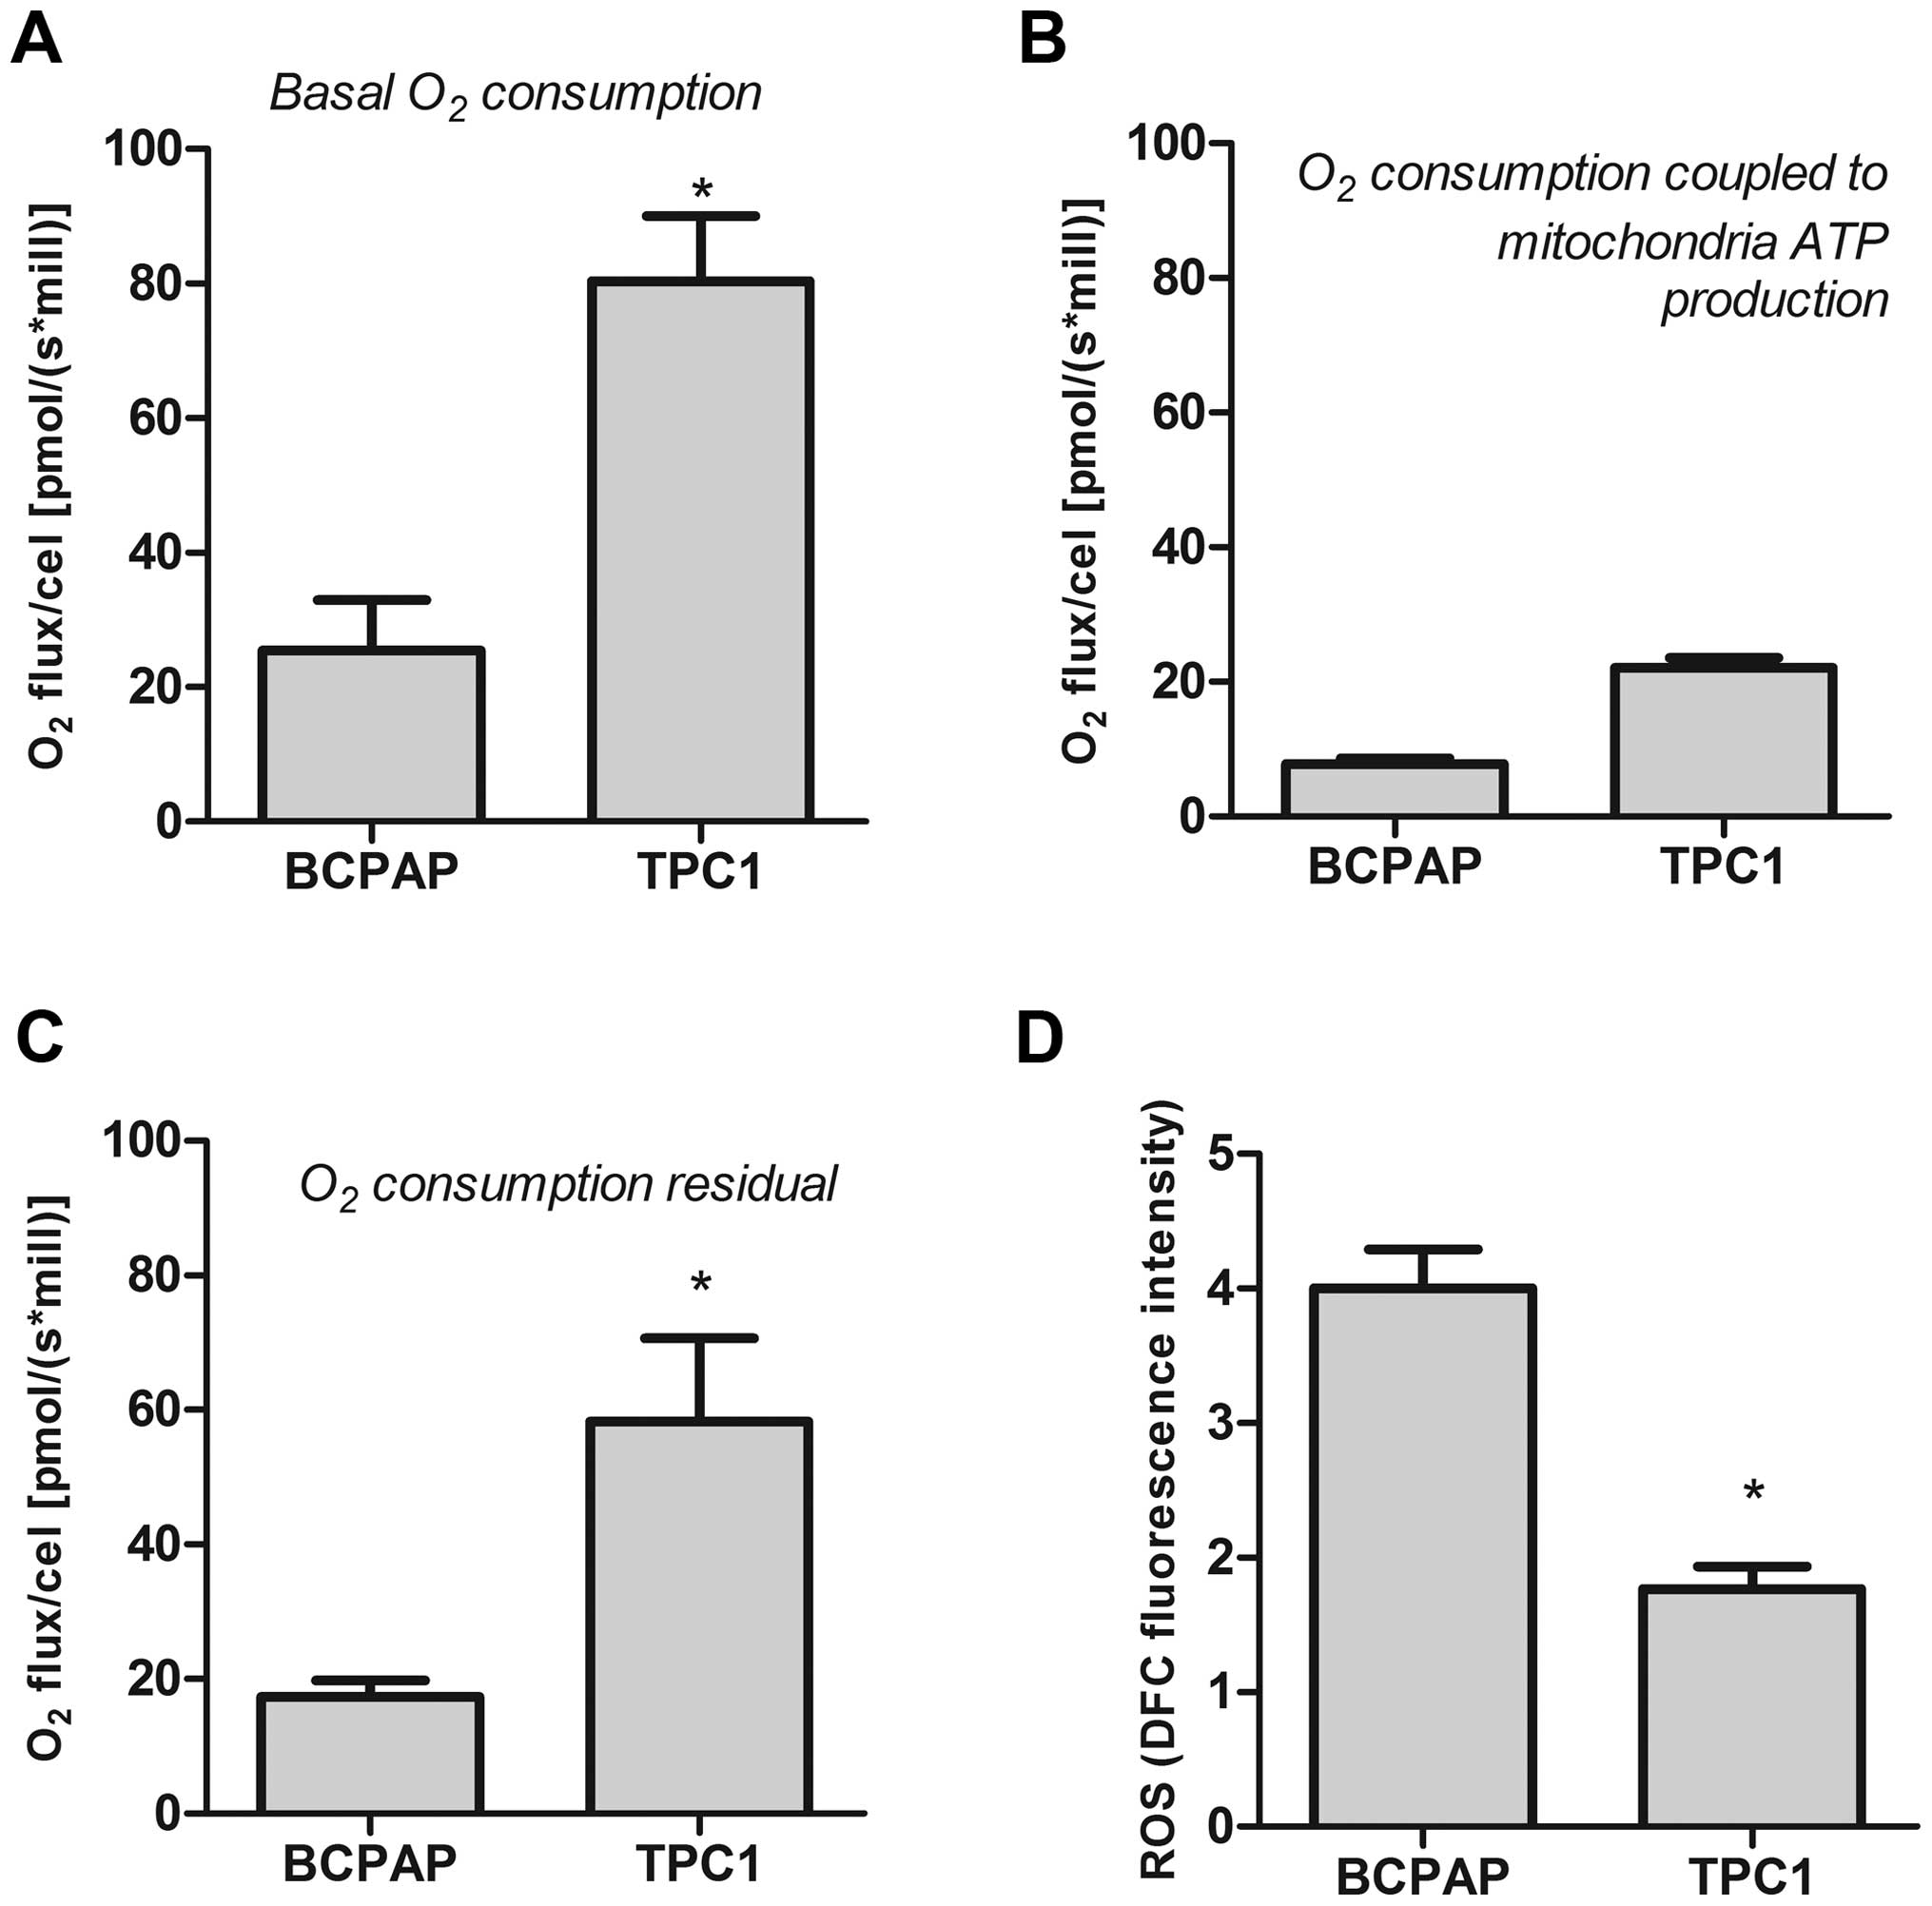
The Warburg effect is present in PTC
cell lines
The above results indicated that the PTC cells are
very different. Because of this finding, we evaluated the oxidative
profile in all thyroid cell lines. Baseline oxygen consumption in
the BCPAP cells was lower than that in the TPC1 cells (Fig. 5A). However, both cell lines showed
lower oxygen consumption coupled to ATP production acquired after
treatment with Olig (2 µg/ml) (Fig.
5B). These results suggest that these cells could redirect the
oxygen to another metabolic pathway. Analysis of residual oxygen,
after inhibition of oxidative phosphorylation in tumor cells by KCN
(2 mM) showed high residual oxygen consumption by both PTC cells
(Fig. 5C). Using a fluorescence
probe, we observed that BCPAP and TPC1 cells produced high ROS
levels. Moreover, the ROS production by the BCPAP cell line was
higher than that noted in the TPC1 cells (Fig. 5D).
Discussion
Although DTC (differentiated thyroid carcinomas) are
slow growing tumors with good prognostics, cellular
dedifferentiation is present in 20–30% of cases, and is usually
accompanied by more aggressive growth, metastatic spread and loss
of iodide uptake ability. Cancer growth is a complex process
depending on several biological factors, such as the chemical
microenvironment of the tumor, its proliferation rate and the
cellular metabolic profile. Over the past years, the bioenergetic
capacities of tumor cells have been the target of intensive
research since many tumors have higher glycolytic rates compared to
normal cells (13,18,20–23).
As a result, there is a great interest in a better understanding of
the cellular mechanisms by which tumor progression and cellular
dedifferentiation occur.
Here, we compared the glycolytic parameters in two
different cell lines derived from thyroid carcinomas of follicular
origin. The TPC1 and BCPAP cells are derived from PTCs, which are
responsible for 80–90% of all thyroid malignancies. Although BCPAP
and TPC1 cells are derived from the same type of thyroid carcinoma,
they show distinct genetic alterations. TPC1 cells show the RET/PTC
translocations found in 13–43% of PTCs, which produces constitutive
activation of the MAPK pathway (8,9). BCPAP
cells present a BRAF V600E mutation, which is a constitutively
active serine-threonine kinase that activates MEK1 and MEK2 in the
MAPK pathway. This mutation is present in 20–70% of papillary
carcinomas (8).
Several studies comparing the glycolytic parameters
between tumor and non-tumor cells have demonstrated that the
Warburg effect is positively correlated with aggressive behavior,
especially in highly proliferative cells (16,17,20–25).
Using these thyroid cancer cell lineages, we confirmed this
hypothesis, since TPC1 and BCPAP cells presented higher glycolytic
efficiency acquired by glucose consumption and lactate production
(Fig. 1). Furthermore, the BCPAP
cell line has rapid growth rates, representing the typical tumor
characteristic. Notably, the TPC1 cell line has the same type of
cell adaptations in the glycolytic parameters analyzed, but a lower
growth rate when compared to the other thyroid tumor cell types.
These results suggest that the differences in glucose metabolism
found in tumor cells are not necessarily a consequence of their
higher growth rate.
High levels of GLUT1 expression in all cell lineages
were observed, which contributed to the elevated glucose uptake and
utilization by these cells (Fig.
2). In non-tumor cells, the glycolysis pathway appears to be
insufficient to maintain the adequate ATP production rate, since it
produces only 2 mol of ATP per mole of glucose (13–15).
These cells are usually dependent on metabolic processes that
require the oxygen molecule to produce ATP and maintain cell energy
demand. Curiously, cancer cells develop a partial anaerobic
ability, and thus do not require oxygen for survival despite their
fast growth rate (15). According
to Gonzalez et al (15),
this cancer characteristic shifts differentiation to
dedifferentiation and proliferative state and some evidence
indicates that aerobic glycolysis is closely associated with
tumorigenesis and plays an important role in cancer development or
malignant characteristics (4,5,15). Our
study used models of two well-differentiated cancer cell lines.
Both cell lines had a higher aerobic glycolysis rate, in accordance
with previous findings (13–16).
Moreover, TPC1 and BCPAP cells had distinct oxidative metabolisms.
Both TPC1 and BCPAP showed lower oxygen consumption ATP-coupled
(Fig. 5B), indicating that the
oxygen consumption of these cells did not drive ATP synthesis. This
result could explain the strong inhibitory effect of Olig on ATP
levels (Fig. 4A). Yet it is
necessary to reinforce that the cell viability 24 h after Olig was
not altered in any cells tested. However, the BCPAP cell line was
strongly affected by glycolysis inhibition (Fig. 4E), featuring a predominantly
glycolytic behavior. Altogether, these results confirm that the
phenomenon described by Warburg is also present in thyroid
carcinoma cell lineages, no matter the degree of cell
differentiation.
However, the TPC1 cell line had a slow growth rate
and was dependent on mitochondria for adequate ATP production and
survival, despite the higher glycolytic efficiency. On the other
hand, BCPAP cells had a high glycolytic efficiency, fast growth
rate and were independent of mitochondria for ATP production and
survival (Figs. 1 and 4).
Our results also demonstrated that mitochondria were
functional in all of the cell types studied. When we used
ATP-synthase complex V inhibitor for 2 h, there was a considerable
reduction in intracellular ATP levels in all thyroid carcinoma
cells. However, the cells were able to reverse the impact exerted
by Olig on ATP production after 24 h (data not shown). On the other
hand, an opposite effect was observed when we used 2-DOG, an
inhibitor of glycolysis (Fig. 4).
These results demonstrated that although mitochondrial activity
exerted a great influence on cell metabolism, BCPAP cell metabolism
was predominantly anaerobic and dependent on the glycolytic
phenotype to survive. The TPC1 cells had a predominant
mitochondrial dependency to maintain ATP production and their
energy status necessary for cell viability. Notably, the TPC1 cell
line showed both a glycolytic phenotype and a similar oxidative
metabolism. This behavior suggests that TPC1 cells have an
intermediate metabolic status, which may explain the less
aggressive behavior of these cells. TPC1 cells may have metabolic
similarity with normal cells which may contribute to increased
resistance to death under stress situations. Chen et al
(25) demonstrated that breast
cancer cells improve their mitochondrial respiratory rate to
increase energy production during metastatic processes in
vivo. Vander Heiden et al (18) also described this metabolic
phenotype shared with nonmalignant proliferative cells.
Furthermore, there is evidence that some solid tumors are able to
retain their oxidative capacities, reverting the aerobic glycolysis
12,24–27.
In thyroid tumors, evidence indicates that
mitochondrial activities are connected with carcinogenesis,
especially in regards to mitochondrial dysfunction (24,26,27).
Other mitochondrial functions are also implicated in cell
differentiation, in calcium homeostasis, in the production of ROS
and regulation of cell death pathways (28,29).
In this context, BCPAP and TPC1 cells showed a relationship between
glycolytic profiles and ROS production. There are several
glycolytic enzymes related to cell survival by mechanisms that
involve mitochondrial activity (8,18,24,25).
Here, we showed HK activity in all cell lineages. HK is considered
as a marker of progression and tumor aggressiveness (23,30,31),
and its activation is implicated in maintaining levels of
intracellular ATP and suppression of apoptosis (32,34).
Although there are four HK isoforms, only HK2 seems to be
overexpressed in cancer cells (34). Our results demonstrated that
expression of both HK2 and HK1 isoforms was upregulated in the
thyroid carcinoma cell lines likewise the specific enzymatic
activity in these cells (Figs. 2
and 3), as has been demonstrated in
human breast and colorectal cancers (32,33).
HK2 has high affinity for glucose and harbors two
catalytic domains that both retain their catalytic activity. In
addition, this isoform has an N-terminal domain that allows it to
bind to the voltage-dependent anion channel (VDAC), located in the
mitochondrial outer membrane. HK2 translocation from the cytoplasm
and its binding to the outer mitochondrial membrane produces a
complex protein that inhibits apoptosis by preventing the
recruitment of pro-apoptotic proteins, such as Bax (34). In addition, HK association to
mitochondria exerts a positive regulation on mitochondrial
transition pore permeability, limiting the production of ROS and
cell death (34).
We thus investigated HK activity in the cytosolic
and mitochondrial fraction in thyroid carcinoma cells. The TPC1
cell line has an equal distribution of HK activity in these
subcellular fractions different than what we found in the BCPAP
carcinoma cells (Fig. 3E). These
data suggest that HK associated to mitochondria is upregulated in
thyroid carcinoma cells and this mechanism may be involved in
glycolysis activation and a fast growth rate.
Hanahan and Weinberg (21) proposed that cancer cells show a
reprogramming of metabolic pathways and another glycolytic enzyme
that has been studied is PK. Mazurek (35) reported that cancer cells gradually
lose the PKM1 isoform and replace it by PKM2. For this reason, PKM2
as well as HK, is considered a link between oncogenes and
reprogramming metabolism (30,35).
Our results showed that thyroid carcinomas cells had enhanced
expression of PKM2 mRNA but not PKM1 mRNA (Fig. 2). Yet, the PK activity in BCPAP
cells was higher compared to that noted in the TPC1 cells (Fig. 3). The role of PKM2 in cancer
metabolism is to drive the precursors originated during glycolysis
to the synthesis of macromolecules and to produce redox potential
such as NADPH molecules by PPP.
As far as we are concerned, the mechanisms related
to these metabolic changes and the strategies to ensure cell growth
and survival, have not yet been unraveled. The literature suggests
that the AMPK pathway may play a role in the metabolic changes
observed in cancer cells (6,27,29,36,37).
AMPK activation has been presented in response to microenvironment
energy stress and increased energy consumption in proliferating
tumor cells (36). Recently, we
demonstrated that AMPK is overexpressed in human PTCs and the
cancer cell lines BCPAP and TPC1 have constitutively higher p-AMPK
expression than the non-tumor-derived thyroid cell line NTHY-Ori
(38). Thus, corroborating Faubert
et al (37), our results
suggest a possible involvement of AMPK in the cellular phenotype
found in our research (38).
In conclusion, the metabolic shift described by
Warburg in several cancer models was present in the BCPAP and TPC1
cell lines analyzed in our study. However, there were important
differences between the PTC cell lines. Better understanding of the
mechanisms involved in this glycolytic phenotype, demonstrated here
for the first time, as well as the changes observed in
mitochondrial metabolism, could elucidate new therapeutic
perspectives for these distinct cell types.
Acknowledgements
This study was supported by grants from the Conselho
Nacional de Desenvolvimento Científco e Tecnológico (CNPq),
Fundação de Amparo à Pesquisa do Estado do Rio de Janeiro (FAPERJ),
and Coordenação de Aperfeiçoamento de Pessoal de Nível Superior
(CAPES).
References
|
1
|
Davies L and Welch HG: Increasing
incidence of thyroid cancer in the United States, 1973–2002. JAMA.
295:2164–2167. 2006. View Article : Google Scholar : PubMed/NCBI
|
|
2
|
Pilli T, Prasad KV, Jayarama S, Pacini F
and Prabhakar BS: Potential utility and limitations of thyroid
cancer cell lines as models for studying thyroid cancer. Thyroid.
19:1333–1342. 2009. View Article : Google Scholar : PubMed/NCBI
|
|
3
|
Pacini F, Cetani F, Miccoli P, Mancusi F,
Ceccarelli C, Lippi F, Martino E and Pinchera A: Outcome of 309
patients with metastatic differentiated thyroid carcinoma treated
with radioiodine. World J Surg. 18:600–604. 1994. View Article : Google Scholar : PubMed/NCBI
|
|
4
|
Nikiforova MN and Nikiforov YE: Molecular
genetics of thyroid cancer: Implications for diagnosis, treatment
and prognosis. Expert Rev Mol Diagn. 8:83–95. 2008. View Article : Google Scholar : PubMed/NCBI
|
|
5
|
van Staveren WC, Solís DW, Delys L, Duprez
L, Andry G, Franc B, Thomas G, Libert F, Dumont JE, Detours V, et
al: Human thyroid tumor cell lines derived from different tumor
types present a common dedifferentiated phenotype. Cancer Res.
67:8113–8120. 2007. View Article : Google Scholar : PubMed/NCBI
|
|
6
|
Andrade BM and Carvalho DP: Perspective of
the AMP-activated kinase (AMPK) signaling pathway in thyroid
cancer. Biosci Rep. 34:181–187. 2014. View Article : Google Scholar
|
|
7
|
Andrade BM, Cazarin J, Zancan P and
Carvalho DP: AMP-activated protein kinase upregulates glucose
uptake in thyroid PCCL3 cells independent of thyrotropin. Thyroid.
22:1063–1068. 2012. View Article : Google Scholar : PubMed/NCBI
|
|
8
|
Kimura ET, Nikiforova MN, Zhu Z, Knauf JA,
Nikiforov YE and Fagin JA: High prevalence of BRAF mutations in
thyroid cancer: Genetic evidence for constitutive activation of the
RET/PTC-RAS-BRAF signaling pathway in papillary thyroid carcinoma.
Cancer Res. 63:1454–1457. 2003.PubMed/NCBI
|
|
9
|
Xing M: BRAF mutation in thyroid cancer.
Endocr Relat Cancer. 12:245–262. 2005. View Article : Google Scholar : PubMed/NCBI
|
|
10
|
Nikiforov YE and Nikiforova MN: Molecular
genetics and diagnosis of thyroid cancer. Nat Rev Endocrinol.
7:569–580. 2011. View Article : Google Scholar : PubMed/NCBI
|
|
11
|
Xing M: Molecular pathogenesis and
mechanisms of thyroid cancer. Nat Rev Cancer. 13:184–199. 2013.
View Article : Google Scholar : PubMed/NCBI
|
|
12
|
Bläser D, Maschauer S, Kuwert T and Prante
O: In vitro studies on the signal transduction of thyroidal uptake
of 18F-FDG and 131I–Iodide. J Nucl Med.
47:1382–1388. 2006.PubMed/NCBI
|
|
13
|
Gatenby RA and Gillies RJ: Why do cancers
have high aerobic glycolysis? Nat Rev Cancer. 4:891–899. 2004.
View Article : Google Scholar : PubMed/NCBI
|
|
14
|
Warburg O: On respiratory impairment in
cancer cells. Science. 124:269–270. 1956.PubMed/NCBI
|
|
15
|
Gonzalez MJ, Massari JR Miranda, Duconge
J, Riordan NH, Ichim T, Quintero-Del-Rio AI and Ortiz N: The
bio-energetic theory of carcinogenesis. Med Hypotheses. 79:433–439.
2012. View Article : Google Scholar : PubMed/NCBI
|
|
16
|
Zhao Y, Butler EB and Tan M: Targeting
cellular metabolism to improve cancer therapeutics. Cell Death Dis.
4:e5322013. View Article : Google Scholar : PubMed/NCBI
|
|
17
|
Amoêdo ND, Valencia JP, Rodrigues MF,
Galina A and Rumjanek FD: How does the metabolism of tumor cells
differ from that of normal cells. Biosci Rep. 33:e000802013.doi:
10.1042/BSR20130066. View Article : Google Scholar : PubMed/NCBI
|
|
18
|
Heiden MG Vander, Cantley LC and Thompson
CB: Under-standing the Warburg effect: The metabolic requirements
of cell proliferation. Science. 324:1029–1033. 2009. View Article : Google Scholar : PubMed/NCBI
|
|
19
|
Schmittgen TD and Livak KJ: Analyzing
real-time PCR data by the comparative C(T) method. Nat Protoc.
3:1101–1108. 2008. View Article : Google Scholar : PubMed/NCBI
|
|
20
|
Coelho RG, Calaça IC, Celestrini DM,
Correia AH, Costa MA and Sola-Penna M: Clotrimazole disrupts
glycolysis in human breast cancer without affecting non-tumoral
tissues. Mol Genet Metab. 103:394–398. 2011. View Article : Google Scholar : PubMed/NCBI
|
|
21
|
Hanahan D and Weinberg RA: Hallmarks of
cancer: The next generation. Cell. 144:646–674. 2011. View Article : Google Scholar : PubMed/NCBI
|
|
22
|
Moreno-Sánchez R, Marín-Hernández A,
Saavedra E, Pardo JP, Ralph SJ and Rodríguez-Enríquez S: Who
controls the ATP supply in cancer cells? Biochemistry lessons to
understand cancer energy metabolism. Int J Biochem Cell Biol.
50:10–23. 2014. View Article : Google Scholar : PubMed/NCBI
|
|
23
|
Soga T: Cancer metabolism: Key players in
metabolic reprogramming. Cancer Sci. 104:275–281. 2013. View Article : Google Scholar : PubMed/NCBI
|
|
24
|
Vaupel P and Mayer A: Availability, not
respiratory capacity governs oxygen consumption of solid tumors.
Int J Biochem Cell Biol. 44:1477–1481. 2012. View Article : Google Scholar : PubMed/NCBI
|
|
25
|
Chen EI, Hewel J, Krueger JS, Tiraby C,
Weber MR, Kralli A, Becker K, Yates JR III and Felding-Habermann B:
Adaptation of energy metabolism in breast cancer brain metastases.
Cancer Res. 67:1472–1486. 2007. View Article : Google Scholar : PubMed/NCBI
|
|
26
|
Chen JQ and Russo J: Dysregulation of
glucose transport, glycolysis, TCA cycle and glutaminolysis by
oncogenes and tumor suppressors in cancer cells. Biochim Biophys
Acta. 1826:370–384. 2012.PubMed/NCBI
|
|
27
|
Arciuch VG Antico, Russo MA, Kang KS and
Di Cristofano A: Inhibition of AMPK and Krebs cycle gene expression
drives metabolic remodeling of Pten-deficient preneoplastic thyroid
cells. Cancer Res. 73:5459–5472. 2013. View Article : Google Scholar : PubMed/NCBI
|
|
28
|
Dodson M, Darley-Usmar V and Zhang J:
Cellular metabolic and autophagic pathways: Traffic control by
redox signaling. Free Radic Biol Med. 63:207–221. 2013. View Article : Google Scholar : PubMed/NCBI
|
|
29
|
Stankov K, Biondi A, D'Aurelio M, Gasparre
G, Falasca A, Romeo G and Lenaz G: Mitochondrial activities of a
cell line derived from thyroid Hürthle cell tumors. Thyroid.
16:325–331. 2006. View Article : Google Scholar : PubMed/NCBI
|
|
30
|
Mathupala SP, Ko YH and Pedersen PL:
Hexokinase-2 bound to mitochondria: Cancer's stygian link to the
‘Warburg effect’ and a pivotal target for effective therapy. Semin
Cancer Biol. 19:17–24. 2009. View Article : Google Scholar : PubMed/NCBI
|
|
31
|
Ros S and Schulze A: Glycolysis back in
the limelight: Systemic targeting of HK2 blocks tumor growth.
Cancer Discov. 3:1105–1107. 2013. View Article : Google Scholar : PubMed/NCBI
|
|
32
|
Pastorino JG, Shulga N and Hoek JB:
Mitochondrial binding of hexokinase II inhibits Bax-induced
cytochrome c release and apoptosis. J Biol Chem. 277:7610–7618.
2002. View Article : Google Scholar : PubMed/NCBI
|
|
33
|
Marini C, Salani B, Massollo M, Amaro A,
Esposito AI, Orengo AM, Capitanio S, Emionite L, Riondato M,
Bottoni G, et al: Direct inhibition of hexokinase activity by
metformin at least partially impairs glucose metabolism and tumor
growth in experimental breast cancer. Cell Cycle. 12:3490–3499.
2013. View Article : Google Scholar : PubMed/NCBI
|
|
34
|
Wilson JE: Isozymes of mammalian
hexokinase: Structure, subcellular localization and metabolic
function. J Exp Biol. 206:2049–2057. 2003. View Article : Google Scholar : PubMed/NCBI
|
|
35
|
Mazurek S: Pyruvate kinase type M2: a key
regulator within the tumour metabolome and a tool for metabolic
profiling of tumours. Ernst Schering Found Symp Proc. 2007:99–124.
2007.
|
|
36
|
Vidal AP, Andrade BM, Vaisman F, Cazarin
J, Pinto LF, Breitenbach MM, Corbo R, Caroli-Bottino A, Soares F,
Vaisman M, et al: AMP-activated protein kinase signaling is
upregulated in papillary thyroid cancer. Eur J Endocrinol.
169:521–528. 2013. View Article : Google Scholar : PubMed/NCBI
|
|
37
|
Faubert B, Boily G, Izreig S, Griss T,
Samborska B, Dong Z, Dupuy F, Chambers C, Fuerth BJ, Viollet B, et
al: AMPK is a negative regulator of the Warburg effect and
suppresses tumor growth in vivo. Cell Metab. 17:113–124. 2013.
View Article : Google Scholar : PubMed/NCBI
|
|
38
|
Cazarin JM, Coelho RG, Hecht F, Andrade BM
and Carvalho DP: 5′-AMP-activated protein kinase regulates
papillary (TPC-1 and BCPAP) thyroid cancer cell survival,
migration, invasion, and epithelial-to-mesenchymal transition.
Thyroid. 26:933–942. 2016. View Article : Google Scholar : PubMed/NCBI
|