Introduction
Solid tumors such as colorectal cancer (CRC) consist
of a heterogeneous population of cancer cells. Among these cell
populations, cancer stem cells (CSCs) are a limited population that
possess self-renewing ability as well as the ability to initiate a
heterogeneous tumor in serially transplanted immunodeficient mice.
Due to this ability, CSCs are thought to be located at the top of
the hierarchy of tumor differentiation (1–3). CSCs
are in a quiescent state and have mechanisms to reduce reactive
oxidative stress, leading to resistance to chemotherapy or
radiotherapy. Furthermore, CSCs change their biological
characteristics depending on their microenvironments to develop
distant metastasis. CSCs are therefore thought to be responsible
for cancer recurrence and metastasis (4–7). Based
on these concepts, CSCs are considered to be the most important
treatment target to overcome cancers.
Surface markers of CSCs have been explored in the
last decade (8–10). The transmembrane glycoprotein CD44,
a receptor of hyaluronic acid, is a CSC marker in various cancers
(8,11). Dalerba et al revealed that
the EpCAMhigh/CD44+ population of CRC cells
has the ability to produce a xenograft tumor in immunodeficient
mice, suggesting that these cells may be the CSC population of CRC
(12). However, CSC selection
according to the expression of CD44 and EpCAM molecules was not
sufficient to identify genuine colorectal CSCs since tumor cells
with other markers, such as CD133 or ALDH1, also produce xenograft
tumors regardless of CD44 expression (13,14).
Therefore, additional markers are required to more precisely
identify colorectal CSCs.
Recently, Sada et al reported that two
molecularly distinct stem cell populations reside in the
interfollicular epidermis of adult skin (15). Although these two stem cell
populations contribute to maintenance of homeostasis in their
territories, they participate in injury repair in both territories.
Pathologically distinct populations of CSCs have never been
identified in tumors. Since tumors consist of heterogeneous
populations, pathologically distinct populations of CSCs may reside
in tumors.
E-cadherin is a member of the cadherin superfamily
and is preferentially expressed in epithelial cells. E-cadherin
mediates cell-cell adhesion through its extracellular domain in the
presence of calcium ions. In the cytoplasm, E-cadherin is
associated with α-, β- and p120-catenin, which in turn bind to
actin filaments. E-cadherin is not only important for regulation of
cell-cell contact, but it also plays a role in regulation of signal
transduction pathways via actin filaments. Recently, E-cadherin was
reported to be an essential molecule for the self-renewing process
of embryonic stem cells (16). In
this previous study, it was demonstrated that E-cadherin regulated
human embryonic stem cell self-renewal through interaction with
Rap1. E-cadherin was also revealed to suppress cancer cell
proliferation in CRC (17).
N-cadherin is also important for maintenance of stemness of
hematopoietic stem cells. Although cadherins are important for
maintenance of stem cell properties and cell proliferation, whether
E-cadherin regulates stemness and cell proliferation in colorectal
CSCs is unclear.
We hypothesized that E-cadherin is essential for the
maintenance of properties of colorectal CSCs. We examined the
impact of E-cadherin expression on colorectal CSCs using human
clinical samples. EpCAMhigh/CD44+ CSCs
contained both E-cadherin-positive (EC+) and -negative
(EC−) cells. Surprisingly, EC+ cells
exhibited higher tumor growth potential than EC− cells
in vivo. Upregulation of NANOG, which is a key molecule for
induction of the proliferation of embryonic stem cells, may
contribute to the higher tumor growth potential of EC+
colorectal CSCs.
Materials and methods
Patients and tumor tissues
From July 2009 to December 2013, surgical specimens
of CRC patients were collected for this study after written
informed consent was obtained from patients at Kyushu University
Hospital. The study protocol was approved by the Institutional
Review Board of Kyushu University Hospital in 2009. In total, 18
samples (from 9 males and 9 females, mean age 64.6 years old) were
used for this study and all samples were obtained from the primary
site of CRC. As shown in Table I,
most cases had well or moderately differentiated
adenocarcinomas.
 | Table I.Patient characteristics. |
Table I.
Patient characteristics.
| No. | Age | Sex | Primary site | Histology | Stagea |
|---|
| #6 | 42 | M | R | Mod | IIIA |
| #7 | 51 | M | T | Well to mod | I |
| #8 | 83 | M | A | Mod to poor | IVA |
|
#24 | 77 | M | R | Well | IIA |
|
#44 | 43 | F | R | Mod | IIA |
|
#49 | 60 | M | T | Mod | IIA |
|
#50 | 72 | F | C | Poor | IIB |
|
#58 | 78 | F | S | Mod | IIA |
|
#62 | 77 | F | A | Well | IVA |
|
#63 | 43 | F | A | Well to mod | IIIC |
|
#64 | 74 | M | A | Well to mod | IIA |
|
#70 | 58 | M | S | Well | IIA |
|
#71 | 63 | F | R | Well to mod | IIA |
|
#74 | 72 | F | D | Mod | IIA |
| #180 | 72 | M | A | Well to Mod | IIIB |
| #182 | 61 | F | C | Well | IIIB |
| #187 | 73 | F | C | Poor | IIIC |
| #211 | 63 | M | R | Well | IIIC |
Tumor cell isolation
CRC tissue and normal colon tissue from surgical
specimens were mechanically minced into small fragments using a
scalpel and scissors in serum-free cell culture medium (RPMI-1640;
Wako Pure Chemicals Industries, Ltd., Osaka, Japan). The fragments
were enzymatically digested by agitating in HEPES (Wako Pure
Chemicals Industries, Ltd.) supplemented with 200 U/ml collagenase
type III (Merck Millipore, Darmstadt, Germany) and 100 U/ml DNase I
(Takara Bio Inc., Shiga, Japan) for 2 h at 37°C. The cells were
then filtered through 100-µm and 40-µm nylon meshes, and the
remaining cells were resuspended in serum-free medium.
Flow cytometry and cell-sorting
experiments
Isolated cancer cells from surgical specimens were
resuspended in FCM buffer (HBSS containing 2% FBS supplemented with
100 U/ml penicillin, 100 µg/ml streptomycin, 50 µg/ml ceftazidime,
0.25 µg/ml amphotericin-B, 1 mM EDTA, and 1 mM sodium pyruvate) for
incubation with fluorescein-labeled antibodies. PE-conjugated
anti-CD44 antibody (1:50; cat. no. 561858; BD Biosciences, San
Jose, CA, USA) and APC-conjugated anti-EpCAM antibody (1:50; cat.
no. 324207; BioLegend, Inc., San Diego, CA, USA) were added, and
the cells were incubated for 1 h on ice in the dark. After
incubation, the cells were washed twice with PBS and then
resuspended in FCM buffer. Flow cytometry was performed using
FACSAria II (BD Biosciences, Franklin Lakes, NJ, USA). The viable
mononuclear single cell population was gated by forward scatter and
propidium iodide staining, and was then sorted with CD44, EpCAM and
E-cadherin.
Immunodeficient mice and
xenotransplantation
NOD/SCID mice were purchased from The Jackson
Laboratory (Bar Harbor, ME, USA). They were housed in groups of 1–4
per cage in a light-controlled room (lights on 7 a.m. to 7 p.m.) at
a room temperature of 24±1°C with food and water ad libitum.
Forty-six mice (27 males and 19 females) were used. The indicated
numbers of sorted tumor cells were resuspended in 200 µl BD
Matrigel (BD Biosciences, Franklin Lakes, NJ, USA) plus medium. The
cell-Matrigel suspension was subcutaneously injected into the
opposite flanks of 6-to 8-week-old NOD/SCID mice using a 23-gauge
syringe. Tumor formation was observed for up to 6 months. The mice
were sacrificed under anesthesia when the tumor size reached a
maximum diameter of 20 mm. Xenograft tumors were then isolated from
the mice and further analyzed using the same analysis techniques as
those used for human colorectal samples or were fixed in 10%
formalin solution. All animal experiments were performed in
accordance with the Institutional Animal Welfare Guidelines of
Kyushu University.
Immunohistochemistry and
immunofluorescence
Formalin-fixed xenograft tumors were cut into 5
µm-thick serial sections and immunohistochemical studies were
performed with avidin-biotin-peroxidase complex kits (Vector
Laboratories, Burlingame, CA, USA) according to the manufacturer's
instructions. The sections were then counterstained with
hematoxylin. For immunofluorescence analysis, the slides were
counterstained with DAPI and mounted. The primary antibodies used
in this study were: Anti-E-cadherin (1:50; cat. no. sc-31021; Santa
Cruz Biotechnology, Inc., Santa Cruz, Dallas, TX, USA), anti-CD44
(1:100; cat. no. 550538; BD Biosciences, San Jose, CA, USA), and
anti-NANOG (1:100; cat. no. 4903; Cell Signaling Technology,
Danvers, MA, USA).
mRNA isolation and cDNA array
Total RNA was isolated from both EC+
cells and EC− cells, using TRIzol (Invitrogen; Thermo
Fisher Scientific, Inc., Carlsbad, CA, USA) and was purified using
the SV Total RNA Isolation System (Promega Corp., Madison, WI,
USA), according to the manufacturer's instructions. The quality and
quantity of the RNA samples obtained were verified using the
Experion System (Bio-Rad Laboratories, Hercules, CA, USA) and an
ND-1000 Spectrophotometer (NanoDrop Technologies; Thermo Fisher
Scientific, Inc., Wilmington, DE, USA). The cRNA was amplified,
labeled, and hybridized to a 60K Agilent 60-mer oligomicroarray
according to the manufacturer's instructions. All hybridized
microarray slides were scanned using an Agilent scanner (Agilent
Technologies, Santa Clara, CA, USA). Relative hybridization
intensities and background hybridization values were calculated
using Agilent Feature Extraction Software (version 9.5.1.1). Raw
signal intensities and flags for each probe were calculated from
hybridization intensities (gProcessedSignal), and spot information
(gIsSaturated) according to the procedures recommended by Agilent.
The raw signal intensities of two samples were
log2-transformed and normalized using a quantile
algorithm with the ‘preprocessCore’ library package (18) on Bioconductor software (19). We selected probes that called a ‘P’
flag in both samples. To identify upregulated or downregulated
genes, we calculated Z-scores (20)
and ratios (non-log scaled fold-change) from the normalized signal
intensities of each probe for comparison between the control and
experimental samples. We then established the following criteria
for regulated genes: (upregulated genes) Z-score ≥2.0 or ratio
≥1.5-fold, (downregulated genes) Z-score ≤-2.0 or ratio ≤0.66.
RNA interference for NANOG
Pre-designed NANOG siRNA was purchased from
Thermo Fisher Scientific, Inc. (Waltham, MA, USA). HCT116 cells
were seeded in 35-mm dishes and transfected with control siRNA or
NANOG siRNA using Lipofectamine 3000 according to the
manufacturer's instructions (Thermo Fisher Scientific, Inc.).
Ninety-six hours after transfection, the cells were collected and
analyzed for NANOG mRNA expression with RT-qPCR and NANOG
protein with an immunofluorescence study. For the cell
proliferation assay, 1×10³ cells were seeded in 35-mm
dishes 72 h after transfection, and then the number of viable cells
was counted on days 1–5.
RT-PCR and quantitative RT-PCR
Ninety-six hours after transfection, total RNA was
extracted from the siRNA-transfected cells using TRIzol
(Invitrogen; Thermo Fisher Scientific, Inc.), and 2 µg total RNA
was used for first-strand cDNA synthesis using
SuperScript™ IV VILO™ Master Mix (Invitrogen;
Thermo Fisher Scientific, Inc.), according to the manufacturer's
instructions. RT-PCR was performed using TaKaRa Ex Taq®
(Takara Bio Inc.) and the Gene Amp PCR System 9,700 (Thermo Fisher
Scientific, Inc.) at the following cycling conditions: 29 cycles of
30 sec at 94°C, 30 sec at 60°C and 60 sec at 72°C. Quantitative
RT-PCR was performed using SYBR® Premix Ex Taq™ II
(Takara Bio Inc.) and StepOnePlus Real-Time PCR Systems (Thermo
Fisher Scientific, Inc.). PCR was performed in triplicate.
Results are expressed as the NANOG copy number
normalized to 104 GAPDH. Gene specific primers used in
this study were: NANOG forward, 5′-TGCAGAGAAGAGTGTCGCAA-3′ and
reverse, 5′-CAGGTCTTCACCTGTTTGTAGC-3′; NANOG (qPCR) forward,
5′-GGTGTGACGCAGAAGGCCTCA-3′ and reverse,
5′-CCCAGTCGGGTTCACCAGGCA-3′; cyclin D1 forward,
5′-AGCTCCTGTGCTGCGAAGTGGAAAC-3′ and reverse,
5′-AGTGTTCAATGAAATCGTGCGGGGT-3′; cyclin A forward,
5′-CCTGCTCGTCACTTGGGATG-3′ and reverse, 5′-ACTGTAGCCAGCACAACTCC-3′;
cyclin B1 forward, 5′-GCCTGCAAATGCCTGGTTTAT-3′ and reverse,
5′-GCCACAGCCTTGGCTAAATC-3′; cyclin E forward,
5′-TGGCGTTTAAGTCCCCTGAC-3′ and reverse, 5′-TCAGTTTTGAGCTCCCCGTC-3′;
p21 forward, 5′-AGTACCCTCTCAGCTCCAGG-3′ and reverse,
5′-TGTCTGACTCCTTGT-3′ p27 forward, 5′-TGTCAAACGTGCGAGTGTCT-3′ and
reverse, 5′-TGTCCTCAGAGTTAGCCGGA-3′; GAPDH forward,
5′-ACCCAGAAGACTGTGGATGG-3′ and reverse,
5′-TCTAGACGGCAGGTCAGGTC-3′.
Statistical analysis
Results are expressed as the mean ± SE unless
otherwise stated. Student's t-test was used to evaluate statistical
significance. Values of P<0.05 were considered to indicate a
statistically significant difference.
Results
The
EpCAMhigh/CD44+ population in CRC has
tumor-initiating potential in immunodeficient mice
We examined surgically resected colorectal tumors
from 18 patients (Table I). Fifteen
patients had clinical stage II or III disease, and two cases had
clinical stage IV disease. Pathologically, most patients had well
or moderately differentiated adenocarcinomas. We isolated the
cancer cells enzymatically and sorted cells using anti-CD44 and
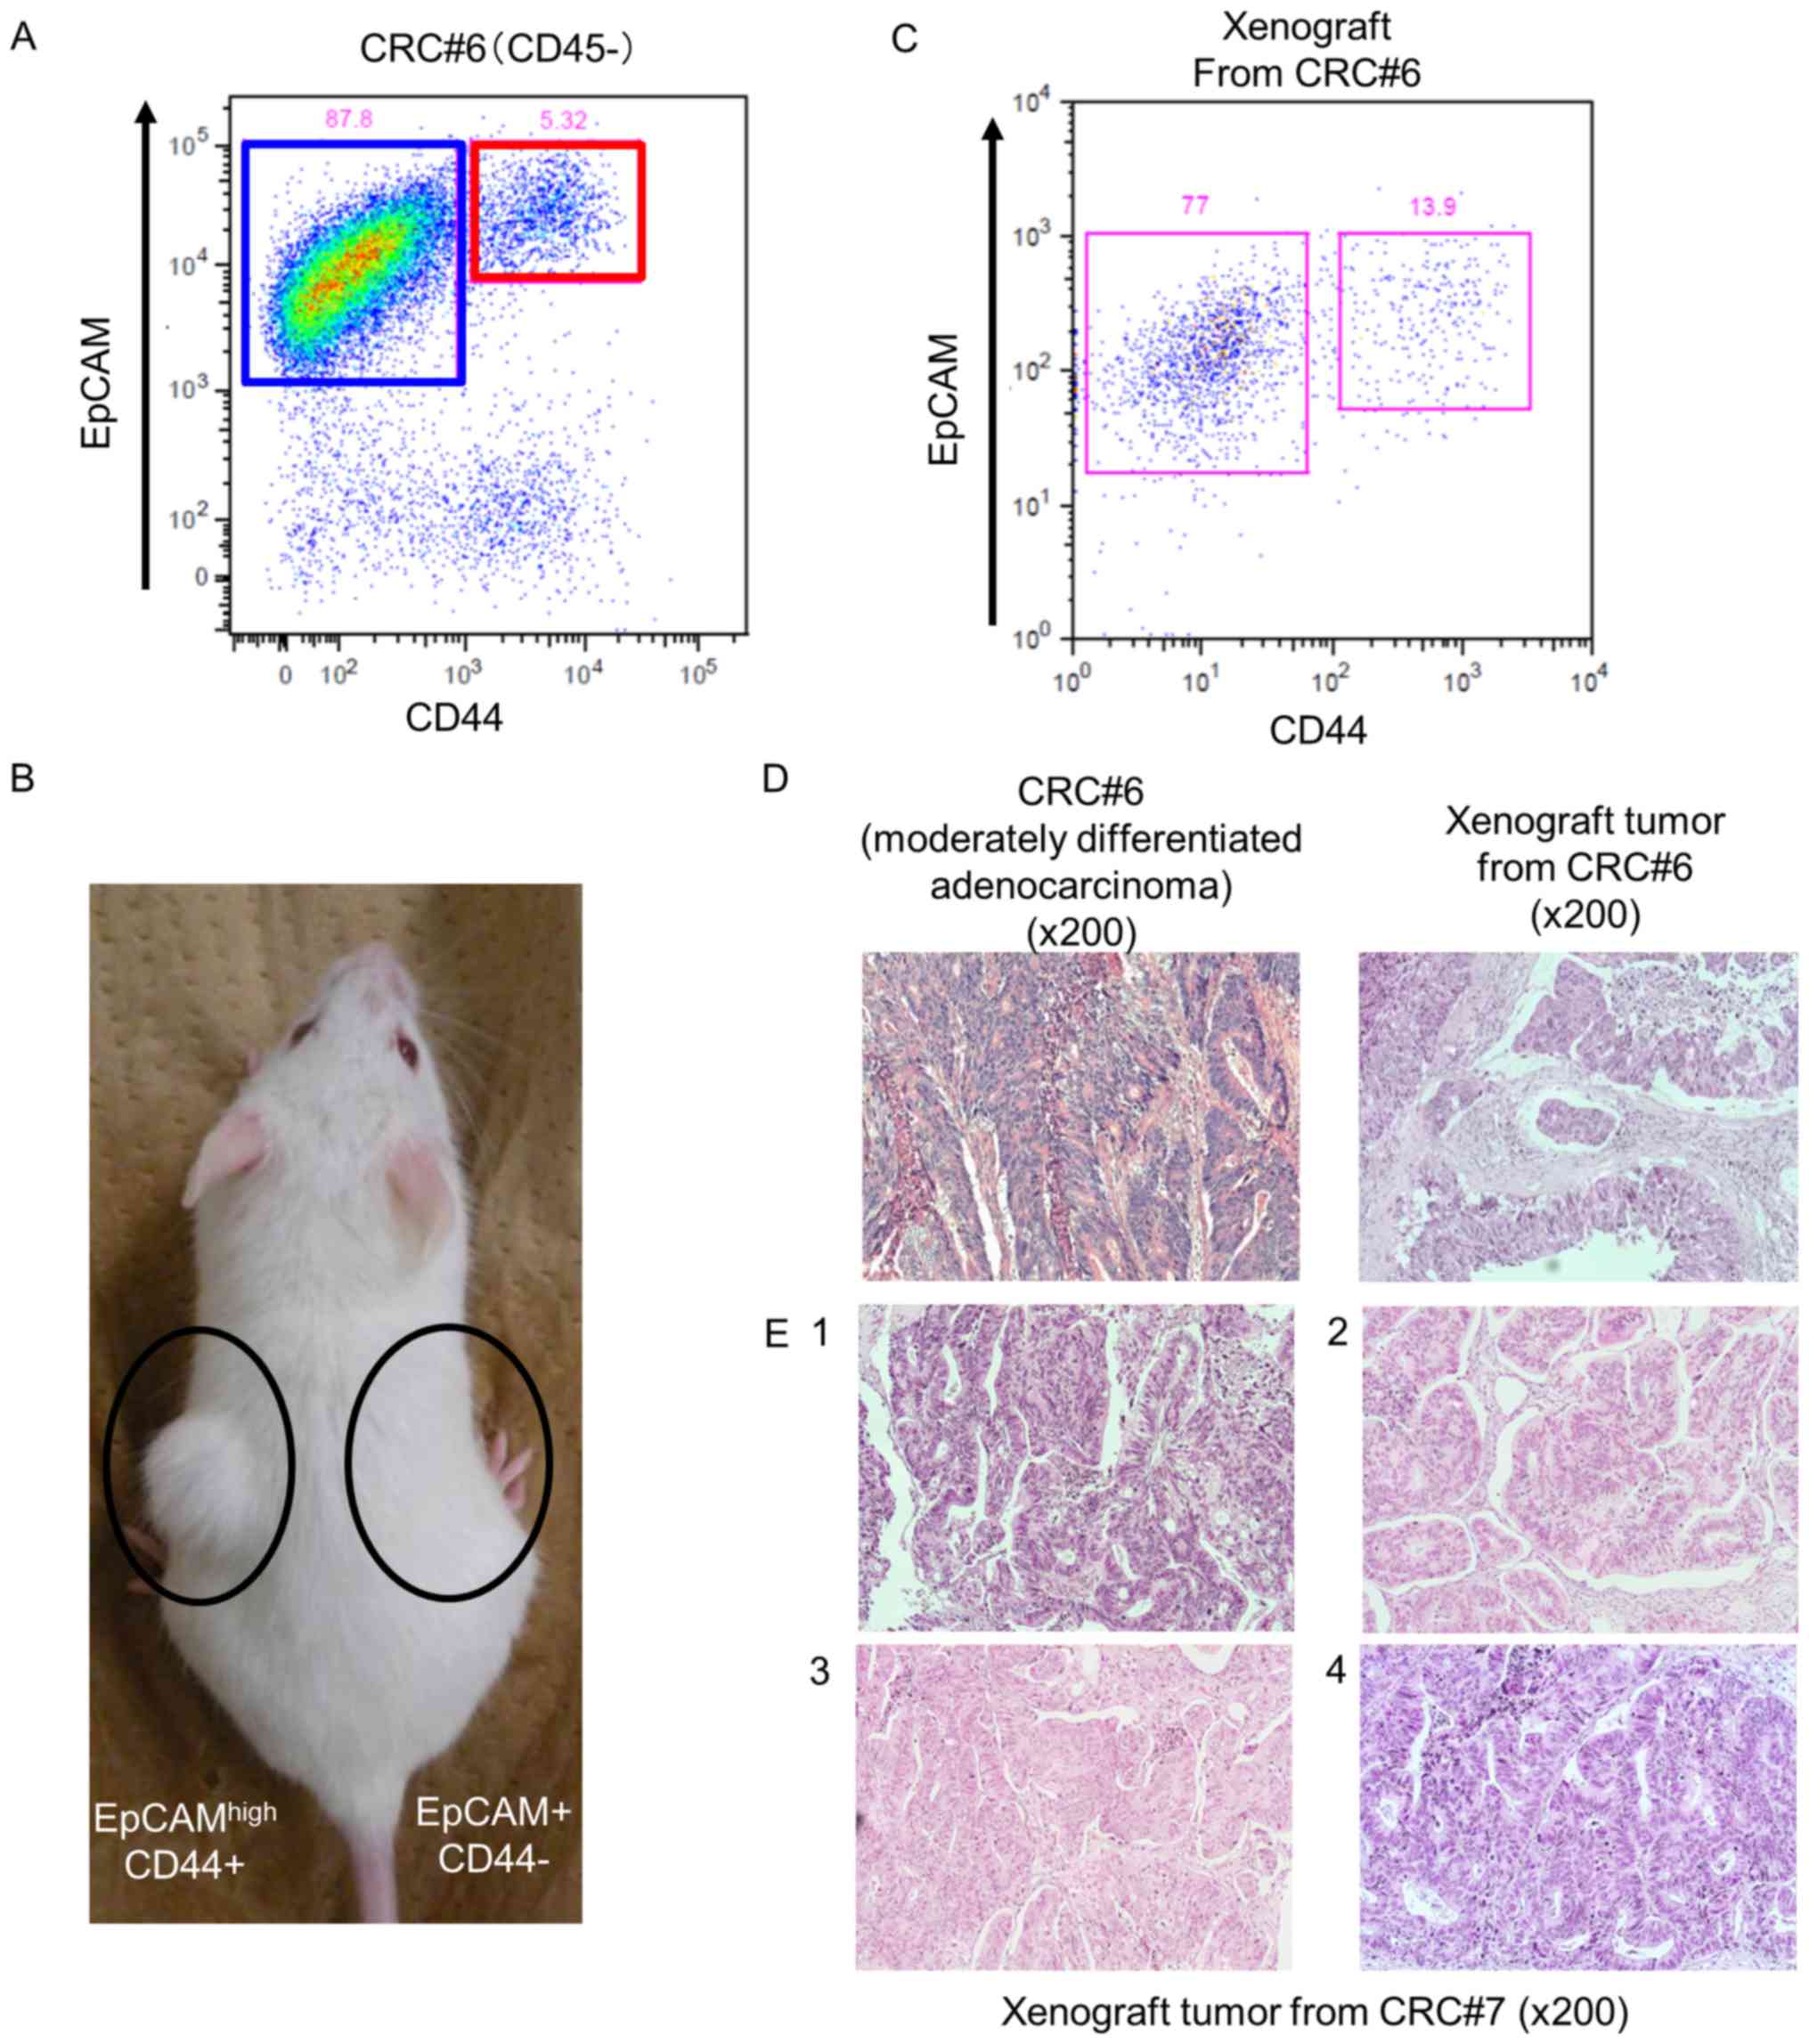
anti-EpCAM antibodies as previously reported (12). Fluorescence-activated cell sorting
analysis indicated that colorectal tumors contained both an
EpCAMhigh/CD44+ population and an
EpCAMpositive/CD44− population of cells
(Fig. 1A). To confirm that the
EpCAMhigh/CD44+ population had tumorigenic
potential in vivo, we transplanted 4×10³
EpCAMhigh/CD44+ cells or 1×10⁴
EpCAMpositive/CD44− cells subcutaneously into
NOD/SCID mice. As shown in Fig. 1B,
EpCAMhigh/CD44+ cells produced tumors (n=3,
patients #6-8), but no tumor was observed in mice in which
EpCAMpositive/CD44− cells had been
transplanted (n=3, patients #6-8). This result revealed that
EpCAMhigh/CD44+ CRC cells have tumorigenic
potential in vivo.
Next, we investigated CD44 expression in the
xenograft tumors by flow cytometric analysis to examine whether the
EpCAMhigh/CD44+ population had the ability to
self-renew and reconstitute a heterogeneous tumor. Xenograft tumors
derived from EpCAMhigh/CD44+ cells consisted
of both the EpCAMhigh/CD44+ population and
the EpCAMpositive/CD44− population (Fig. 1C). We also examined the histological
type of the xenograft tumors. H&E staining of a xenograft tumor
revealed abnormal ductal morphogenesis, indicating that it was a
moderately differentiated adenocarcinoma, which was the same
histological type as the primary human CRC (Fig. 1D). These xenograft tumors therefore
histologically were the same as the primary tumors. In addition,
the EpCAMhigh/CD44+ population from the
xenograft tumor could produce tumors that exhibited the same
histology as human CRC in serially transplanted mice. Thus, we
repeated transplantation four times, and each time, the tumor that
developed exhibited the same histology (Fig. 1E). These results indicated that
EpCAMhigh/CD44+ CRC cells possess the ability
to self-renew and produce heterogeneous tumors with the same
histology as the primary tumor in vivo.
The
EpCAMhigh/CD44+ population expresses
E-cadherin, but not N-cadherin
E-cadherin is essential for the self-renewal ability
of embryonic stem cells (16,21).
In addition, N-cadherin is important to maintain stemness in
hematopoietic stem cells (22). We
hypothesized that cadherin superfamily members may play a role in
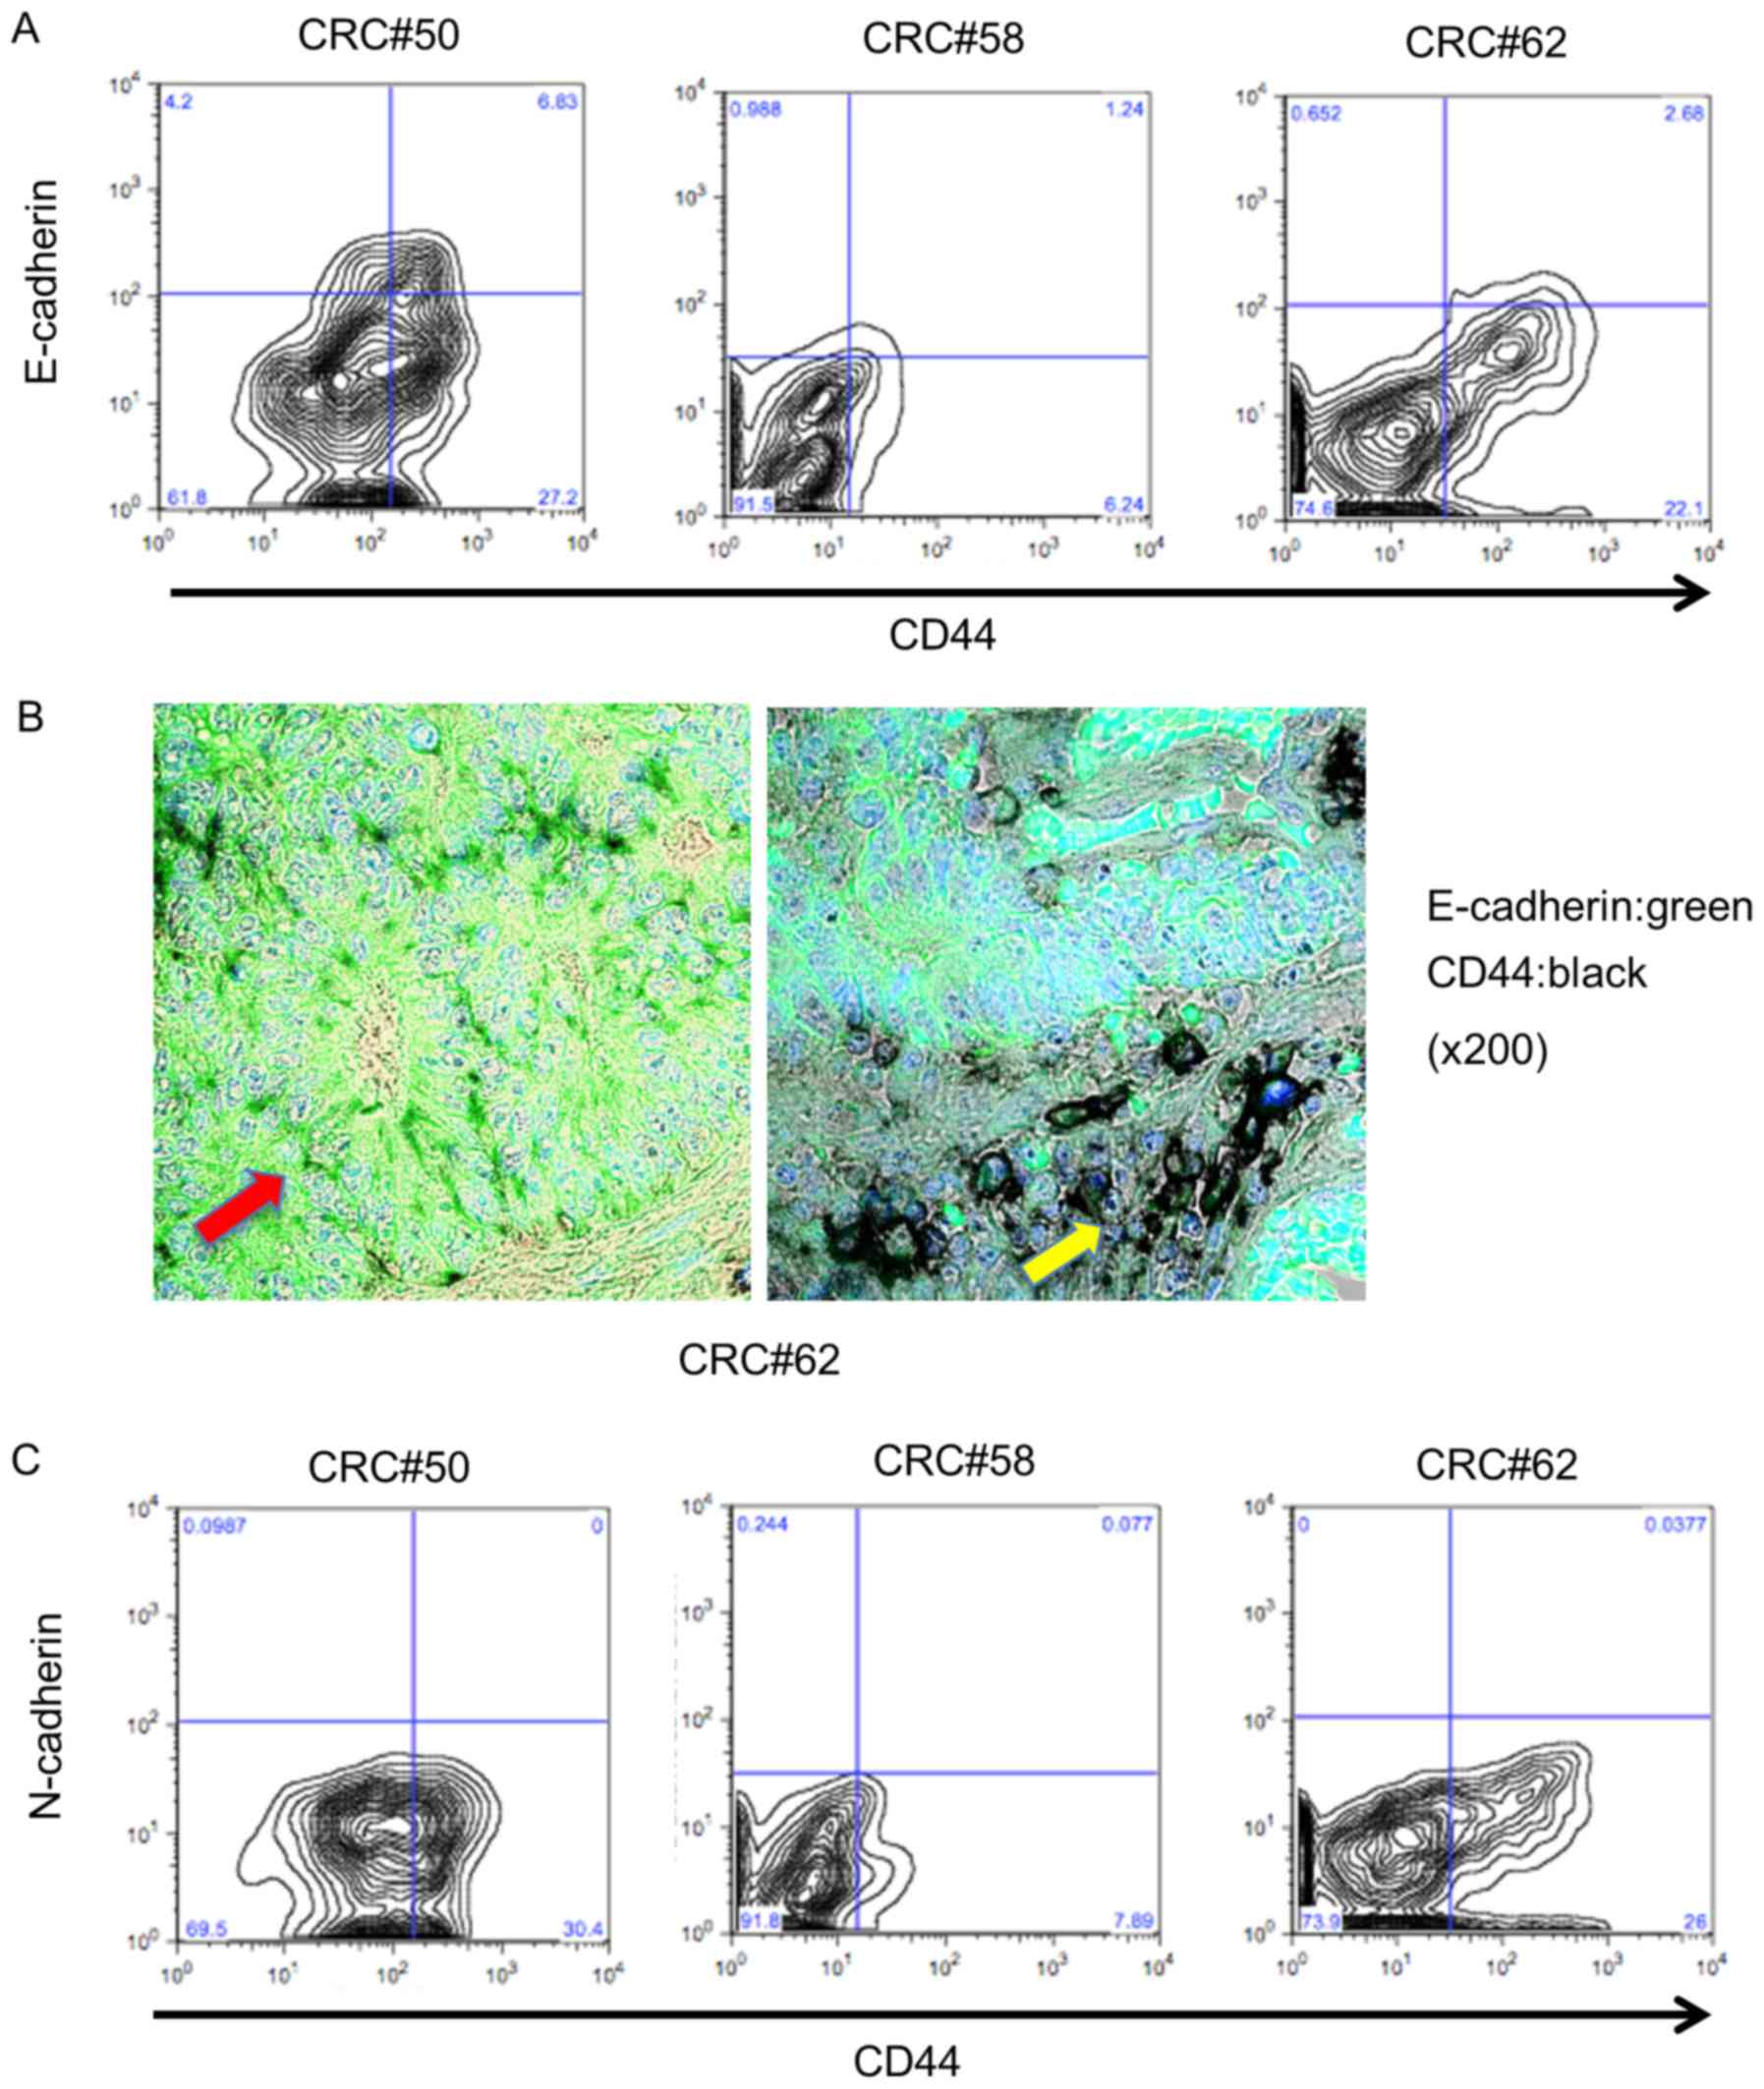
maintaining the stemness of colorectal CSCs. First, we sorted
EpCAMhigh/CD44+ and
EpCAMpositive/CD44− populations and examined
E-cadherin expression in the EpCAMhigh/CD44+
population using flow cytometric analysis; 15.8% of these
EpCAMhigh/CD44+ cells expressed E-cadherin
(10.8–20.0%; n=3; Fig. 2A).
Immunohistochemical staining indicated that CD44-positive cells in
atypical ducts expressed E-cadherin (Fig. 2B, red arrow), but that E-cadherin
was downregulated in CD44-positive cells in the tumor invasive area
(Fig. 2B, yellow arrow). Since a
previous study revealed that cancer cells that had undergone
epithelial-mesenchymal transition (EMT) had CSC properties
(23), EC−
EpCAMhigh/CD44+ cells were hypothesized to
express N-cadherin, which is a marker of EMT. We next examined
N-cadherin expression in the EpCAMhigh/CD44+
cells using flow cytometry. As shown in Fig. 2C, N-cadherin expression was not
observed in EpCAMhigh/CD44+ cells from
primary human tumors (0–0.97%; n=3; Fig. 2C). These results revealed that
EpCAMhigh/CD44+ cells could be divided into
two populations based on E-cadherin expression status and that EMT
may not be related to E-cadherin downregulation in
EpCAMhigh/CD44+ cells in primary human
colorectal tumors.
E-cadherin expressing
EpCAMhigh/CD44+ cells have higher tumorigenic
potential in vivo
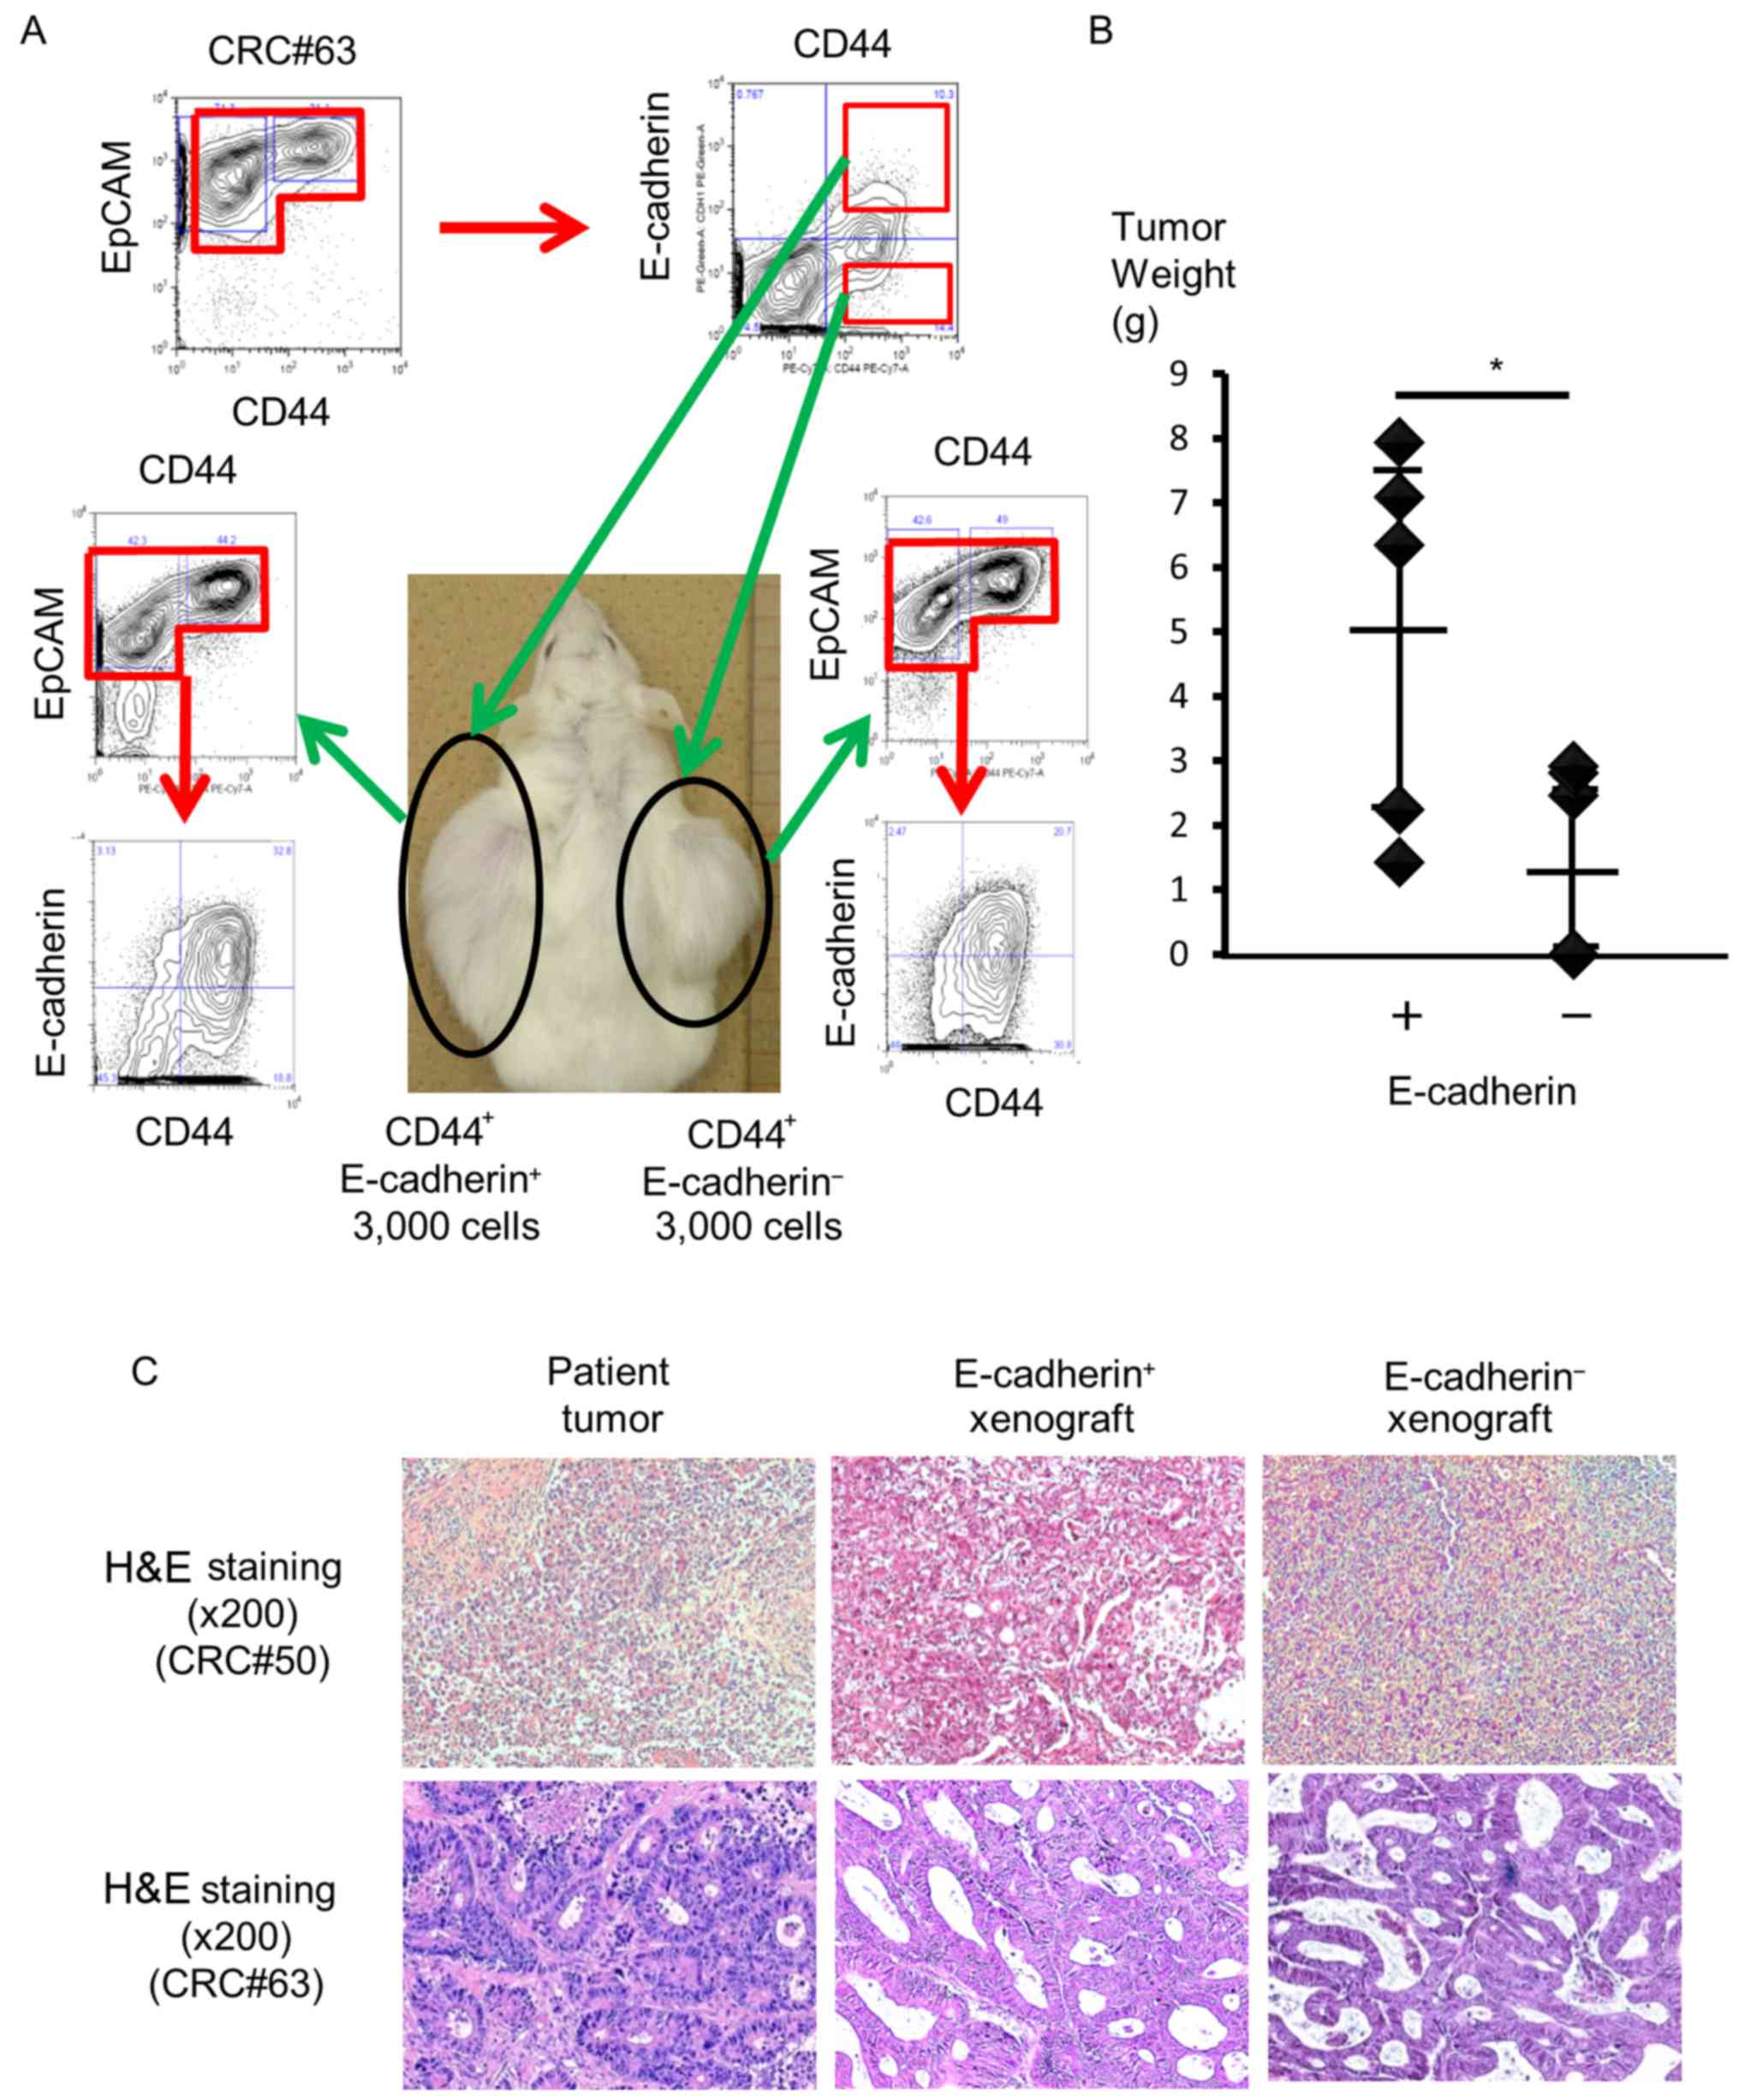
To investigate differences in the pathological
phenotype between EC+
EpCAMhigh/CD44+ cells and EC−
EpCAMhigh/CD44+ cells, we isolated each cell
population from human primary colorectal tumors and transplanted
the isolated cells subcutaneously into NOD/SCID mice (n=7, patients
#44, 49, 63, 64, 70, 71 and 74). Ten weeks after injection, four
out of the eight mice that were injected with more than
3×10³ EC+
EpCAMhigh/CD44+ cells bore tumors. In
particular, three of the four tumors originated from patient #49,
and one originated from patient #63. In contrast, one of the six
mice had a xenograft tumor after injection of 3×10³
EC− EpCAMhigh/CD44+ cells from
patient #63 (Table II and Fig. 3A). However, no statistically
significant difference was found in terms of tumorigenicity,
because only one of the five mice bore a tumor when
3×10³ EC+
EpCAMhigh/CD44+ cells were injected
(P=0.297).
| Table II.Tumor-initiating potential of
E-Cadherin+ and − cells within the
EpCAMhigh/CD44+ population in
vivo. |
Table II.
Tumor-initiating potential of
E-Cadherin+ and − cells within the
EpCAMhigh/CD44+ population in
vivo.
|
| Injected
EC+ or EC−
EpCAMhigh/CD44+ cell number (from the primary
sample) |
|
|---|
|
|
|
|
|---|
|
| 4000 | 3000 | 1500 | 1000 | 500 | 100 | P-value |
|---|
|
E-cadherin+ | 3/3 | 1/5 | 0/3 | – | 0/2 |
0/1 | 0.297 |
|
E-cadherin− | – | 1/6 | – | 0/2 | – | – |
|
| (tumor bearing
mice/total mice) |
|
|
| Injected
EC+ or EC−
EpCAMhigh/CD44+ cell number (from the
xenograft tumor) |
|
|
|
| 5000 | 4000 | 3000 | 2000 | 1000 | 100 | P-value |
|
|
E-cadherin+ | – | 1/1 | 6/6 | 0/1 | 2/3 |
0/1 | 0.099 |
|
E-cadherin− | 1/3 | 1/1 | 3/3 | 1/1 | 1/1 | – |
|
| (tumor bearing
mice/total mice) |
Then, we hypothesized that EC+ cells from
xenograft tumors may have a higher tumorigenic potential in
vivo. To assess this, we isolated EC+ and
EC− cells from xenograft tumors that originated from
patients #8, 49, 50 and 62 and injected them into immunodeficient
mice. Both EC+ and EC− cells from xenograft
tumors exhibited higher tumorigenic potential compared to cells
from primary tumors. All mice that had been injected with more than
3×10³ EC+ cells bore tumors. In addition, two
of the three mice bore tumors after 1×10³ EC+
cells were injected. In contrast, five of the seven mice that had
been injected with more than 3×10³ EC− cells
had tumors (Table II). We did not
detect a significant difference regarding tumorigenicity in this
setting (P=0.099).
Although both EC+ and EC−
cells exhibited tumorigenic potential in vivo,
EC+ cells produced significantly larger and heavier
tumors. The average weight of a tumor derived from EC+
cells was 5.01 g (1.43–7.94 g, n=5), whereas that derived from
EC− cells was 1.64 g (0.00–2.92 g, n=5, P=0.026;
Fig. 3B). H&E staining of
xenograft tumors derived from EC+ or EC−
cells revealed that the tumors had the same histology (Fig. 3C). Based on these results,
EC+ EpCAMhigh/CD44+ cells had
higher tumor growth potential in vivo compared to
EC− EpCAMhigh/CD44+ cells.
cDNA microarray identifies genes
potentially related to the higher tumor growth ability of
EC+ EpCAMhigh/CD44+ cells
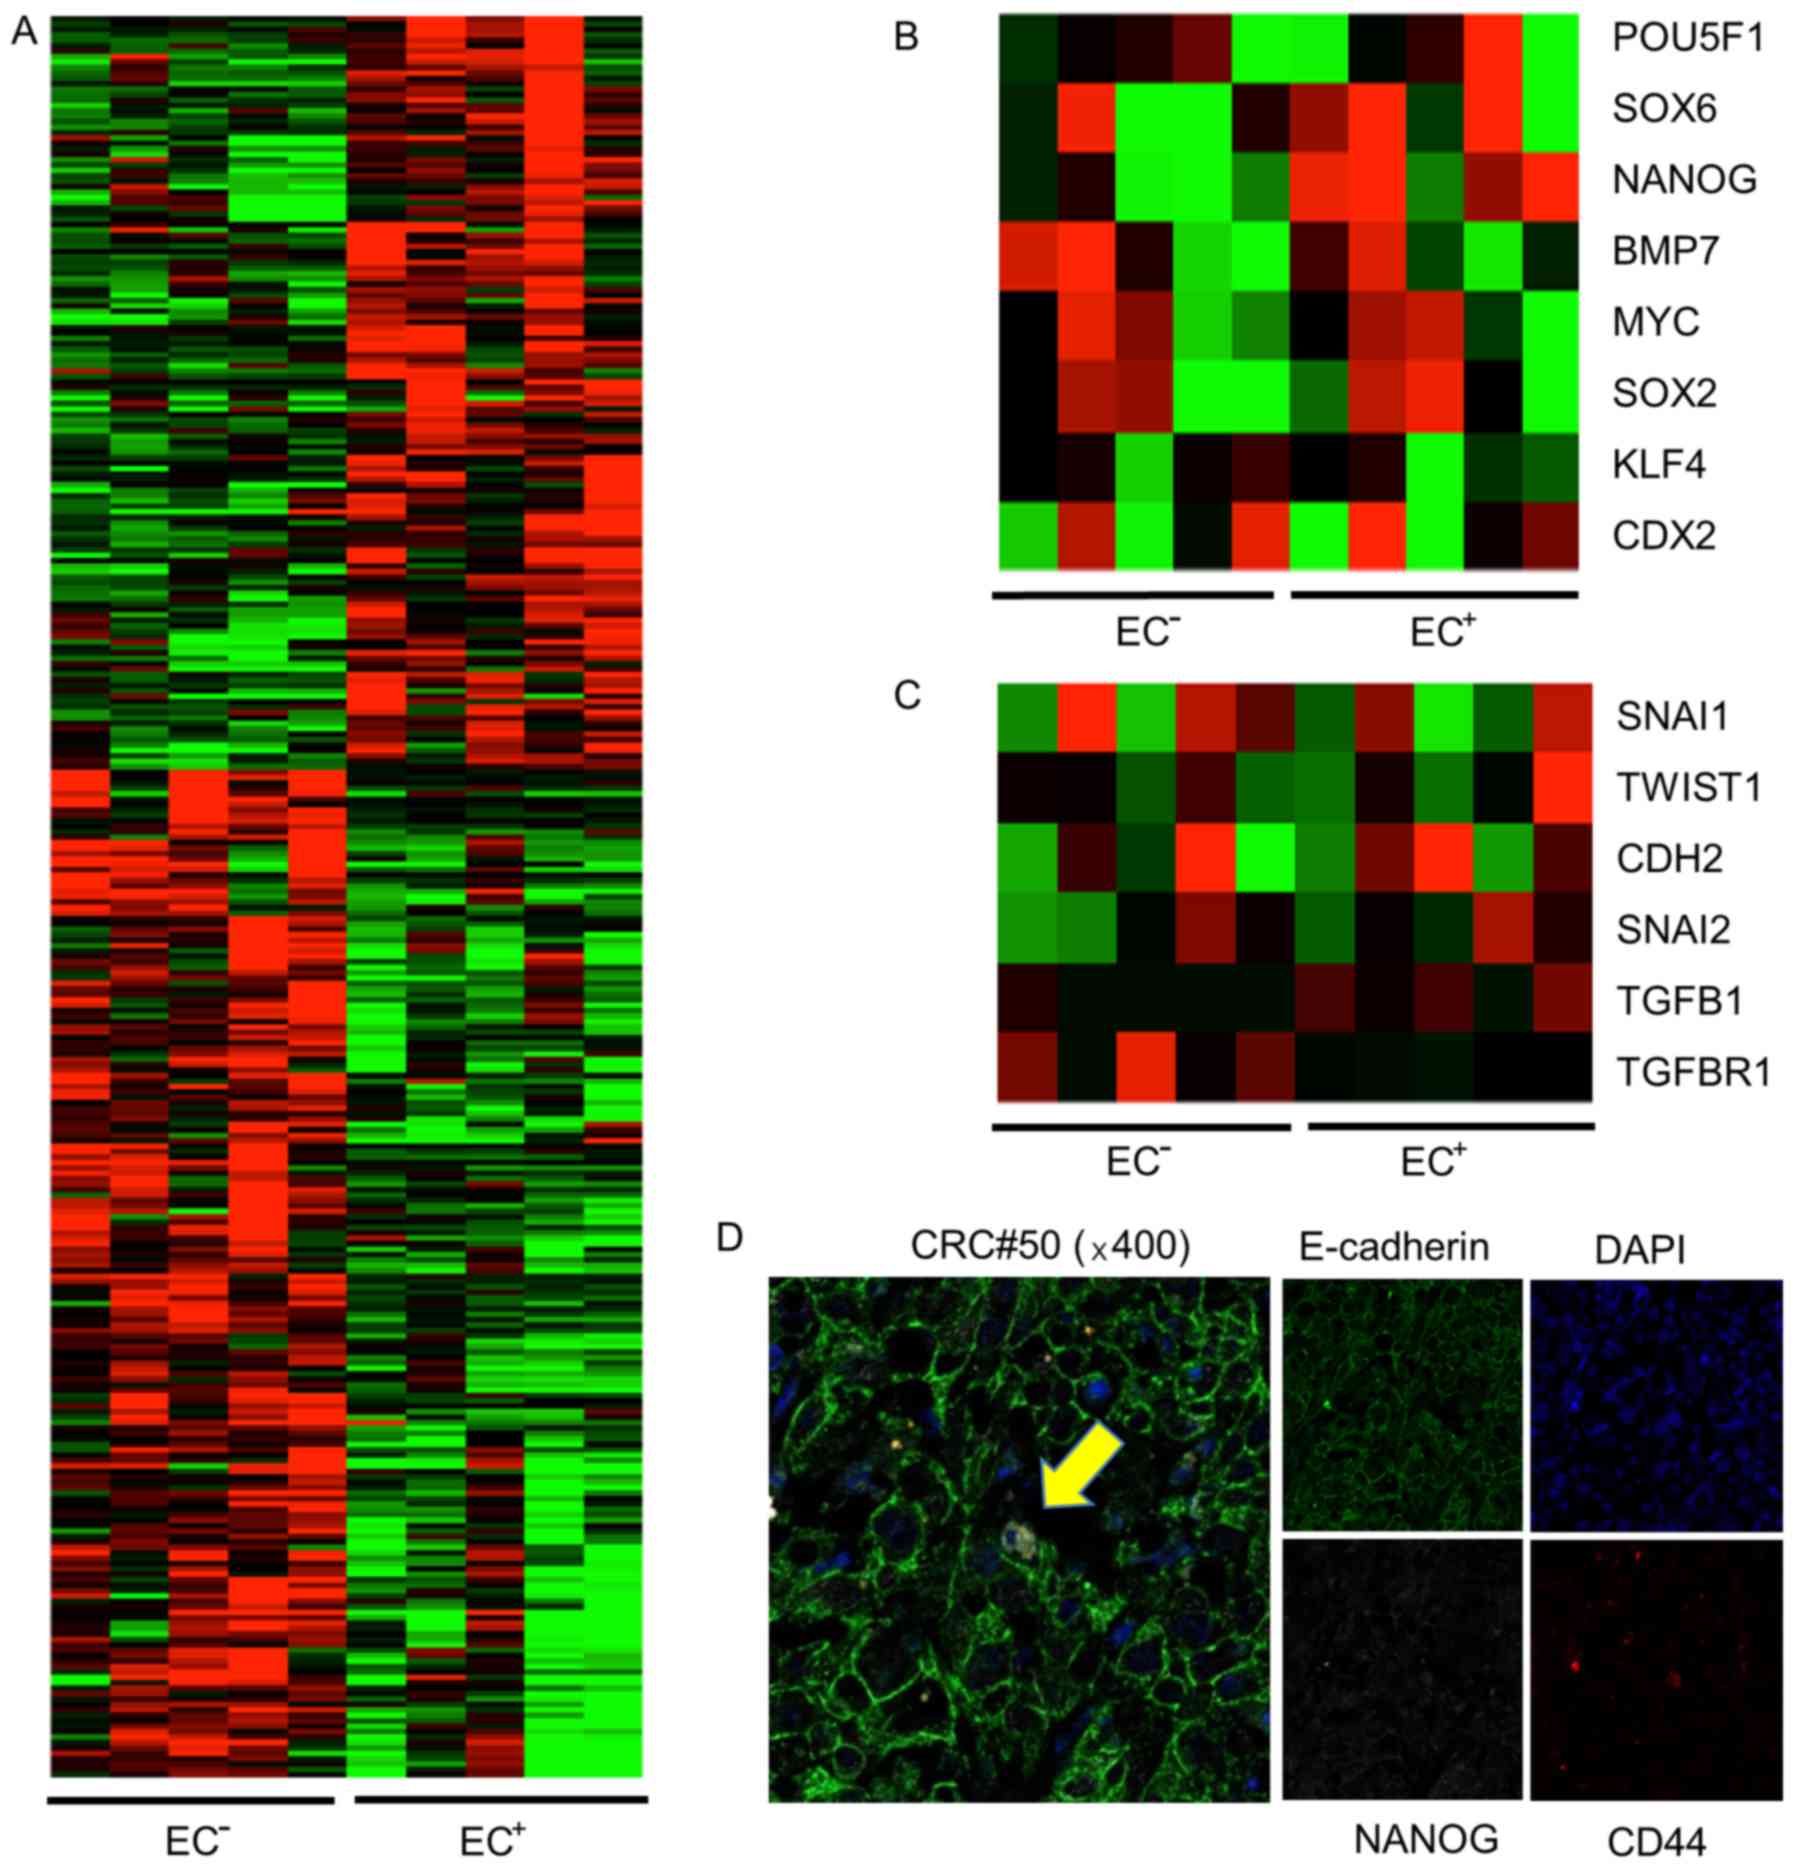
To explore the genetic profile leading to the
difference in tumor growth potential between EC+ and
EC− EpCAMhigh/CD44+ cells, we
isolated 5×10³ EC+ and EC−
EpCAMhigh/CD44+ cells from primary tumors of
patients #24, 180, 182, 187, and 211, and analyzed the mRNA
expression of 41,628 genes using a cDNA microarray (Agilent
Technologies, Santa Clara, CA, USA). Different gene expression
profiles were obtained for the EC+ and EC−
EpCAMhigh/CD44+ cells (Fig. 4A). We subsequently focused on NANOG
expression since NANOG is a transcription factor that is essential
for self-renewal and pluripotency of embryonic stem cells.
Moreover, NANOG has been revealed to be associated with increased
cell proliferation in the colon (24). In four out of five populations of
EC+ cells, NANOG expression was upregulated more than
four times, compared to EC− cells. The expression of
CDX2, which is a crypt-like differentiation marker, was not
upregulated in EC− cells (Fig. 4B, Table III). We then compared the
expression of EMT-related genes between EC+ cells and
EC− cells. Consistent with previous data, EMT-related
gene expression was not different between the cell types, and the
CDH1 mRNA level was not altered (Fig.
4C, Table III). Next, we
confirmed the expression of NANOG in
EpCAMhigh/CD44+ cells using
immunofluorescence. NANOG expression was detected in the nucleus of
one of eight EC+ EpCAMhigh/CD44+
cells (Fig. 4D).
| Table III.The relative ratio of mRNA expression
of stemness and EMT-related genes between EC+ and
EC− cells (EC+/EC−). |
Table III.
The relative ratio of mRNA expression
of stemness and EMT-related genes between EC+ and
EC− cells (EC+/EC−).
| A,
Transcription-related gene expression |
|---|
|
|---|
|
| #180 (ratio) | #182 (ratio) | #187 (ratio) | #211 (ratio) | #24 (ratio) |
|---|
| POU5F1 | 0.349898 | 0.904157 | 1.078143 | 3.702691 | NULL |
| NANOG | 4.328553 | 4.141721 | 1.860814 | 21.28952 | 9.054102 |
| SOX2 | 0.562313 | 1.136609 | 1.654131 | 14.43825 | NULL |
| SOX6 | 2.599258 | 2.951994 | 4.416502 | 23.84684 | 0.202682 |
| KLF4 | 1.024759 | 1.106549 | 0.699897 | 0.709549 | 0.464341 |
| BMP7 | 0.453347 | 0.583328 | 0.563205 | NULL | NULL |
| CDX2 | 0.270185 | 1.509952 | 0.248415 | 1.154388 | 0.536948 |
|
| B, EMT-related
gene expression |
|
|
| #180 (ratio) | #182 (ratio) | #187 (ratio) | #211 (ratio) | #24 (ratio) |
| CDH1 | 0.959147 | 0.904071 | 1.285291 | 1.474868 | 0.747187 |
| CDH2 | NULL | 1.330456 | 7.381092 | 0.046765 | NULL |
| SNAI1 | 1.326144 | 0.513009 | 0.849582 | 0.241307 | 1.678008 |
| SNAI2 | 1.325459 | 2.02312 | 0.837368 | 1.275875 | 1.118609 |
| TWIST1 | NULL | NULL | NULL | NULL | NULL |
These results revealed that NANOG may be involved in
the higher tumor growth ability of EC+ CSC cells, but
was not associated with CSC properties or EMT in colorectal
CSCs.
NANOG increases CSC proliferation
through cyclin D1 expression
To confirm that NANOG-induced higher cell
proliferation ability in EC+ colorectal CSCs, we knocked
out NANOG expression in the HCT116 CRC cell line with siRNA, since
this cell line expresses CD44, a colorectal CSC marker, and NANOG.
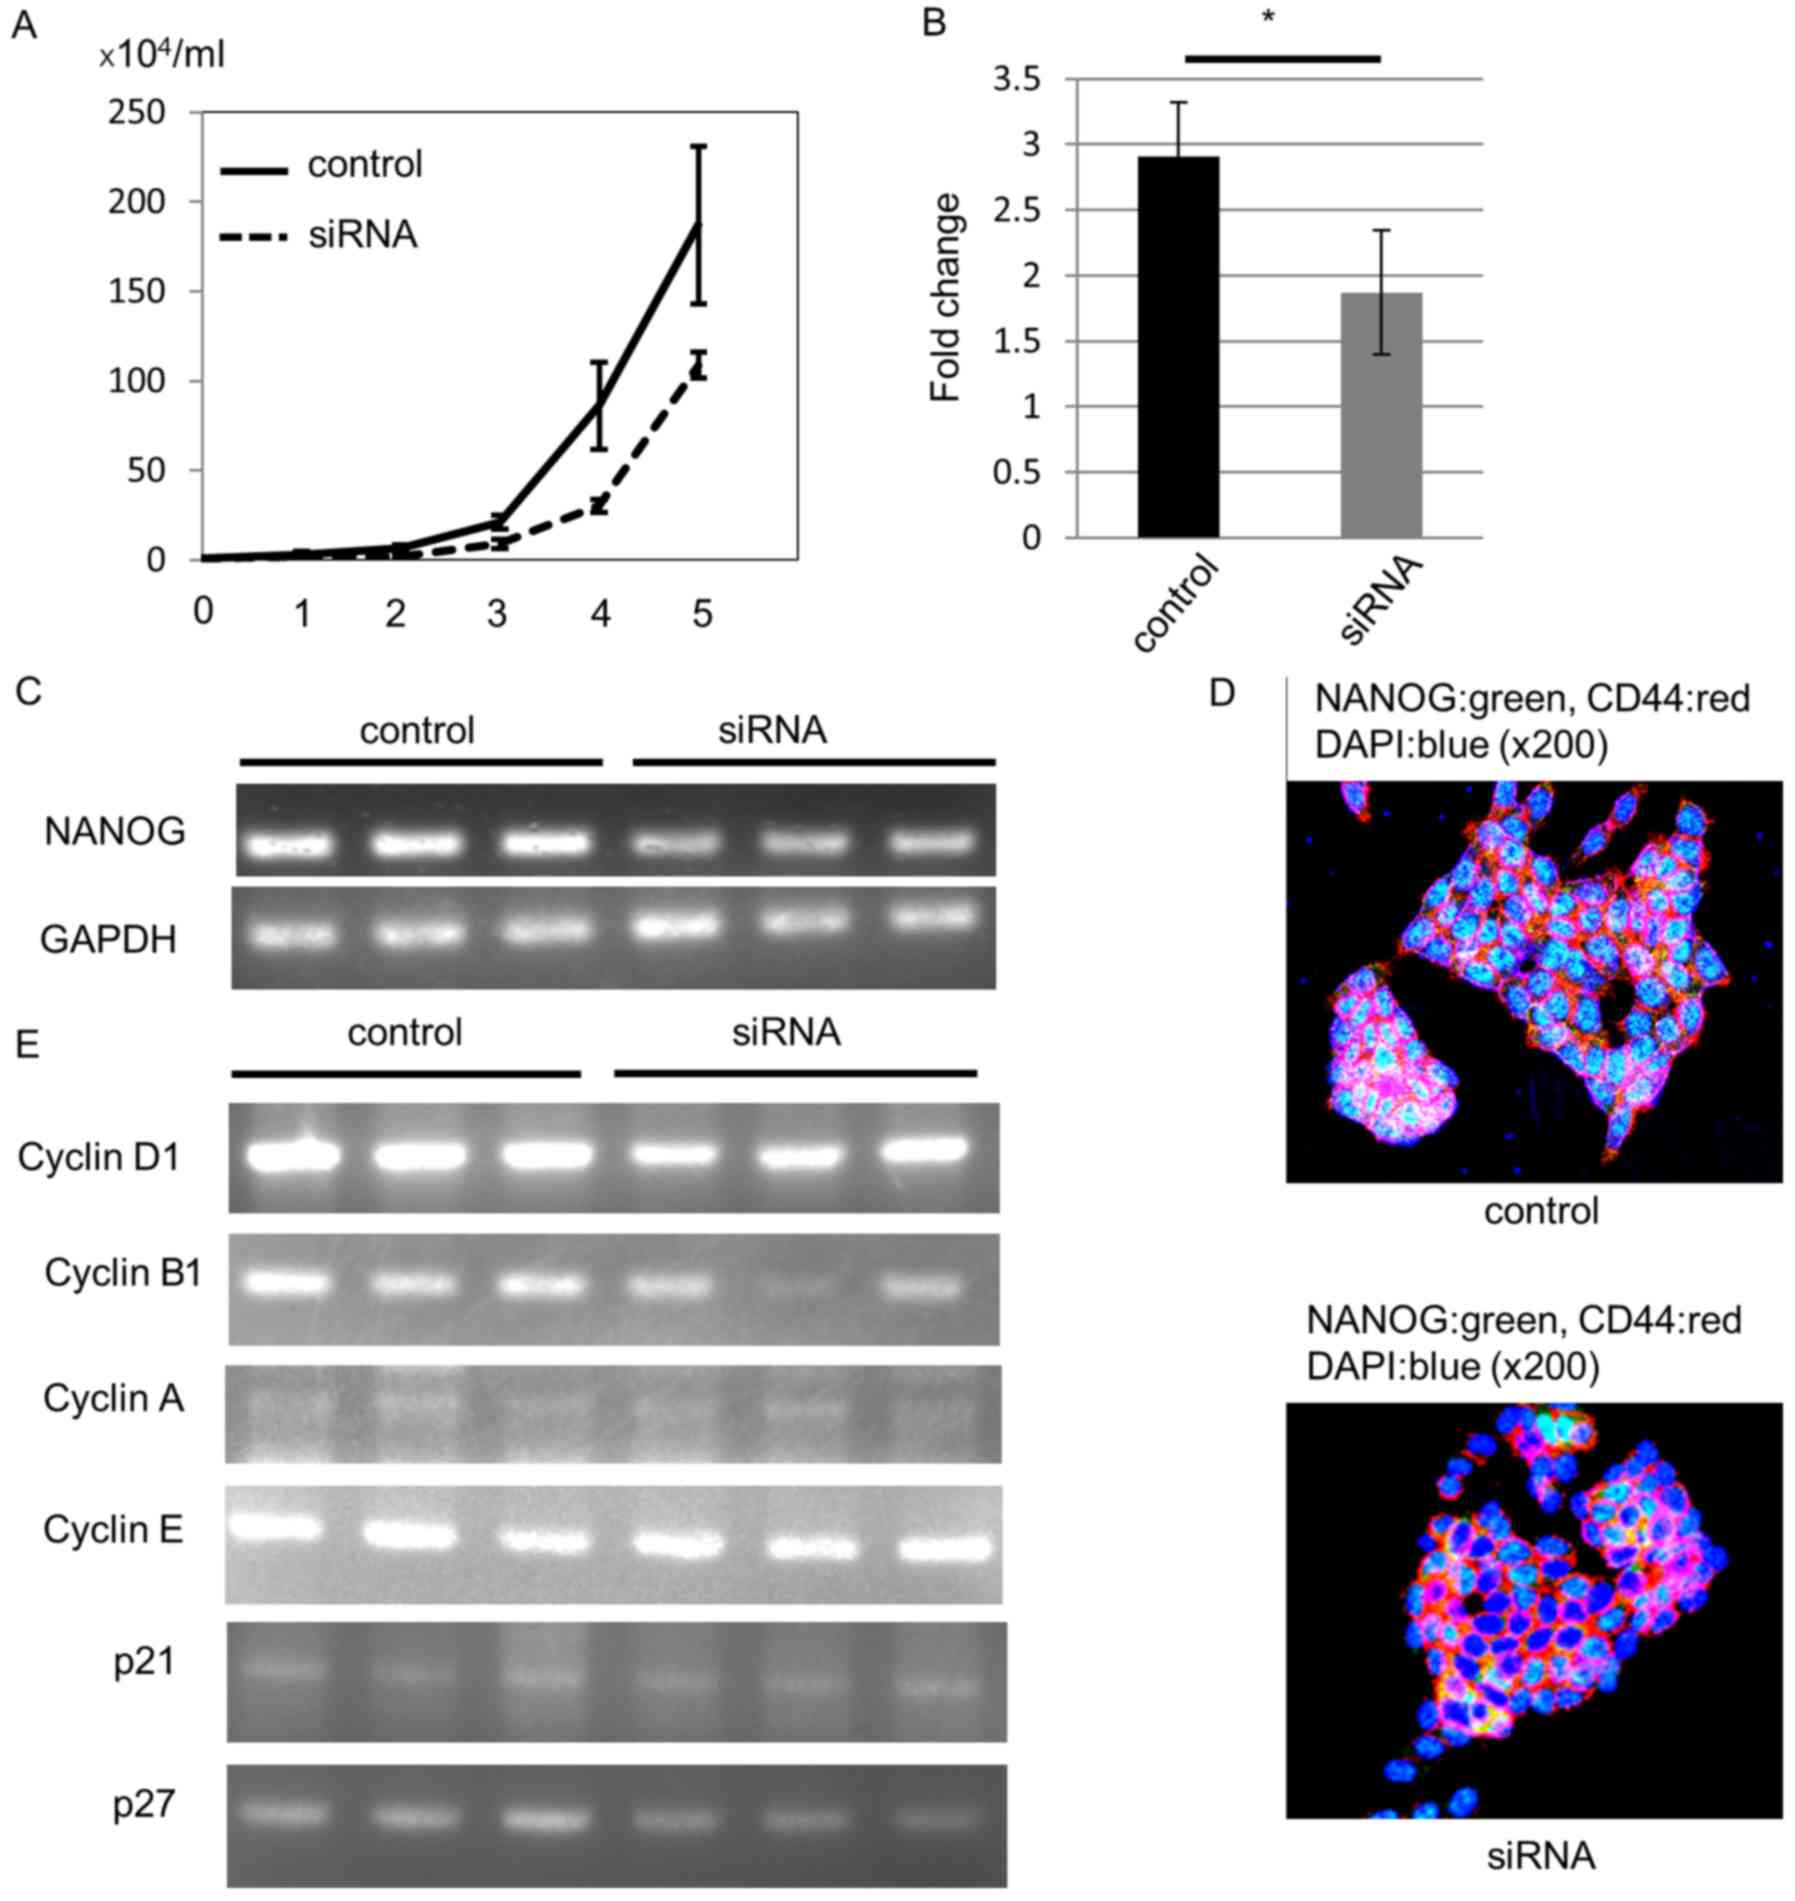
As expected, NANOG siRNA-transfected cells demonstrated
lower cell proliferation ability than control siRNA-transfected
cells (Fig. 5A). To confirm the
knockout of NANOG, we estimated NANOG mRNA levels
with RT-qPCR 4 days after transfection. Compared to the control
siRNA-transfected cells, the NANOG mRNA level was
significantly decreased in NANOG siRNA-transfected cells
(Fig. 5B). In addition, our RT-PCR
analysis also revealed downregulation of NANOG mRNA
expression (Fig. 5C).
We performed an immunofluorescence study to confirm
NANOG protein downregulation. All control HCT116 cells expressed
NANOG protein in the nucleus, and we could not detect NANOG protein
in some siRNA-transfected cells 4 days after transfection (Fig. 5D).
Next, we analyzed the mechanism of the decreased
proliferation ability induced by downregulation of NANOG. Since
NANOG regulates cell cycle-related gene expression (25,26),
we hypothesized that the lower cell proliferation ability may be
due to cyclin D1 downregulation after knockout of NANOG. We
analyzed mRNA expression of cell cycle-related genes 4 days after
siRNA transfection. RT-PCR data revealed that cyclin D1 mRNA
levels were decreased in NANOG siRNA-transfected cells. In
addition, cyclin B1 mRNA levels were also decreased,
especially in one siRNA-transfected cell line, but mRNA levels of
other cyclins, p21, and p27 were not altered (Fig. 5E).
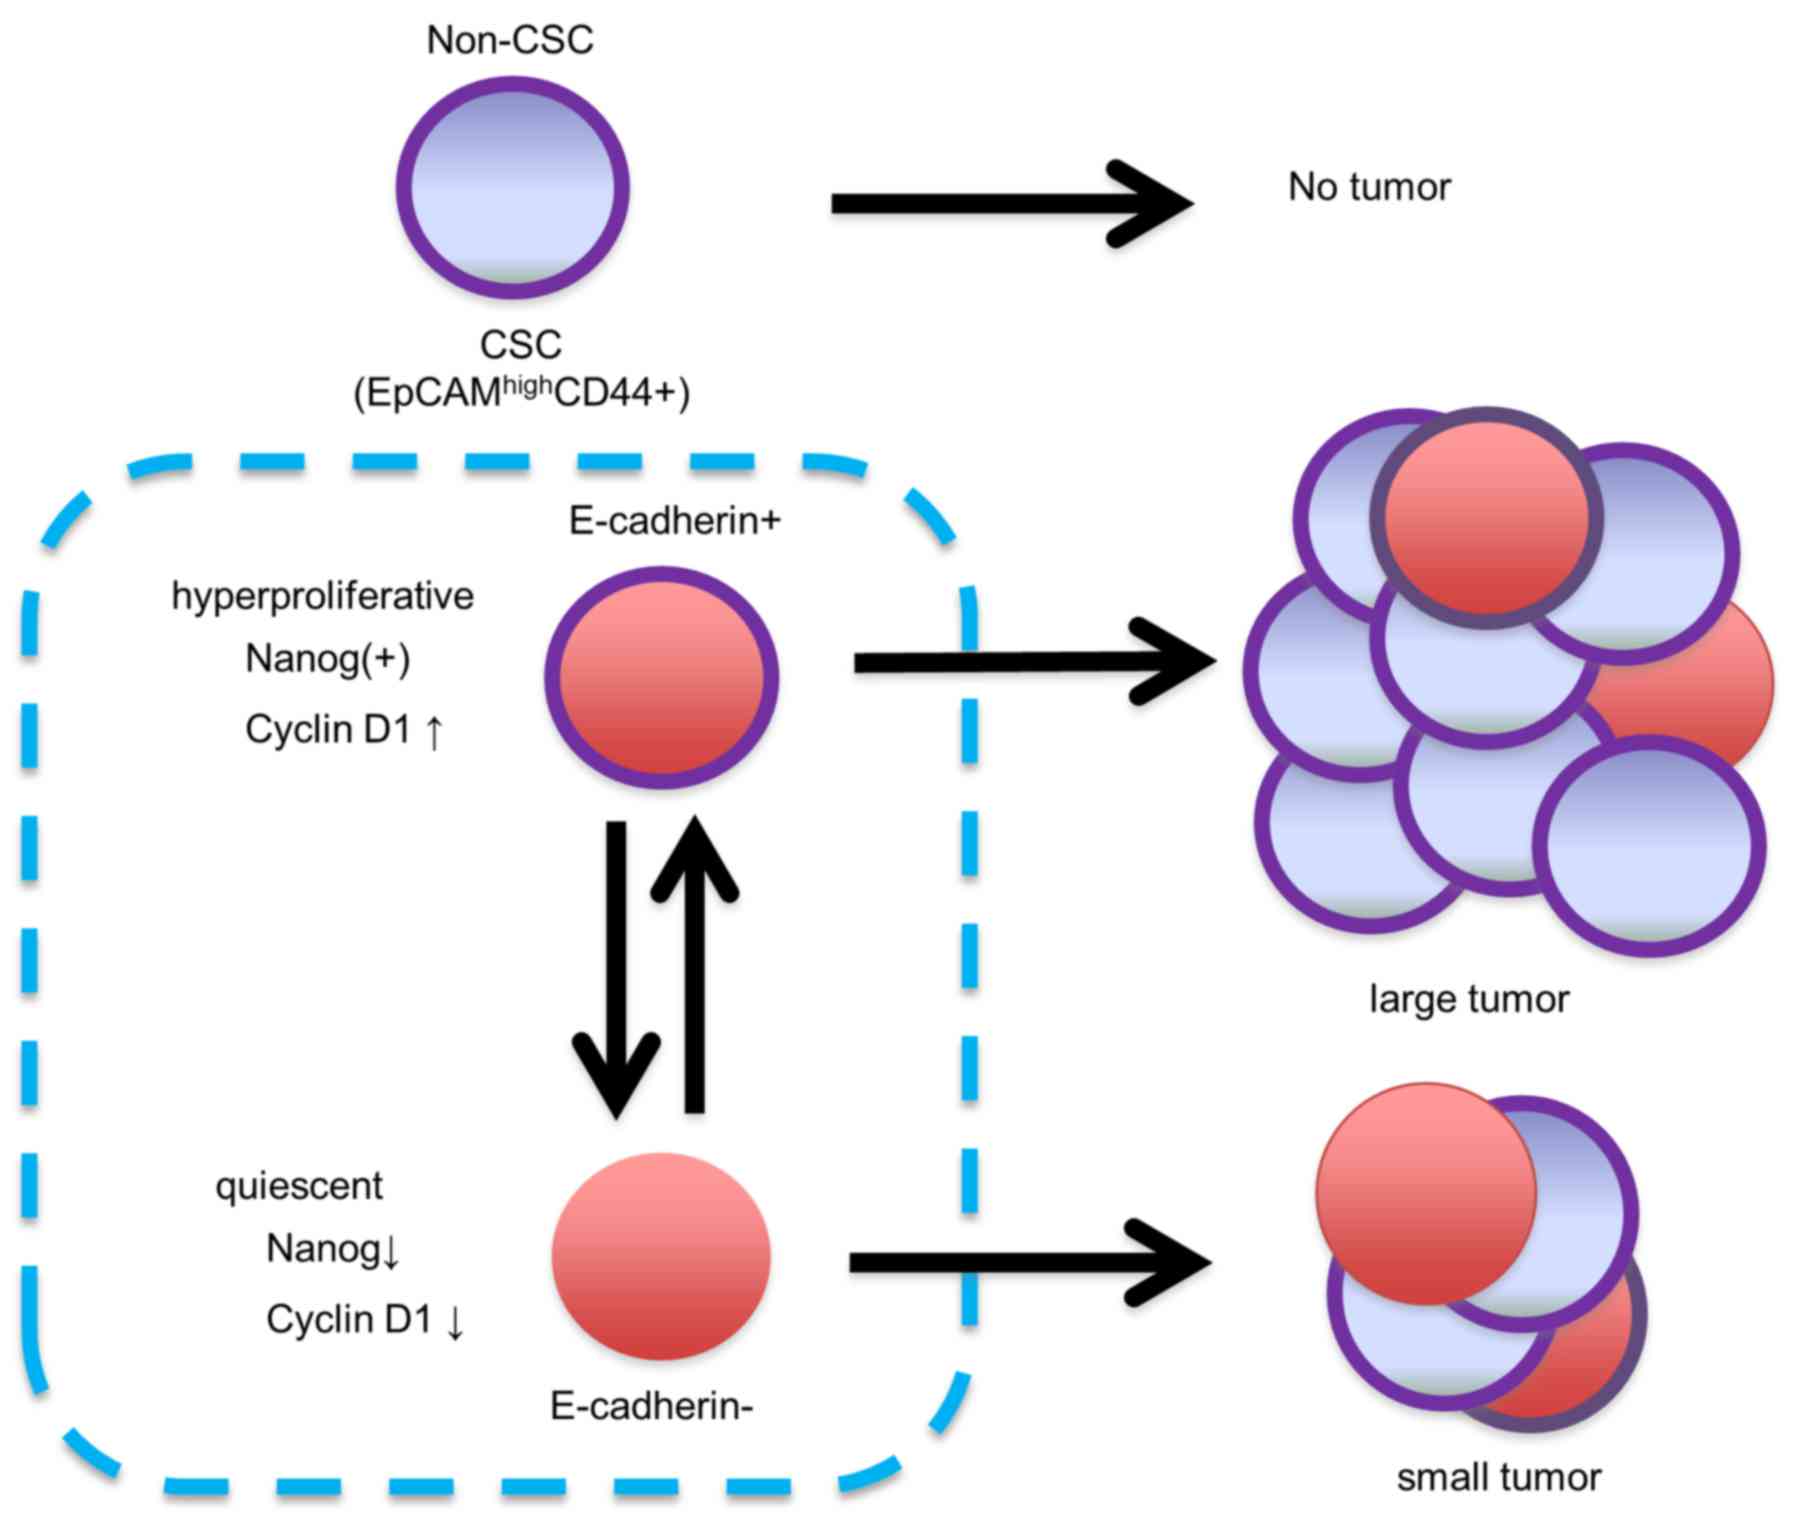
These data revealed that NANOG increased CRC cell
proliferation through up-regulation of cyclin D1, and that cyclin
B1 may also be involved in this process. In particular, NANOG
controlled colorectal CSC proliferation, leading to the difference
in the tumor growth rate between EC+ CSCs and
EC− CSCs (Fig. 6).
Discussion
The classical understanding of the concept of CSCs
is that tumor tissue arises from CSCs and that a limited population
of tumor cells during tumor growth has CSC properties. The CSC
population is considered to be uniform because it is small in
numbers. However, cancer cells that undergo EMT also possess CSC
properties (23), and this
EMT-induced stemness is possibly important for development of
metastatic cancer lesions. According to this concept, the CSC
population is thought to consist of heterogeneous cells. However,
whether heterogeneous CSCs exist in the primary tumor is
unclear.
We identified two different populations of CSCs in
the primary tumor based on E-cadherin expression status for the
first time. E-cadherin-expressing CSCs (EC+ CSCs) and
E-cadherin-deficient CSCs (EC− CSCs) existed within the
EpCAMhigh/CD44+ colorectal CSC population.
Expression of CDH1, which encodes the E-cadherin protein, is
downregulated by several EMT-related genes such as SNAIL,
TWIST and SLUG. However, the cDNA array analysis of the
present study revealed no differences in the expression of
CDH1 or EMT-related genes between EC+ CSCs and
EC− CSCs. In addition, expression of N-cadherin, which
is believed to be highly expressed in cells during the EMT process,
was not detected in EC− CSCs, either by flow cytometry
or immunohistochemical staining. Our data revealed that the
downregulation of E-cadherin expression that we observed does not
represent a step in the EMT process and that distinct expression
levels of E-cadherin in each CSC population may be regulated by
signals other than EMT programs, such as SRC, epidermal growth
factor, and WNT (27,28). Thus, our data indicated that human
primary CRC tissue contains CSCs that consist of EC+
CSCs and EC− CSCs, and suggest that differences between
these two CSC phenotypes are independent of the EMT process.
EC+ CSCs and EC− CSCs
demonstrated pathologically different phenotypes. Although both
EC+ CSCs and EC− CSCs had self-renewal
ability and produced tumors with the same histology in
immunodeficient mice, EC+ CSCs from primary tumors
exhibited higher tumor growth potential than EC− CSCs
from primary tumors in vivo This observation strongly
suggested that signal transduction-promoting cell growth was
enhanced in EC+ CSCs compared to EC− CSCs.
Such a higher growth ability of EC+ CSCs is possibly due
to the increased expression of NANOG. NANOG is a key transcription
factor that maintains the pluripotency of human embryonic stem
cells by blocking differentiation and establishing the pluripotent
ground state during somatic cell reprogramming (29). NANOG expression has been reported in
human tumors, especially in CSCs of prostate cancer, ovarian cancer
and CRC (30–32). We had previously revealed that
NANOGP8 was overexpressed in the human colorectal CSC population
and that downregulation of NANOG by siRNA reduced cellular
proliferation (33). Therefore, the
higher growth ability of EC+ CSCs could be understood in
terms of their association with preferential NANOG expression. In
the present study, we demonstrated that downregulation of
NANOG by siRNA reduced cyclin D1 expression, and this may be
the main explanation for the lower proliferation ability of
EC− CSCs. In this aspect, we considered EC+
CSCs to be proliferating CSCs and EC− CSCs to be
quiescent CSCs.
Many transcription factors have been identified in
human embryonic stem cells that are recruited to the NANOG locus to
regulate its expression (29).
Although direct interactions between the E-cadherin/β-catenin
signaling pathway and increased NANOG expression still remain
unclear in human colorectal CSCs, Hawkins et al reported
that E-cadherin promoted Nanog transcript and protein expression in
mouse embryonic stem cells. In their study, they revealed that
Stat3 signaling was involved in Nanog expression and that the
β-catenin binding site region in E-cadherin was essential (34). The same results were reported by
Valle et al (35). In
addition, it was revealed that STAT3 promoted stemness in CRC
(36,37). With these results, STAT3 signaling
may also be involved in NANOG expression by E-cadherin in human
colorectal CSCs.
The present study is the first to demonstrate that
the EpCAMhigh/CD44+ colorectal CSC population
consists of heterogeneous populations, such as EC+ CSCs
and EC− CSCs. Although both populations possess stem
cell properties, which could reconstitute tumors consisting of both
populations in human CRC tissues, they exhibited pathologically
different phenotypes. EC+ CSCs exhibited higher
proliferative potential, possibly due to high NANOG expression,
leading to increased cyclin D1 and cyclin B1 expression. On the
other hand, EC− CSCs are thought to be in a more
quiescent state than EC+ CSCs due to the low expression
of cyclin D1. E-cadherin downregulation in EC− CSCs was
independent of the EMT process, and EC− CSCs have the
ability to revert to EC+ CSCs depending on their
environment.
Acknowledgements
The authors acknowledge the assistance of Mr.
Nobuhiro Torata during tissue sample collection.
Funding
The present study was supported by a grant from the
Ministry of Education, Culture, Sports, Science and Technology of
Japan (grant no. 15K08970).
Availability of data and materials
The datasets used during the present study are
available from the corresponding author upon reasonable
request.
Authors' contributions
ST, HA, TI and EB conceived and designed the study.
ST, HA and TI performed the experiments and wrote the manuscript.
MN performed some experiments. YK, ST, HK, KT, TU, MN, KA and EB
made substantial contributions to conception and intellectual
content of the studies. All authors read and approved the
manuscript.
Ethics approval and consent to
participate
The study protocol was approved by the
Institutional Review Board of Kyushu University Hospital in 2009
and written informed consent was obtained from patients. All animal
experiments were performed in accordance with the Institutional
Animal Welfare Guidelines of Kyushu University.
Consent for publication
Not applicable.
Competing interests
The authors declare that they have no competing
interests.
Glossary
Abbreviations
Abbreviations:
|
CSC
|
cancer stem cell
|
|
CRC
|
colorectal cancer
|
|
EC
|
E-cadherin
|
|
EMT
|
epithelial-mesenchymal transition
|
References
|
1
|
Clevers H: The cancer stem cell: Premises,
promises and challenges. Nat Med. 17:313–319. 2011. View Article : Google Scholar : PubMed/NCBI
|
|
2
|
Dick JE: Stem cell concepts renew cancer
research. Blood. 112:4793–4807. 2008. View Article : Google Scholar : PubMed/NCBI
|
|
3
|
Shackleton M, Quintana E, Fearon ER and
Morrison SJ: Heterogeneity in cancer: Cancer stem cells versus
clonal evolution. Cell. 138:822–829. 2009. View Article : Google Scholar : PubMed/NCBI
|
|
4
|
Takeishi S, Matsumoto A, Onoyama I, Naka
K, Hirao A and Nakayama KI: Ablation of Fbxw7 eliminates
leukemia-initiating cells by preventing quiescence. Cancer Cell.
23:347–361. 2013. View Article : Google Scholar : PubMed/NCBI
|
|
5
|
Ishimoto T, Nagano O, Yae T, Tamada M,
Motohara T, Oshima H, Oshima M, Ikeda T, Asaba R, Yagi H, et al:
CD44 variant regulates redox status in cancer cells by stabilizing
the xCT subunit of system xc- and thereby promotes tumor growth.
Cancer Cell. 19:387–400. 2011. View Article : Google Scholar : PubMed/NCBI
|
|
6
|
Diehn M, Cho RW, Lobo NA, Kalisky T, Dorie
MJ, Kulp AN, Qian D, Lam JS, Ailles LE, Wong M, et al: Association
of reactive oxygen species levels and radioresistance in cancer
stem cells. Nature. 458:780–783. 2009. View Article : Google Scholar : PubMed/NCBI
|
|
7
|
Oskarsson T, Batlle E and Massagué J:
Metastatic stem cells: Sources, niches, and vital pathways. Cell
Stem Cell. 14:306–321. 2014. View Article : Google Scholar : PubMed/NCBI
|
|
8
|
Al-Hajj M, Wicha MS, Benito-Hernandez A,
Morrison SJ and Clarke MF: Prospective identification of
tumorigenic breast cancer cells. Proc Natl Acad Sci USA.
100:3983–3988. 2003. View Article : Google Scholar : PubMed/NCBI
|
|
9
|
Bonnet D and Dick JE: Human acute myeloid
leukemia is organized as a hierarchy that originates from a
primitive hematopoietic cell. Nat Med. 3:730–737. 1997. View Article : Google Scholar : PubMed/NCBI
|
|
10
|
Singh SK, Clarke ID, Terasaki M, Bonn VE,
Hawkins C, Squire J and Dirks PB: Identification of a cancer stem
cell in human brain tumors. Cancer Res. 63:5821–5828.
2003.PubMed/NCBI
|
|
11
|
Takaishi S, Okumura T, Tu S, Wang SS,
Shibata W, Vigneshwaran R, Gordon SA, Shimada Y and Wang TC:
Identification of gastric cancer stem cells using the cell surface
marker CD44. Stem Cells. 27:1006–1020. 2009. View Article : Google Scholar : PubMed/NCBI
|
|
12
|
Dalerba P, Dylla SJ, Park IK, Liu R, Wang
X, Cho RW, Hoey T, Gurney A, Huang EH, Simeone DM, et al:
Phenotypic characterization of human colorectal cancer stem cells.
Proc Natl Acad Sci USA. 104:10158–10163. 2007. View Article : Google Scholar : PubMed/NCBI
|
|
13
|
Ricci-Vitiani L, Lombardi DG, Pilozzi E,
Biffoni M, Todaro M, Peschle C and De Maria R: Identification and
expansion of human colon-cancer-initiating cells. Nature.
445:111–115. 2007. View Article : Google Scholar : PubMed/NCBI
|
|
14
|
Huang EH, Hynes MJ, Zhang T, Ginestier C,
Dontu G, Appelman H, Fields JZ, Wicha MS and Boman BM: Aldehyde
dehydrogenase 1 is a marker for normal and malignant human colonic
stem cells (SC) and tracks SC overpopulation during colon
tumorigenesis. Cancer Res. 69:3382–3389. 2009. View Article : Google Scholar : PubMed/NCBI
|
|
15
|
Sada A, Jacob F, Leung E, Wang S, White
BS, Shalloway D and Tumbar T: Defining the cellular lineage
hierarchy in the interfollicular epidermis of adult skin. Nat Cell
Biol. 18:619–631. 2016. View Article : Google Scholar : PubMed/NCBI
|
|
16
|
Li L, Wang S, Jezierski A, Moalim-Nour L,
Mohib K, Parks RJ, Retta SF and Wang L: A unique interplay between
Rap1 and E-cadherin in the endocytic pathway regulates self-renewal
of human embryonic stem cells. Stem Cells. 28:247–257.
2010.PubMed/NCBI
|
|
17
|
Miyo M, Yamamoto H, Konno M, Colvin H,
Nishida N, Koseki J, Kawamoto K, Ogawa H, Hamabe A, Uemura M, et
al: Tumour-suppressive function of SIRT4 in human colorectal
cancer. Br J Cancer. 113:492–499. 2015. View Article : Google Scholar : PubMed/NCBI
|
|
18
|
Bolstad BM, Irizarry RA, Astrand M and
Speed TP: A comparison of normalization methods for high density
oligonucleotide array data based on variance and bias.
Bioinformatics. 19:185–193. 2003. View Article : Google Scholar : PubMed/NCBI
|
|
19
|
Gentleman RC, Carey VJ, Bates DM, Bolstad
B, Dettling M, Dudoit S, Ellis B, Gautier L, Ge Y, Gentry J, et al:
Bioconductor: Open software development for computational biology
and bioinformatics. Genome Biol. 5:R802004. View Article : Google Scholar : PubMed/NCBI
|
|
20
|
Quackenbush J: Microarray data
normalization and transformation. Nat Genet. 32 (Suppl):S496–S501.
2002. View
Article : Google Scholar
|
|
21
|
Soncin F and Ward CM: The function of
e-cadherin in stem cell pluripotency and self-renewal. Genes
(Basel). 2:229–259. 2011. View Article : Google Scholar : PubMed/NCBI
|
|
22
|
Hosokawa K, Arai F, Yoshihara H, Iwasaki
H, Nakamura Y, Gomei Y and Suda T: Knockdown of N-cadherin
suppresses the long-term engraftment of hematopoietic stem cells.
Blood. 116:554–563. 2010. View Article : Google Scholar : PubMed/NCBI
|
|
23
|
Mani SA, Guo W, Liao MJ, Eaton EN, Ayyanan
A, Zhou AY, Brooks M, Reinhard F, Zhang CC, Shipitsin M, et al: The
epithelial-mesenchymal transition generates cells with properties
of stem cells. Cell. 133:704–715. 2008. View Article : Google Scholar : PubMed/NCBI
|
|
24
|
Fischedick G, Wu G, Adachi K, Araúzo-Bravo
MJ, Greber B, Radstaak M, Köhler G, Tapia N, Iacone R,
Anastassiadis K, et al: Nanog induces hyperplasia without
initiating tumors. Stem Cell Res. 13:300–315. 2014. View Article : Google Scholar : PubMed/NCBI
|
|
25
|
Han J, Zhang F, Yu M, Zhao P, Ji W, Zhang
H, Wu B, Wang Y and Niu R: RNA interference-mediated silencing of
NANOG reduces cell proliferation and induces G0/G1 cell cycle
arrest in breast cancer cells. Cancer Lett. 321:80–88. 2012.
View Article : Google Scholar : PubMed/NCBI
|
|
26
|
Son MY, Choi H, Han YM and Cho YS:
Unveiling the critical role of REX1 in the regulation of human stem
cell pluripotency. Stem Cells. 31:2374–2387. 2013. View Article : Google Scholar : PubMed/NCBI
|
|
27
|
Behrens J, Vakaet L, Friis R, Winterhager
E, Van Roy F, Mareel MM and Birchmeier W: Loss of epithelial
differentiation and gain of invasiveness correlates with tyrosine
phosphorylation of the E-cadherin/beta-catenin complex in cells
transformed with a temperature-sensitive v-SRC gene. J Cell Biol.
120:757–766. 1993. View Article : Google Scholar : PubMed/NCBI
|
|
28
|
Nelson WJ and Nusse R: Convergence of Wnt,
beta-catenin, and cadherin pathways. Science. 303:1483–1487. 2004.
View Article : Google Scholar : PubMed/NCBI
|
|
29
|
Saunders A, Faiola F and Wang J: Concise
review: Pursuing self-renewal and pluripotency with the stem cell
factor Nanog. Stem Cells. 31:1227–1236. 2013. View Article : Google Scholar : PubMed/NCBI
|
|
30
|
Gu G, Yuan J, Wills M and Kasper S:
Prostate cancer cells with stem cell characteristics reconstitute
the original human tumor in vivo. Cancer Res. 67:4807–4815. 2007.
View Article : Google Scholar : PubMed/NCBI
|
|
31
|
Chiou SH, Yu CC, Huang CY, Lin SC, Liu CJ,
Tsai TH, Chou SH, Chien CS, Ku HH and Lo JF: Positive correlations
of Oct-4 and Nanog in oral cancer stem-like cells and high-grade
oral squamous cell carcinoma. Clin Cancer Res. 14:4085–4095. 2008.
View Article : Google Scholar : PubMed/NCBI
|
|
32
|
Ibrahim EE, Babaei-Jadidi R, Saadeddin A,
Spencer-Dene B, Hossaini S, Abuzinadah M, Li N, Fadhil W, Ilyas M,
Bonnet D and Nateri AS: Embryonic NANOG activity defines colorectal
cancer stem cells and modulates through AP1- and TCF-dependent
mechanisms. Stem Cells. 30:2076–2087. 2012. View Article : Google Scholar : PubMed/NCBI
|
|
33
|
Uchino K, Hirano G, Hirahashi M, Isobe T,
Shirakawa T, Kusaba H, Baba E, Tsuneyoshi M and Akashi K: Human
Nanog pseudogene8 promotes the proliferation of gastrointestinal
cancer cells. Exp Cell Res. 318:1799–1807. 2012. View Article : Google Scholar : PubMed/NCBI
|
|
34
|
Hawkins K, Mohamet L, Ritson S, Merry CL
and Ward CM: E-cadherin and, in its absence, N-cadherin promotes
Nanog expression in mouse embryonic stem cells via STAT3
phosphorylation. Stem Cells. 30:1842–1851. 2012. View Article : Google Scholar : PubMed/NCBI
|
|
35
|
del Valle I, Rudloff S, Carles A, Li Y,
Liszewska E, Vogt R and Kemler R: E-cadherin is required for the
proper activation of the Lifr/Gp130 signaling pathway in mouse
embryonic stem cells. Development. 140:1684–1692. 2013. View Article : Google Scholar : PubMed/NCBI
|
|
36
|
Lin L, Liu A, Peng Z, Lin HJ, Li PK, Li C
and Lin J: STAT3 is necessary for proliferation and survival in
colon cancer-initiating cells. Cancer Res. 71:7226–7237. 2011.
View Article : Google Scholar : PubMed/NCBI
|
|
37
|
Kim BR, Oh SC, Lee DH, Kim JL, Lee SY,
Kang MH, Lee SI, Kang S, Joung SY and Min BW: BMP-2 induces
motility and invasiveness by promoting colon cancer stemness
through STAT3 activation. Tumour Biol. 36:9475–9486. 2015.
View Article : Google Scholar : PubMed/NCBI
|