Introduction
MicroRNAs (miRNAs/miRs) regulate mRNA expression
through RNA interference and are known to be associated with
various diseases (1–3). Abnormal miRNA expression is a
well-known and crucial factor that is associated with the
initiation and progression of various tumors, including brain
tumors and breast cancer (1,4,5).
The term brain tumor describes an inhomogeneous collection of
tumors of the brain, which can be either malignant or benign and
either originate in the central nervous system or represent
metastases from other tumors (4,6). Among
these various types of brain tumors, studies have been conducted on
miRNAs in gliomas, meningiomas and schwannomas (6–10).
Notably, certain previous studies have focused on the expression
profiles of miRNAs in cancerous tissues and their associations with
target genes involved in cancer cell formation and metastasis.
Abnormal expression of miRNAs in glioma tissues was
previously reported, and miRNAs, including miR-34a, 146a, 7,
128 and 195, were downregulated in cancer tissues
compared with those in normal tissues, suggesting dysregulation of
tumor suppressor genes (6).
However, the expression of certain miRNAs (miR-21, 26a, 10b,
30e and 221/222) was increased, suggesting that
miRNAs act not only as tumor suppressors, but also, dependent on
the function of the targeted mRNA, as oncogenes (6,7). The
miRNA expression profiling of meningiomas has shown a reduction in
miR-29c and miR-219 depending on the tumor grade and
has indicated that high expression of miR-190a in
meningiomas correlates with tumorigenic risk. In addition, the
expression pattern of miR-190a is a prognostic predictor of
postoperative outcome (8). In
addition, the expression patterns of miRNAs, including
miR-200a and miR-145, are reportedly associated with
the progression of meningiomas (9).
A schwannoma study also showed altered miRNA expression patterns in
tumor tissues, with 8 miRNAs showing increased expression and 4
miRNAs showing decreased expression in tumor tissues compared with
that in normal tissues (10).
Numerous studies have found a correlation between
miR-146a, 149, 196a2 and 499 and tumorigenesis and
tumor suppression. These miRNAs are associated with tumor
initiation, invasion, metastasis and proliferation through a
variety of mechanisms, and can also function as tumor suppressor
genes (4,11–13).
Thus, previous studies of miRNA have focused on miRNA regulation
and its influence on tumorigenesis. Nevertheless, the reasons for
the widespread differential expression of miRNAs in malignant cells
compared with that in normal cells are not fully elucidated.
Previous studies have reported miRNA polymorphisms
in various cancer types. miRNA single nucleotide polymorphisms
(SNPs) have been found to be associated with carcinogenesis,
progression, development and prognosis (14,15).
SNPs are known to affect miRNA expression and maturation (16). miR-146aC>G,
miR-149C>T, miR-196a2C>T and
miR-499A>G are well-known miRNA SNPs, and among these,
three variants (miR-146aC>G, miR-196a2C>T and
miR-499A>G) are located in the mature form of the
sequence, and the remaining variant (miR-149C>T) is
located in the precursor form of the sequence. A previous study
(14) reported that increased
expression of the miR-196a2C>T polymorphism was
associated with a decreased survival rate in patients with lung
cancer. In addition, other studies have reported significant
associations between the miR-196a2C>T polymorphism and
the prevalence of various cancer types and heart disease (17–22).
Furthermore, previous studies have suggested that
miR-146aC>G, miR-149C>T and
miR-499A>G variants are associated with heart disease and
esophageal cancer (18,19,22).
Recently, reports have found an association between
miRNAs and brain tumors. However, the function of miRNA
polymorphisms in brain tumors is unclear in terms of the
pathogenesis, and the majority of studies have been limited to
specific tumors. The results of these studies have been
inconsistent (11,14–24).
Thus, the present study sought to investigate the frequency of four
miRNA polymorphisms (146aC>G, 149C>T, 196aC>T and
499A>G) in brain tumors, specifically gliomas, meningiomas and
schwannomas.
Materials and methods
Study population
A total of 362 patients were enrolled, including 179
with brain tumors and 183 healthy controls. Patients with brain
tumors were diagnosed through imaging examinations, including
computed tomography and magnetic resonance imaging, and were
confirmed to have gliomas, meningiomas or schwannomas through
histopathological studies following surgical resection. Adults who
underwent a general health care examination at CHA Bundang Hospital
(Seongnam, South Korea) and who had no history of tumors, brain
diseases, including Alzheimer's disease, dementia, stroke or
intracerebral hemorrhage, or other underlying diseases were
selected for the control group. All study participants were fully
informed and received an explanation of the study, and provided
written informed consent; individuals who did not agree to the
study were excluded.
Genetic analysis
Genomic DNA was extracted using the G-DEX blood kit
(iNtRON Biotechnology, Inc., Seongnam, South Korea) from
anticoagulated peripheral blood, as previously described (25). The four miRNA polymorphisms of
interest (miR-146a, 149, 196a2 and 499) were
identified by a literature search using the key words ‘miRNA’ and
‘brain tumor’ in Pubmed (https://www.ncbi.nlm.nih.gov/pubmed). The genotype
examination conditions outlined in our previous study protocol were
used (25). Samples underwent
re-genotyping examination by an additional operator for
confirmation. In addition, 20% of the total samples were randomly
selected and the four miRNA polymorphisms were confirmed by
sequencing (ABI3730Xl DNA analyzer; Applied Biosystem; Thermo
Fisher Scientific, Inc., Waltham, MA, USA). PCR was performed with
conditions and primer and probe sequences as detailed in our
previous study (25).
Statistical analysis
The genotype and allele frequencies for miRNA
polymorphisms in the patients with brain tumors and the controls
were determined. The differences in the genotypes and allele
frequencies were analyzed using the χ2 test and Fisher's
exact test, respectively. Allelic frequencies included calculated
deviations based on the Hardy-Weinberg equilibrium, using P<0.05
as a threshold (26). As the
inferences of the present study were derived from multiple tests,
the Benjamini and Hochberg strategy was adopted, which effectively
reduced the potential impact of spurious significant results
(27). Statistical analyses were
performed that measured the efficacy of the association between
brain tumor and genotype based on multivariable logistic regression
and according to the statistical methods discussed by Kim and Hong
(28). The multifactor
dimensionality reduction method has been described in detail
previously (29–33). In addition, all possible
allele-allelic combinations were performed using HAPSTAT software
(v.3.0; www.bios.unc.edu/~lin/hapstat/). Survival analysis
estimated the adjusted hazard ratios (HRs) and their 95% confidence
intervals (CIs), with adjustment for age by multivariate Cox
proportion hazards regression.
Results
Participant characteristics
A total of 362 participants whose aged from 21 to 85
years were enrolled in the present study, including 183 healthy
controls (age range, 24–85 years) and 179 patients (age range,
21–78 years) with brain tumors. In the brain tumor group, 79
patients had gliomas, 69 had meningiomas and 31 had schwannomas.
The male:female ratio for all participants was 1:1.48 (1:1.88 for
the control group and 1:1.16 for the brain tumor group). The mean
age of all participants was 48.8±15.9 years (control group mean,
45.9±16.6 years; brain tumor group mean, 51.9±14.7 years) (Table I).
 | Table I.Demographic characteristics of
patients with brain tumor and control subjects. |
Table I.
Demographic characteristics of
patients with brain tumor and control subjects.
|
Characteristics | Control
(n=183) | Brain tumor
(n=179) |
|---|
| Sex
(male:female) | 1:1.88 | 1:1.16 |
| Age, years (mean ±
SD) | 45.9±16.6 | 51.9±14.7 |
| Hypertension,
n | − | 43 |
| Diabetes mellitus,
n | − | 21 |
| FBS, mg/dl (mean ±
SD) | − | 168.0±70.8 |
| Dyslipidemia,
n | − | 21 |
| T. chol, mg/dl
(mean ± SD) | − | 197.9±57.3 |
| Triglyceride, mg/dl
(mean ± SD) | − | 153.9±145.5 |
| HDL-C, mg/dl (mean
± SD) | − | 46.4±16.0 |
| LDL-C, mg/dl (mean
± SD) | − | 106.5±43.9 |
| BUN, mg/dl (mean ±
SD) | − | 22.3±19.7 |
| Creatinine, mg/dl
(mean ± SD) | − | 0.8±0.5 |
| Platelets,
103 cell/µl (mean ± SD) | − | 346.5±854.0 |
| Antithrombin, %
(mean ± SD) | − | 85.2±27.5 |
| aPTT, sec (mean ±
SD) | − | 34.2±21.5 |
| Prothrombin time,
sec (mean ± SD) | − | 12.5±2.7 |
| D-dimer, ng/ml
(mean ± SD) | − | 2925.8±2907.5 |
| Fibrinogen, mg/dl
(mean ± SD) | − | 477.8±195.9 |
| Hematocrit, % (mean
± SD) | − | 28.9±6.1 |
| Hemoglobin, mg/dl
(mean ± SD) | − | 9.5±2.6 |
Genetic analysis
The miR-146a rs2910164, miR-149
rs4846049, miR-196a2 rs11614913 and miR-499 rs3746444
polymorphisms were compared between the brain tumor and control
groups. Participant genotype and allelic frequencies of the four
miRNA polymorphisms are detailed in Table II. Analysis by tumor type found
that the frequencies of the dominant miR-149 genotype [odds
ratio (OR), 1.842; 95% CI, 1.074–3.159; P=0.02] and CC type of
miR-149 (OR, 2.771; 95% CI, 1.158–6.635; P=0.02) were
significantly increased compared with those of the TT and TC
genotypes for gliomas. The frequencies of the miR-146a,
miR-149, miR-196a2 and miR-499 genotypes were not
significantly different between the control group and the
meningioma or schwannoma patient groups.
| Table II.Genotype frequencies of miRNA
polymorphisms between patients with three different brain tumor
subtypes [glioma (n=79), meningioma (n=69) and schwannoma (n=31)]
and control subjects (n=183). |
Table II.
Genotype frequencies of miRNA
polymorphisms between patients with three different brain tumor
subtypes [glioma (n=79), meningioma (n=69) and schwannoma (n=31)]
and control subjects (n=183).
|
|
| Glioma | Meningioma | Schwannoma |
|---|
|
|
|
|
|
|
|---|
| Genotypes | Controls, n
(%) | n (%) | AOR (95% CI) |
P-valuea | FDR-P-value | Statistical power,
% | n (%) | AOR (95% CI) |
P-valuea | FDR-P-value | Statistical power,
% | n (%) | AOR (95% CI) |
P-valuea | FDR-P-value | Statistical power,
% |
|---|
|
miR-146aC>G |
| CC | 70 (38.3) | 30 (38.0) | 1.000 |
|
|
| 28 (40.6) | 1.000 |
|
|
| 10 (32.3) | 1.000 |
|
|
|
|
|
|
| (reference) |
|
|
|
| (reference) |
|
|
|
| (reference) |
|
|
|
| CG | 88 (48.1) | 34 (43.0) | 0.902 | 0.727 | 0.969 | 5.1 | 32 (46.4) | 0.909 | 0.754 | 0.898 | 5.7 | 17 (54.8) | 1.352 | 0.482 | 0.749 | 7.6 |
|
|
|
| (0.503–1.615) |
|
|
|
| (0.501–1.651) |
|
|
|
| (0.583–3.138) |
|
|
|
| GG | 25 (13.7) | 15 (19.0) | 1.400 | 0.392 | 0.467 | 12.6 | 9 (13.0) | 0.900 | 0.814 | 0.814 | 4.2 | 4 (12.9) | 1.120 | 0.859 | 0.859 | 3.8 |
|
|
|
| (0.648–3.023) |
|
|
|
|
(0.374–2.168) |
|
|
|
| (0.322–3.895) |
|
|
|
|
Dominant (CC vs. CG+GG) |
|
| 1.012 | 0.966 | 0.966 | 4.1 |
| 0.907 | 0.735 | 0.747 | 5.5 |
| 1.301 | 0.524 | 0.726 | 8.2 |
|
|
|
| (0.5881.742) |
|
|
|
| (0.515–1.597) |
|
|
|
| (0.579–2.924) |
|
|
|
|
Recessive (CC+CG vs. GG) |
|
| 1.481 | 0.273 | 0.364 | 17.5 |
| 0.948 | 0.898 | 0.994 | 3.9 |
| 0.936 | 0.909 | 0.909 | 3.0 |
|
|
|
| (0.733–2.992) |
|
|
|
| (0.418–2.148) |
|
|
|
| (0.302–2.903) |
|
|
|
|
miR-149T>C |
| TT | 97 (53.0) | 30 (38.0) | 1.000 |
|
|
| 35 (50.7) | 1.000 |
|
|
| 18 (58.1) | 1.000 |
|
|
|
|
|
|
| (reference) |
|
|
|
| (reference) |
|
|
|
| (reference) |
|
|
|
| TC | 72 (39.3) | 37 (46.8) | 1.662 | 0.081 | 0.162 | 49.3 | 27 (39.1) | 1.039 | 0.898 | 0.898 | 4.2 | 11 (35.5) | 0.823 | 0.638 | 0.749 | 6.3 |
|
|
|
| (0.940–2.938) |
|
|
|
| (0.578–1.870) |
|
|
|
| (0.366–1.850) |
|
|
|
| CC | 14 (7.7) | 12 (15.2) | 2.771 | 0.022 | 0.088 | 67.4 | 7 (10.1) | 1.386 | 0.517 | 0.814 | 8.7 | 2 (6.5) | 0.770 | 0.743 | 0.859 | 1.8 |
|
|
|
| (1.158–6.635) |
|
|
|
| (0.517–3.715) |
|
|
|
| (0.161–3.681) |
|
|
|
|
Dominant (TT vs. TC+CC) |
|
| 1.842 | 0.026 | 0.104 | 68.1 |
| 1.096 | 0.747 | 0.747 | 5.9 |
| 0.815 | 0.602 | 0.726 | 5.9 |
|
|
|
| (1.074–3.159) |
|
|
|
| (0.630–1.907) |
|
|
|
| (0.377–1.760) |
|
|
|
|
Recessive (TT+TC vs. CC) |
|
| 2.162 | 0.066 | 0.264 | 48.8 |
| 1.363 | 0.524 | 0.994 | 8.6 |
| 0.833 | 0.815 | 0.909 | 1.9 |
|
|
|
| (0.951–4.916) |
|
|
|
| (0.526–3.534) |
|
|
|
| (0.180–3.857) |
|
|
|
|
miR-196a2T>C |
| TT | 46 (25.1) | 22 (27.8) | 1.000 |
|
|
| 20 (29.0) | 1.000 |
|
|
| 10 (32.3) | 1.000 |
|
|
|
|
|
|
| (reference) |
|
|
|
| (reference) |
|
|
|
| (reference) |
|
|
|
| TC | 92 (50.3) | 44 (55.7) | 1.000 | 1.000 | 1.000 | 4.1 | 32 (46.4) | 0.800 | 0.508 | 0.898 | 8.9 | 15 (48.4) | 0.750 | 0.519 | 0.749 | 8.9 |
|
|
|
| (0.537–1.863) |
|
|
|
| (0.413–1.550) |
|
|
|
| (0.313–1.799) |
|
|
|
| CC | 45 (24.6) | 13 (16.5) | 0.604 | 0.216 | 0.432 | 22.6 | 17 (24.6) | 0.869 | 0.719 | 0.814 | 4.6 | 6 (19.4) | 0.613 | 0.380 | 0.859 | 9.6 |
|
|
|
| (0.272–1.344) |
|
|
|
| (0.404–1.869) |
|
|
|
| (0.206–1.829) |
|
|
|
|
Dominant (TT vs. TC+CC) |
|
| 0.870 | 0.646 | 0.861 | 6.4 |
| 0.823 | 0.536 | 0.747 | 8.6 |
| 0.705 | 0.406 | 0.726 | 12.0 |
|
|
|
| (0.480–1.577) |
|
|
|
| (0.443–1.526) |
|
|
|
| (0.309–1.607) |
|
|
|
|
Recessive (TT+TC vs. CC) |
|
| 0.604 | 0.148 | 0.296 | 27.4 |
| 1.003 | 0.994 | 0.994 | 4.1 |
| 0.736 | 0.528 | 0.909 | 6.1 |
|
|
|
| (0.305–1.196) |
|
|
|
| (0.527–1.907) |
|
|
|
| (0.284–1.908) |
|
|
|
|
miR-499A>G |
| AA | 112 (61.2) | 58 (73.4) | 1.000 |
|
|
| 44 (63.8) | 1.000 |
|
|
| 20 (64.5) | 1.000 |
|
|
|
|
|
|
| (reference) |
|
|
|
| (reference) |
|
|
|
| (reference) |
|
|
|
| AG | 64 (35.0) | 19 (24.1) | 0.573 | 0.070 | 0.162 | 42.1 | 24 (34.8) | 0.955 | 0.876 | 0.898 | 4.3 | 10 (32.3) | 0.875 | 0.749 | 0.749 | 4.6 |
|
|
|
| (0.314–1.047) |
|
|
|
| (0.532–1.713) |
|
|
|
| (0.386–1.985) |
|
|
|
| GG | 7 (3.8) | 2 (2.5) | 0.552 | 0.467 | 0.467 | 4.4 | 1 (1.4) | 0.364 | 0.351 | 0.814 | 3.5 | 1 (3.2) | 0.800 | 0.839 | 0.859 | 1.3 |
|
|
|
| (0.111–2.741) |
|
|
|
| (0.044–3.042) |
|
|
|
| (0.093–6.858) |
|
|
|
|
Dominant (AA vs. AG+GG) |
|
| 0.571 | 0.059 | 0.118 | 45.2 |
| 0.896 | 0.708 | 0.747 | 5.5 |
| 0.868 | 0.726 | 0.726 | 5.4 |
|
|
|
| (0.320–1.021) |
|
|
|
| (0.505–1.591) |
|
|
|
| (0.392–1.919) |
|
|
|
|
Recessive (AA+AG vs. G) |
|
| 0.653 |
|
|
|
|
|
|
|
|
|
|
|
|
|
|
|
|
| (0.133–3.216) | 0.600 | 0.600 | 2.9 |
| 0.370 | 0.356 | 0.994 | 3.6 |
| 0.838 | 0.871 | 0.909 | 1.4 |
|
|
|
|
|
|
|
|
| (0.045–3.062) |
|
|
|
| (0.100–7.058) |
|
|
|
Allele combination analysis according
to subgroup
ORs for gliomas, meningiomas and schwannomas are
detailed in Tables III, IV and V,
respectively. The ORs for glioma were increased in the following
combinations: i) CCCG, CTCG and GCTG haplotypes of
miR-146aC>G, miR-149T>C, miR-196a2T>C
and miR-499A>G; ii) GCT haplotype of
miR-146aC>G, miR-149T>C and
miR-196a2T>C; iii) CCG haplotype of miR-149T>C,
miR-196a2T>C and miR-499A>G; iv) GC haplotype
of miR-146aC>G and miR-149T>C; and v) CA
haplotype of miR-149T>C and miR-499A>G
(Table III). For meningiomas, the
ORs were increased in the following combinations: i) GTCG haplotype
of miR-146aC>G, miR-149T>C,
miR-196a2T>C and miR-499A>G; ii) GCG haplotype
of miR-146aC>G, miR-196a2T>C and
miR-499A>G; and iii) CCG haplotype of
miR-149T>C, miR-196a2T>C and miR-499A>G
(Table IV). The ORs for
schwannomas were increased in the following combinations: i) GCTG
haplotype of miR-146aC>G, miR-149T>C,
miR-196a2T>C and miR-499A>G; and ii) CCG
haplotype of miR-149T>C, miR-196a2T>C and
miR-499A>G (Table V).
| Table III.Allele combination of miRNA
polymorphisms between glioma patients (2n=158) and control subjects
(2n=366). |
Table III.
Allele combination of miRNA
polymorphisms between glioma patients (2n=158) and control subjects
(2n=366).
|
|
|
| Reference vs.
Allele combination | Overall vs. Allele
combination |
|---|
|
|
|
|
|
|
|---|
| Allele
combination | Controls, n
(%) | Glioma, n (%) | OR (95% CI) |
P-valuea | FDR-P-value | OR (95% CI) |
P-valuea | FDR-P-value |
|---|
|
miR-146aC>G/miR-149T>C/miR-196a2T>C/miR-499A>G |
|
C-T-T-A | 51 (14.0) | 28 (17.8) | 1.000
(reference) |
|
| 1.272
(0.773–2.091) | 0.361 | 0.525 |
|
C-T-C-G | 26 (7.0) | 3 (1.7) | 0.210
(0.058–0.757) | 0.015 | 0.045 | 0.267
(0.080–0.896) | 0.021 | 0.048 |
|
C-C-T-G | 16 (4.4) | 0 (0.0) | 0.055
(0.003–0.948) | 0.003 | 0.015 | 0.070
(0.004–1.176) | 0.005 | 0.020 |
|
C-C-C-G | 0 (0.0) | 4 (2.6) | 16.260
(0.844–313.200) | 0.020 | 0.050 | 20.810
(1.113–389.100) | 0.009 | 0.024 |
|
G-T-C-A | 53 (14.6) | 6 (4.0) | 0.206
(0.079–0.540) | 0.001 | 0.015 | 0.262
(0.110–0.623) | 0.001 | 0.008 |
|
G-T-C-G | 0 (0.0) | 6 (3.8) | 23.490
(1.275–432.700) | 0.003 | 0.015 | 30.060
(1.682–537.200) | 0.001 | 0.008 |
|
G-C-T-A | 14 (3.8) | 17 (10.9) | 2.212
(0.951–5.146) | 0.085 | 0.159 | 2.813
(1.353–5.847) | 0.008 | 0.024 |
|
G-C-T-G | 0 (0.1) | 5 (2.9) | 19.880
(1.060–372.900) | 0.008 | 0.030 | 25.440
(1.397–463.100) | 0.003 | 0.016 |
|
miR-146aC>G/miR-149T>C/miR-196a2T>C |
|
C-T-T | 77 (21.0) | 33 (20.7) | 1.000
(reference) |
|
| 0.993
(0.634–1.555) | 1.000 | 1.000 |
|
G-T-C | 53 (14.5) | 10 (6.5) | 0.440
(0.200–0.970) | 0.045 | 0.158 | 0.437
(0.217–0.881) | 0.018 | 0.072 |
|
G-C-T | 14 (3.7) | 17 (10.6) | 2.833
(1.252–6.412) | 0.018 | 0.126 | 2.813
(1.353–5.847) | 0.008 | 0.064 |
|
miR-146aC>G/miR-149T>C/miR-499A>G |
|
C-T-A | 116 (31.8) | 57 (36.1) | 1.000
(reference) |
|
| 1.138
(0.788–1.645) | 0.507 | 0.579 |
|
C-T-G | 51 (13.9) | 9 (5.5) | 0.359
(0.165–0.781) | 0.008 | 0.056 | 0.409
(0.196–0.851) | 0.015 | 0.120 |
|
miR-146aC>G/miR-196a2T>C/miR-499A>G |
|
C-T-A | 81 (22.2) | 45 (28.2) | 1.000
(reference) |
|
| 1.287
(0.855–1.938) | 0.240 | 0.384 |
|
C-T-G | 42 (11.3) | 6 (3.8) | 0.257
(0.102–0.652) | 0.003 | 0.021 | 0.331
(0.138–0.794) | 0.008 | 0.064 |
|
G-C-A | 72 (19.8) | 20 (12.7) | 0.500
(0.270–0.925) | 0.035 | 0.123 | 0.644
(0.379–1.093) | 0.106 | 0.212 |
|
miR-149T>C/miR-196a2T>C/miR-499A>G |
|
T-T-A | 93 (25.3) | 45 (28.3) | 1.000
(reference) |
|
| 1.121
(0.750–1.675) | 0.604 | 0.690 |
|
C-C-G | 0 (0.0) | 8 (5.0) | 34.930
(1.971–619.100) | 0.0002 | 0.001 | 39.310
(2.254–685.700) | <0.0001 | 0.001 |
|
miR-146aC>G/miR-149T>C |
|
C-T | 167 (45.8) | 66 (41.6) | 1.000
(reference) |
|
| 0.916
(0.651–1.287) | 0.666 | 0.804 |
|
G-C | 39 (10.8) | 33 (20.8) | 2.141
(1.242–3.690) | 0.009 | 0.027 | 1.960
(1.189–3.231) | 0.010 | 0.040 |
|
miR-146aC>G/miR-499A>G |
|
C-A | 163 (44.4) | 81 (51.6) | 1.000
(reference) |
|
| 1.151
(0.831–1.594) | 0.404 | 0.539 |
|
C-G | 65 (17.9) | 13 (7.9) | 0.403
(0.210–0.773) | 0.006 | 0.018 | 0.463
(0.248–0.865) | 0.015 | 0.060 |
|
miR-149T>C/miR-499A>G |
|
T-A | 206 (56.2) | 83 (52.6) | 1.000
(reference) |
|
| 0.933
(0.681–1.280) | 0.689 | 0.830 |
|
C-A | 82 (22.5) | 52 (32.9) | 1.574
(1.023–2.422) | 0.044 | 0.132 | 1.469
(0.990–2.179) | 0.062 | 0.124 |
|
miR-196a2T>C/miR-499A>G |
|
T-A | 134 (36.7) | 78 (49.3) | 1.000
(reference) |
|
| 1.348
(0.964–1.887) | 0.082 | 0.164 |
|
T-G | 50 (13.6) | 10 (6.4) | 0.344
(0.165–0.716) | 0.003 | 0.009 | 0.463
(0.229–0.937) | 0.034 | 0.136 |
|
C-A | 154 (42.0) | 57 (36.2) | 0.636
(0.421–0.961) | 0.037 | 0.056 | 0.857
(0.600–1.225) | 0.421 | 0.561 |
| Table IV.Allele combination of miRNA
polymorphisms between patients with meningioma (2n=138) and control
subjects (2n=366). |
Table IV.
Allele combination of miRNA
polymorphisms between patients with meningioma (2n=138) and control
subjects (2n=366).
|
|
|
| Reference vs.
Allele combination | Overall vs. Allele
combination |
|---|
|
|
|
|
|
|
|---|
| Allele
combination | Controls, n
(%) | Meningioma, n
(%) | OR (95% CI) |
P-valuea | FDR-P-value | OR (95% CI) |
P-valuea | FDR-P-value |
|---|
|
miR-146aC>G/miR-149T>C/miR-196a2T>C/miR-499A>G |
|
C-T-T-A | 51 (14.0) | 26 (18.7) |
|
|
| 1.352
(0.811–2.255) | 0.277 | 0.462 |
|
C-T-C-G | 26 (7.0) | 0 (0.0) | 0.037
(0.002–0.626) | 0.0002 | 0.003 | 0.050
(0.003–0.826) | 0.0002 | 0.003 |
|
G-T-C-A | 53 (14.6) | 6 (4.7) | 0.222
(0.084–0.584) | 0.002 | 0.014 | 0.300
(0.126–0.714) | 0.004 | 0.030 |
|
G-T-C-G | 0 (0.0) | 4 (2.8) | 17.490
(0.907–337.500) | 0.017 | 0.079 | 23.820
(1.273–445.600) | 0.006 | 0.030 |
|
miR-146aC>G/miR-149T>C/miR-196a2T>C |
|
C-T-T | 77 (21.0) | 41 (29.5) | 1.000
(reference) |
|
| 1.412
(0.922–2.164) | 0.115 | 0.308 |
|
C-T-C | 89 (24.3) | 23 (16.9) | 0.485
(0.268–0.880) | 0.019 | 0.112 | 0.685
(0.416–1.128) | 0.154 | 0.308 |
|
C-C-T | 46 (12.7) | 10 (7.3) | 0.408
(0.187–0.892) | 0.032 | 0.112 | 0.577
(0.283–1.174) | 0.151 | 0.308 |
|
miR-146aC>G/miR-149T>C/miR-499A>G |
|
C-T-A | 116 (31.8) | 54 (39.3) | 1.000
(reference) |
|
| 1.235
(0.846–1.801) | 0.281 | 0.664 |
|
C-T-G | 51 (13.9) | 10 (7.4) | 0.421
(0.199–0.893) | 0.029 | 0.203 | 0.520
(0.257–1.053) | 0.066 | 0.528 |
|
miR-146aC>G/miR-196a2T>C/miR-499A>G |
|
C-T-A | 81 (22.2) | 36 (25.8) | 1.000
(reference) |
|
| 1.179
(0.760–1.828) | 0.493 | 0.789 |
|
G-C-G | 4 (1.2) | 7 (5.2) | 3.938
(1.084–14.300) | 0.042 | 0.186 | 4.641
(1.337–16.110) | 0.014 | 0.112 |
|
miR-149T>C/miR-196a2T>C/miR-499A>G |
|
T-T-A | 93 (25.3) | 47 (34.0) | 1.000
(reference) |
|
| 1.340
(0.897–2.003) | 0.170 | 0.496 |
|
C-C-G | 0 (0.0) | 5 (4.0) | 21.650
(1.172–400.200) | 0.005 | 0.035 | 29.110
(1.598–530.300) | 0.002 | 0.016 |
|
miR-149T>C/miR-196a2T>C |
|
T-T | 126 (34.4) | 58 (41.9) | 1.000
(reference) |
|
| 1.221
(0.845–1.763) | 0.295 | 0.295 |
|
T-C | 140 (38.3) | 39 (28.4) | 0.605
(0.378–0.970) | 0.044 | 0.096 | 0.739
(0.493–1.108) | 0.165 | 0.264 |
| Table V.Allele combination of miRNA
polymorphisms between patients with Schwannoma (2n=62) and control
subjects (2n=366). |
Table V.
Allele combination of miRNA
polymorphisms between patients with Schwannoma (2n=62) and control
subjects (2n=366).
|
|
|
| Reference vs.
Allele combination | Overall vs. Allele
combination |
|---|
|
|
|
|
|
|
|---|
| Allele
combination | Controls, n
(%) | Schwannoma, n
(%) | OR (95% CI) |
P-valuea | FDR-P-value | OR (95% CI) |
P-valuea | FDR-P-value |
|---|
|
miR-146aC>G/miR-149T>C/miR-196a2T>C/miR-499A>G |
|
C-T-T-A | 51 (14.0) | 18 (28.6) | 1.000
(reference) |
|
| 2.083
(1.142–3.801) | 0.021 | 0.135 |
|
C-T-C-A | 63 (17.3) | 3 (4.6) | 0.135
(0.038–0.484) | 0.001 | 0.013 | 0.281
(0.086–0.923) | 0.029 | 0.135 |
|
C-C-T-G | 16 (4.4) | 0 (0.0) | 0.084
(0.005–1.479) | 0.019 | 0.095 | 0.178
(0.011–3.002) | 0.144 | 0.504 |
|
G-T-T-A | 39 (10.6) | 4 (6.3) | 0.291
(0.091–0.928) | 0.049 | 0.127 | 0.606
(0.209–1.754) | 0.490 | 0.858 |
|
G-C-T-A | 14 (3.8) | 0 (0.0) | 0.096
(0.005–1.692) | 0.033 | 0.107 | 0.202
(0.012–3.435) | 0.235 | 0.632 |
|
G-C-T-G | 0 (0.1) | 3 (4.3) | 19.490
(0.959–395.800) | 0.022 | 0.095 | 41.050
(2.093–805.000) | 0.003 | 0.042 |
|
miR-146aC>G/miR-149T>C/miR-196a2T>C |
|
C-T-T | 77 (21.0) | 20 (32.2) | 1.000
(reference) |
|
| 1.533
(0.875–2.687) | 0.162 | 0.627 |
|
C-T-C | 89 (24.3) | 8 (12.5) | 0.346
(0.144–0.830) | 0.023 | 0.161 | 0.531
(0.245–1.148) | 0.135 | 0.627 |
|
miR-146aC>G/miR-196a2T>C/miR-499A>G |
|
C-T-A | 81 (22.2) | 22 (36.0) | 1.000
(reference) |
|
| 1.603
(0.932–2.759) | 0.098 | 0.302 |
|
C-C-A | 81 (22.2) | 7 (11.0) | 0.318
(0.129–0.786) | 0.014 | 0.084 | 0.510
(0.225–1.156) | 0.122 | 0.302 |
|
G-T-A | 53 (14.5) | 4 (6.5) | 0.278
(0.091–0.852) | 0.024 | 0.084 | 0.446
(0.156–1.275) | 0.151 | 0.302 |
|
miR-149T>C/miR-196a2T>C/miR-499A>G |
|
T-T-A | 93 (25.3) | 19 (31.4) | 1.000
(reference) |
|
| 1.206
(0.687–2.116) | 0.552 | 0.877 |
|
T-C-G | 27 (7.5) | 0 (0.0) | 0.087
(0.005–1.492) | 0.024 | 0.084 | 0.107
(0.006–1.772) | 0.037 | 0.148 |
|
C-C-G | 0 (0.0) | 3 (5.1) | 33.560
(1.665–676.700) | 0.006 | 0.042 | 41.050
(2.093–805.000) | 0.003 | 0.024 |
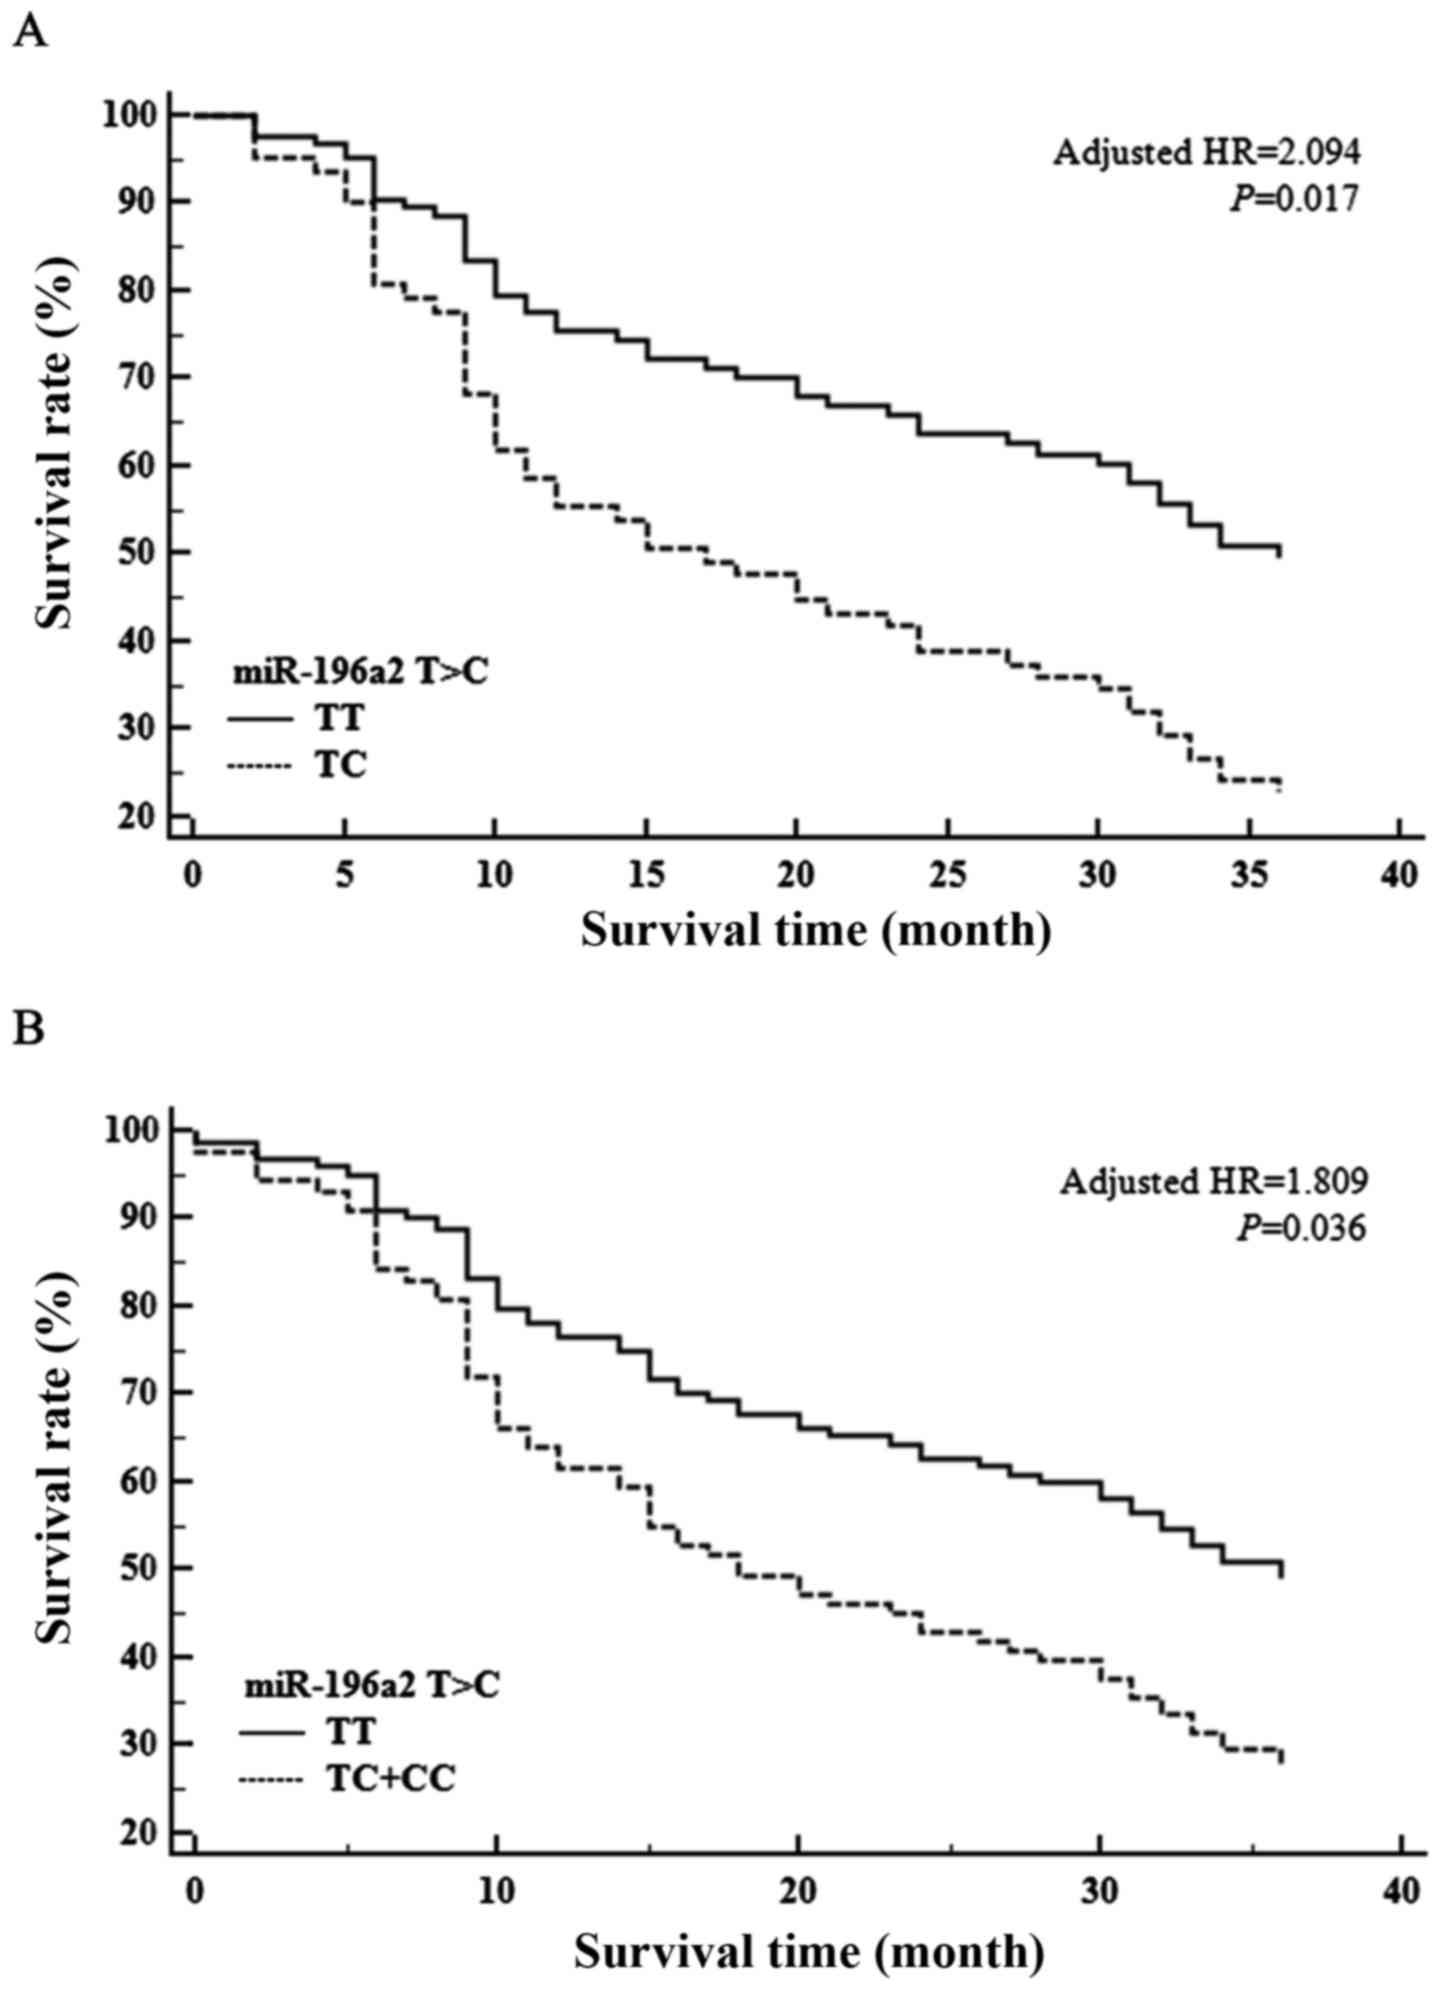
Multivariate survival analysis
according to genotypes
Fig. 1 shows the
association between the overall survival (OS) of patients with
brain tumors and the four pre-miRNA SNPs. No significant
association was found between OS and miR-146a, miR-149 or
miR-499; however, miR-196a2T>C was associated with
a significantly shorter OS time (adjusted HR, 2.094; 95% CI,
1.147–3.823; P=0.017; Fig. 1).
Additionally, when OS was analyzed according to the dominant
genotype (TT vs. TC+CC), a poorer OS time was associated with the
miR-196a2 C allele (HR, 1.809; 95% CI, 1.043–3.137; P=0.036;
Fig. 1).
Discussion
Brain tumors can cause severe impairment and impose
a decreased quality of life, often resulting in mortality (34,35).
The overall incidence rate of all brain tumors is 10.82 per 100,000
person-years (36). In the 2013
Central Brain Tumor Registry of the United States report, the
average annual age-adjusted incidence rate of glioblastoma was 3.19
per 100,000 individuals, which was the highest incidence among all
types of brain and central nervous system (CNS) tumors. Meningioma
is the second most common type of brain tumor (37). Sex and age standardized incidence
rates range from 1.28 per 100,000 individuals to 7.80 per 100,000
individuals for cerebral meningioma. The overall incidence rate of
schwannomas was 1.2 per 100,000 individuals per year in the United
States in the period between 2004 and 2009 (38).
Studies on the pathogenesis of brain tumors are
ongoing. For several decades, studies have identified molecular
alterations characterizing gliomas and reported decreased
expression of tumor suppressor genes, such as retinoblastoma
transcriptional corepressor 1 and p53, or alterations of genes in
pathways associated with tumor suppressors (39). In addition, genetic variants,
including isocitrate dehydrogenase 1 and phosphatase and tensin
homolog (PTEN), have been reported in gliomas (40–42).
Chromosomal anomalies, aberrant cellular pathways and alterations
in tumor suppressor genes are associated with meningioma
pathogenesis (43–46). Schwannomas are directly associated
with genetic changes in neurofibromin 2 gene inactivation (47). However, no clear mechanism of the
pathogenesis for all brain tumors has been identified.
miRNAs regulate target gene expression at the
post-transcriptional level. miRNAs control key physiological
processes, including cell growth, differentiation and apoptosis,
which suggests that miRNA gene abnormality could be involved in
tumorigenesis (1–3,48). The
correlation between cancer and miRNAs was established in 2002
(49). Certain miRNA abnormalities
have been associated with cancer types, and with carcinogenesis and
progression (1,3–5). The
results reported in the present study suggest that identifying
miRNAs and their targets may provide potential diagnostic and
prognostic tumor biomarkers and novel cancer therapeutic
strategies. Studies of miRNAs associated with brain tumors are
ongoing. miRNAs are associated with regulation of tumorigenic cells
in CNS tumors, and certain miRNAs are oncogenes (4,50,51).
miRNAs also regulate tumor invasion, metastasis and cell apoptosis,
and are involved in tumor chemoresistance and radioresistance
(52–54).
Recent epidemiological studies have demonstrated
that miRNA variants cause altered expression and are associated
with the risk of cancer (55). For
example, miRNA-146a antagonizes the expression of interleukin
(IL)-1β, tumor necrosis factor-α and nuclear factor-κB (56). miR-146a is known to be
important for tumor proliferation and metastatic ability (23). In addition, certain studies have
suggested that miR-196a dysfunction is associated with tumor
abnormality (13). miR-196a2
has a double mature strand containing a 5′-end strand
(hsa-miR-196a2−5p) and a 3′-end strand
(hsa-miR-196a2−3p), and the miR-196a2 rs11614913
T>C polymorphism is located in the hsa-miR-196a-3p sequence. The
rs11612913 SNP may influence the maturation of hsa-miR-196a. In
other words, this polymorphism may affect or alter the expression
of the target, which may be involved in regulating carcinogenesis.
Several studies have identified miR-499A>G as a potential
marker for a number of cancer types, including breast cancer,
gastric cancer, squamous cell carcinoma and hepatocellular
carcinoma (11,14,24).
The miR-499 rs3746444 A>G polymorphism is located in the
stem loop. To date, few studies have investigated rs2292932 in
miR-149 compared with the three other genes. Li et al
(12) suggested that miR-149
inhibits associated fibroblasts by regulating prostaglandin E2 and
IL-6 in tumor cells (12).
The present study identified the genotypic
distribution of the four most common miRNAs associated with tumors
(i.e., miR-146a, miR-149, miR-196a2 and
miR-499) in patients with glioma, meningioma or schwannoma.
In this Korean population, the frequencies of the dominant
miR-149 genotype and the CC genotype were significantly
increased compared with those of the TT and TC genotypes in the
patients with glioma. However, the frequency of the miR-146a
rs2910164 C>G, 196a2 rs11614913 T>C and 499 rs3746444 A>G
polymorphisms were not significantly different between the control
group and the tumor group. To date, there have been considerably
fewer studies on miR-149 than on other miRNAs, particularly
concerning the association of miR-149 with brain tumors. One
previous study of the association between miR-149 and brain
tumors reported that increased miR-149 levels downregulate
tumor proliferation and metastasis in glioblastoma (57). miR-149 regulates cell
cycle-related genes and controls potential proliferation and
invasion activity of glioma cells through a mechanism that induces
arrest at the G0/G1 phase (58). However, the manner in which miRNAs
affect tumorigenesis or suppression of brain tumors is not yet
known, and the results differ by study and participant ethnicity.
Analysis of haplotype frequencies according to brain tumor type
showed that odds ratios were higher in certain haplotypes in the
present study. In particular, the GCTG haplotype of
miR-146aC>G, miR-149T>C, miR-196a2T>C
and miR-499A>G had increased the ORs for gliomas and
schwannomas. The CCG haplotype of miR-149T>C,
miR-196a2T>C and miR-499A>G showed increased
ORs for all three types of brain tumors. However, the mechanism by
which certain haplotypes simultaneously increase the risk for
various tumors has not been determined.
The miR-196a2 rs11614913C allele has been
reported to be associated with the risk of various cancer types in
several studies. Hu et al (14) showed that the miR-196a2
rs11614913C allele was associated with a significant risk of breast
cancer. In addition, Tian et al (17) demonstrated that the miR-196a2
rs11614913 CC type posed a significant risk of lung cancer in
Chinese individuals. Moreover, several studies suggested the
association of the miR-196a2C allele with an elevated risk
of various cancer types, including hepatoma, gastric cancer and
esophageal squamous cell carcinoma (20–22).
To date, there have been only two reports on the effects of an
association between miR-196a2 and brain tumor prognosis
(59,60). The present study showed that the
miR-196a2T>C polymorphism was a significant factor for
mortality in Korean patients with brain tumors. However, as the
survival analysis included the entire brain tumor group, care must
be taken when interpreting these results.
The present study had several limitations. First,
the way in which miRNA genetic variants affect brain tumor
progression remains unclear. Second, in this study, the expression
patterns of the four miRNAs in gliomas, meningiomas and schwannomas
samples could not be identified as the biopsy samples were in poor
condition and the number of tissue samples was insufficient.
Therefore, the acquisition of tissue samples is currently being
attempted and further studies are being planned. Third, the sample
size of this study is limited in number. Lastly, the analysis was
performed in a solely Korean population. Although the results
present the first evidence for utilization of miRNA polymorphisms
as diagnostic and prognostic markers of brain tumor risk, further
research in large and diverse cohorts is necessary. Based on the
results from this study, a future large-population study is
required to identify the association between brain tumors and
miRNAs beyond the four miRNAs tested here. In addition, the
expression patterns of miRNAs in brain tumors and normal tissues
require further study, as does the function of cultured cell lines
derived from brain tumors, including gliomas, meningiomas and
schwannomas. Additional studies will also be necessary to determine
the mechanism by which miRNAs affect carcinogenesis and tumor
progression. In conclusion, the present study analyzed the
association between the miR-149 rs2292832 C>T
polymorphism and glioma susceptibility and found allele-allelic
combinations in which miRNA polymorphisms were positively
associated with glioma, meningioma and schwannoma
susceptibility.
Acknowledgements
The abstract of this paper was presented at the 5th
Quadrennial Meeting of the World Federation of Neuro-Oncology
Societies, May 4–7, 2017, in Zurich, Switzerland, and was published
as Abstract no. p08.33 in Neuro-Oncology (Suppl 3) 2017.
Funding
This study was supported by the Industrial
Technology Innovation Program through the Ministry of Trade,
Industry and Energy (Korea), funded by the Ministry of Trade,
Industry and Energy, Republic of Korea (grant no. 10067378), and
supported by a grant of the Korea Health Technology Research and
Development Project through the Korea Health Industry Development
Institute, funded by the Ministry of Health and Welfare, Republic
of Korea (grant no. HI15C1972010015).
Availability of data and materials
The datasets used during the present study are
available from the corresponding author upon reasonable
request.
Authors' contributions
KC and NKK conceived and designed the experiments.
JOK and HSP performed the experiments. JL, JOK, HSP, IBH, KK, KC
and NKK analyzed the data. JL, JOK, HSP, IBH, KC and NKK were
responsible for reagents, materials and analysis tools. JL and JOK
wrote the paper. KC and NKK performed the article editing.
Ethics approval and consent to
participate
All study protocols were reviewed and approved by
The Institutional Review Board of CHA Bundang Medical Center
(Seongnam, South Korea) and followed the recommendations of the
Declaration of Helsinki. All patients provided written informed
consent.
Patient consent for publication
All patients provided written informed consent for
publication.
Competing interests
The authors have no competing interests to
declare.
References
|
1
|
Bandres E, Agirre X, Ramirez N, Zarate R
and Garcia-Foncillas J: MicroRNAs as cancer players: Potential
clinical and biological effects. DNA Cell Biol. 26:273–282. 2007.
View Article : Google Scholar : PubMed/NCBI
|
|
2
|
Deng S, Calin GA, Croce CM, Coukos G and
Zhang L: Mechanisms of microRNA deregulation in human cancer. Cell
Cycle. 7:2643–2646. 2008. View Article : Google Scholar : PubMed/NCBI
|
|
3
|
Ruan K, Fang X and Ouyang G: MicroRNAs:
Novel regulators in the hallmarks of human cancer. Cancer Lett.
285:116–126. 2009. View Article : Google Scholar : PubMed/NCBI
|
|
4
|
Garg N, Vijayakumar T, Bakhshinyan D,
Venugopal C and Singh SK: MicroRNA regulation of brain tumour
initiating cells in central nervous system tumours. Stem Cells Int.
2015:1417932015. View Article : Google Scholar : PubMed/NCBI
|
|
5
|
Iorio MV, Ferracin M, Liu CG, Veronese A,
Spizzo R, Sabbioni S, Magri E, Pedriali M, Fabbri M, Campiglio M,
et al: MicroRNA gene expression deregulation in human breast
cancer. Cancer Res. 65:7065–7070. 2005. View Article : Google Scholar : PubMed/NCBI
|
|
6
|
Kreth S, Thon N and Kreth FW: Epigenetics
in human gliomas. Cancer Lett. 342:185–192. 2014. View Article : Google Scholar : PubMed/NCBI
|
|
7
|
Hummel R, Maurer J and Haier J: MicroRNAs
in brain tumors: A new diagnostic and therapeutic perspective? Mol
Neurobiol. 44:223–234. 2011. View Article : Google Scholar : PubMed/NCBI
|
|
8
|
Galani V, Lampri E, Varouktsi A, Alexiou
G, Mitselou A and Kyritsis AP: Genetic and epigenetic alterations
in meningiomas. Clin Neurol Neurosurg. 158:119–125. 2017.
View Article : Google Scholar : PubMed/NCBI
|
|
9
|
Murnyák B, Bognár L, Klekner Á and
Hortobágyi T: Epigenetics of meningiomas. Biomed Res Int.
2015:5324512015. View Article : Google Scholar : PubMed/NCBI
|
|
10
|
Saydam O, Senol O, Würdinger T, Mizrak A,
Ozdener GB, Stemmer-Rachamimov AO, Yi M, Stephens RM, Krichevsky
AM, Saydam N, et al: miRNA-7 attenuation in Schwannoma tumors
stimulates growth by upregulating three oncogenic signaling
pathways. Cancer Res. 71:852–861. 2011. View Article : Google Scholar : PubMed/NCBI
|
|
11
|
Catucci I, Yang R, Verderio P, Pizzamiglio
S, Heesen L, Hemminki K, Sutter C, Wappenschmidt B, Dick M, Arnold
N, et al: Evaluation of SNPs in miR-146a, miR-196a2 and miR-499 as
low-penetrance alleles in German and Italian familial breast cancer
cases. Hum Mutat. 31:E1052–E1057. 2010. View Article : Google Scholar : PubMed/NCBI
|
|
12
|
Li P, Shan JX, Chen XH, Zhang D, Su LP,
Huang XY, Yu BQ, Zhi QM, Li CL, Wang YQ, et al: Epigenetic
silencing of microRNA-149 in cancer-associated fibroblasts mediates
prostaglandin E2/interleukin-6 signaling in the tumor
microenvironment. Cell Res. 25:588–603. 2015. View Article : Google Scholar : PubMed/NCBI
|
|
13
|
Liu M, Du Y, Gao J, Liu J, Kong X, Gong Y,
Li Z, Wu H and Chen H: Aberrant expression miR-196a is associated
with abnormal apoptosis, invasion, and proliferation of pancreatic
cancer cells. Pancreas. 42:1169–1181. 2013. View Article : Google Scholar : PubMed/NCBI
|
|
14
|
Hu Z, Chen J, Tian T, Zhou X, Gu H, Xu L,
Zeng Y, Miao R, Jin G, Ma H, et al: Genetic variants of miRNA
sequences and non-small cell lung cancer survival. J Clin Invest.
118:2600–2608. 2008.PubMed/NCBI
|
|
15
|
Yazici H, Zipprich J, Peng T, Akisik EZ,
Tigli H, Isin M, Akisik EE, Terry MB, Senie RT, Li L, et al:
Investigation of the miR16-1 (C > T) + 7 substitution in seven
different types of cancer from three ethnic groups. J Oncol.
2009:8275322009. View Article : Google Scholar : PubMed/NCBI
|
|
16
|
Duan R, Pak C and Jin P: Single nucleotide
polymorphism associated with mature miR-125a alters the processing
of pri-miRNA. Hum Mol Genet. 16:1124–1131. 2007. View Article : Google Scholar : PubMed/NCBI
|
|
17
|
Tian T, Shu Y, Chen J, Hu Z, Xu L, Jin G,
Liang J, Liu P, Zhou X, Miao R, et al: A functional genetic variant
in microRNA-196a2 is associated with increased susceptibility of
lung cancer in Chinese. Cancer Epidemiol Biomarkers Prev.
18:1183–1187. 2009. View Article : Google Scholar : PubMed/NCBI
|
|
18
|
Xu J, Hu Z, Xu Z, Gu H, Yi L, Cao H, Chen
J, Tian T, Liang J, Lin Y, et al: Functional variant in
microRNA-196a2 contributes to the susceptibility of congenital
heart disease in a Chinese population. Hum Mutat. 30:1231–1236.
2009. View Article : Google Scholar : PubMed/NCBI
|
|
19
|
Hu Z, Liang J, Wang Z, Tian T, Zhou X,
Chen J, Miao R, Wang Y, Wang X and Shen H: Common genetic variants
in pre-microRNAs were associated with increased risk of breast
cancer in Chinese women. Hum Mutat. 30:79–84. 2009. View Article : Google Scholar : PubMed/NCBI
|
|
20
|
Qi P, Dou TH, Geng L, Zhou FG, Gu X, Wang
H and Gao CF: Association of a variant in MIR 196A2 with
susceptibility to hepatocellular carcinoma in male Chinese patients
with chronic hepatitis B virus infection. Hum Immunol. 71:621–626.
2010. View Article : Google Scholar : PubMed/NCBI
|
|
21
|
Peng S, Kuang Z, Sheng C, Zhang Y, Xu H
and Cheng Q: Association of microRNA-196a-2 gene polymorphism with
gastric cancer risk in a Chinese population. Dig Dis Sci.
55:2288–2293. 2010. View Article : Google Scholar : PubMed/NCBI
|
|
22
|
Wang K, Guo H, Hu H, Xiong G, Guan X, Li
J, Xu X, Yang K and Bai Y: A functional variation in
pre-microRNA-196a is associated with susceptibility of esophageal
squamous cell carcinoma risk in Chinese Han. Biomarkers.
15:614–618. 2010. View Article : Google Scholar : PubMed/NCBI
|
|
23
|
Jazdzewski K, Murray EL, Franssila K,
Jarzab B, Schoenberg DR and de la Chapelle A: Common SNP in
pre-miR-146a decreases mature miR expression and predisposes to
papillary thyroid carcinoma. Proc Natl Acad Sci USA. 105:7269–7274.
2008. View Article : Google Scholar : PubMed/NCBI
|
|
24
|
Liu Z, Li G, Wei S, Niu J, El-Naggar AK,
Sturgis EM and Wei Q: Genetic variants in selected pre-microRNA
genes and the risk of squamous cell carcinoma of the head and neck.
Cancer. 116:4753–4760. 2010. View Article : Google Scholar : PubMed/NCBI
|
|
25
|
Ahn TK, Kim JO, Kumar H, Choi H, Jo MJ,
Sohn S, Ropper AE, Kim NK and Han IB: Polymorphisms of miR-146a,
miR-149, miR-196a2, and miR-499 are associated with osteoporotic
vertebral compression fractures in Korean postmenopausal women. J
Orthop Res. 36:244–253. 2018.PubMed/NCBI
|
|
26
|
Han M, Yang Q, Feng K, Li R, Ren J and Wei
L: Associations of MMP-2 −1306 C/T and MMP-9 −1562 C/T
polymorphisms with breast cancer risk among different populations:
a meta-analysis. Genes Genom. 39:331–340. 2017. View Article : Google Scholar
|
|
27
|
Benjamini Y and Hochberg Y: Controlling
the false discovery rate: A practical and powerful approach to
multiple testing. J R Stat Soc Series B Stat. 57:289–300. 1995.
|
|
28
|
Kim YR and Hong SH: Influences of
−482C>T and 3238G>C polymorphisms of the apolipoprotein C3
gene on prevalence of metabolic syndrome. Genes Genom. 38:857–864.
2016. View Article : Google Scholar
|
|
29
|
Ritchie MD, Hahn LW, Roodi N, Bailey LR,
Dupont WD, Parl FF and Moore JH: Multifactor-dimensionality
reduction reveals high-order interactions among estrogen-metabolism
genes in sporadic breast cancer. Am J Hum Genet. 69:138–147. 2001.
View Article : Google Scholar : PubMed/NCBI
|
|
30
|
Moore JH and Williams SM: New strategies
for identifying gene-gene interactions in hypertension. Ann Med.
34:88–95. 2002. View Article : Google Scholar : PubMed/NCBI
|
|
31
|
Hahn LW, Ritchie MD and Moore JH:
Multifactor dimensionality reduction software for detecting
gene-gene and gene-environment interactions. Bioinformatics.
19:376–382. 2003. View Article : Google Scholar : PubMed/NCBI
|
|
32
|
Ritchie MD, Hahn LW and Moore JH: Power of
multifactor dimensionality reduction for detecting gene-gene
interactions in the presence of genotyping error, missing data,
phenocopy, and genetic heterogeneity. Genet Epidemiol. 24:150–157.
2003. View Article : Google Scholar : PubMed/NCBI
|
|
33
|
Lee SY, Chung Y, Elston RC, Kim Y and Park
T: Log-linear model-based multifactor dimensionality reduction
method to detect gene gene interactions. Bioinformatics.
23:2589–2595. 2007. View Article : Google Scholar : PubMed/NCBI
|
|
34
|
Jacques G and Cormac O: Central nervous
system tumors. Handb Clin Neurol. 112:931–958. 2013. View Article : Google Scholar : PubMed/NCBI
|
|
35
|
Lacy J, Saadati H and Yu JB: Complications
of brain tumors and their treatment. Hematol Oncol Clin North Am.
26:779–796. 2012. View Article : Google Scholar : PubMed/NCBI
|
|
36
|
de Robles P, Fiest KM, Frolkis AD,
Pringsheim T, Atta C, St Germaine-Smith C, Day L, Lam D and Jette
N: The worldwide incidence and prevalence of primary brain tumors:
A systematic review and meta-analysis. Neuro Oncol. 17:776–783.
2015. View Article : Google Scholar : PubMed/NCBI
|
|
37
|
Choy W, Kim W, Nagasawa D, Stramotas S,
Yew A, Gopen Q, Parsa AT and Yang I: The molecular genetics and
tumor pathogenesis of meningiomas and the future directions of
meningioma treatments. Neurosurg Focus. 30:E62011. View Article : Google Scholar : PubMed/NCBI
|
|
38
|
Babu R, Sharma R, Bagley JH, Hatef J,
Friedman AH and Adamson C: Vestibular schwannomas in the modern
era: Epidemiology, treatment trends, and disparities in management.
J Neurosurg. 119:121–130. 2013. View Article : Google Scholar : PubMed/NCBI
|
|
39
|
Huse JT and Aldape KD: The evolving role
of molecular markers in the diagnosis and management of diffuse
glioma. Clin Cancer Res. 20:5601–5611. 2014. View Article : Google Scholar : PubMed/NCBI
|
|
40
|
Bastien JI, McNeill KA and Fine HA:
Molecular characterizations of glioblastoma, targeted therapy, and
clinical results to date. Cancer. 121:502–516. 2015. View Article : Google Scholar : PubMed/NCBI
|
|
41
|
Cloughesy TF, Cavenee WK and Mischel PS:
Glioblastoma: From molecular pathology to targeted treatment. Annu
Rev Pathol. 9:1–25. 2014. View Article : Google Scholar : PubMed/NCBI
|
|
42
|
Louis DN: Molecular pathology of malignant
gliomas. Annu Rev Pathol. 1:97–117. 2006. View Article : Google Scholar : PubMed/NCBI
|
|
43
|
Liu Y, Pang JC, Dong S, Mao B, Poon WS and
Ng HK: Aberrant CpG island hypermethylation profile is associated
with atypical and anaplastic meningiomas. Hum Pathol. 36:416–425.
2005. View Article : Google Scholar : PubMed/NCBI
|
|
44
|
Mawrin C and Perry A: Pathological
classification and molecular genetics of meningiomas. J Neurooncol.
99:379–391. 2010. View Article : Google Scholar : PubMed/NCBI
|
|
45
|
Perry A, Gutmann DH and Reifenberger G:
Molecular pathogenesis of meningiomas. J Neurooncol. 70:183–202.
2004. View Article : Google Scholar : PubMed/NCBI
|
|
46
|
Yew A, Trang A, Nagasawa DT, Spasic M,
Choy W, Garcia HM and Yang I: Chromosomal alterations, prognostic
factors, and targeted molecular therapies for malignant
meningiomas. J Clin Neurosci. 20:17–22. 2013. View Article : Google Scholar : PubMed/NCBI
|
|
47
|
Grönholm M, Teesalu T, Tyynelä J, Piltti
K, Böhling T, Wartiovaara K, Vaheri A and Carpén O:
Characterization of the NF2 protein merlin and the ERM protein
ezrin in human, rat, and mouse central nervous system. Mol Cell
Neurosci. 28:683–693. 2005. View Article : Google Scholar : PubMed/NCBI
|
|
48
|
Giannakakis A, Coukos G, Hatzigeorgiou A,
Sandaltzopoulos R and Zhang L: miRNA genetic alterations in human
cancers. Expert Opin Biol Ther. 7:1375–1386. 2007. View Article : Google Scholar : PubMed/NCBI
|
|
49
|
Calin GA, Dumitru CD, Shimizu M, Bichi R,
Zupo S, Noch E, Aldler H, Rattan S, Keating M, Rai K, et al:
Frequent deletions and down-regulation of micro-RNA genes miR15 and
miR16 at 13q14 in chronic lymphocytic leukemia. Proc Natl Acad Sci
USA. 99:15524–15529. 2002. View Article : Google Scholar : PubMed/NCBI
|
|
50
|
Guessous F, Alvarado-Velez M,
Marcinkiewicz L, Zhang Y, Kim J, Heister S, Kefas B, Godlewski J,
Schiff D, Purow B and Abounader R: Oncogenic effects of miR-10b in
glioblastoma stem cells. J Neurooncol. 112:153–163. 2013.
View Article : Google Scholar : PubMed/NCBI
|
|
51
|
Shi L, Zhang J, Pan T, Zhou J, Gong W, Liu
N, Fu Z and You Y: MiR-125b is critical for the suppression of
human U251 glioma stem cell proliferation. Brain Res. 1312:120–126.
2010. View Article : Google Scholar : PubMed/NCBI
|
|
52
|
Alsidawi S, Malek E and Driscoll JJ:
MicroRNAs in brain metastases: Potential role as diagnostics and
therapeutics. Int J Mol Sci. 15:10508–10526. 2014. View Article : Google Scholar : PubMed/NCBI
|
|
53
|
Besse A, Sana J, Fadrus P and Slaby O:
MicroRNAs involved in chemo- and radioresistance of high-grade
gliomas. Tumour Biol. 34:1969–1978. 2013. View Article : Google Scholar : PubMed/NCBI
|
|
54
|
Low SY, Ho YK, Too HP, Yap CT and Ng WH:
MicroRNA as potential modulators in chemoresistant high-grade
gliomas. J Clin Neurosci. 21:395–400. 2014. View Article : Google Scholar : PubMed/NCBI
|
|
55
|
Lv M, Dong W, Li L and Zhang L, Su X, Wang
L, Gao L and Zhang L: Association between genetic variants in
pre-miRNA and colorectal cancer risk in a Chinese population. J
Cancer Res Clin Oncol. 139:1405–1410. 2013. View Article : Google Scholar : PubMed/NCBI
|
|
56
|
Williams AE, Perry MM, Moschos SA,
Larner-Svensson HM and Lindsay MA: Role of miRNA-146a in the
regulation of the innate immune response and cancer. Biochem Soc
Trans. 36:1211–1215. 2008. View Article : Google Scholar : PubMed/NCBI
|
|
57
|
Li D, Chen P, Li XY, Zhang LY, Xiong W,
Zhou M, Xiao L, Zeng F, Li XL, Wu MH, et al: Grade-specific
expression profiles of miRNAs/mRNAs and docking study in human
grade I–III astrocytomas. OMICS. 15:673–682. 2011. View Article : Google Scholar : PubMed/NCBI
|
|
58
|
Pan SJ, Zhan SK, Pei BG, Sun QF, Bian LG
and Sun BM: MicroRNA-149 inhibits proliferation and invasion of
glioma cells via blockade of AKT1 signaling. Int J Immunopathol
Pharmacol. 25:871–881. 2012. View Article : Google Scholar : PubMed/NCBI
|
|
59
|
Yang G, Han D, Chen X, Zhang D, Wang L,
Shi C, Zhang W, Li C, Chen X, Liu H, et al: MiR-196a exerts its
oncogenic effect in glioblastoma multiforme by inhibition of IκBα
both in vitro and in vivo. Neuro Oncol. 16:652–661. 2014.
View Article : Google Scholar : PubMed/NCBI
|
|
60
|
Guan Y, Chen L, Bao Y, Qiu B, Pang C, Cui
R and Wang Y: High miR-196a and low miR-367 cooperatively correlate
with unfavorable prognosis of high-grade glioma. Int J Clin Exp
Pathol. 8:6576–6588. 2015.PubMed/NCBI
|