Introduction
The pathogenic mechanisms of adrenocortical tumors
(ACTs) are complex and heterogeneous. The most common ACT is benign
and is typically diagnosed incidentally (1). The aggressive forms of ACTs include
adrenocortical carcinomas (ACCs), which has an incidence of 0.5 to
2 cases per million per year (1).
ACC has a high mortality, with 5-year survival rates varying
between 16 and 40%, and is largely dependent on its stage at
diagnosis (2). ACC is a highly
aggressive tumor that has a poor prognosis, in part because various
ACCs cannot be detected prior to the advanced stage (1). Although these types of cancer are
commonly associated with a poor outcome, it is difficult to predict
the prognosis (1,3). The active role of insulin-like growth
factor 2 (IGF2) and Ki-67 in differentiating ACCs from
adrenocortical adenomas (ACAs) has been reported (4). A previous study has confirmed the
active role of IGF2 in adrenocortical tumor growth (5). It has been identified that
cyclin-dependent kinase inhibitor 2A, RB transcriptional
corepressor 1, multiple endocrine neoplasia 1, zinc and ring finger
3, death-associated protein 6, ERT and mediator complex subunit 12
were driver genes in the transformation of ACA to ACC (6,7). TP53
and catenin β1 mutations have been reported in ACT, and are
associated with tumor progression (8–10).
Although there are multiple reports on ACC, the molecular mechanism
underlying the molecular events accounting for carcinogenesis in
ACC has not been completely elucidated. Additionally, this
information is critical for allowing clinicians to make appropriate
decisions and predictions of ACC survival. Therefore, further
molecular level studies, including studies of genes and proteins
focused on carcinogenesis and the prognostic prediction of ACC, are
required.
The Gene Expression Omnibus (GEO, http://www.ncbi.nlm.nih.gov/geo/), an
international public repository, consists of various
high-throughput functional genomic datasets (11). The Cancer Genome Atlas (TCGA)
provides multidimensional maps of genomic and survival information
for 33 types of cancer (http://cancergenome.nih.gov/) (12). In the present study, the associated
data (patients gene chip and prognostic information) were
downloaded from these two datasets. However, the data stored in
public databases are limited and are characterized by inconsistent
results. Therefore, integrated bioinformatics methods were combined
with expression profiling techniques to overcome these
disadvantages in the present study.
In the present study, differentially expressed genes
(DEGs) between ACC and ACA were identified, and functional analyses
were subsequently performed. Gene ontology (GO) terms, Kyoto
Encyclopedia of Genes and Genomes (KEGG) pathways and
protein-protein interactions (PPIs) of DEGs associated with ACC
were performed, particularly for genes associated with the cell
cycle, organelle fission, chromosome segregation, cell division and
spindle stability. To determine the role of final core genes in
carcinogenesis and the prognostic prediction of ACC, the effects of
genes associated with cell proliferation and the cell cycle that
were silenced in NCI-H295R cells were assessed. The present study
provides a further understanding of ACC, carcinogenesis and the
basis for prognostic predictions, paving the way for future
studies. The prognostic signature of the three genes was
successfully validated in another independent cohort from TCGA.
Materials and methods
Preprocessing of gene expression
microarray data, identification of DEGs and prognostic
information
In the present study, gene microarray datasets
comparing the gene expression profiles between ACC and ACA were
downloaded from the GEO (http://www.ncbi.nlm.nih.gov/gds/). The accession
numbers were GSE12368, GSE10927 and GSE14922. The microarray data
of GSE12368 and GSE10927 were assessed using the GPL570
[HG-U133_Plus_2] Affymetrix Human Genome U133 Plus 2.0 Array
(http://www.affymetrix.com/index.affx). The microarray
data of GSE14922 were assessed using the GPL6480. The gene
microarray data comprised 47 malignant tissue samples from patients
with ACC and 46 adrenocortical adenomas tissue samples from
surgical specimens. CEL files in different databases were converted
to expression measures and normalized via the affy package in R
(13). The aberrantly expressed
mRNAs were subsequently calculated using the Limma package
(14), based on the Benjamini and
Hochberg procedure (14). DEGs
between ACC and NAC tissues were defined by the cut-off criterion
of fold change >2 and a P-value of <0.05. The intersect
function in R was applied to identify the common DEGs among
GSE12368, GSE10927 and GSE14922. A Venn diagram was generated using
the VennDiagram R package. The detailed survival information of a
cohort of 76 patients with ACC was downloaded from the TCGA
dataset.
GO and KEGG pathway analysis of the
DEGs
Database for Annotation, Visualization and
Integrated Discovery (DAVID) (http://david.abcc.ncifcrf.gov/) (15,16)
was used for functional annotation of DEGs, gene functional
classification and gene ID conversion. DAVID was used to generate
the official gene symbols for DEGs and to perform the GO and KEGG
pathway analyses. The online website KOBAS 3.0 (http://kobas.cbi.pku.edu.cn) was used to perform the
pathway enrichment analysis of the DEGs. Once the list of DEGs was
submitted to the database, the GO and KEGG pathways were obtained.
The false discovery rate of the q-value was adjusted to 0.05, and a
P<0.05 was considered the cut-off criterion.
PPI network construction
The PPI network of the DEGs was constructed using
Cytoscape software (version 3.5.1, available online: http://www.cytoscape.org/) (17). Once the DEGs were entered into the
Search Tool for the Retrieval of Interacting Genes (STRING) online
database (http://string-db.org), the PPI network
was constructed by searching for known interactions. The gene-gene
interactions whose integrated scores were >0.9 (the default
threshold in the STRING database) with a fold change >2 were
selected to construct the PPI network. In addition, cluster
analysis was performed for genes with P<0.05. The Cytoscape
MCODE plugin was applied to search clustered subnetworks of highly
intraconnected nodes from the PPI network complex with the default
parameters (degree cut-off ≥2, node score cut-off ≥0.2, K-score ≥2
and maximum depth = 100).
Patients and tumor samples
Samples of adrenal tumors were collected from
patients undergoing adrenalectomy at the Department of Urology, the
First Hospital of China Medical University (Shenyang, China)
between July 2001 and July 2015. The present study was approved by
the Ethics Committee of the First Hospital of China Medical
University. Consent for the use of pertinent patient records and
samples was obtained from the institutional ethics review board of
the First Hospital of China Medical University and the patients. A
total of 20 ACA samples were randomly selected as control samples
from 1,365 patients. with ACA who underwent surgical removal of
adrenocortical tumors. Clinicopathological characteristics are
presented in Table SI.
Experimental samples from a total of 15 patients with ACC were
available at the Department of Urology between July 2001 and July
2015. All 1,365 samples included in the present study and the
subset used for the further analysis were obtained retrospectively
for analysis only. Diagnosis of ACCs and ACAs was performed based
on the histopathologic criteria (Weiss score ≥3 and <3,
respectively) proposed by Weiss et al (18) and the modification proposed by
Aubert et al (19). There
were no oncocytic variant ACCs in the cohort. All tumor samples
were derived from the primary surgery. There was no discrepancy
between the two pathologists who independently classified the
histopathological slides.
Cell culture and small interfering
(si)RNA transfection
DNA topoisomerase 2α (TOP2A), cyclin B2 (CCNB2),
NDC80 and control siRNAs (human TOP2A-siRNA, CCNB2-siRNA,
NDC80-siRNA and control-siRNA) were obtained from Shanghai
GenePharma Co., Ltd. (Shanghai, China). The control-siRNAs in the
present study were scrambled controls. Their sequences are
indicated in Table I. NCI-H295R
cells were cultured in 60-cm2 dishes at 37°C in a
humidified incubator at 5% CO2. Cells were treated with
Dulbecco's modified Eagle medium (DMEM)/F12 (Gibco; Thermo Fisher
Scientific, Inc. Waltham, MA, USA) supplemented with 2.5% Nu-serum
I (Corning Inc., Corning, NY, USA), 1% ITS+ Premix (Corning Inc.),
1% L-glutamine and 1% penicillin-streptomycin (Gibco; Thermo Fisher
Scientific, Inc.). It was transfected with double-stranded siRNA
oligomers using Lipofectamine 3000 Transfection Reagent (Thermo
Fisher Scientific, Inc.) according to the manufacturer's
instructions. The amount of siRNAs that were used in the
transfection experiments was 2.64 µg. Following transfection, cells
were cultured for 48 h to measure their mRNA levels.
 | Table I.Target gene siRNAs sequences. |
Table I.
Target gene siRNAs sequences.
| Target genes | Sequence
(5′-3′) |
|---|
| TOP2A-siRNA |
UUCACGCACAUCAAAGUUGGG |
| CCNB2-siRNA |
GGAUCGAUUUUUACAGGUUTT |
| NDC80-siRNA |
GCAGCCUUAGUUUGGCUAATT |
| Negative |
UUCUCCGAACGUGUCACGUTT |
| control-siRNA |
|
RNA isolation and reverse
transcription-quantitative polymerase chain reaction (RT-qPCR)
Following surgical resection, ACC and ACA tissue
fragments were immediately frozen in liquid nitrogen and stored at
−80°C until total RNA extraction using TRIzol reagent (Invitrogen;
Thermo Fisher Scientific, Inc.). Total RNA was extracted from
cultured cells with TRIzol reagent (Invitrogen; Thermo Fisher
Scientific, Inc.) according to the manufacturer's instructions. RT
of RNA was performed using a high-capacity cDNA reverse
transcription kit (Applied Biosystems; Thermo Fisher Scientific,
Inc.). RT-qPCR was performed using LightCycler 480 SYBR-Green
(Roche Molecular Systems, Inc., Pleasanton, CA, USA) and the
corresponding dissociation protocol were used for gene
amplification; negative controls contained water instead of
first-strand cDNA. The reaction system was maintained at 55°C for 2
min and heated to 95°C for 10 min, followed by 35 cycles of
denaturing the mixture at 95°C for 15 sec, annealing at 60°C for 30
sec and extension at 72°C for 30 sec. The relative levels of
expression were quantified and analyzed using SDS 2.3 software
(Applied Biosystems; Thermo Fisher Scientific, Inc.). Each sample
was normalized to its β-actin content. The final results were
expressed as n-fold differences in gene expression relative to
β-actin and a calibrator, calculated using the 2−ΔΔCq
method (20). The primer sequences
of 14 hub genes and β-actin are indicated in Table II. Three independent experiments
were performed to analyze the relative gene expression, and each
sample was examined in triplicate.
| Table II.Primer sequences of the 14 identified
hub genes and β-actin. |
Table II.
Primer sequences of the 14 identified
hub genes and β-actin.
| Target gene | Forward primer
sequence (5′-3′) | Reverse primer
sequence (5′-3′) |
|---|
| CDK1 |
GGAAGGGGTTCCTAGTACTGC |
CCATGTACTGACCAGGAGGGA |
| MAD2L1 |
ACTTTTGAAACGCTTGGCGG |
GAGAAGAACTCGGCCACGAT |
| BIRC5 |
AGGACCACCGCATCTCTACAT |
AAGTCTGGCTCGTTCTCAGTG |
| CCNB2 |
CCGACGGTGTCCAGTGATTT |
TGTTGTTTTGGTGGGTTGAACT |
| TPX2 |
ATGGAACTGGAGGGCTTTTTC |
TGTTGTCAACTGGTTTCAAAGGT |
| PRC1 |
ACACTCTGTGCAGCGAGTTAC |
TTCGCATCAATTCCACTTGGG |
| RRM2 |
CACGGAGCCGAAAACTAAAGC |
TCTGCCTTCTTATACATCTGCCA |
| ASPM |
GGCCCTAGACAACCCTAACGA |
AGCTTGGTGTTTCAGAACATCA |
| EZH2 |
AATCAGAGTACATGCGACTGAGA |
GCTGTATCCTTCGCTGTTTCC |
| PBK |
CCAAACATTGTTGGTTATCGTGC |
GGCTGGCTTTATATCGTTCTTCT |
| NCAPG |
GAGGCTGCTGTCGATTAAGGA |
AACTGTCTTATCATCCATCGTGC |
| TOP2A |
ACCATTGCAGCCTGTAAATGA |
GGGCGGAGCAAAATATGTTCC |
| NDC80 |
TGCCGACAGCTTTGATGAGA |
GCAGGTGCTTGTGTTTCTCC |
| KIAA0101 |
ATGGTGCGGACTAAAGCAGAC |
CCTCGATGAAACTGATGTCGAAT |
| β-ACTIN |
CATGTACGTTGCTATCCAGGC |
CTCCTTAATGTCACGCACGA |
3-(4,5-Dimethylthazol-2-yl)-2,5-diphenyltetrazolium bromide (MTT)
assay
Si-TOP2A, Si-CCNB2, Si-NDC80, Si-Control and MOCK
(only transfection reagents were added) cells were plated onto
96-well plates at a density of 3×10³ cells/well. The
three replicates were performed for each group (Si-TOP2A, Si-CCNB2,
Si-NDC80 and Si-Ctrl group) cultured in the complete DMEM/f12
medium at 37°C under a humidified atmosphere containing 5%
CO2. At 0, 24, 48 and 72 h of incubation, cell
proliferation was measured following the addition of 0.5 mg/ml MTT
solution (Sigma-Aldrich; Merck KGaA, Darmstadt, Germany). The
medium was replaced with 100 ml of dimethyl sulfoxide
(Sigma-Aldrich; Merck KGaA) and samples were vortexed for 10 min
following ~4 h of incubation. The absorbance was measured at a
wavelength of 490 nm using a plate reader (model 680; Bio-Rad
Laboratories, Inc., Hercules, CA, USA). Each proliferation assay
was performed in triplicate.
Colony formation assay
NCI-H295R cells (1×10³) were seeded in
6-well plates for 2 weeks and stained for 5 min at room temperature
with Giemsa. The number of foci containing >100 cells was
counted under a light microscope (magnification, ×100). Each
experiment was performed in triplicate.
5-Ethynyl-20-deoxyuridine (EdU)
incorporation assay
Following transfection for 36 h, cells were
trypsinized and resuspended in 96-well plates at 5×10³
cells/well (after the cells had been adhered). Following this,
cells were exposed to 50 µmol/l of EdU (Guangzhou RiboBio Co.,
Ltd., Guangzhou, China) for an additional 8 h at 37°C. The three
replicates were performed for each group. Cells were fixed with 4%
formaldehyde for 15 min and treated with 0.5% Triton X-100 for 10
min at room temperature. Following three wash steps with phosphate
buffered saline, the cells of each well were treated with 100 µl of
1X Apollo reaction cocktail (Guangzhou RiboBio Co., Ltd.) for 30
min. Subsequently, the DNA contents of cells in each well were
stained for 20 min at 37°C with 100 µl of Hoechst 33342 (5 µg/ml)
for 30 min and visualized under a fluorescent microscope
(magnification, ×400).
Immunohistochemistry (IHC)
The expression of TOP2A, CCNB2 and NDC80 in ACC and
ACA tissues was detected using an UltraSensitive
Streptavidin-Peroxidase (mouse/rabbit) IHC Kit (Fuzhou Maixin
Biotechnology Development Co., Ltd., Fuzhou, China) according to
the manufacturer's instructions. Briefly, sections were dewaxed in
xylene and ethanol. Formalin-fixed for 24 h at room temperature,
Paraffin-embedded tissue blocks were cut to a thickness of 4 µm.
Slices were mounted on glass slides. Immunostaining was performed
using the avidin-biotin-peroxidase complex method (Ultrasensitive;
Fuzhou Maixin Biotechnology Development Co., Ltd.). The sections
were deparaffinized in xylene, rehydrated with graded alcohol (100,
90, 80, 70, 60 and 50%), and then boiled in 0.01 M citrate buffer
(pH 6.0) for 2 min in an autoclave. Peroxidase inhibitor was
applied to block endogenous peroxide activity for 30 min at room
temperature, and the sections were incubated with normal goat serum
(dilution not specified in kit; Fuzhou Maixin Biotechnology
Development Co., Ltd.) to reduce nonspecific binding for 30 min.
Antibody staining was performed at 4°C overnight. Biotinylated goat
anti-mouse serum IgG was used as a secondary antibody (dilution not
specified in kit; cat. no. KIT-9710; Fuzhou Maixin Biotechnology
Development Co., Ltd.) for 30 min at room temperature. Following
washing, the sections were incubated with streptavidin-biotin
conjugated with horseradish peroxidase (dilution not specified in
kit; cat. no. KIT-9710; Fuzhou Maixin Biotechnology Development
Co., Ltd.) for 30 min at room temperature, and immunoreaction was
visualized using diaminobenzidine as a chromogen for 30 sec-1 min
at room temperature. As a control, incubation without the primary
antibody or with a nonspecific serum was also performed. The
paraffin-embedded tissue blocks that were cut into 4-µm thick
sections were also subjected to IHC with rabbit monoclonal antibody
for human TOP2A (1:100 dilution; Abcam, Cambridge, UK), CCNB2
(1:100 dilution; Abcam) and NDC80 (1:100 dilution; Abcam). For both
antigens, diaminobenzidine and hematoxylin were used for nuclear
staining. Nuclear staining was performed by treating the slides for
2 min with hemalum, followed by 10 min incubation in running water
to induce the color reaction. Eventually, the stained slices were
dehydrated and mounted. A light microscope was used (magnification,
×400).
Data analysis and statistical
methods
SPSS 22.0 software (IBM Corp., Armonk, NY, USA) was
used in different analyses. The datasets analyzed in the study are
available in GEO (http://www.ncbi.nlm.nih.gov/geo/) and TCGA (http://cancergenome.nih.gov). The statistical
significance of different experimental data was analyzed using
GraphPad Prism 6.0 software (GraphPad Software, Inc., San Diego,
CA, USA). Kaplan-Meier curves were used to determine survival
status, and differences between groups were analyzed using the
log-rank test. All data were presented as the mean ± standard
deviation. P<0.05 was considered to indicate a statistically
significant difference. Associations between variables were
analyzed using Spearman's rank correlation test. The associations
between variables were analyzed by Student's t-test and the
χ2 test. Comparisons were performed for multiple means
using analysis of variance followed two-way analysis of variance
with Turkey's multiple comparisons. All experiments were repeated
at least three times.
Results
DEGs among GSE12368, GSE10927 and
GSE14922
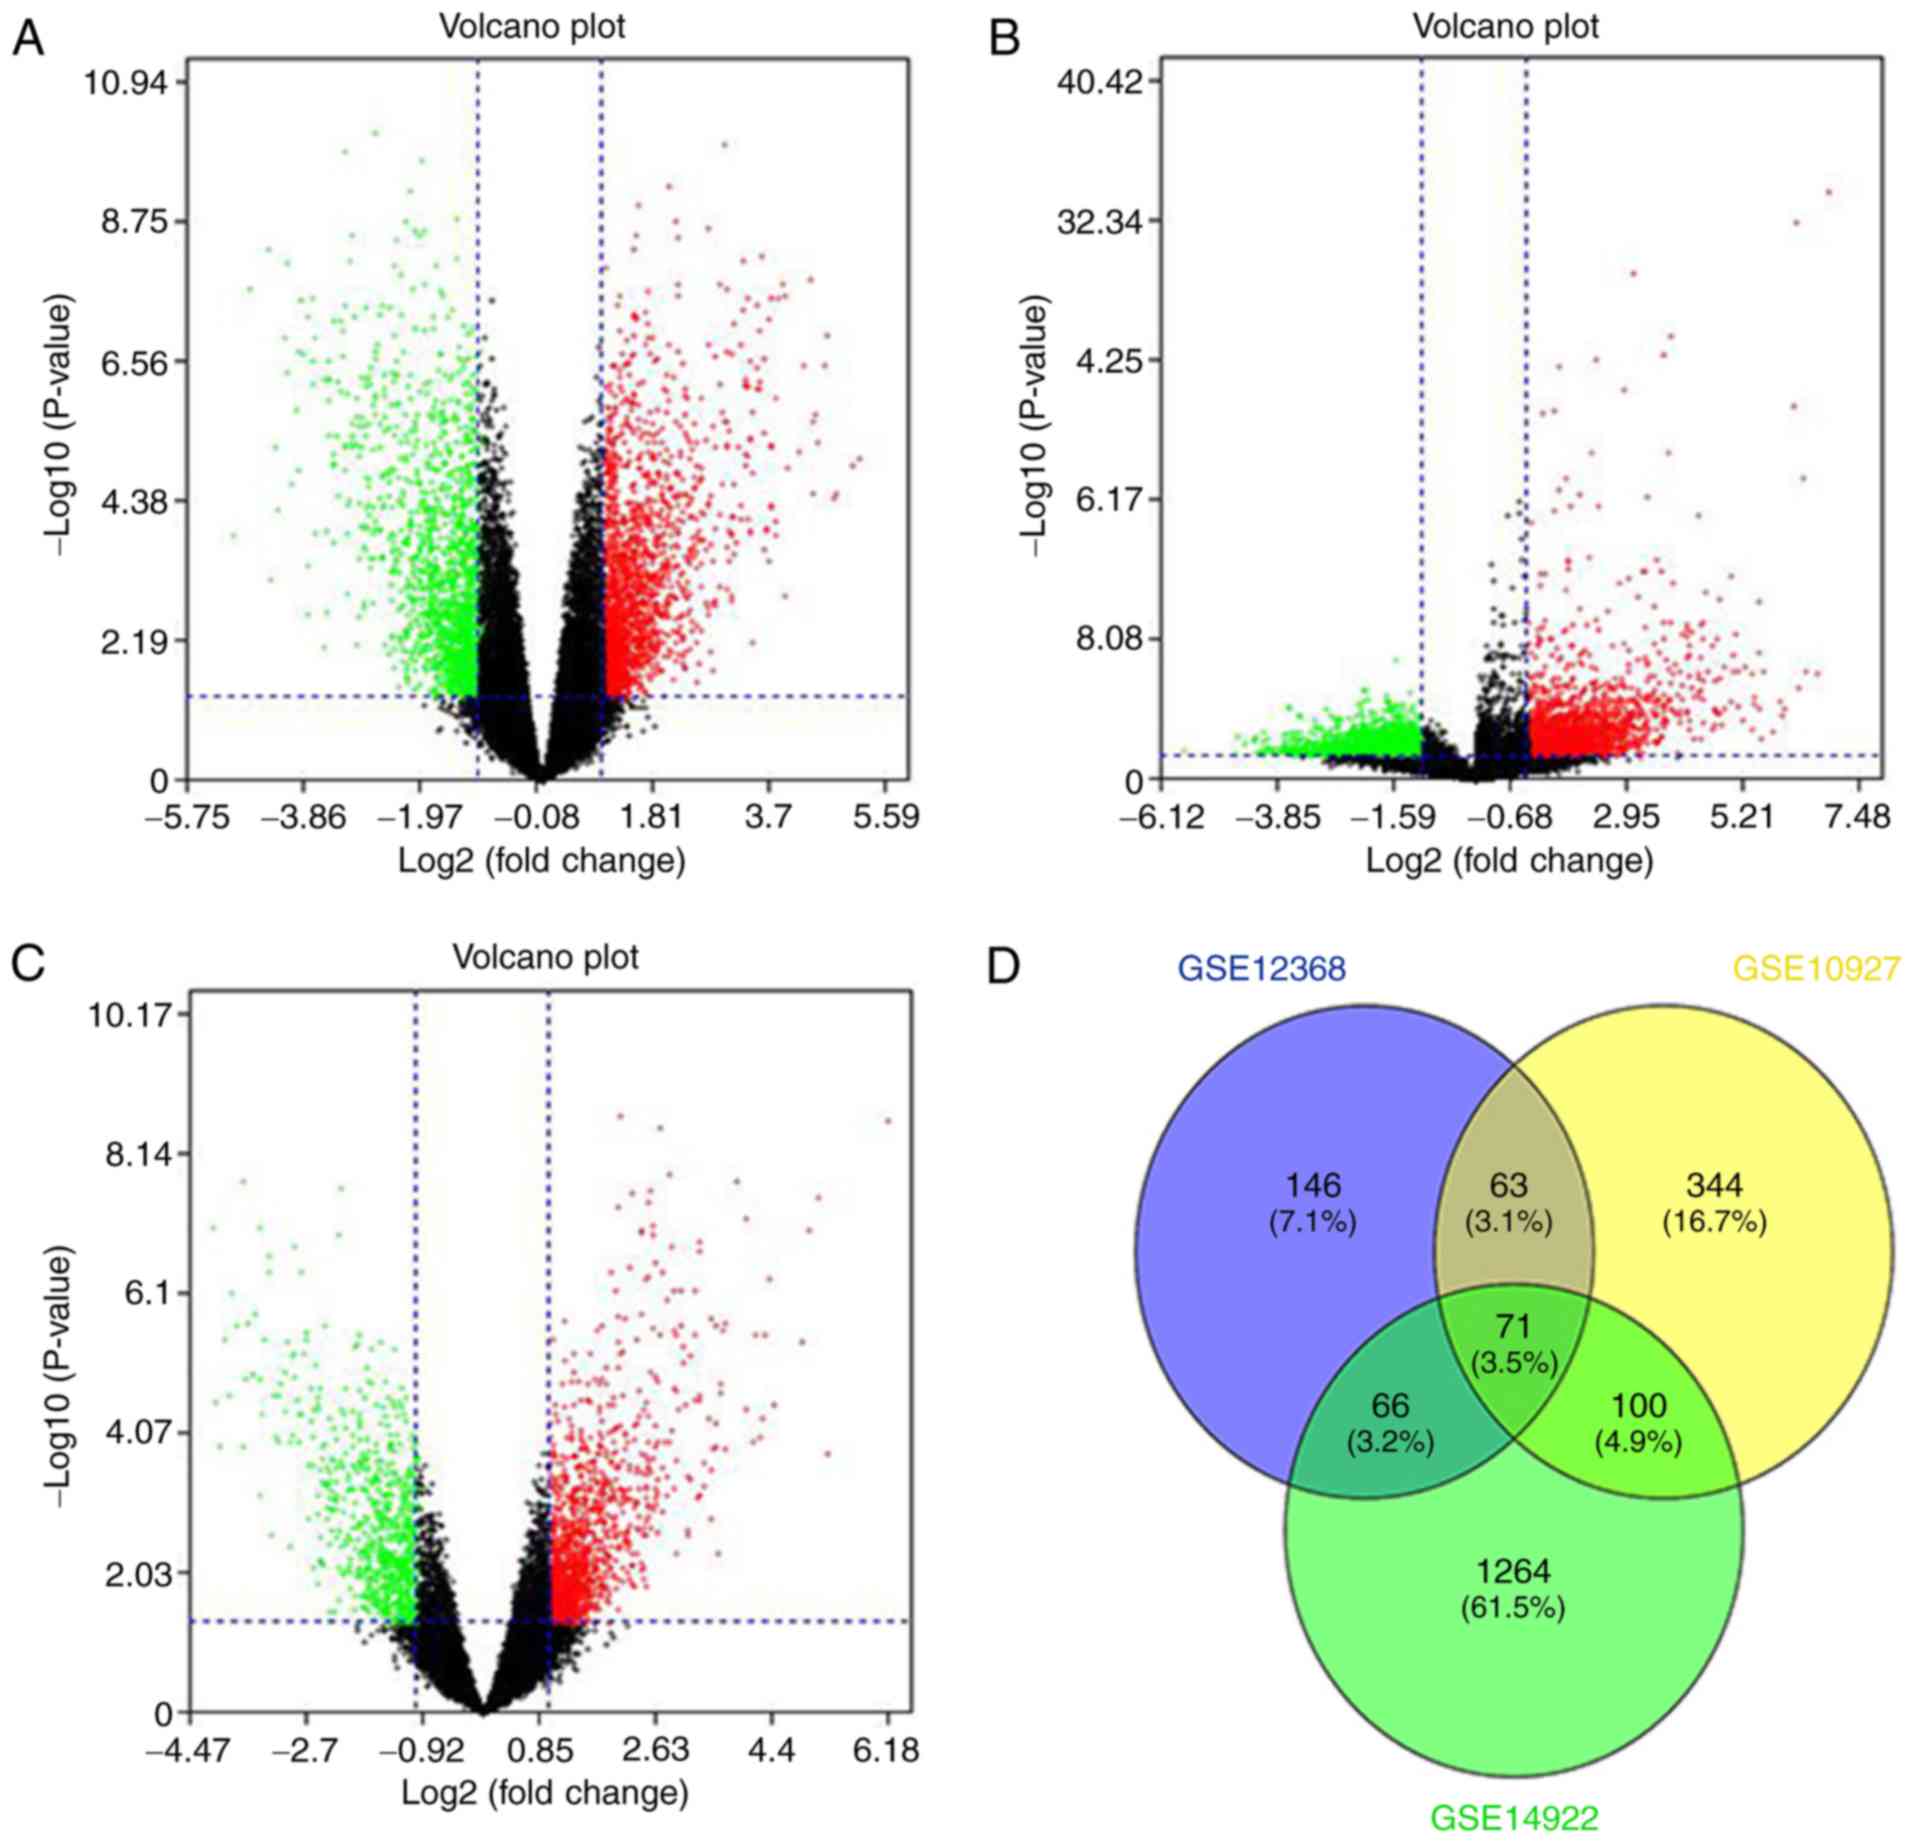
Quality and systematic bias among original chip data
were adjusted following preprocessing by the Affymetrix package in
R language. Volcano plots were constructed to visualize the
distribution of expressed genes between ACC and ACA from different
studies. Significantly upregulated genes were represented by red
dots, and significantly downregulated genes were indicated with
green on the plots (Fig. 1A-C). The
common DEGs (P<0.05 and |Fold change| >2) of the three
projects were demonstrated (Fig.
1D). A total of 20 significantly upregulated genes and 51
downregulated genes were acquired from the three independent
cohorts and are listed in Table
III.
| Table III.Common DEGs identified among
GSE12368, GSE10927 and GSE14922. |
Table III.
Common DEGs identified among
GSE12368, GSE10927 and GSE14922.
| A, Downregulated
DEGs |
|---|
| Gene names |
|
| KCNQ1, HSD3B2,
ADH1B, CYP11B2, NR4A2, NOV, MFAP5, AADAC, FBLN1, PDGFRA, ABCA8,
AOX1, DCN, SPON1, LMOD1, CSDC2, HOPX, HTR2B, VSNL1, C7, RAI2,
NPY1R, CYP11B1, FBLN5, CXCL12, NDUFC2-KCTD14, KCTD14, SORBS2,
KCNJ5, PDGFD, OGN, GSTT1, CHRDL1, DNAJC12, GGT5, COL4A4, KIF5C,
CDKN1C, FNDC4, ABLIM1, PTGDS, TKFC, HEPH, ALAS1, APOD, ALDH1A1,
HOXA5, SORBS1, ABCB1, ABCB4, ABCB1, FMO2 and SCG2. |
|
| B, Upregulated
DEGs |
|
| GINS1, CCNB2,
MAD2L1, PBK, APOBEC3B, EZH2, BIRC5, NDC80, NCAPG, KIAA0101, TPX2,
ANGPT2, RRM2, TOP2A, SMC3, PRC1, PMAIP1, INS-IGF2, IGF2, ASPM and
CDK1. |
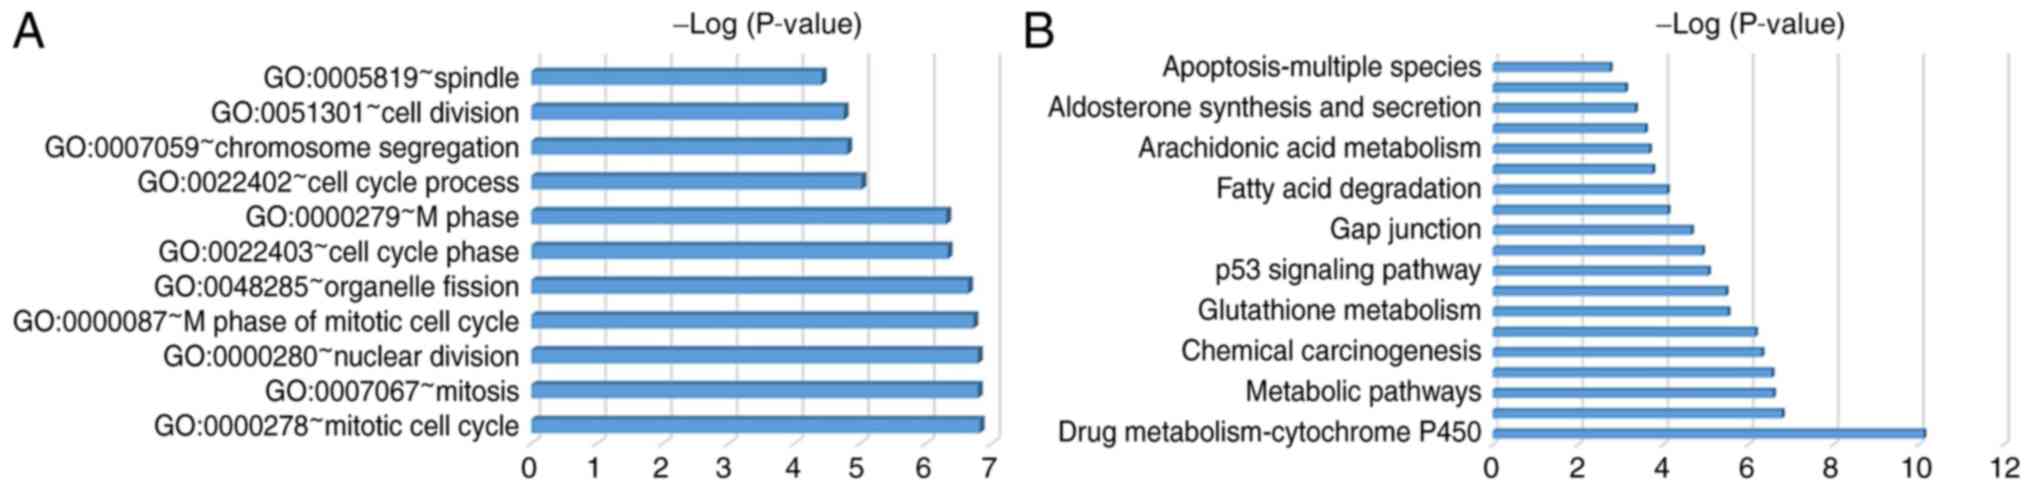
Enriched GO terms and KEGG pathways of
DEGs
STRING, DAVID and KOBAS 3.0 online websites were
applied to perform GO and pathway enrichment analysis of the DEGs.
The most enriched GO terms were associated with the cell cycle,
including the mitotic cell cycle, mitosis, nuclear division and the
M phase of the mitotic cell cycle. GO terms were revealed according
to P-values (Fig. 2A; Table IV). DEGs were primarily enriched in
retinal metabolism, metabolic pathways, tyrosine metabolism, the
cell cycle and p53 signaling pathways (Fig. 2B; Table
V).
| Table IV.Significant GO terms of
differentially expressed genes in adrenocortical carcinoma. |
Table IV.
Significant GO terms of
differentially expressed genes in adrenocortical carcinoma.
| Term | Description | Count | P-value |
|---|
| GO:0000278 | Mitotic cell
cycle | 12 |
1.50×10−07 |
| GO:0007067 | Mitosis | 10 |
1.61×10−07 |
| GO:0000280 | Nuclear
division | 10 |
1.61×10−07 |
| GO:0000087 | M phase of mitotic
cell cycle | 10 |
1.88×10−07 |
| GO:0048285 | Organelle
fission | 10 |
2.26×10−07 |
| GO:0022403 | Cell cycle
phase | 12 |
4.63×10−07 |
| GO:0000279 | M phase | 11 |
4.87×10−07 |
| GO:0022402 | Cell cycle
process | 12 |
9.44×10−06 |
| GO:0007059 | Chromosome
segregation | 6 |
1.56×10−05 |
| GO:0051301 | Cell division | 9 |
1.76×10−05 |
| GO:0005819 | Spindle | 7 |
3.81×10−05 |
| Table V.Significant pathways involved in the
differentially expressed genes in adrenocortical carcinoma. |
Table V.
Significant pathways involved in the
differentially expressed genes in adrenocortical carcinoma.
| ID | Term | Count | P-value |
|---|
| hsa00982 | Drug
metabolism-cytochrome P450 | 7 |
7.55×10⁻¹¹ |
| hsa00830 | Retinol
metabolism | 5 |
1.61×10−07 |
| hsa01100 | Metabolic
pathways | 13 |
2.56×10−07 |
| hsa00980 | Metabolism of
xenobiotics by cytochrome P450 | 5 |
2.77×10−07 |
| hsa05204 | Chemical
carcinogenesis | 5 |
4.79×10−07 |
| hsa00350 | Tyrosine
metabolism | 4 |
6.87×10−07 |
| hsa00480 | Glutathione
metabolism | 4 |
3.00×10−06 |
| hsa04110 | Cell cycle | 5 |
3.37×10−06 |
| hsa04115 | p53 signaling
pathway | 4 |
8.69×10−06 |
| hsa01524 | Platinum drug
resistance | 4 |
1.19×10−05 |
| hsa04540 | Gap junction | 4 |
2.17×10−05 |
| hsa04114 | Oocyte meiosis | 4 |
7.68×10−05 |
| hsa00071 | Fatty acid
degradation | 3 |
7.97×10−05 |
| hsa00140 | Steroid hormone
biosynthesis | 3 |
1.74×10⁻⁴ |
| hsa00590 | Arachidonic acid
metabolism | 3 |
2.10×10⁻⁴ |
| hsa00010 |
Glycolysis/Gluconeogenesis | 3 |
2.62×10⁻⁴ |
| hsa04925 | Aldosterone
synthesis and secretion | 3 |
4.47×10⁻⁴ |
| hsa04914 |
Progesterone-mediated oocyte
maturation | 3 |
7.66×10⁻⁴ |
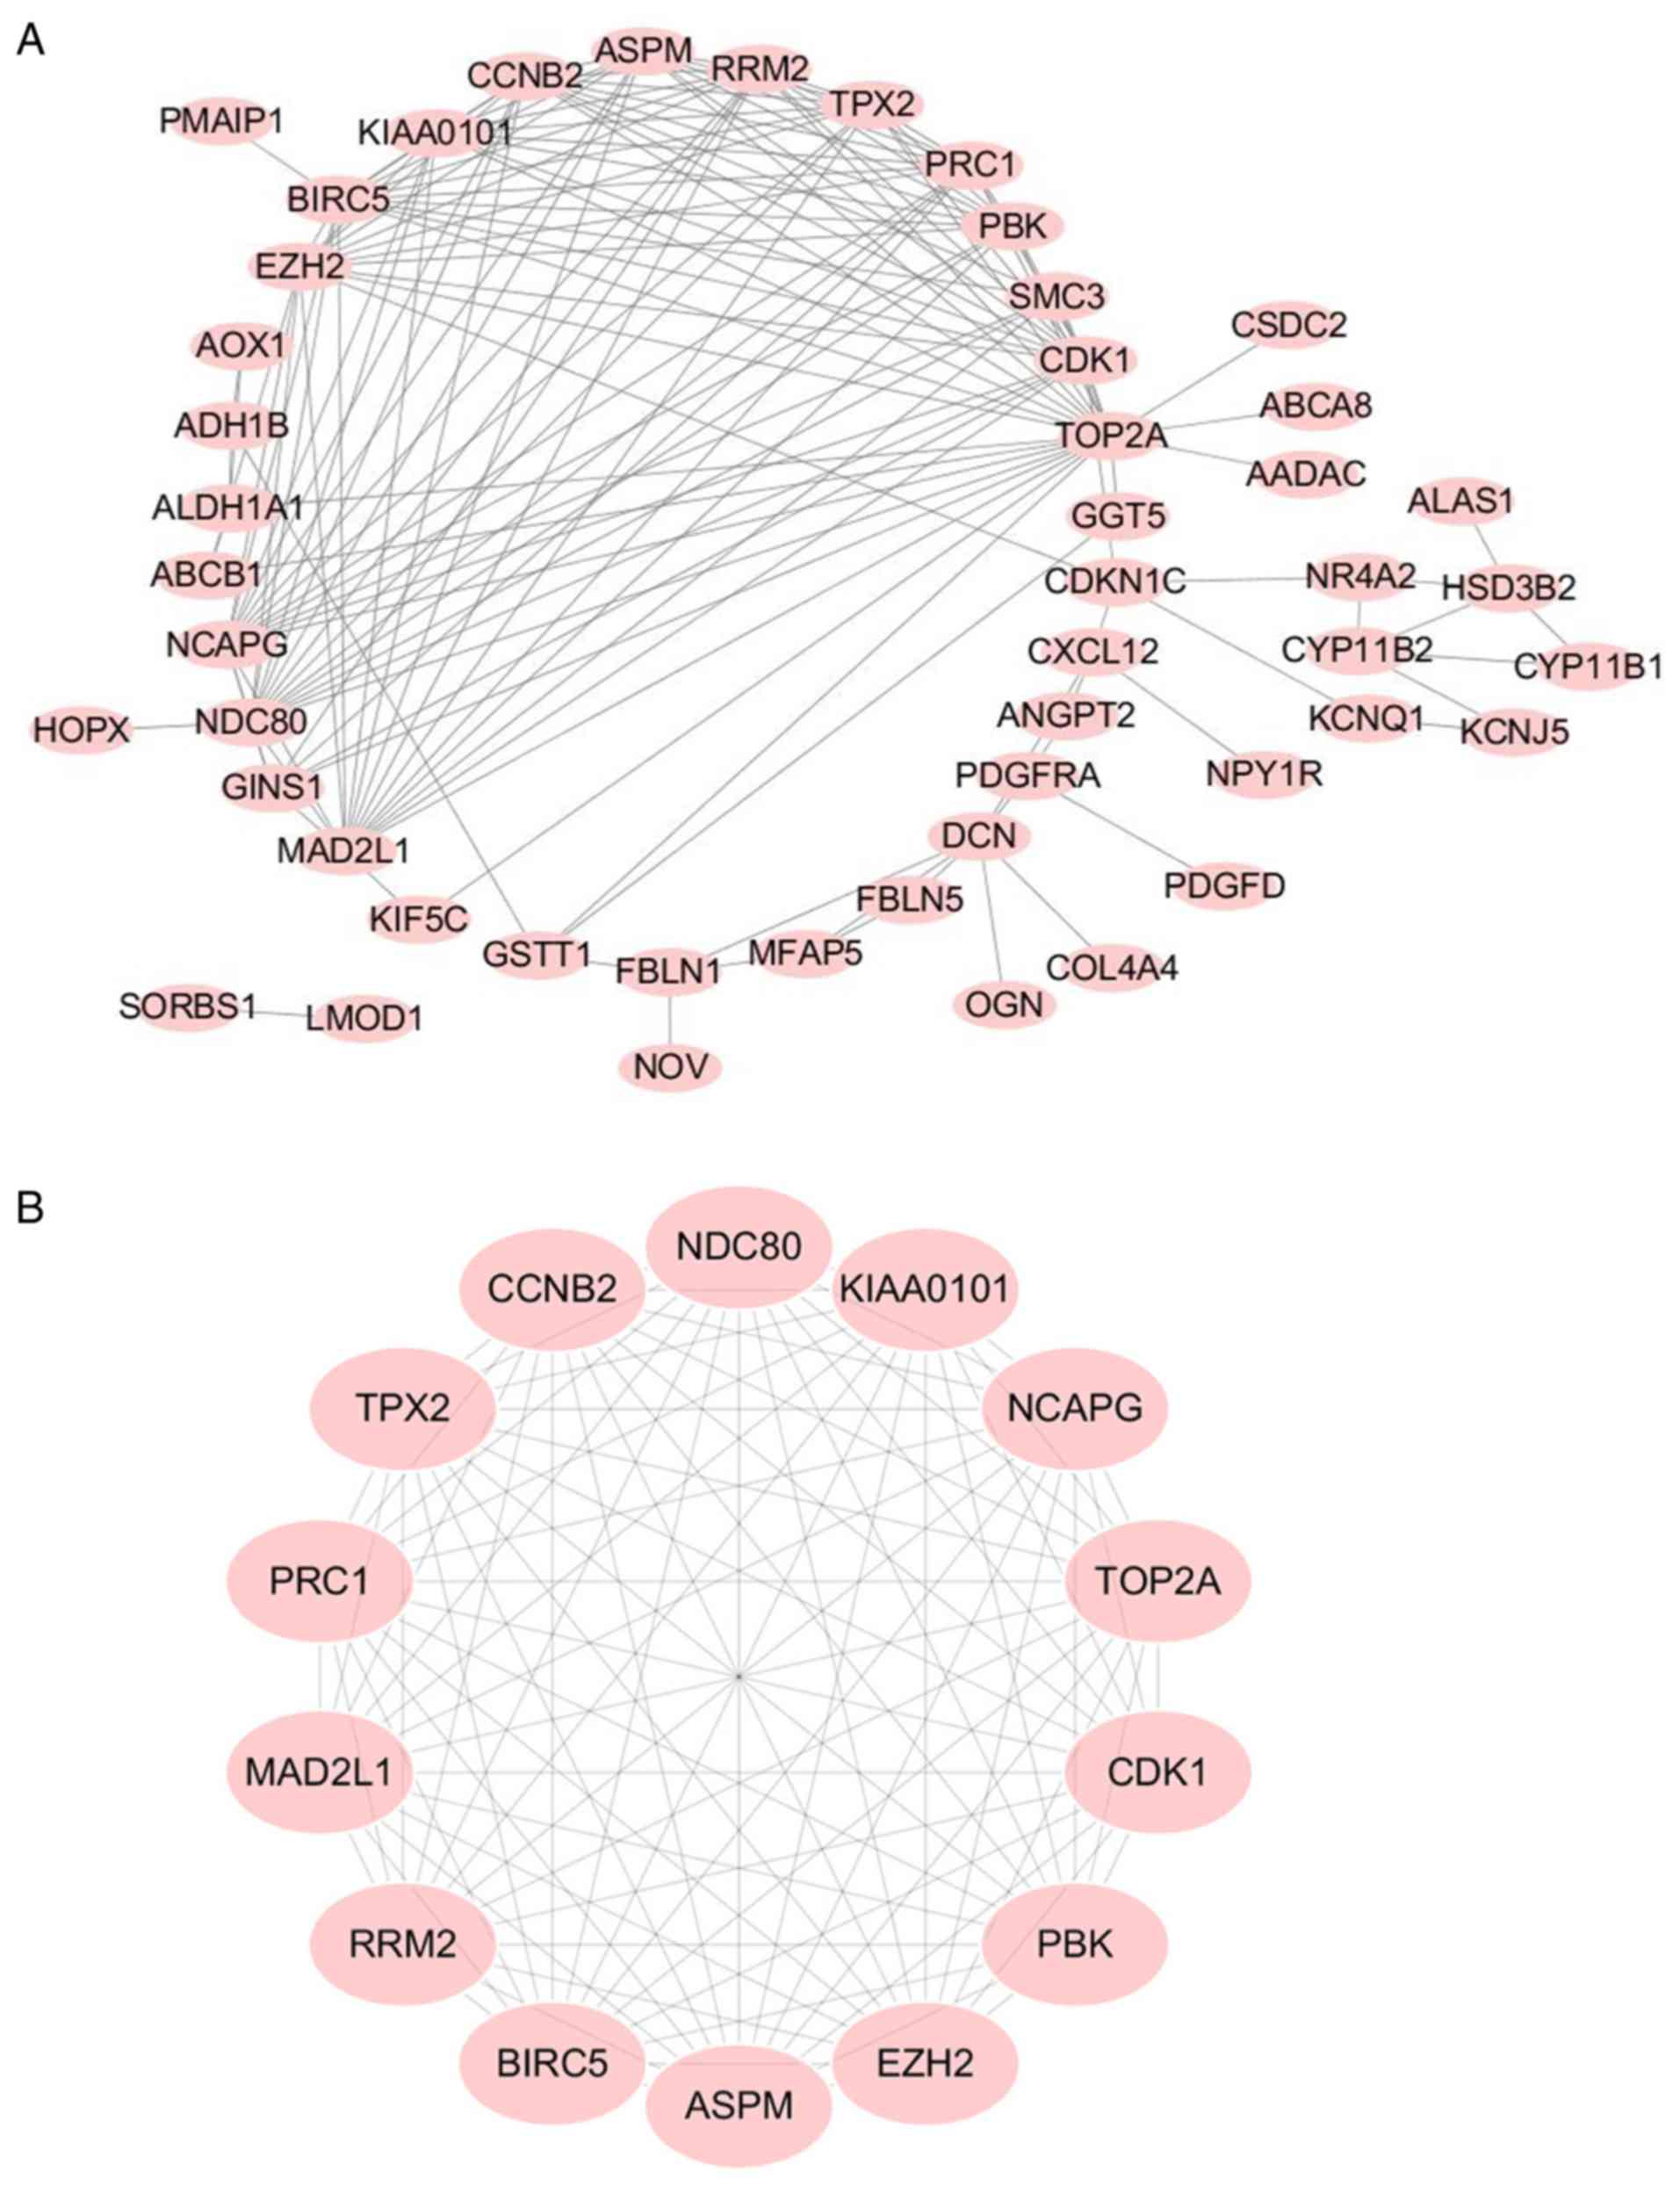
Key candidate gene identification with
DEGs in the PPI network
As indicated in Fig.
3A, a PPI network complex was constructed containing 176 nodes
and 639 edges according to the STRING online database (available
online: http://string-db.org) and Cytoscape
software (version 3.5.1, available online: http://www.cytoscape.org/). The 71 DEGs screened out
in all four datasets. The PPI network was performed with MCODE
plugin for module analysis. The most significant module was
confirmed for further pathway analyses according to the degree
(Fig. 3B) and the 14 genes involved
that were defined as key candidate genes.
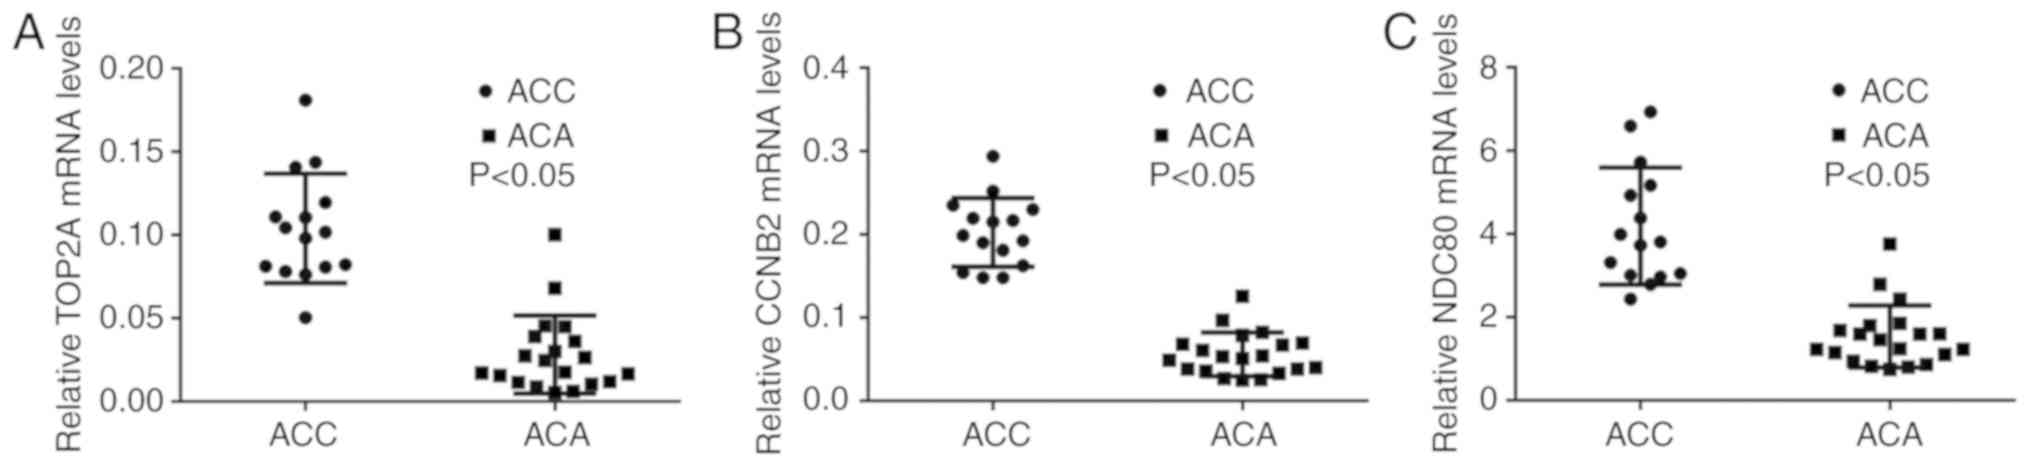
RT-qPCR validation of core genes
Based on the PPI results and the information of
cancer-associated genes, RT-qPCR was performed to confirm the
selected 14 core genes that were the most meaningful DEGs for
distinguishing ACC and ACA. There were only three genes, namely
TOP2A, CCNB2 and NDC80, whose RT-qPCR results were consistent with
the PPI results from the microarray data (P<0.05; Fig. 4A-C). All three genes were
upregulated in the ACC group compared with the ACA group. RT-qPCR
results of the remaining 11 genes that exhibited no statistical
significance between ACC and ACA groups were demonstrated in
Fig. S1.
Knockdown of TOP2A CCNB2 and NDC80 in
NCI-H295R cells hinders cell proliferation
To investigate the involved roles of TOP2A, CCNB2
and NDC80 in tumor progression, NCI-H295R cells were transfected
with the siRNAs of the above three genes, as well as their
respective negative controls. The targeting siRNAs (Si-TOP2A,
Si-CCNB2, Si-NDC80) knocked out the corresponding mRNAs expression
levels in NCI-H295R cells. The transfection efficacy was confirmed
by RT-qPCR (Fig. S2). The
expression level of each corresponding mRNA expression levels were
reduced by ~90%. Following this, MTT assays were performed to
evaluate the effects of TOP2A, CCNB2 and NDC80 knockdown on cell
proliferation. As indicated in Fig.
5A-C, the proliferation rates of NCI-H295R cells in the three
groups were lower compared with those in the control groups at the
same time points, and this difference was statistically significant
(P<0.05), suggesting the important role of the three genes in
regulating cell proliferation. Colony formation assays supported
this conclusion (Fig. 5D and E).
Furthermore, EdU incorporation assays revealed that knockdown of
TOP2A, CCNB2 and NDC80 influenced the proliferation of NCI-H295R
cells (Fig. 5F and G). These
results indicated that knockdown of TOP2A, CCNB2 and NDC80 affected
the proliferation of ACC cells and induced ACC cell proliferation
stagnation in vitro.
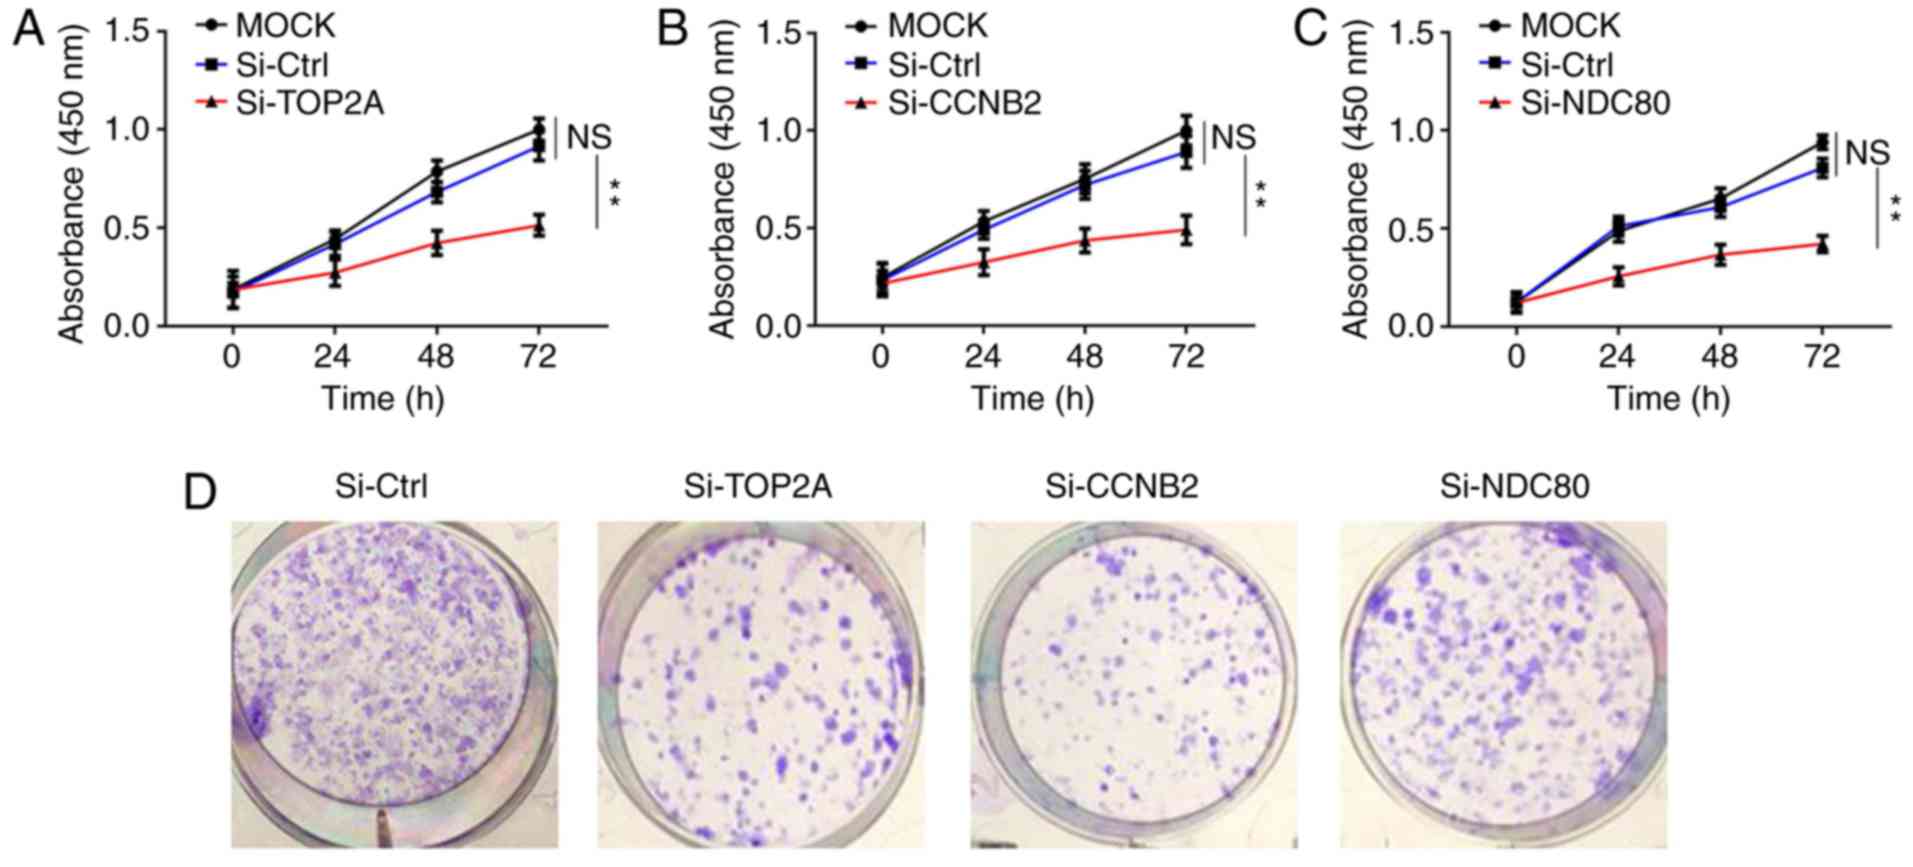 | Figure 5.Inhibition of NCI-H295R cell
proliferation by downregulation of TOP2A, CCNB2 and NDC80. (A-C)
Proliferation rates of NCI-H295R cells in the si-TOP2A, si-CCNB2
and si-NDC80 groups were significantly decreased compared with the
control groups at the same time points. (D) Effects of the
silencing TOP2A, CCNB2 and NDC80 on NCI-H295R cell colony
formation. (E) Statistical results of NCI-H295R cell colony
formation. (F) EdU incorporation assays (magnification, ×400). (G)
Statistical results of NCI-H295R cell EdU incorporation assays.
Data were presented as the mean ± standard deviation. **P<0.01
and ***P<0.001 as indicated. TOP2A, DNA topoisomerase 2α; CCNB2,
cyclin B2; si, small interfering; Ctrl, control; EdU,
5-ethynyl-20-deoxyuridine; NS, not significant. |
Prognostic signature of the three
genes from IHC results and an independent cohort in TCGA
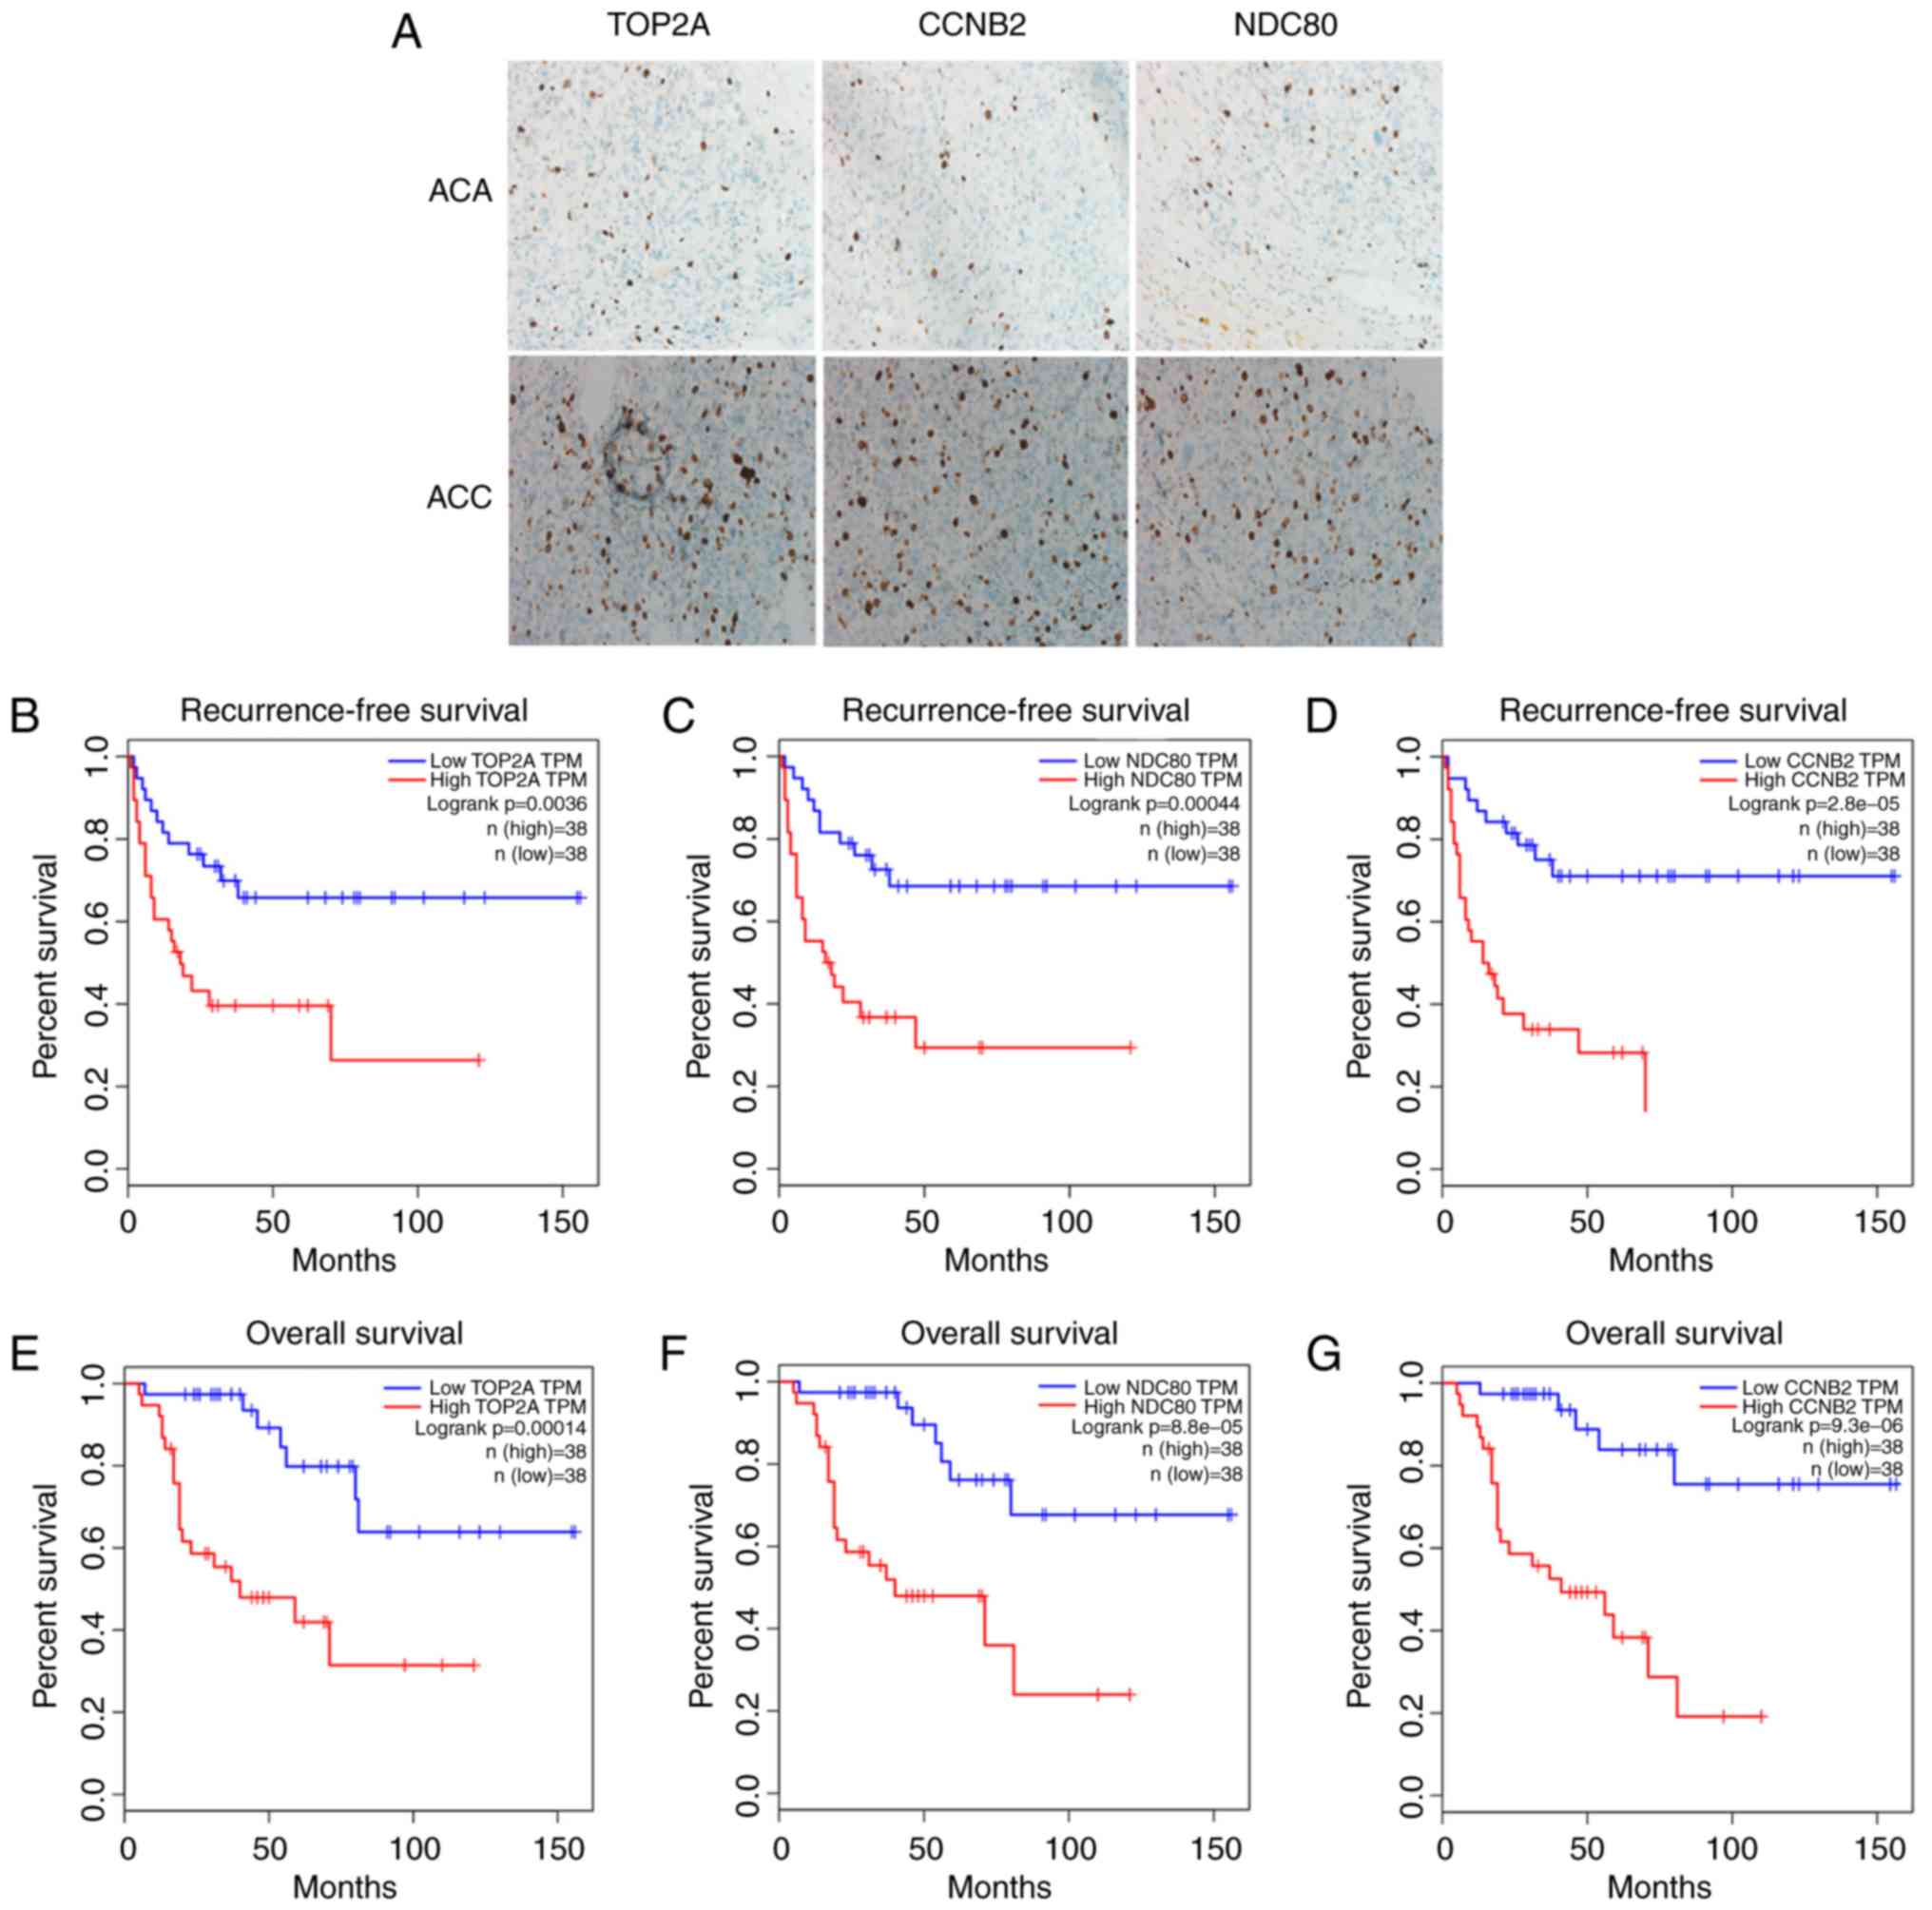
IHC results were consistent with those of RT-qPCR.
The immunostaining data regarding the expression of TOP2A, CCNB2
and NDC80 in ACC and ACA tissues were demonstrated (Fig. 6A). The expression of each protein in
ACC was markedly higher compared with that in ACA. The influence of
the three genes on recurrence-free survival (RFS) and overall
survival (OS) were assessed by TCGA. A cohort of 76 ACC patients
were enrolled to evaluate the association between the three genes
and RFS time. Kaplan-Meier curve and log-rank tests revealed that
the TOP2A, CCNB2 and NDC80 genes were each significantly associated
with RFS (Fig. 6B-D). Similar to
RFS, the association between the three genes and OS also indicated
significant correlations (Fig.
6E-G). The results suggested that the high-expression group had
shorter RFS and OS compared with the low-expression group for these
three genes.
Discussion
For pathologists, the Weiss score is primarily used
to diagnose ACTs between ACC and ACA (19). However, when the tumor is borderline
(Weiss score 3), the task of diagnosing can be problematic.
Although TERT promoter mutations can appear in ACCs (21), the underlying genetic alterations
associated with ACC remain to be elucidated. Notably, the rapid
development and wide use of microarray and high-throughput
sequencing technology has revealed thousands of genetic alterations
during the progression of diseases. This method can be used with
the GEO database to identify the DEGs of ACC and ACA tissues. The
present analysis identified 71 commonly changed DEGs integrating
three original microarray datasets, including 51 significantly
upregulated and 20 downregulated genes based on P-values <0.05.
These DEGs may be important for understanding the mechanism of ACC
carcinogenesis and prognostic prediction. GO analyses revealed that
these DEGs were primarily associated with the mitotic cell cycle,
mitosis, nuclear division and the M phase of the mitotic cell
cycle. KEGG pathway enrichment analysis also revealed that the DEGs
were predominantly enriched in retinol metabolism, metabolic
pathways, tyrosine metabolism, the cell cycle and p53 signaling
pathways. In addition, a PPI network was constructed to visualize
the interactions among the DEGs based on the intersection of GO
enrichment terms and KEGG pathways. The most significant genes in
the PPI network complex were identified by a module of the
Cytoscape MCODE plugin. Subsequently, 14 candidate genes were
identified, suggesting their potential roles as the most essential
genes in distinguishing ACC from ACA. These 14 genes were validated
by RT-qPCR. Because the databases used were from Australia
(GSE12368), the United States (GSE10927) and Hungary (GSE14922),
the races contained in the databases were different from the human
specimens involved in the present experiments. Only TOP2A, CCNB2
and NDC80 were confirmed to be consistent with the microarray data.
To our knowledge, all three genes are associated with cell
proliferation and cell growth (22–24).
Furthermore, TOP2A, CCNB2 and NDC80 were knocked out in the ACC
cell line NCI-H295R, and MTT assays, colony formation assays and
EdU incorporation assays were performed. All results demonstrated
that these genes serve important roles in the process of ACC cell
proliferation and growth. The results of IHC further confirmed that
these three genes serve an important role in the identification of
ACC and ACA. Notably, Kaplan-Meier analysis revealed that TOP2A,
CCNB2 and NDC80 were correlated with OS and RFS.
The first DEG identified via microarray and RT-qPCR
data was TOP2A, which is a key enzyme in DNA replication and
transcription that controls or alters the topologic states of DNA
(25). The gene catalyzes
double-strand DNA breaks and promotes gene transcription during
mitosis (26,27). It was reported that TOP2A is a
sensitive and specific marker in actively proliferating cells (in
the late S, G2 and M phases of the cell cycle), implicating its
role in cancer (28). Its enzyme is
a marker of cell proliferation in normal and tumor tissue (28). TOP2A was confirmed to be involved in
epigenetic regulation through enhancer of zeste homolog 2, and
aberrant expression of TOP2A was correlated with malignant
characteristics of prostate cancer (29,30).
In the present study, TOP2A was upregulated in ACC compared with
ACA according to microarray data, which was confirmed by RT-qPCR.
Furthermore, the results of the above experiments indicated that
TOP2A serves an important role in cell proliferation. Previous
studies have indicated that overexpression of TOP2A is associated
with shortened survival in breast, ovary, brain, skin and small
cell lung cancer (31–35). In the present study, it was revealed
that TOP2A may be a significant DEG between ACC and ACA. Thus,
TOP2A may serve an important role in carcinogenesis and could be
used in prognostic predictions of ACC.
CCNB2, a member of the cyclin family proteins,
serves a key role in the cell proliferation and in cell cycle.
CCNB2 inhibition induces cell cycle arrest, and it is overexpressed
in various types of tumors, including colorectal adenocarcinoma
(36), breast (37) and bladder cancer (38). Furthermore, CCNB2 overexpression is
also associated with tumor progression and poor outcome in patients
(23). Mechanistic research has
suggested that overexpressed CCNB2 causes aurora-A-mediated Plk1
hyperactivation, bringing about accelerated centrosome separation
and lagging chromosomes (39). In
the present study, CCNB2 was upregulated in ACC compared with ACA
based on microarray data and RT-qPCR. Additionally, in the present
study, the results of the MTT, colony formation and EdU
incorporation assays revealed that the proliferation rate of
NCI-H295R cells was significantly reduced following CCNB2
knockdown. Therefore, it was suggested that CCNB2 may be involved
in the progression of ACC.
NDC80 serves an important role in constituting the
mitotic kinetochore complex (40).
It is an attractive molecular target for cancer. The critical
function of NDC80 for spindle checkpoint control, kinetochore
functionality and cell survival has also been confirmed (41). NDC80 is mostly expressed in rapidly
dividing cells, and its expression levels increase with
transformation in the cell lines (42). Shortly following its identification,
the function of the NDC80 protein was established to be associated
with tumor formation (43). In
vivo, overexpression of NDC80 has been demonstrated to
contribute to tumor formation (44). Some studies have reported that
targeted inhibition of NDC80 by RNA interference or small molecules
effectively hinders the growth of tumors in animal models (44,45).
NDC80 silencing may also cause mitotic spindle checkpoint
dysfunction that leads to cell proliferation (40). In the present study, NDC80 was
upregulated in ACC according to microarray and RT-qPCR data. Cell
proliferation were hindered in NDC80-silenced NCI-H295R cells
compared with the control according to MTT, colony formation and
EdU incorporation assays. Based on these findings, it was suspected
that NDC80 may serve an important role in the development of
ACC.
Since the number of samples enrolled in the present
research was limited, there was insufficient detail to investigate
the clinicopathological characteristics of the patients. The TCGA
database was used to verify the prognostic value of the three-gene
molecular signature. In summary, high TOP2A, CCNB2 or NDC80
expression contributes to malignant progression and poor outcomes
in patients with ACC. Combining the immunohistochemical results of
the three genes expressed in ACC and ACA (TOP2A, CCNB2 and NDC80)
identified in the present study may be useful for distinguishing
between ACC and ACA or could serve as biomarkers for survival
prediction in patients with ACC. It can also be concluded that they
serve an important role in understanding the progress of ACC.
Using several microarray datasets from the GEO
database, a series of DEGs were obtained between ACC and ACA. These
genes may be associated with the pathogenesis and progression of
ACC. Following validation of the results by RT-qPCR, three DEGs
were identified to be significantly associated with ACC and ACA.
They may serve important roles in the pathogenesis of ACC, or they
may provide new viewpoints regarding the diagnosis and prognosis of
patients with adrenal cortical tumors and the clinical outcomes of
ACC. The results of Colony formation assay, MTT assays and EdU
assays of the three genes in NCI-H295R cells indicated the
prognostic prediction and can develop the understand the of the
carcinogenesis of ACC. Combined with the results of IHC, and RFS
and OS from TCGA, the three genes may not only indicate the
carcinogenesis of ACC but also have clinical usefulness for
prognostic prediction in patients with ACC.
There are some limitations to the present study. The
validation samples and the TCGA were analyzed retrospectively;
therefore, the present results should be further confirmed
prospectively. In the present study, ACA was defined with a Weiss
score <3. ACC was defined with a Weiss score >3. The present
research results are based on the traditional Weiss score without
opening up a completely new diagnostic criteria. Furthermore, all
three indicators in the study were highly expressed in ACC, whereas
the expression in ACA was limited. Of note, the patient's follow-up
information was not successfully obtained, resulting in the
uncertainty of the prognostic role of these three genes in
patients. Unfortunately, no clinical data regarding the patients
with ACAs and ACCs were indicated in the present study, which was a
further limitation.
To conclude, further work will be performed to
provide some evidence that the identified potential markers may be
superior to the golden standard and that when Weiss score is ~3,
the expression of these markers may provide guidance for
distinguishing malignant and benign tumors.
Supplementary Material
Supporting Data
Acknowledgements
Not applicable.
Funding
The present study was supported by the Project of
Liaoning Distinguished Professor [grant no. (2012)145], the
Liaoning Natural Science Fund [201602830], the Shenyang Plan
Project of Science and Technology (grant no. F17-230-9-08), the
Shenyang Clinical Medicine Research Center [grant no. (2017)76] and
the National Nature Science Foundation of China (grant no.
81672523).
Availability of data and materials
The datasets used and/or analyzed during the current
study are available from the corresponding author on reasonable
request.
Authors' contributions
ZG, XM, ZhL and JB wrote the manuscript and analyzed
the data. ZG, XL, ZeL and YZ performed the experiments. ZZ and CK
conceived and designed the study. All authors have read and
approved the final manuscript.
Ethics approval and consent to
participate
All protocols associated with humans in the present
study were approved by the Review Board of the First Hospital of
China Medical University. All methods were performed in accordance
with the relevant guidelines and regulations. Consent was obtained
at the time of data collection.
Patient consent for publication
All patients provided consent.
Competing interests
The authors declare that they have no competing
interests.
References
|
1
|
Fassnacht M, Kroiss M and Allolio B:
Update in adrenocortical carcinoma. J Clin Endocrinol Metab.
98:4551–4564. 2013. View Article : Google Scholar : PubMed/NCBI
|
|
2
|
Fassnacht M, Johanssen S, Fenske W,
Weismann D, Agha A, Beuschlein F, Führer D, Jurowich C, Quinkler M,
Petersenn S, et al: Improved survival in patients with stage II
adrenocortical carcinoma followed up prospectively by specialized
centers. J Clin Endocrinol Metab. 95:4925–4932. 2010. View Article : Google Scholar : PubMed/NCBI
|
|
3
|
Drougat L, Omeiri H, Lefèvre L and
Ragazzon B: Novel insights into the genetics and pathophysiology of
adrenocortical tumors. Front Endocrinol. 6:962015. View Article : Google Scholar
|
|
4
|
Soon PS, Gill AJ, Benn DE, Clarkson A,
Robinson BG, McDonald KL and Sidhu SB: Microarray gene expression
and immunohistochemistry analyses of adrenocortical tumors identify
IGF2 and Ki-67 as useful in differentiating carcinomas from
adenomas. Endocr Relat Cancer. 16:573–583. 2009. View Article : Google Scholar : PubMed/NCBI
|
|
5
|
Guillaud-Bataille M, Ragazzon B, de
Reyniès A, Chevalier C, Francillard I, Barreau O, Steunou V,
Guillemot J, Tissier F, Rizk-Rabin M, et al: IGF2 promotes growth
of adrenocortical carcinoma cells, but its overexpression does not
modify phenotypic and molecular features of adrenocortical
carcinoma. PLoS One. 9:e1037442014. View Article : Google Scholar : PubMed/NCBI
|
|
6
|
Wandoloski M, Bussey KJ and Demeure MJ:
Adrenocortical cancer. Surg Clin North Am. 89:1255–1267. 2009.
View Article : Google Scholar : PubMed/NCBI
|
|
7
|
Assié G, Letouzé E, Fassnacht M, Jouinot
A, Luscap W, Barreau O, Omeiri H, Rodriguez S, Perlemoine K,
René-Corail F, et al: Integrated genomic characterization of
adrenocortical carcinoma. Nat Genet. 46:607–612. 2014. View Article : Google Scholar : PubMed/NCBI
|
|
8
|
Lin SR, Lee YJ and Tsai JH: Mutations of
the p53 gene in human functional adrenal neoplasms. J Clin
Endocrinol Metab. 78:483–491. 1994. View Article : Google Scholar : PubMed/NCBI
|
|
9
|
Hsu CH, Lee SC, Yang YC, Lian ST, Shin SJ
and Lin SR: The p53 codon 249 mutant-derived from human functional
adrenal tumors-can modify the cell shape of normal adrenocortical
transfected cells. Cancer Lett. 170:63–71. 2001. View Article : Google Scholar : PubMed/NCBI
|
|
10
|
Tissier F, Cavard C, Groussin L,
Perlemoine K, Fumey G, Hagneré AM, René-Corail F, Jullian E,
Gicquel C, Bertagna X, et al: Mutations of beta-catenin in
adrenocortical tumors: Activation of the Wnt signaling pathway is a
frequent event in both benign and malignant adrenocortical tumors.
Cancer Res. 65:7622–7627. 2005. View Article : Google Scholar : PubMed/NCBI
|
|
11
|
Clough E and Barrett T: The gene
expression Omnibus database. Methods Mol Biol. 1418:93–110. 2016.
View Article : Google Scholar : PubMed/NCBI
|
|
12
|
Lee JS: Exploring cancer genomic data from
the cancer genome atlas project. BMB Rep. 49:607–611. 2016.
View Article : Google Scholar : PubMed/NCBI
|
|
13
|
Gautier L, Cope L, Bolstad BM and Irizarry
RA: Affy-analysis of Affymetrix GeneChip data at the probe level.
Bioinformatics. 20:307–315. 2004. View Article : Google Scholar : PubMed/NCBI
|
|
14
|
Ritchie ME, Phipson B, Wu D, Hu Y, Law CW,
Shi W and Smyth GK: limma powers differential expression
analyses for RNA-sequencing and microarray studies. Nucleic Acids
Res. 43:e472015. View Article : Google Scholar : PubMed/NCBI
|
|
15
|
Huang da W, Sherman BT and Lempicki RA:
Systematic and integrative analysis of large gene lists using DAVID
bioinformatics resources. Nat Protoc. 4:44–57. 2009. View Article : Google Scholar : PubMed/NCBI
|
|
16
|
Harris MA, Clark J, Ireland A, Lomax J,
Ashburner M, Foulger R, Eilbeck K, Lewis S, Marshall B, Mungall C,
et al: The Gene Ontology (GO) database and informatics resource.
Nucleic Acids Res. 32:D258–D261. 2004. View Article : Google Scholar : PubMed/NCBI
|
|
17
|
Shannon P, Markiel A, Ozier O, Baliga NS,
Wang JT, Ramage D, Amin N, Schwikowski B and Ideker T: Cytoscape: A
software environment for integrated models of biomolecular
interaction networks. Genome Res. 13:2498–2504. 2003. View Article : Google Scholar : PubMed/NCBI
|
|
18
|
Weiss LM, Medeiros LJ and Vickery AL:
Pathologic features of prognostic significance in adrenocortical
carcinoma. Am J Surg Pathol. 13:202–206. 1989. View Article : Google Scholar : PubMed/NCBI
|
|
19
|
Aubert S, Wacrenier A, Leroy X, Devos P,
Carnaille B, Proye C, Wemeau JL, Lecomte-Houcke M and Leteurtre E:
Weiss system revisited: A clinicopathologic and immunohistochemical
study of 49 adrenocortical tumors. Am J Surg Pathol. 26:1612–1619.
2002. View Article : Google Scholar : PubMed/NCBI
|
|
20
|
Livak KJ and Schmittgen TD: Analysis of
relative gene expression data using real-time quantitative PCR and
the 2−ΔΔCT method. Methods. 25:402–408. 2001. View Article : Google Scholar : PubMed/NCBI
|
|
21
|
Liu T, Brown TC, Juhlin CC, Andreasson A,
Wang N, Bäckdahl M, Healy JM, Prasad ML, Korah R, Carling T, et al:
The activating TERT promoter mutation C228T is recurrent in
subsets of adrenal tumors. Endocr Relat Cancer. 21:427–434. 2014.
View Article : Google Scholar : PubMed/NCBI
|
|
22
|
Strausfeld U and Richter A: Simultaneous
purification of DNA topoisomerase I and II from eukaryotic cells.
Prep Biochem. 19:37–48. 1989.PubMed/NCBI
|
|
23
|
Qian X, Song X, He Y, Yang Z, Sun T, Wang
J, Zhu G, Xing W and You C: CCNB2 overexpression is a poor
prognostic biomarker in Chinese NSCLC patients. Biomed
Pharmacother. 74:222–227. 2015. View Article : Google Scholar : PubMed/NCBI
|
|
24
|
Qu Y, Li J, Cai Q and Liu B: Hec1/Ndc80 is
overexpressed in human gastric cancer and regulates cell growth. J
Gastroenterol. 49:408–418. 2014. View Article : Google Scholar : PubMed/NCBI
|
|
25
|
Ploeg M, Aben KK and Kiemeney LA: The
present and future burden of urinary bladder cancer in the world.
World J Urol. 27:289–293. 2009. View Article : Google Scholar : PubMed/NCBI
|
|
26
|
Wu KZ, Wang GN, Fitzgerald J, Quachthithu
H, Rainey MD, Cattaneo A, Bachi A and Santocanale C: DDK dependent
regulation of TOP2A at centromeres revealed by a chemical genetics
approach. Nucleic Acids Res. 44:8786–8798. 2016. View Article : Google Scholar : PubMed/NCBI
|
|
27
|
Terashima M, Ichikawa W, Ochiai A, Kitada
K, Kurahashi I, Sakuramoto S, Katai H, Sano T, Imamura H and Sasako
M; ACTS-GC Group, : TOP2A, GGH, and PECAM1 are
associated with hematogenous, lymph node, and peritoneal recurrence
in stage II/III gastric cancer patients enrolled in the ACTS-GC
study. Oncotarget. 8:57574–57582. 2017. View Article : Google Scholar : PubMed/NCBI
|
|
28
|
de Resende MF, Vieira S, Chinen LT,
Chiappelli F, da Fonseca FP, Guimarães GC, Soares FA, Neves I,
Pagotty S, Pellionisz PA, et al: Prognostication of prostate cancer
based on TOP2A protein and gene assessment: TOP2A in prostate
cancer. J Transl Med. 11:362013. View Article : Google Scholar : PubMed/NCBI
|
|
29
|
Kirk JS, Schaarschuch K, Dalimov Z,
Lasorsa E, Ku S, Ramakrishnan S, Hu Q, Azabdaftari G, Wang J, Pili
R, et al: Top2a identifies and provides epigenetic rationale for
novel combination therapeutic strategies for aggressive prostate
cancer. Oncotarget. 6:3136–3146. 2015. View Article : Google Scholar : PubMed/NCBI
|
|
30
|
Labbé DP, Sweeney CJ, Brown M, Galbo P,
Rosario S, Wadosky KM, Ku SY, Sjöström M, Alshalalfa M, Erho N, et
al: TOP2A and EZH2 provide early detection of an aggressive
prostate cancer subgroup. Clin Cancer Res. 23:7072–7083. 2017.
View Article : Google Scholar : PubMed/NCBI
|
|
31
|
Mu XC, Tran TA, Ross JS and Carlson JA:
Topoisomerase II-alpha expression in melanocytic nevi and malignant
melanoma. J Cutan Pathol. 27:242–248. 2000. View Article : Google Scholar : PubMed/NCBI
|
|
32
|
Holden JA and Townsend JJ: DNA
topoisomerase II-alpha as a proliferation marker in astrocytic
neoplasms of the central nervous system: Correlation with MIB1
expression and patient survival. Mod Pathol. 12:1094–1100.
1999.PubMed/NCBI
|
|
33
|
Costa MJ, Hansen CL, Holden JA and Guinee
D Jr: Topoisomerase II alpha: Prognostic predictor and cell cycle
marker in surface epithelial neoplasms of the ovary and peritoneum.
Int J Gynecol Pathol. 19:248–257. 2000. View Article : Google Scholar : PubMed/NCBI
|
|
34
|
Dingemans AM, Witlox MA, Stallaert RA, van
der Valk P, Postmus PE and Giaccone G: Expression of DNA
topoisomerase IIalpha and topoisomerase IIbeta genes predicts
survival and response to chemotherapy in patients with small cell
lung cancer. Clin Cancer Res. 5:2048–2058. 1999.PubMed/NCBI
|
|
35
|
Depowski PL, Rosenthal SI, Brien TP,
Stylos S, Johnson RL and Ross JS: Topoisomerase IIalpha expression
in breast cancer: Correlation with outcome variables. Mod Pathol.
13:542–547. 2000. View Article : Google Scholar : PubMed/NCBI
|
|
36
|
Park SH, Yu GR, Kim WH, Moon WS, Kim JH
and Kim DG: NF-Y-dependent cyclin B2 expression in colorectal
adenocarcinoma. Clin Cancer Res. 13:858–867. 2007. View Article : Google Scholar : PubMed/NCBI
|
|
37
|
Shubbar E, Kovács A, Hajizadeh S, Parris
TZ, Nemes S, Gunnarsdóttir K, Einbeigi Z, Karlsson P and Helou K:
Elevated cyclin B2 expression in invasive breast carcinoma is
associated with unfavorable clinical outcome. BMC Cancer. 13:12013.
View Article : Google Scholar : PubMed/NCBI
|
|
38
|
Lei CY, Wang W, Zhu YT, Fang WY and Tan
WL: The decrease of cyclin B2 expression inhibits invasion and
metastasis of bladder cancer. Urol Oncol. 34:237.e1–10. 2016.
View Article : Google Scholar
|
|
39
|
Zhou L, Du Y, Kong L, Zhang X and Chen Q:
Identification of molecular target genes and key pathways in
hepatocellular carcinoma by bioinformatics analysis. Onco Targets
Ther. 11:1861–1869. 2018. View Article : Google Scholar : PubMed/NCBI
|
|
40
|
Yoo TY, Choi JM, Conway W, Yu CH, Pappu RV
and Needleman DJ: Measuring NDC80 binding reveals the molecular
basis of tension-dependent kinetochore-microtubule attachments.
Elife. 7:e363922018. View Article : Google Scholar : PubMed/NCBI
|
|
41
|
Wu G, Qiu XL, Zhou L, Zhu J, Chamberlin R,
Lau J, Chen PL and Lee WH: Small molecule targeting the Hec1/Nek2
mitotic pathway suppresses tumor cell growth in culture and in
animal. Cancer Res. 68:8393–8399. 2008. View Article : Google Scholar : PubMed/NCBI
|
|
42
|
Bièche I, Vacher S, Lallemand F,
Tozlu-Kara S, Bennani H, Beuzelin M, Driouch K, Rouleau E,
Lerebours F, Ripoche H, et al: Expression analysis of mitotic
spindle checkpoint genes in breast carcinoma: Role of
NDC80/HEC1 in early breast tumorigenicity, and a two-gene
signature for aneuploidy. Mol Cancer. 10:232011. View Article : Google Scholar : PubMed/NCBI
|
|
43
|
Huang LY, Chang CC, Lee YS, Chang JM,
Huang JJ, Chuang SH, Kao KJ, Lau GM, Tsai PY, Liu CW, et al:
Activity of a novel Hec1-targeted anticancer compound against
breast cancer cell lines in vitro and in vivo. Mol Cancer Ther.
13:1419–1430. 2014. View Article : Google Scholar : PubMed/NCBI
|
|
44
|
Diaz-Rodríguez E, Sotillo R, Schvartzman
JM and Benezra R: Hec1 overexpression hyperactivates the mitotic
checkpoint and induces tumor formation in vivo. Proc Natl Acad Sci
USA. 105:16719–16724. 2008. View Article : Google Scholar : PubMed/NCBI
|
|
45
|
Puisieux A, Galvin K, Troalen F, Bressac
B, Marcais C, Galun E, Ponchel F, Yakicier C, Ji J and Ozturk M:
Retinoblastoma and p53 tumor suppressor genes in human hepatoma
cell lines. FASEB J. 7:1407–1413. 1993. View Article : Google Scholar : PubMed/NCBI
|